Embed Size (px)
Citation preview

World Journal of Engineering and Technology, 2018, 6, 332-349 http://www.scirp.org/journal/wjet
ISSN Online: 2331-4249 ISSN Print: 2331-4222
DOI: 10.4236/wjet.2018.62021 May 15, 2018 332 World Journal of Engineering and Technology
Qualitative and Quantitative Evaluation of Permeability Changes during EOR Polymer Flooding Using Micromodels
Lucas Oliver Knobloch, Rafael Eduardo Hincapie Reina, Hendrik Födisch, Leonhard Ganzer
Institute of Petroleum Engineering, Clausthal University of Technology, Clausthal-Zellerfeld, Germany
Abstract
Polymer solutions are used in chemical EOR processes to achieve incremental oil recoveries through obtaining favorable mobility ratios. In the process, the in-situ viscosity is a key parameter for the polymer flood design, as well as the changes in permeability due to the retention or adsorption (e.g.: plugging). Understanding the major causes of the plugging effects allows predicting in-jectivity problems as well as optimizing project design. The objective of this work is to use glass-silicon-glass micromodels in combination with tracer par-ticles—attached to the flooded fluids—to qualitatively and quantitatively de-scribe the extent of permeability changes after polymer injection. Laboratory work is performed in order to determine the physical properties of the poly-mer solutions when they flow through porous media, such as the presence of permeability reduction/plugging of the micromodel. A statistical analysis of the distribution and extent of plugged areas is performed and a study of the pressure response during various injection stages will complement the study. A biopolymer (Scleroglucan) was tested and compared to a commonly used polymer, giving a direct insight into their pros and cons. Five different con-centrations of polymers were tested and put into relation with their quantita-tive and qualitative amount of sort of called retention. The amount of adsorp-tion was determined experimentally in one case in order to draw the signific-ance. By exploiting the potential of GSG-micromodels in combination with tracer particles, it was possible to visualize the reduction of flow paths and its increase during various injections for the first time. Expanding the working principle proposed in this work could provide further understanding of the behavior of any polymers. The results obtained and workflow presented in this work allow for additional understanding of polymer solutions behavior in flooding applications. Furthermore, the definition of optimized workflows to assess any kind of solutions in porous media and permeability changes is supported.
How to cite this paper: Knobloch, L.O., Hincapie Reina, R.E., Foedisch, H. and Ganzer, L. (2018) Qualitative and Quantit-ative Evaluation of Permeability Changes during EOR Polymer Flooding Using Mi-cromodels. World Journal of Engineering and Technology, 6, 332-349. https://doi.org/10.4236/wjet.2018.62021 Received: January 27, 2018 Accepted: May 12, 2018 Published: May 15, 2018 Copyright © 2018 by authors and Scientific Research Publishing Inc. This work is licensed under the Creative Commons Attribution International License (CC BY 4.0). http://creativecommons.org/licenses/by/4.0/
Open Access

L. O. Knobloch et al.
DOI: 10.4236/wjet.2018.62021 333 World Journal of Engineering and Technology
Keywords
Enhanced Oil Recovery, Polymer Flooding, Micromodels, Retention, Plugging, Adsorption, Biopolymer
1. Introduction
The recovery of oil can be split into three phases, namely the primary recovery, secondary recovery and tertiary recovery. With the first two, only up to 40% of the OIIP can be produced. As oil is a limited resource, the importance of deple-tion of reservoirs has been increasing and will continue to do so. Thus, the ter-tiary recovery—also called improved oil recovery (IOR)—and its subpart the enhanced oil recovery (EOR) [1] are of significant importance. One key me-chanism in EOR is polymer flooding, in which polymer is injected into the wellbore to increase oil mobility ratio and avoid viscous fingering of water [2] [3].
A very important aspect for the efficiency of a polymer is its viscosity under a specific in-situ shear rate. Viscosity can be understood as the resistance of a fluid to flow and it determines how well suited a polymer is to produce oil [4]. The downside with increasing viscosity is injectivity problems and higher chances of retention and therefore at some point plugging of the formation increase as well [5] [6].
The reduction in permeability during a polymer flood is due to several inte-ractions of the fluid and the porous medium. Permeability reduction has a criti-cal effect on flood productivity, especially in originally low permeable reservoirs. This reduction always leads to, in some extent, irreparable damage to the reser-voir, a decrease in production efficiency and higher costs. The contributors to permeability reduction can be seen in Figure 1, namely adsorption, mechanical entrapment and hydrodynamic retention; the latter is almost negligible at low injection rates [2] [7] [8] [9]. Adsorption describes the bonding at contact of a polymer to the rock surface via van der Waal’s and hydrogen bonding and in-creases with increasing rock surface. It is the only effect that removes polymer from a free powder/bulk solution. Polymers with a high molecular weight have shown high adsorption levels, which are accounted for by a layer thickness in-crease [2]. Furthermore, adsorption depends on the concentration of the used polymer solution. This can be explained with the increasing amount of polymer structures (chains) inside the solution [10]. Both, mechanical entrapment and hydrodynamic retention only occur during a flow through porous media. Me-chanical entrapment refers to the molecules of the polymer being filtered out in narrow pore throats and in extreme cases building up and blocking passages, leading to a change of direction of the fluid flow. This mechanism occurs when the polymer fluid was not filtered accordingly to fit through the pore size of the porous medium. As to the nature of filtration, the most retention due to

L. O. Knobloch et al.
DOI: 10.4236/wjet.2018.62021 334 World Journal of Engineering and Technology
Figure 1. Polymer retention mechanisms [8].
entrapment will occur near to the injection point and will decrease the further the fluid flows into the porous medium. Hydrodynamic retention means, that at high flow rates molecules of the polymer could get pushed into a cavity where there is no flow possible. The stream passing by that cavity prevents the mole-cules to reenter the stream due to hydrodynamic drag forces. This retention mechanism has been experienced to be to some extent reversible by stopping the flow for a short period of time. The drag forces vanish and the molecules are able to reenter the flow [2].
Due to the fact, that most oil reservoirs have a permeability of below 1 D, the experiments will focus on how the tested polymers will perform under realistic conditions. In EOR, it is important to design the fluids in a way so that they match the conditions of the reservoir in all aspects for the production to be feas-ible. Choosing an unsuited polymer fluid will lead to plugging and a loss in productivity. With the help of Glass-Silicon-Glass (GSG) micromodels we can track the polymers path through a simulated reservoir and can observe the sev-eral plugging mechanisms which occur during a polymer flood. These experi-ments are conducted with both Biopolymer (Scleroglucan) and the HPAM po-lymer (Flopaam) using different concentrations. Thus, we can compare their performances directly and give more insight into creating the best possible fluid solution.
The objective of this work is to experimentally and mathematically determine the influences of polymer flow in porous media; moreover, to present a com-prehensive and systematic workflow to address and evaluate any kind of poly-mers. The flood experiments consist of porous media visualization in combina-tion with differential pressure measurements at various stages of injection. These will be analyzed according to the following aspects: • Comparison of the performance of a synthetic polymer with a biopolymer
Scleroglucan. • Occurrence and amount of plugging mechanisms, visible and not visible. • Changes in permeability due to: 1) the retention mechanism of adsorption, 2)
mechanical entrapment and 3) hydrodynamic retention. • Polymer injectivity aspects such as: resistance factor (RF) and residual resis-
tance factor (RRF).

L. O. Knobloch et al.
DOI: 10.4236/wjet.2018.62021 335 World Journal of Engineering and Technology
2. Previously Reported Experiment Results Using Polymers
Manichand and Seright (2014) [9] reported that approximately half of Xanthan (Biopolymer) retention was due to adsorption and the other half to mechanical entrapment. Whereby, about 35.2% of the retention caused by HPAM was attri-buted to adsorption and the rest of 64.8% to mechanical entrapment [9].
A field test, Yariguí-Cantagallo Field in Columbia, over 24 months conducted with a HPAM resulted in a RRF of 3. With a resulting water cut of up to 5% the polymer flooding was considered both technically and economically feasible for the field. The testing reservoir was a sand-reservoir of a Klinkenberg permeabil-ity of 1.279 mD [11].
Zaitoun and Kohler (1988) [12] reported a set of experiments, in which at higher permeability ranges retention does no longer change. Furthermore, Vela et al. (1976) [13] showed that there is a significant decrease in retention when the permeability is increased from 12 mD to 137 mD. Permeability appears to be an important characteristic at the pore-scale and microscale level at values lower than 100 mD and becomes less important at higher permeabilities. Further re-sults are summarized in Table 1 and serve for comparison purposes of the values calculated in this paper.
3. Fluids Optimization and Concentrations Selection
Two polymers in five different concentrations are tested during this work. Two Scleroglucan solutions and three Flopaam solutions. Different target viscosities were expected to be achieved in order to make the comparison more accurate. The fluids ought to be comparable and are therefore matched at their viscosity at a shear rate of 25 s−1. The approach adopted for the comparison purpose is pre-sented in Table 2. Fluids are tested before tracer particles and fluorescein so-dium salt are added via Kinexus Pro rheometer at 22˚C with a start shear of 0.01 s−1, a final shear of 5000.0 s−1 and 10 samples per decade.
The preparation for both the brine and the polymer solutions (without in-duced mechanical degradation, non-sheared) is performed using the approach as utilized by Hincapie and Ganzer (2015) [6], Elhajjaji et al. (2016) [20] and Hin-capie (2016) [21]. For the experiments in this work Synthetic Sea Water-Brine (SSW) was used for all solutions.
To be able to visualize the colorless polymer and brine flood through the mi-cromodel, powder form of Fluorescein sodium salt by Sigma-Aldrich was added at 0.02% w/w concentration. Thus, enhancing the ability to follow the path the fluids are taking, as well as enabling plugging visibility under the UV-Light. One brine solution and all the polymer solutions were then mingled with 0.08% Sig-ma-Aldrich micro particles based on polystyrene with a size of 1 µm. The fluo-rescein sodium salt sticks to the tracer particles, thereby coloring them and making them more visible on the photographs. In the initial experiment a lower percentage of tracer was tested, but did not make the plugging visible. Utiliza-tion of Fluorescein sodium salt was a proven approach presented by Födisch

L. O. Knobloch et al.
DOI: 10.4236/wjet.2018.62021 336 World Journal of Engineering and Technology
Table 1. Summary of polymer retention experiments.
Polymer Type Concentration
[ppm] Porous Media
Permeability [mD]
RF RRF Reference
HPAM Glass Beads 3.98 - 4.55 360 3 [14]
Xanthan Glass Beads 3.98 - 4.55 440 6 [14]
HPAM 500 Sandstone 1.279 - 3 [11]
HPAM 1000 - - 1.68 1.47 [15]
HPAM 100 Quartz-San
d - 13 - 16.1 3.5 - 4.9 [16]
Alcoflood (254S) 5000 Sand-Pack - 4.47 - 6.04 1.17 - 1.54 [17]
Alcoflood (955) 20,000 Sand-Pack - 5.13 - 6.1 1.45 - 2.03 [14]
HPAM 1500 Sand-Pack 2500 - 23,000 - 1 - 1.9 [18]
Xanthan 500 - 1000 Berea Plug - - 6 [19]
Table 2. Summary of polymers characteristics based on the evaluation approach.
Scleroglucan (Biopolymer) HPAM, Flopaam
Desired Shear-Viscosity at Shear rate 25 s−1
[mPas]
Shear-Viscosity
[mPas]
Shear-Viscosity with additives [mPas]
Concentration [ppm]
Shear-Viscosity
[mPas]
Shear-Viscosity with additives [mPas]
Concentration [ppm]
~5 - - 5.027 4.647 700
~10 - - 8.307 7.501 1000
~15 12.99 12.82 600 17.8 17.5 1500
~25 24.42 24.26 1000 - -
et al. (2015) [22]. The reason that only one out of two brine solutions are pre-pared with tracer particles is described more clearly in the methodology section. The first two steps in each experiment are to show that there is basically no in-fluence of the tracer on the differential pressure, therefore we can conclude that the tracer particles themselves do not cause plugging. Furthermore, to describe the influence of these two additions to the polymer fluid, each solution is tested in the rheometer previous and after they are added.
4. Micromodel and Setup
The experimental setup used in this work was specifically designed for micro-model EOR flooding experiments. The setup has proven to be very exact and to deliver reproducible results in the past for polymers and surfactants among oth-ers. The entire setup is placed in a darkroom with the reason being that the camera is very sensitive to light. Thus, the photographs could bleach at the slightest bit of brightness. The experimental setup consists of the following components depicted in Figure 2 below: • Syringe pumps for fluid injection into the micromodel at the desired rate • DLSR reflex camera

L. O. Knobloch et al.
DOI: 10.4236/wjet.2018.62021 337 World Journal of Engineering and Technology
Figure 2. Schematic overview of the experimental setup used during this work.
• Pressure differential device to measure the pressure drop across the micro-
model • Valves and flow lines consisting of PTFE material and stainless steel • A modified cabinet dryer with the camera and UV-Lights built in and able to
heat the micromodel • Back-pressure unit to install the pressure across the system accurately • Glass Syringes with a capacity of 10 ml • Computer connected to system to record photographs and differential pres-
sure • Micromodel Holder with an orange metal plate below it for better contrast
Micromodels have been used for several applications and evaluations, the flow behavior is addressed at the microscale by using microfluidics or lab-on-a–chip systems [23]-[28]. Micromodels used in this work are made of three layers, namely Glass-Silicon-Glass, and possess a size of 40 mm × 40 mm × 0.05 mm. To keep the micromodel transparent the porous structure is dry etched through the silicon. The silicon amidst two glass layers resembles a realistic, heterogene-ous sandstone and is depicted in Figure 3. The arrows implicate the injection and production areas. The micromodel structure is derived from a µT image of a real unconsolidated sandstone or a thin-section, which is in the range of milli-meters. An algorithm is used to create a large-scale image, whilst keeping the same properties, to create a micromodel utilizable for experiments, by adding patterns [29] [30] [31]. The characteristics of the used Micromodel can be seen

L. O. Knobloch et al.
DOI: 10.4236/wjet.2018.62021 338 World Journal of Engineering and Technology
Figure 3. Binary image (lithographic mask) of the micromodel [29].
in Table 3. Permeability (k) was measured during brine injection, at a rate of 2.5 µl/min, according to Darcy and equals 1.14 D.
5. Experimental Methodology and Evaluation Methods
Prior the beginning of each experiment, it is important to ensure that the room and the cabinet have a temperature of about 22˚C (room temperature). For cor-rect differential pressure measurements is important to make sure that the pipe-lines and the micromodel are free of any air. If air should still be in the pipelines and the model, it has to be cleaned prior to starting the experiment. The back-pressure was initiated before every experiment and set to 3 bar. The experiments consist of six steps which are repeated with every polymer concentration. The differential pressure is recorded at every step of the experiment via software for qualitative analysis. A photograph is taken every minute for quantitative analy-sis.
The workflow can be schematically understood and explained using Figure 4. Moreover, Figure 5 describes in detail each step. An additional sequence for the workflow can be given as follows: • Before injecting into the micromodel, 1 ml of the fluids is injected into the
effluent container to fully saturate both sides. • The first step of the experiment is to show the effect of the added tracer par-
ticles in aspect of plugging. To accomplish this, in the first step brine without tracer particles is injected at a rate of 2.5 µl/min into the fully water saturated micromodel for about 40 minutes. This injection rate and length of injection will be the same for all the steps. At the first contact of the polymer fluid with the micromodel, 2 - 3 more pore volumes (PV) are injected. At a rate of 2.5 µl/min each 10 minutes another PV is injected and the first contact was usually seen after ~10 minutes.

L. O. Knobloch et al.
DOI: 10.4236/wjet.2018.62021 339 World Journal of Engineering and Technology
Table 3. Properties of the micromodel modified after Wegner (2015) [29], Herbas et al. (2015) [31] and Wegner et al. (2015) [32].
Property Micromodel Value
Porosity [%] 34.07
Bulk volume (BV) [mm3] 80
Pore volume (PV) [mm3] 27.26
Average pore diameter [µm] 182.29
Min. pore diameter [µm] 62.60
Max. pore diameter [µm] 1682.10
Average grain size [mm2] 0.31
Min. grain size [mm2] 0.001
Max. grain size [mm2] 57.09
Grain count [-] 3360
Specific-Surface [mm2/mm3] 13.93
X-Tortuosity [-] 1.287
Y-Tortuosity [-] 1.189
Permeability 1.14 D
Figure 4. Schematic representation of the Experimental Steps as interpreted. Steps included here: Brine Injection without Tracer , Polymer Injection , Brine Injection without Tracer .
• During the second step, brine with added tracer particles is injected. It is will
observed, that the differential pressure recorded during both stages depicted very similar or even identical behavior, thus leading to the result, that the tracer itself does not cause plugging.
0 2 4 6 8 100
20
40
60
80
100
120

L. O. Knobloch et al.
DOI: 10.4236/wjet.2018.62021 340 World Journal of Engineering and Technology
Figure 5. Workflow of the steps undertaken to conduct experiments in this work. • The third step is to clean the system. The tracer particles are not dissolvable,
therefore have to be pushed out of the system. 4 ml Scleroglucan 600 - 800 ppm is injected at a rate of 500 µl/min. Afterwards 6 ml deionized water is injected at the same rate. This cleaning process is used during the experi-ments because it shows sufficient results. However, after each experiment the micromodel is cleaned more thorough with acid.
• In a fourth step, brine is injected without tracer to saturate the micromodel. • Step 5 consists of the injection of the polymer with tracer, which is followed
by another brine injection without tracer in step 6. • Finally, brine with tracer is injected to be able to compare the results of step 2
and 7. In matter of quantitative analysis, the reduction in permeability due to a va-
riety of mechanisms can be calculated and represented as resistance factor (RF) and residual resistance factor (RRF). RF shows the enhancement of viscosity due to the polymer, also the mobility control capability, and RRF defines the per-meability reduction in a porous medium due to retention [21].
( )( )
PolymerBrine before Polymer Injection
PRF
P∆
=∆
(1)
( )( )
Brine after Polymer InjectionBrine before Polymer Injection
PRRF
P∆
=∆
(2)
Experiments with tracer particles are not able to visualize adsorption. This could be due to the fact that only retention mechanisms can be made visible where the tracer particles are stopped fully. Adsorption does narrow down even small passages, but does not usually block them, so that the tracer particles are still able to flow past. Thus, with adsorption not being made visible in the expe-riments the following equation is used to calculate the adsorption in a specific case.
( )0 eVm
C CΓ = − (3)

L. O. Knobloch et al.
DOI: 10.4236/wjet.2018.62021 341 World Journal of Engineering and Technology
where Γ [mg/g] is the polymer adsorption in porous media, C0 [ppm] is the ini-tial polymer concentration, Ce [ppm] is the equilibrium polymer concentration, V [L] is the volume of the solution and m [g] is the weight of the adsorbent [2].
In matter of qualitative analysis, the photographs of the micromodel after the polymer injection are analyzed using a grid of 10 × 10. This helps defining the areas in which polymer retention occurred and is summarized in Table 2. The flowing part of the micromodel is calculated by:
Flowing Grids Overall Grids Not Flowing Grids= − (4)
The grids, which showed polymer retention, in percentage from the overall flowing grids is then calculated by:
[ ] Grids with visible retentionGrids with visible retention % *100Flowing Grids
= (5)
6. Qualitative Results
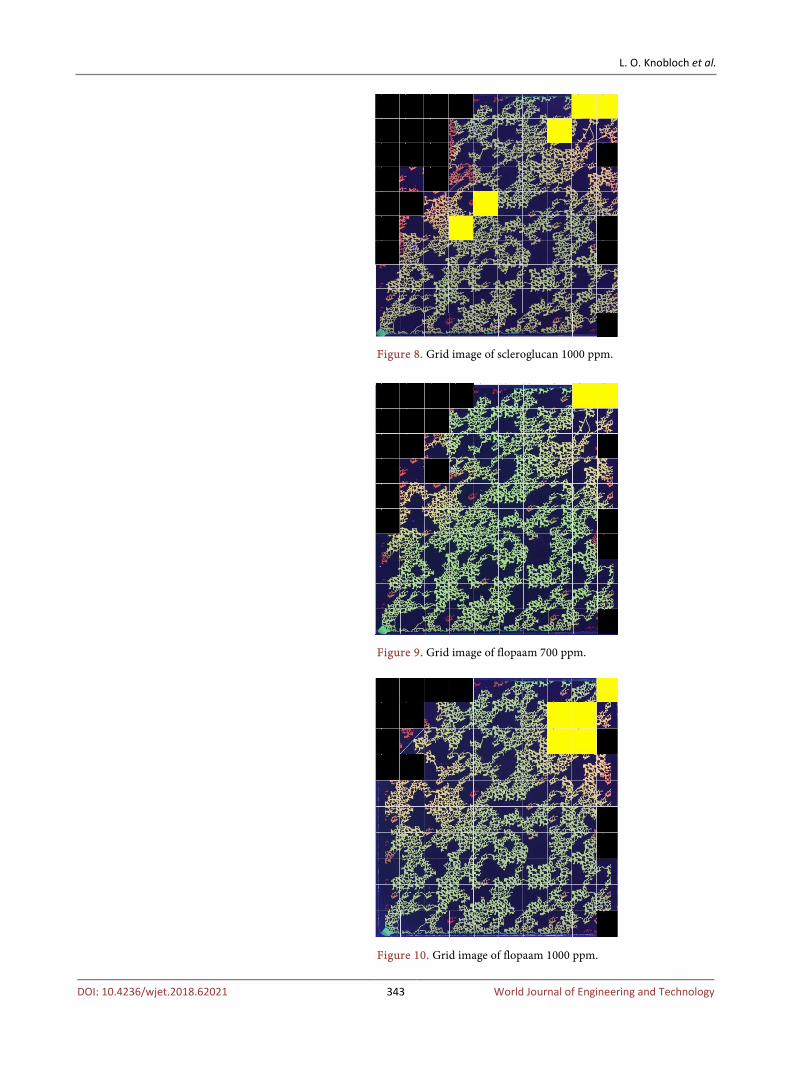
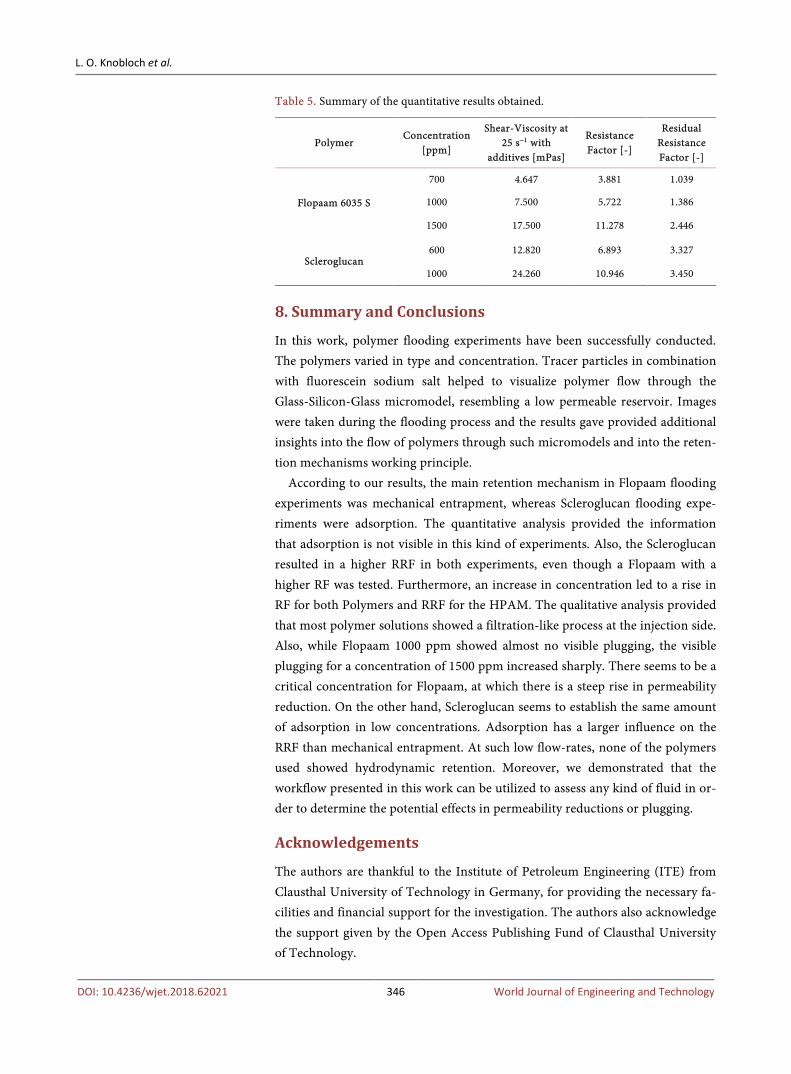
The qualitative analysis led to the assumption, that adsorption is not visible in the experiments conducted in this work. This will be further shown and proven in the quantitative analysis. Furthermore, only Flopaam showed a high amount of plugging throughout the entire micromodel. The values of plugged grids and flowing grids for each experiment are summarized in Table 4. The overall flow that the fluid establishes in the micromodel is depicted in Figure 6. The Grid-Images resulting after the polymer injection can be seen in Figures 7-11. The black grids resemble not-flowing grids of the micromodel, the yellow grids resemble zones in the micromodel, in which polymer retention was observed.
7. Quantitative Results
The RF and RRF for all experiments are depicted in Figure 12 and Figure 13 respectively, and summarized in Table 3. These values correspond nicely to the observations made earlier in this work. Scleroglucan solutions reached higher viscosity and therefore RF at lower concentrations. Furthermore, since adsorp-tion seems to be the main mechanism of retention working during a biopolymer flood, the impact of it is displayed clearly. Scleroglucan 600 ppm reaches a lower RF than Flopaam 1500 ppm, but a higher RRF. Also, even though Flopaam 1500 ppm reaches the same RF value as Scleroglucan 1000 ppm, the RRF is reasonably lower.
Flopaam reaches a higher RF in a concentration of 1000 ppm than with 700 ppm and therefore a higher viscosifying power, but the reduction in permeabili-ty is almost the same and almost neglectable. Flopaam 1000 ppm therefore seems to be very suitable for reservoirs similar to the micromodel used in this work. A concentration of 1500 ppm already shows a more significant reduction in per-meability.
For the Scleroglucan 600 ppm the effluents were collected and tested and re-sulted in a viscosity of 11.68 mPas at a shear rate of 25 s−1. The concentration and viscosity of further test results of Scleroglucan at shear-rate 25 s−1 were

L. O. Knobloch et al.
DOI: 10.4236/wjet.2018.62021 342 World Journal of Engineering and Technology
Table 4. Summary of the qualitative analysis.
Polymer Concentration
[ppm] Flowing Grids
[%] Grids with visible
retention* [%] Visible
Retention
BIO-Scleroglucan 600 87.0 3.45 Low
BIO-Scleroglucan 1000 79.5 6.29 Intermediate
HPAM-Flopaam 700 83.0 2.41 Low
HPAM-Flopaam 1000 86.5 5.78 Intermediate
HPAM-Flopaam 1500 87.0 19.54 High
*Percentage of the flowing grids.
Figure 6. Overall flow establishing in the micromodel.
Figure 7. Grid image of scleroglucan 600 ppm.
plotted in Figure 14, the equilibrium concentration could be determined and equals 536.52 ppm. The density of the silica is approximately 2.23 g/cm3. The volume of the silica is calculated by subtracting the volume of the porosity from the total volume, Equation (6). The mass was then calculated via Equation (7) and the adsorption could be determined in Equation (8).
L. O. Knobloch et al.
DOI: 10.4236/wjet.2018.62021 343 World Journal of Engineering and Technology
Figure 8. Grid image of scleroglucan 1000 ppm.
Figure 9. Grid image of flopaam 700 ppm.
Figure 10. Grid image of flopaam 1000 ppm.

L. O. Knobloch et al.
DOI: 10.4236/wjet.2018.62021 344 World Journal of Engineering and Technology
Figure 11. Grid image of flopaam 1500 ppm.
Figure 12. Summary of the resistance factor of all polymers.
( ) ( )3 3 3[mm ] silica 80 mm 80 mm 0.3407 52.744V = − ∗ = (6)
[ ]( ) 33
gg silica 0.00223 *52.744 mm 0.1176mm
m = = (7)
[ ] ( ) ( )00.008mg g 600 536.52 4.318
0.1176eVC Cm
Γ = − = − = (8)
This result equals 4318 µg/g of adsorption and is a very high result comparing it to the values found in previous experiments. This value should be considered with caution, since the experiment was running for two days under room
0 0.5 1 1.5 2 2.5 3 3.5 40
2
4
6
8
10
12

L. O. Knobloch et al.
DOI: 10.4236/wjet.2018.62021 345 World Journal of Engineering and Technology
Figure 13. Summary of the residual resistance factor of all polymers.
Figure 14. Scleroglucan viscometer results at shear-rate 25 s−1.
temperature. Uncertainties, such as the degradation of the polymer are not in-cluded. Nevertheless, it implies a very large amount of adsorption for the biopo-lymer.
All in all, it can be seen in the data, that the adsorption in biopolymers is a large issue for polymer flooding in media with low permeability (Table 5).
0 0.5 1 1.5 2 2.5 3 3.5 40
5
10
15
300 400 500 600 700 800 900 10005
10
15
20
25
L. O. Knobloch et al.
DOI: 10.4236/wjet.2018.62021 346 World Journal of Engineering and Technology
Table 5. Summary of the quantitative results obtained.
Polymer Concentration
[ppm]
Shear-Viscosity at 25 s−1 with
additives [mPas]
Resistance Factor [-]
Residual Resistance Factor [-]
Flopaam 6035 S
700 4.647 3.881 1.039
1000 7.500 5.722 1.386
1500 17.500 11.278 2.446
Scleroglucan 600 12.820 6.893 3.327
1000 24.260 10.946 3.450
8. Summary and Conclusions
In this work, polymer flooding experiments have been successfully conducted. The polymers varied in type and concentration. Tracer particles in combination with fluorescein sodium salt helped to visualize polymer flow through the Glass-Silicon-Glass micromodel, resembling a low permeable reservoir. Images were taken during the flooding process and the results gave provided additional insights into the flow of polymers through such micromodels and into the reten-tion mechanisms working principle.
According to our results, the main retention mechanism in Flopaam flooding experiments was mechanical entrapment, whereas Scleroglucan flooding expe-riments were adsorption. The quantitative analysis provided the information that adsorption is not visible in this kind of experiments. Also, the Scleroglucan resulted in a higher RRF in both experiments, even though a Flopaam with a higher RF was tested. Furthermore, an increase in concentration led to a rise in RF for both Polymers and RRF for the HPAM. The qualitative analysis provided that most polymer solutions showed a filtration-like process at the injection side. Also, while Flopaam 1000 ppm showed almost no visible plugging, the visible plugging for a concentration of 1500 ppm increased sharply. There seems to be a critical concentration for Flopaam, at which there is a steep rise in permeability reduction. On the other hand, Scleroglucan seems to establish the same amount of adsorption in low concentrations. Adsorption has a larger influence on the RRF than mechanical entrapment. At such low flow-rates, none of the polymers used showed hydrodynamic retention. Moreover, we demonstrated that the workflow presented in this work can be utilized to assess any kind of fluid in or-der to determine the potential effects in permeability reductions or plugging.
Acknowledgements
The authors are thankful to the Institute of Petroleum Engineering (ITE) from Clausthal University of Technology in Germany, for providing the necessary fa-cilities and financial support for the investigation. The authors also acknowledge the support given by the Open Access Publishing Fund of Clausthal University of Technology.

L. O. Knobloch et al.
DOI: 10.4236/wjet.2018.62021 347 World Journal of Engineering and Technology
References
[1] Hincapie, R., Tovar, F.D. and Alvarez, C.E. (2011) Feasibility for the Application of In Situ Combustion in Faja Petrolifera del Orinoco (FPO) Based in a Novel Screen-ing Criteria for the Technology. Society of Petroleum Engineers, Kuala Lumpur.
[2] Sorbie, K. (1990) Polymer-Improved Oil Recovery. CRC Press Inc., Boca Raton, 126-164.
[3] Hincapie, R.E., Alvarez, C.E. and Vargas, A.J. (2011) Technical Feasibility of Poly-mer Injection in Heavy Oil Reservoir BAINF60 and BAMED78: Intercampo Norte—Through Predictive Models. SPE Heavy Oil Conference and Exhibition, Kuwait City, 12-14 December 2011, SPE-149621-MS.
[4] Mezger, T.G. (2011) The Rheology Handbook. 3rd Edition, Vincentz Network GmbH & Co KG, Hanover.
[5] Seright, R.S., Seheult, J.M. and Talashek, T. (2009) Injectivity Characteristics of EOR Polymers. SPE Annual Technical Conference and Exhibition, Denver, Colo-rado, 21-24 September 2009, SPE-115142-MS. https://doi.org/10.2118/115142-PA
[6] Hincapie, R.E. and Ganzer, L. (2015) Assessment of Polymer Injectivity with Re-gards to Viscoelasticity: Lab Evaluations towards Better Field Operations. EUROPEC 2015, Madrid, 1-4 June 2015, SPE-174346-MS.
[7] Sheng, J.J. (2010) Modern Chemical Enhanced Oil Recovery—Theory and Practice. Elsevier, Amsterdam.
[8] Thomas, A. (2016) Polymer Flooding. InTech. https://doi.org/10.5772/64623
[9] Manichand, R. and Seright, R.S. (2014) Field vs. Laboratory Polymer-Retention Values for a Polymer Flood in the Tambaredjo Field. SPE Improved Oil Recovery Symposium, Tulsa, 12-16 April 2014, SPE-169027-MS.
[10] Yerramilli, S., Zitha, P. and Yerramilli, C. (2013) Novel Insight into Polymer Injec-tivity for Polymer Flooding. SPE European Formation Damage Conference & Exhi-bition, Noordwijk, 5-7 June 2013, SPE-165195-MS.
[11] Castro-Garcia, R.H., Maya-Toro, G., Jimenes-Diaz, R., Quintero-Perez, H., Diaz-Guardia, V., Colmenares-Vargas, K., Palma-Bustamante, J., Delgadillo-Aya, C. and Perez-Romero, R. (2016) Polymer Flooding to Improve Volumetric Sweep Efficiency in Waterflooding Processes. CT&F—Ciencia, Tecnologia y Futuro, Santander, Columbia.
[12] Zaitoun, A. and Kohler, N. (1988) Two-Phase Flow through Porous Media: Effect of an Adsorbed Polymer Layer. Society of Petroleum Engineers, Houston.
[13] Vela, S., Peaceman, D. and Sandvik, E. (1976) Evaluation of Polymer Flooding in a Layered Reservoir with Crossflow, Retention and Degradation. SPE J, 16, 82-96. https://doi.org/10.2118/5102-PA
[14] Wei, B., Romero-Zerón, L. and Rodrigue, D. (2013) Mechanical Properties and Flow Behaviour of Polymers for Enhanced Oil Recovery. Taylor & Francis, Abing-don-on-Thames.
[15] De Melo, M.A., de Holleben, C.R.C., da Silva, I.P.G., de Barros Correia, A., da Silva, G.A., Rosa, A.J., Lins, A.G. and de Lima, J.C. (2005) Evaluation of Poly-mer-Injection Projects in Brazil. Society of Petroleum Engineers, Rio de Janeiro.
[16] Lu, X., Liu, H., Wang, S. and Wang, X. (2011) Performance Evaluation and Me-chanism Analysis of HPAM Solutin with Broad-Distribution Relative Molecular Mass. International Petroleum Technology Conference, Bangkok, 15-17 November 2011, 12. https://doi.org/10.2523/IPTC-14352-MS

L. O. Knobloch et al.
DOI: 10.4236/wjet.2018.62021 348 World Journal of Engineering and Technology
[17] Tu, T.N. and Bae, W. (2011) Investigating the Effect of Polymer Gels Swelling Phe-nomenon under Reservoir Conditions on Polymer Conformance Control Process. International Petroleum Technology Conference, Bangkok, 15-17 November 2011, 11. https://doi.org/10.2523/IPTC-14673-MS
[18] Wassmuth, F.R., Green, K. and Bai, J. (2012) Associative Polymers Outperform Regular Polymers Displacing Heavy Oil in Heterogeneous Systems. Society of Pe-troleum Engineers, Calgary. https://doi.org/10.2118/157916-MS
[19] Fletcher, A., Flew, S.R.G., Lamb, S.P., Lund, T., Bjornestad, E., Stavland, A. and Gjovikli, N.B. (1991) Measurements of Polysaccharide Polymer Properties in Por-ous Media. Society of Petroleum Engineers, Anaheim.
[20] Elhajjaji, R.R., Hincapie, R.E., Tahir, M., Rock, A., Wegner, J. and Ganzer, L. (2016) Systematic Study of Viscoelastic Properties during Polymer-Surfactant Flooding in Porous Media. Society of Petroleum Engineers, Moscow. https://doi.org/10.2118/181916-MS
[21] Hincapie, R.E. (2016) Pore-Scale Investigation of the Viscoelastic Phenomenon during Enhanced Oil Recovery (EOR) Polymer Flooding through Porous Media. Papierflieger Verlag GmbH, Clausthal-Zellerfeld.
[22] Foedisch, H., Wegner, J., Hincapie, R.E. and Ganzer, L. (2015) Impact of Connate Water Replacement on Chemical EOR Processes. Society of Petroleum Engineers, Quito. https://doi.org/10.2118/177196-MS
[23] Clarke, A., Howe, A.M., Mitchell, J., Staniland, J. and Hawkes, L.A. (2016) How Viscoelastic Polymer Flooding Enhances Displacement Efficiency. Society of Petro-leum Engineers, Quito.
[24] Galindo-Rosales, F.J., Campo-Deaño, L., Pinho, F.T., van Bokhorst, E., Hamersma, P.J., Oliveira, M.S.N. and Alves, M.A. (2011) Microfluidic Systems for the Analysis of Viscoelastic Fluid Flow Phenomena in Porous Media. Microfluidics and Nanof-luidics, 12, 485-498. https://doi.org/10.1007/s10404-011-0890-6
[25] Hincapie, R.E., Rock, A., Wegner, J. and Ganzer, L. (2017) Oil Mobilization by Vis-coelastic Flow Instabilities Effects during Polymer EOR: A Pore-Scale Visualization Approach. Society of Petroleum Engineers, Buenos Aires.
[26] Rock, A., Hincapie, R.E., Wegner, J. and Ganzer, L. (2017) Advanced Flow Behavior Characterization of Enhanced Oil Recovery Polymers. Society of Petroleum Engi-neers, Paris.
[27] Be, M., Hincapie, R.E., Rock, A., Gaol, C.L., Tahir, M. and Ganzer, L. (2017) Com-prehensive Evaluation of the EOR Polymer Viscoelastic Phenomenon at Low Rey-nolds Number. Society of Petroleum Engineers, Paris.
[28] Rock, A., Hincapie, R.E., Wegner, J., Foedisch, H. and Ganzer, L. (2017) Pore-Scale Visualization of Oil Recovery by Viscoelastic Flow Instabilities during Polymer EOR. European Association of Geoscientists and Engineers, Stavanger. https://doi.org/10.3997/2214-4609.201700273
[29] Wegner, J. (2015) Investigation of Polymer Enhanced Oil Recovery (EOR) in Mi-crofluidic Devices that resemble Porous Media—An Experimental and Numerical Approach. Institute of Petroleum Engineering, Clausthal-Zellerfeld.
[30] Foedisch, H., Hincapie, R., Wegner, J. and Ganzer, L. (2015) Visualization of Con-nate Water Replacement during Flooding Experiments Using Glass-Silicon-Glass Micromodels. First Break Magazine.
[31] Herbas, J.G., Wegner, J., Hincapie, R.E., Foedisch, H., Ganzer, L., Castillo, J.A.D. and Mugizi, H.M. (2015) Comprehensive Micromodel Study to Evaluate Polymer EOR in Unconsolidated Sand Reservoirs. Society of Petroleum Engineers, Manama.

L. O. Knobloch et al.
DOI: 10.4236/wjet.2018.62021 349 World Journal of Engineering and Technology
https://doi.org/10.2118/172669-MS
[32] Wegner, J., Hincapie, R.E., Foedisch, H. and Ganzer, L. (2015) Novel Visualisation of Chemical EOR Flooding Using a Lab-on-a-Chip Setup Supported by an Exten-sive Rheological Characterisation. Society of Petroleum Engineers, Kuala Lumpur. https://doi.org/10.2118/174648-MS


![Error Analysis of Radial Motion Measurement of Ultra ... · R. S. Zhang et al. DOI: 10.4236/wjet.2018.63034 568 World Journal of Engineering and Technology [4]. Grejda proposed a](https://img.dokumen.tips/doc/110x75/5f7e063963dbdf3b79028dd4/error-analysis-of-radial-motion-measurement-of-ultra-r-s-zhang-et-al-doi.jpg)