Embed Size (px)
Citation preview
Qualification and skill mismatches: Europe in a cross-national perspective*
Santiago Budría Universidad Nebrija, CEEAplA and IZA
Ana I. Moro-EgidoUniversidad de Granada
Abstract
This paper examines patterns in qualification and skill mismatches between countries using data from the CEDEFOP European Skills and Jobs Survey for 28 EU countries. We assess the incidence of both types of mismatches across the EU and document the higher incidence of over instead of under qualification and skilling. The analysis of the determinants of both overqualification and overskilling shows that it is worth exploring qualification and skills mismatches separately, as they are associated with different worker profiles, job characteristics and country aggregate features. Finally, we are able to account for the contribution of aggregate level variables in explaining the incidence of mismatches across the population and countries. They are crucial for the case of overqualification, and as important as individual and job characteristics for overskilling.
Keywords: skill mismatch, qualification mismatch, multilevel techniques, individual and country characteristics.
JEL classification: J24, I20, I28
Resumen
El objetivo principal de este estudio es examinar los patrones de desajustes de cualificación y de habilidades entre países utilizando datos de la Encuesta Europea de Habilidades y Empleos para 28 países de la UE. Al evaluar la incidencia de ambos tipos de desajustes, encontramos que el más frecuente es el exceso de cualificación y habilidades. El análisis de los factores determi-nantes de dichos desajustes por exceso de cualificación y habilidades muestra que vale la pena explorar los desajustes de cualificaciones y habilidades por separado, ya que están asociados con diferentes perfiles de trabajadores, con diferentes características de trabajo y con diferentes ca-racterísticas agregadas de país. Finalmente, determinamos que la contribución de las variables que recogen las características del país a nivel agregado es crucial para el caso de la sobrecua-lificación, y tan importante como la contribución de las características individuales y laborales para el exceso de habilidades.
Palabras clave: desajuste de habilidad, desajuste de cualificación, técnicas multinivel, características del individuo y del país.
Clasificación JEL: J24, I20, I28.
* The financial support from the Government of Spain through grant ECO2015-63734-P (MINECO/FEDER) is gratefully acknowledged.

152 CUADERNOS ECONÓMICOS DE ICE N.O 95
1. Introduction
There is evidence that a large part of the working population is job mismatched in terms of qualifications and/or skills. However, overqualification and skill mismatches refer to quite different phenomena. Measures of overqualification may not capture the extent to which a worker’s skills are utilized in employment and workers with excess qualifications may still lack skills that are necessary on the job. The labour market consequences of these two distinct phenomena may differ markedly (Mavromaras et al., 2009, 2010a, 2010b, 2015). At the top of that, overqualification is closely related to education achievement, while overskilling is more prone to capture work-related human capital. From an individual point of view, the determinants of overskilling and overqualification are found to differ, and the correlation between these two indicators is weak (Flisi et al., 2014; Battu and Zakariya, 2015; McGuinness et al., 2017b). Therefore, it is likely that these two forms of mismatch react differently to changes in aggregate structural factors and economic fluctuations.
This phenomenon of mismatches has serious consequences for individuals, organizations and countries. Examining the determinants of qualification and skills mismatches has become, therefore, a recurrent theme in the literature. However, most research to date has been conducted within countries and has put the focus on the role of individual, microeconomic characteristics. Due to a lack of available datasets that measure qualification and skills mismatch consistently across countries, there has been relatively little assessments from an aggregate country level perspective. This is unfortunate, since comparative international research on the issue may underline the importance of aggregate level variables in explaining the incidence of qualification mismatches across the population and countries. Moreover, the few attempts to exploit international comparable data have been confined to the analysis of overqualification (Verhaest and Van der Velden, 2013; Davia et al., 2017; McGuinness et al., 2017a).
Using the CEDEFOP European Skills and Jobs Survey (ESJS), which comprises data from the 28 EU member states for 2014, we contribute to the literature in three different ways. First, we examine jointly the role of individual and macroeconomic and institutional factors in determining qualification and skills mismatches. Unlike earlier studies that use solely individual level data to explain inter-personal differences in mismatch, we adopt a more aggregate approach that allows us to combine individual data with aggregate country-specific conditions. Secondly, we focus on various forms of mismatch. Specifically, we differentiate between qualification mismatches, i.e., a situation whereby the workers possess educational credentials above or below those required to do the job, and skills mismatch, i.e., the underutilization at the job of skills and abilities possessed by the worker or the lack of skills that are required at the job. Thirdly, an advantage of the ESJS is that it differentiates between qualification mismatches to get a job and qualification mismatches to do a job, and it contains information on skills mismatches at three different points in time: i) at the time of the survey completion, ii) at the time of

QUALIFICATION AND SKILL MISMATCHES... 153
the entry at the current job and iii) in the previous job. This detailed information allows us to examine how different scenarios of mismatch are related to micro and macroeconomic variables.
The paper is organized as follows. The next section provides an overview on the related literature of measurement issues and determinants of mismatch. Section 3 presents the method of analysis. Section 4 describes the data set, the definitions of education and skills mismatches and the variables used in the paper. Section 5 includes a detailed description of the regression results. Section 6 presents the concluding remarks and further discussion.
2. Background
Education and skills mismatches have been systematically found to exert negative effects on earnings (McGuinnes, 2006; Mavromaras et al., 2007, 2012, 2015; Budría and Moro-Egido, 2008, 2009, 2014; McGuinness and Wooden, 2009; McGuinness and Sloane, 2011; Bárcena et al., 2012; Sánchez-Sánchez and McGuinness, 2015; McGuinness and Pouliakas, 2016); job satisfaction (Verhaest and Omey, 2009; Green and Zhu, 2010; Piper, 2015; Sánchez-Sánchez and McGuinness, 2015; Congregado et al., 2016), labour market prospects (Mavromaras et al., 2015), firm productivity (Mahy et al., 2015), etc. These effects, which have been documented extensively, under a myriad of datasets, countries, econometric approaches, definitions and measurement methods, are well summarized in two surveys on the topic, McGuinnes (2006) and, more recently, McGuinness et al. (2017b).
Despite the accumulated evidence, there is still not much consensus about the main causes of job mismatches, and especially about the issue of whether they are a temporary or permanent phenomenon. Several theories in the literature support the view of the phenomenon being a short-term problem. For instance, matching theory (Jovanovic, 1979) suggests that overqualification represents a poor match for workers because they are qualified to perform higher level jobs. Over time, however, workers are expected to improve their job match. In the same line, the career mobility hypothesis supports that overqualification is part of a career path or insertion process in the labour market. According to this view, workers may enter jobs for which they are overqualified and later on move to jobs that better match their educational attainments (Groot and van den Brink, 2000; Büchel and Mertens, 2004).
Other theories consider job mismatches as a more serious and long-lasting problem. This occurs, for instance, when the labour market is characterized by imperfect information –Spence’s (1973) job-screening model– or when the presence of labour market rigidities induces workers to occupy jobs for which they are overqualified. Family responsibilities and/or regional immobility have been found to explain workers’ decisions to voluntarily accept jobs for which they are overqualified (Dolton and Vignoles, 2000; Green et al., 2002). Assignment models (Sattinger, 1993) also stress the importance of job distribution. Under this setting, the job allocation

154 CUADERNOS ECONÓMICOS DE ICE N.O 95
process and utility maximization guides workers to choose certain jobs over others. Therefore, changes in the distribution of earnings and, by default, overqualification, will be related to both the distribution of jobs and the characteristics of the workforce.
Complementary explanations of the qualification mismatches focus on the presence of unobserved heterogeneity. Mismatched workers may be in some way less able and lack some of the abilities and skills required to do a job that is not aligned with their level of education. The evidence supporting this ability-skills hypothesis is limited, however. Evidence based on earnings shows, for instance, that the wage penalty associated with being overqualified is independent of the level of skill utilization within firms (McGuiness, 2003a) and/or the skills and abilities possessed by the individual (McGuiness, 2003b; and Chevalier, 2003). In this line, evidence based on quantile regression techniques to differentiate between high-skill and low-skill workers shows that overqualification decreases wages also among the high-skilled (McGuiness and Bennet, 2007; Budría and Moro-Egido, 2014).
2.1. Measurement
Overqualification describes the extent to which an individual possesses a level of education in excess of that which is required for his or her job. Two ways of measuring this phenomenon can be distinguished in the literature: the “subjective” approach and the “objective” approach. The subjective approach is based on the worker’s self-assessment regarding the quality of the match between his or her education and the educational requirements of the job or, alternatively the minimum educational requirements for the job (Frei and Sousa-Poza, 2012; Baert et al., 2013). The objective approach, in turn, consists of finding the educational requirements externally. A worker is regarded to be overqualified (underqualified) if he or she has more (less) education than is required for the job. A number of studies have established the job-level requirements by calculating the mean/mode value within occupations (Quinn and Rubb, 2006, among many others). This method is frequently termed the “statistical” approach. Some other authors prefer to rest upon the formal evaluation of independent job analysts to determine the correct level of education required for each job title (e.g. Dekker et al., 2002).
It is generally accepted that none of the above methods outperforms the others, the choice of a particular one in applied work being mostly dependent on data availability. The most recent sensitivity analyses show that the extent, effects and determinants of overqualification may differ sensitively across measures (Barone and Ortiz, 2011; European Commission, 2015). This observation highlights the pending challenges associated with the measurement of overqualification.
As for the measurement of skills mismatches, most studies rely on self-reported data. This is due to the difficulty of defining and surveying all skills that, on the one hand, individuals possesses and, on the other hand, are required in a job. The REFLEX dataset has been probably the most utilized source to investigate the

QUALIFICATION AND SKILL MISMATCHES... 155
determinants and consequences of skills mismatches (Baert et al., 2013; Sánchez-Sánchez and McGuiness, 2015). In this dataset, the central question is “to what extent are your skills utilized in this work”, the possible answers ranging from of 1 (not at all) to 5 (to a very high extent). Low answers are then interpreted as an indicator of overskilling. A separate question with an identical range of possible answers is intended to measure underskilling, “to what extent does this work require more knowledge and skills than you can actually offer”. The CEDEFOP ESJ survey also asks workers to assess whether they are overskilled as a whole (CEDEFOP, 2015). A feature of this dataset is that workers have to assess also the extent of skills match in a subset of eleven specific skills, including for instance literacy, numeracy, ICT, technical skills, foreign languages and teamwork among others.
2.2. Individual determinants of qualification and skills mismatches
Papers investigating the determinants of overqualification typically conclude that the phenomenon is more prevalent among the high-educated, graduates of social sciences, and humanities, individuals living in areas with high commuting time and workers in firms that rely on shifts and part-time workers (Ortiz and Kucel, 2008; Belfield, 2010; McGowan and Andrews, 2015).
Past overqualification is also an important determinant of current mismatches. Verhaest et al. (2015) find that a high percentage of Belgian graduates’ experience persistent overqualification. A similar finding is reported in overeducation Blazquez and Budria (2012), who show that personal traits also play a role when accounting for overqualification inertia. Using the 2009 ad-hoc module of the Spanish Labour Force Survey, Acosta-Ballesteros et al. (2017) find that the probability of overeducation increases by 40 pp for those workers who were mismatched in their first significant job. Initial overeducation frequently becomes a trap, especially among university graduates. However, Frei and Sousa-Poza (2012) find that half of overqualified persons in a given year manage to find a job commensurate with their qualifications one year later.
Studies investigating the determinants of skills mismatches have also reported substantial persistence effects. Using data from the European Skills and Jobs Survey, Cedefop (2015) finds that 80 per cent of EU employees who were overskilled at the start of their current job remained overskilled throughout their tenure. Only 17.6 per cent of employees transitioned from being overskilled to matched, and 1.75 per cent went from being overskilled to underskilled. A similar conclusion can be found in Mavromaras et al. (2013).

156 CUADERNOS ECONÓMICOS DE ICE N.O 95
2.3. A country level perspective
As is apparent in our review of the literature, most of the existing work tends to be specific to individual countries and tends to focus on overqualification. To date, research to identify the determinants of international differences in rates of various forms of mismatch has been very limited due to data constraints. Efforts in this direction show that a substantial part of the cross-country variation in overeducation can be attributed to structural imbalances between the overall demand and supply of skilled workers and differences in the business cycle at the time of graduation.
The first paper to provide an aggregate country level perspective is Verhaest and van der Velden (2013), who cover 14 countries using data of the REFLEX survey. For each country, a representative sample of graduates from tertiary education who received their degrees in the academic year 1999/2000 was approached at the end of 2005. The data include, among other elements, detailed information on the study programme, the first employment after graduation, and the employment at the time of the survey, i.e. five years after graduation. Explanatory variables in Verhaest and van der Velden (2013) include indicators for the supply and demand of skilled workers (share of highly educated individuals in the population aged 25 years or older and the gross domestic expenditure on R&D), proxies the quality and orientation (general versus specific) of the study program, indicators of employment protection legislation and variations of the unemployment rate and GDP to proxy macroeconomic conditions. Using multi-level regression techniques, they show that a substantial part of the cross-country variation in graduate overqualification can be attributed to the quality and orientation of the study programme. Moreover, the business cycle and the relative supply of educated workers are two important factors in explaining cross-country differences in overequalification. Graduates that enter the labour market during a recession are much more likely to be overerqualified in their first job and less likely to make a transition from overqualification to a good match. This result is in line with Summerfield and Theodossiou (2017), who investigate the impact of state economic conditions at the time of the individual’s graduation on the probability of him or her suffering a subsequent bad job match, using the German Socioeconomic Panel (GSOEP) for the years 1994-2012. OLS results indicate that a single percentage point increase in the state-level unemployment rate at the time of the individual’s graduation corresponds to an increase in the probability of his or her subsequent overqualification by about 1 per cent. Importantly, this finding is not restricted to the initial job. Moreover, separating the effect by education type shows that the relationship is strongest for workers with university education.
With a similar approach, Davia et al. (2017) use data from the EU-SILC collected between 2004 and 2009 and cover 28 countries. In this case, the relative supply and demand of skilled workers is captured by the ratio of university graduates to employment in professional or managerial positions and the rate of unemployment among graduates. Levels of trade-union density, employment protection legislation and the sectorial composition of employment account for institutional factors.

QUALIFICATION AND SKILL MISMATCHES... 157
They also include returns to schooling and the dispersion of them among university graduates to proxy the benefits and risks associated with education investments. The underlying idea is that overqualification rates are more substantial in regions with higher rates of returns and/or lower dispersion of returns, as these are likely to generate increases in educated labour supply which, in turn, may create a temporary disequilibrium within the labour market that results in overqualification. In line with Verhaest and van der Velden (2013) they find that the incidence of overqualification across countries is sensitive to institutional factors and the relative supply and demand of educated workers, whereas the schooling risk-return variables fail to be significant.
McGuinness et al. (2017a) use the European Union Labour Force Study (EU-LFS) to highlight regional differences in the effects of institutional factors upon overqualification rates. For instance, they find that overqualification and unemployment are treated as substitutes by female workers in Eastern Europe, while labour market flexibility is an important mediating factor but only for males in central European countries. As expected, the distribution of jobs in an economy is also an important factor, with countries employing larger shares of labour in sectors reliant on vocational skills, manufacturing in Central Europe and sales and hospitality in peripheral countries, experiencing lower rates of overqualification. An additional finding is that overqualifcation tends to be lower the higher the availability of vocational educational options for young persons seeking post-secondary education and training in eastern and peripheral countries.
In Davia et al. (2017), overqualification is found to be negatively related to the share of female workers in the labour market, suggesting that factors that stimulate female participation may also simultaneously influence mismatch. Their fractional logit model suggests that one percentage point increase in the share of female employment will produce an average 0.65 percentage point fall in the incidence of overqualification within countries. A candidate explanation for their finding is that labour markets that pro-actively pursue policies in the areas of childcare and family conciliation enable females to remain in the labour market without having to occupationally downgrade.
Overall, these results have strong theoretical implications. Firstly, the key role played by institutional factors does not lend support to job matching and career mobility theories, which suggest that job mismatches are mainly due to short-run disequilibria. Secondly, the finding that overqualification is explained by the supply of persons with education relative to the distribution of skilled jobs in the economy and by the sectorial composition of employment is consistent with an assignment interpretation of the labour market.
3. Econometric model
We account for the hierarchical structure of data using two levels, namely individuals nested into countries. Moreover, to handle the issue of correlated

158 CUADERNOS ECONÓMICOS DE ICE N.O 95
observations within a country, and because we are mainly interested in country differences, we rely on multilevel regression.1 Therefore, we explore the information beyond clustering and analyze the effect of country-level variables.2
We use a random intercept model in which the intercept is allowed to vary between countries.3 We estimate alternative models to evaluate the relative importance of individuals and country-level determinants in explaining cross-national variation in the incidence of qualification mismatches.4 Let us then consider a two-level structure where individuals, i (first level), are nested into countries, c (second level). We model random effects in the form of random intercepts. Each random effect is described according to its estimated variance. Let Mic denote the existence of a mismatch for individual i in country c , and the vectors Xic and Zic contain first level (individual) and the second level (country) characteristics. The null model (Model 1) does not include any explanatory variables, although it gives us information on whether there are country differences in child deprivation levels.
Mic = γ0 +ξ0c + εic [1]
where ξ0c designates the random intercept and εic the individual-level residuals. Both residuals are assumed to be independent and to follow normal distributions with zero mean. We denote the between-country variance by σ 2
ξ0, and the within-country
between-individuals variance by σ 2ε. If the within-country variance were zero, all variability would be among countries. In contrast, if the between-country variance were zero, then there is only variability among individuals of the same country. As usual in the literature, we use the intra-class correlation coefficient to express the proportion of the total variance due to differences between countries,
ICC = σ 2ξ0
/(σ 2ξ0
+ σ 2ε) [2]
We extend the null model by gradually including individual and job characteristics (Model 2):
Mic = γ0 + γ1́Xic + ξ0c + εic [3]
1 Traditional multivariate regression techniques may not be employed with hierarchical data since the standard errors of variables at higher levels of aggregation are underestimated. This is so because the degrees of freedom are calculated as if they were at the first level.
2 We cannot properly evaluate the effect of country-level variables in separate country regressions or with fixed effect models.
3 Regarding the exchangeability assumption required when treating cluster effects as random, we can assume it is satisfied, as we include country-specific covariates. See RABE-HESKETH and SKRONDAL (2012).
4 According to Bryan and Jenkins (2013), a minimum of 25 countries are necessary for linear multilevel models to obtain reliable results in relation to the contribution of the country effect. We fulfill this requirement.

QUALIFICATION AND SKILL MISMATCHES... 159
Finally, to check whether country-level determinants have an effect over and beyond the effect of individual and job characteristics, we propose and extended model (Model 3) to the following:
Mic = γ0 + γ1́Xic + γ2́Zic + ξ0c + εic [4]
where cZ is a vector of country-specific characteristics.
4. Data and variables
4.1. Data set
There are few data sources that allow for the simultaneous measurement of both qualification and skills mismatches. The European Skills and Jobs Survey (ESJS) is an exception. Carried out by CEDEFOP and referred to 2014, the ESJS is a micro dataset covering about 49,000 EU-28 adult employees that contains valuable information on educational achievement, the dynamic evolution of skills mismatches and the pool of skills needed in different occupations. An advantage of the ESJS is that the skills mismatch measures refer to three different points in time: i) at the time of the survey completion, ii) at the time of the entry at the current job and iii) in the previous job. This allows us to examine how divergences in the various scenarios of mismatch are related to micro and macroeconomic variables. The ESJS data thereby allows us to estimate the incidence of various combinations of qualification and skills mismatches affecting adult workers (24-65 years old workers) in the 28 EU member states.
4.2. Variables and descriptive analysis
We differentiate among three major determinants of mismatches: individual characteristics, former and current job characteristics and labour market characteristics at the country level.
4.2.1. Dependent variables: Qualification and skill mismatches
Qualification mismatches
We adopt the subjective approach to measure qualification mismatches. This approach is generally based on the worker self-assessment of the level of qualifications required “to get” or “to do” the job, which is then compared to the highest level of education actually acquired by the worker in order to determine if they are

160 CUADERNOS ECONÓMICOS DE ICE N.O 95
overqualified. Based on the responses to this type of questions, overqualification is generally measured in terms of a dichotomous variable. As pointed out in McGuiness et al. (2017b), it is important to note that different distributions of answers may pick up different effects; being overqualified both “to do the job” and “to get the job” reflects surplus qualifications and skills, whereas being overqualified “to do the job” while being matched “to get the job” may be more reflective of surplus entry requirements. The principal advantage of the subjective approach is that it is relatively easy to apply in survey data.
The use of ESJS gives us the feature of comparability as well. We are able to cover the purpose of cross-country analysis since the questions are common to each country. The ESJS contains self-reported information on the qualification needed to get the job and to do job. Taking the highest level of qualification achieved by the respondent into account, we calculate a set of dummies to capture mismatches in both scenarios. Specifically, we capture whether the individual is overqualified (Overqualif_get), matched (Matchqualif_get) or underqualified (Underqualif_get) to get the job and/or whether the individual is overqualified (Overqualif_do), matched (Matchqualif_do) or underqualified (Underqualif_do) to do the job.
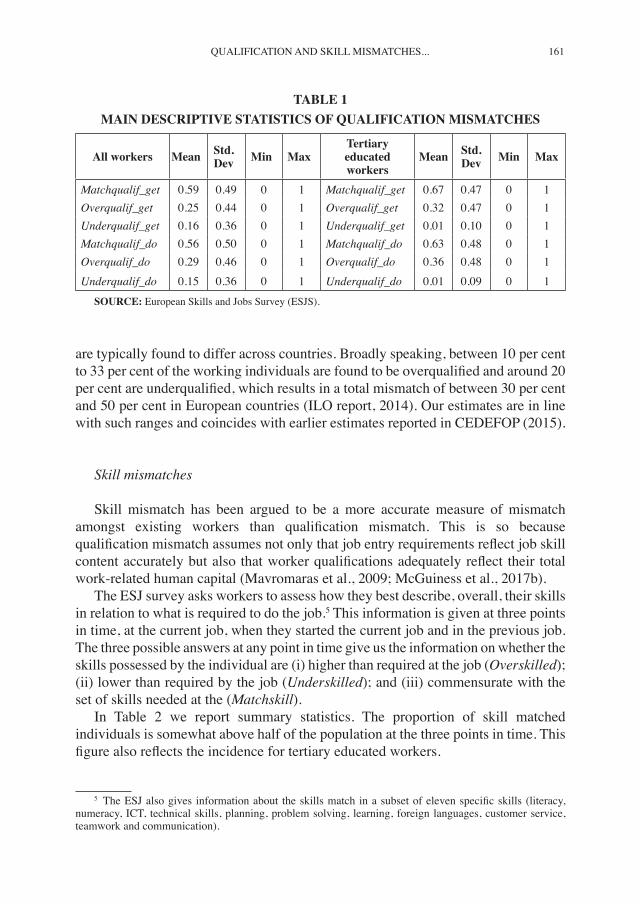
The prevalence of the various types of mismatch is reported in Table 1. We find that more than half of the population is matched to get and to do the job (59 per cent and 56 per cent respectively). The proportion of overqualified individuals ranges from 25 per cent and 29 per cent, whereas the incidence of underqualification is about 15 per cent in both cases. In other words, about 2 out of 3 mismatched individuals are overqualified. Considering only workers with a tertiary education, the incidence of overqualification to get and to do the job is sensitively higher than in the total sample (32 per cent and 36 per cent, respectively), whereas underqualified individuals are practically non-existent. Therefore, among those highly educated workers one third suffers from overqualification. The figures also suggest that the extent of mismatch does not depend crucially on whether one focuses on the qualifications needed to get or do the job. In computations not reported here (but available from the authors on request), we find that 88 per cent of the individuals who are overqualified to get the job are also overqualified to do the job, and this percentage raises to 92 per cent among workers with a university education. In this respect, we do not find evidence of credentialism, i.e., employers requesting a higher degree than needed at the time of hiring relative to what is the genuine qualification level of the job.
We find some differences across countries (Table A1 in Appendix A), with the proportion of correctly matched workers ranging from some 40 per cent in France to 80 per cent in Luxembourg. The prevalence of overqualification ranges from about 10 per cent to 40 per cent, being Croatia and UK the countries with the highest incidence. Underqualification ranges from about 5 per cent to 30 per cent and it reaches the highest levels in France, Portugal and Italy. However, we find that the ranking of countries may vary sensitively, depending on whether we consider qualifications needed to get the job or to do the job. All in all, the international differences reported in the table are not surprising, insofar as estimates of mismatch
QUALIFICATION AND SKILL MISMATCHES... 161
are typically found to differ across countries. Broadly speaking, between 10 per cent to 33 per cent of the working individuals are found to be overqualified and around 20 per cent are underqualified, which results in a total mismatch of between 30 per cent and 50 per cent in European countries (ILO report, 2014). Our estimates are in line with such ranges and coincides with earlier estimates reported in CEDEFOP (2015).
Skill mismatches
Skill mismatch has been argued to be a more accurate measure of mismatch amongst existing workers than qualification mismatch. This is so because qualification mismatch assumes not only that job entry requirements reflect job skill content accurately but also that worker qualifications adequately reflect their total work-related human capital (Mavromaras et al., 2009; McGuiness et al., 2017b).
The ESJ survey asks workers to assess how they best describe, overall, their skills in relation to what is required to do the job.5 This information is given at three points in time, at the current job, when they started the current job and in the previous job. The three possible answers at any point in time give us the information on whether the skills possessed by the individual are (i) higher than required at the job (Overskilled); (ii) lower than required by the job (Underskilled); and (iii) commensurate with the set of skills needed at the (Matchskill).
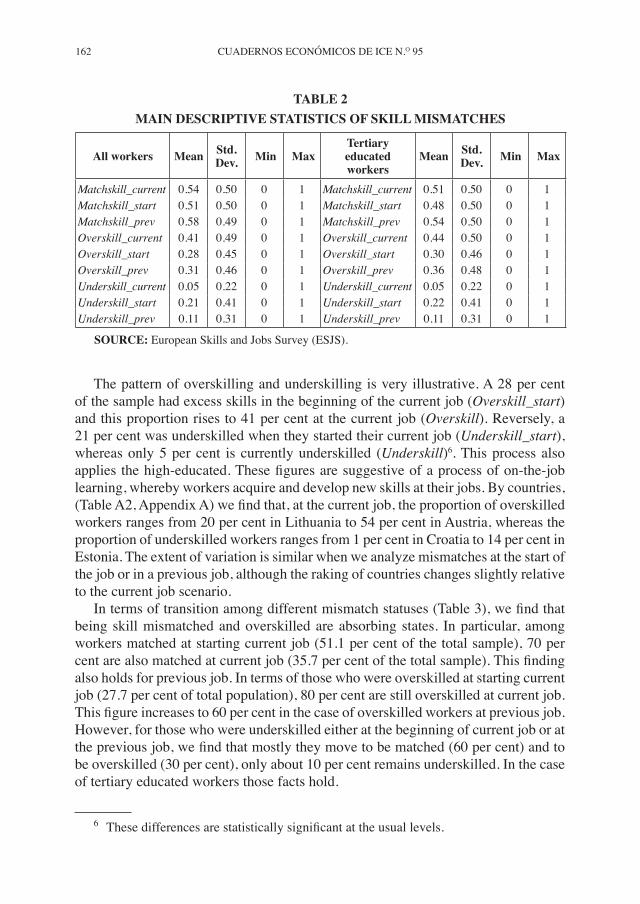
In Table 2 we report summary statistics. The proportion of skill matched individuals is somewhat above half of the population at the three points in time. This figure also reflects the incidence for tertiary educated workers.
5 The ESJ also gives information about the skills match in a subset of eleven specific skills (literacy, numeracy, ICT, technical skills, planning, problem solving, learning, foreign languages, customer service, teamwork and communication).
TABLE 1MAIN DESCRIPTIVE STATISTICS OF QUALIFICATION MISMATCHES
All workers Mean Std. Dev Min Max
Tertiary educated workers
Mean Std. Dev Min Max
Matchqualif_get 0.59 0.49 0 1 Matchqualif_get 0.67 0.47 0 1Overqualif_get 0.25 0.44 0 1 Overqualif_get 0.32 0.47 0 1Underqualif_get 0.16 0.36 0 1 Underqualif_get 0.01 0.10 0 1Matchqualif_do 0.56 0.50 0 1 Matchqualif_do 0.63 0.48 0 1Overqualif_do 0.29 0.46 0 1 Overqualif_do 0.36 0.48 0 1Underqualif_do 0.15 0.36 0 1 Underqualif_do 0.01 0.09 0 1
SOURCE: European Skills and Jobs Survey (ESJS).
162 CUADERNOS ECONÓMICOS DE ICE N.O 95
The pattern of overskilling and underskilling is very illustrative. A 28 per cent of the sample had excess skills in the beginning of the current job (Overskill_start) and this proportion rises to 41 per cent at the current job (Overskill). Reversely, a 21 per cent was underskilled when they started their current job (Underskill_start), whereas only 5 per cent is currently underskilled (Underskill)6. This process also applies the high-educated. These figures are suggestive of a process of on-the-job learning, whereby workers acquire and develop new skills at their jobs. By countries, (Table A2, Appendix A) we find that, at the current job, the proportion of overskilled workers ranges from 20 per cent in Lithuania to 54 per cent in Austria, whereas the proportion of underskilled workers ranges from 1 per cent in Croatia to 14 per cent in Estonia. The extent of variation is similar when we analyze mismatches at the start of the job or in a previous job, although the raking of countries changes slightly relative to the current job scenario.
In terms of transition among different mismatch statuses (Table 3), we find that being skill mismatched and overskilled are absorbing states. In particular, among workers matched at starting current job (51.1 per cent of the total sample), 70 per cent are also matched at current job (35.7 per cent of the total sample). This finding also holds for previous job. In terms of those who were overskilled at starting current job (27.7 per cent of total population), 80 per cent are still overskilled at current job. This figure increases to 60 per cent in the case of overskilled workers at previous job. However, for those who were underskilled either at the beginning of current job or at the previous job, we find that mostly they move to be matched (60 per cent) and to be overskilled (30 per cent), only about 10 per cent remains underskilled. In the case of tertiary educated workers those facts hold.
6 These differences are statistically significant at the usual levels.
TABLE 2MAIN DESCRIPTIVE STATISTICS OF SKILL MISMATCHES
All workers Mean Std. Dev. Min Max
Tertiary educated workers
Mean Std. Dev. Min Max
Matchskill_current 0.54 0.50 0 1 Matchskill_current 0.51 0.50 0 1Matchskill_start 0.51 0.50 0 1 Matchskill_start 0.48 0.50 0 1Matchskill_prev 0.58 0.49 0 1 Matchskill_prev 0.54 0.50 0 1Overskill_current 0.41 0.49 0 1 Overskill_current 0.44 0.50 0 1Overskill_start 0.28 0.45 0 1 Overskill_start 0.30 0.46 0 1Overskill_prev 0.31 0.46 0 1 Overskill_prev 0.36 0.48 0 1Underskill_current 0.05 0.22 0 1 Underskill_current 0.05 0.22 0 1Underskill_start 0.21 0.41 0 1 Underskill_start 0.22 0.41 0 1Underskill_prev 0.11 0.31 0 1 Underskill_prev 0.11 0.31 0 1
SOURCE: European Skills and Jobs Survey (ESJS).

QUALIFICATION AND SKILL MISMATCHES... 163
TABL
E 3
MA
IN D
ESC
RIP
TIV
E ST
ATIS
TIC
S O
F SK
ILL
MIS
MAT
CH
ES (E
VO
LUTI
ON
)
All
wor
kers
Tert
iary
Edu
cate
d w
orke
rsPr
evio
us jo
b Pr
evio
us jo
bC
urre
nt jo
b O
vers
kill
Mat
chsk
illU
nder
skill
Tota
lC
urre
nt jo
bO
vers
kill
Mat
chsk
illU
nder
skill
Tota
lO
vers
kill
18.6
18.6
3.4
40.
6O
vers
kill
21.9
18.5
3.5
43.9
Mat
chsk
ill
11.3
36.8
6.2
54.
3M
atch
skill
12
.332
.6 6
.050
.9U
nder
skill
1.3
2.5
1.3
5.
1U
nder
skill
1.4
2.6
1.2
5.2
Tota
l 31
.2 5
7.9
10.9
100,
0To
tal
35.6
53.7
10.7
100,
0St
art c
urre
nt jo
bSt
art c
urre
nt jo
bC
urre
nt jo
b O
vers
kill
Mat
chsk
illU
nder
skill
Tota
lC
urre
nt jo
b O
vers
kill
Mat
chsk
illU
nder
skill
Tota
lO
vers
kill
22.4
13.8
4.4
40.
6O
vers
kill
24.7
14.5
4.7
43.9
Mat
chsk
ill
4.9
35.7
13.8
54.
3M
atch
skill
5
.132
.113
.750
.9U
nder
skill
0.5
1.7
3.0
5.
1U
nder
skill
0.5
1.6
3.2
5.2
Tota
l 27
.751
.121
.210
0,0
Tota
l 3
0.3
48.1
21.6
100,
0Pr
evio
us jo
bPr
evio
us jo
bSt
art j
obO
vers
kill
Mat
chsk
illU
nder
skill
Tota
lSt
art j
obO
vers
kill
Mat
chsk
illU
nder
skill
Tota
lO
vers
kill
14.6
11.4
1.7
27.
7O
vers
kill
17.4
11.2
1.7
30.3
Mat
chsk
ill
11.2
35.8
4.1
51.
1M
atch
skill
12
.032
.4 3
.748
.1U
nder
skill
5.4
10.7
5.1
21.
2U
nder
skill
6.2
10.2
5.2
21.6
Tota
l 3
1.2
57.9
10.9
100,
0To
tal
35.6
53.7
10.7
100,
0
SOU
RC
E: E
urop
ean
Skill
s and
Jobs
Sur
vey
(ESJ
S).

164 CUADERNOS ECONÓMICOS DE ICE N.O 95
Finally, in Table 4 we investigate the combination of qualification and skills mismatches. Since we do not have information about educational requirements in a previous job, we focus on two different moments in time: when the individual was hired and at the current job. We find that at the time of the hiring, the most prevalent groups are those who are matched in both dimensions (32.7 per cent), those who are matched in terms of qualification but overskilled (20.5 per cent), and those who are overkilled in both dimensions (15.7 per cent). Those figures are slightly different at the current job. The group with matched qualifications and skills still is the most frequent with a 30.6 per cent of the population. However, those with over or matched qualifications with over or matched skills are equally frequent. This latest finding suggests that workers are subject to new tasks requirements and changes in the type of tasks they must perform at their jobs. This idea is consistent with the evolution of the percentage of underskilled individuals. In both cases, at hiring and at the present time, the incidence of underqualifications and underskilling is low. There is an exception at present time. We find that the group of workers who are matched in terms of qualifications but who are underskilled is as large as the other groups with overskilled and overqualification (11.8 per cent). This observation might suggest that jobs requires tasks and skills that are beyond the skills and knowledge one may acquire through formal education and training.
TABLE 4JOINT INCIDENCE OF QUALIFICATION AND SKILL MISMATCHES
When hired Overqualified Matched UnderqualifiedOverskilled 15.7 20.5 4.5Matched 12.3 32.7 9.3Underskilled 1.3 2.7 1.1
Present time Overqualified Matched UnderqualifiedOverskilled 11.3 13.4 3.1Matched 12.3 30.6 8.1Underskilled 5.7 11.8 3.8
SOURCE: European Skills and Jobs Survey (ESJS).
4.2.2. Independent variables: Individual characteristics
In terms of individual characteristics, we consider the most common socio-economic variables used in the related literature (Xi in Equation 3). We define the dummy variable Female, which is coded 1 if the respondent is a woman. Forty-seven per cent of the sample are women. We also consider the respondent’s age (Age),

QUALIFICATION AND SKILL MISMATCHES... 165
TABLE 5 MAIN DESCRIPTIVE STATISTICS OF INDIVIDUAL CHARACTERISTICS
Mean St. Dev. Min MaxIndividual characteristics
Female 0.47 0.50 0 1Age 43.1 9.94 24 65Young (%) 0.40 0.49 0 1Middle (%) 0.44 0.50 0 1Old (%) 0.16 0.36 0 1
Live_own 0.16 0.37 0 1Live_children 0.39 0.49 0 1Education 4.77 1.22 1 7Lower-Secondary (%) 0.13 0.32 0 1Upper-Secondary (%) 0.39 0.46 0 1Post-Secondary (%) 0.11 0.31 0 1Tertiary (%) 0.37 0.50 0 1
Main activity before working forcurrent employerEmployed 0.65 0.47 0 1Self-employed 0.04 0.04 0 1Education 0.15 0.35 0 1Unemployed 0.12 0.33 0 1Notworking 0.04 0.19 0 1
Job characteristicsPrevious occupationFirstjob 0.08 0.34 0 1Same 0.13 0.34 0 1Similar 0.34 0.47 0 1Different 0.45 0.50 0 1
the sample average being 43. To better capture non-linear effects, we differentiate among three categories, Young, Middle and Old aged workers, depending on whether the respondent’s age lies between 24-39, 40-54 or 55-65, respectively. Young workers comprise 40 per cent of the sample, whereas middle-aged and old workers account for 44 per cent and 16 per cent of the sample, respectively. We also include information on whether the respondent lives by his/her own (Live_own) -about 16 per cent of the sample- and whether her children are still at home (Live_children)- about 39 per cent. The main descriptive statistics are reported in Table 5.7
7 Detailed figures by country are available upon request.
SOURCE: European Skills and Jobs Survey (ESJS).

166 CUADERNOS ECONÓMICOS DE ICE N.O 95
TABLE 5 (Cont.) MAIN DESCRIPTIVE STATISTICS OF INDIVIDUAL CHARACTERISTICS
Mean St. Dev. Min MaxType of organisationPrivate 0.65 0.48 0 1Public 0.25 0.43 0 1Not-for-profit 0.04 0.20 0 1Other 0.05 0.22 0 1
Full or part time employmentPart-time 0.19 0.39 0 1Full-time 0.82 0.39 0 1
Type of contractIndefinite/permanent 0.84 0.36 0 1Fixedterm/temporary 0.12 0.32 0 1Non-formal 0.02 0.15 0 1Other 0.01 0.10 0 1
Size of the firm1 to 9 0.20 0.40 0 110 to 49 0.27 0.44 0 150-99 0.13 0.33 0 1100-249 0.14 0.34 0 1250-499 0.09 0.28 0 1500 and over 0.18 0.39 0 1It varies 0.01 0.08 0 1
TenureLess than 1 year 0.10 0.30 0 1One year 0.03 0.17 0 12-5 years 0.27 0.44 0 16-10 years 0.23 0.42 0 111-15 years 0.15 0.36 0 1More than 15 years 0.22 0.41 0 1
How often your job involveNon-routine 0.60 0.49 0 1Learning 0.52 0.5 0 1Autonomy 0.70 0.46 0 1Team 0.72 0.45 0 1
SOURCE: European Skills and Jobs Survey (ESJS).
The average level of education (Education) is 4.8 (in a scale from 1 to 7). To assess the impact of schooling, we include a dummy variable for those whose maximum educational achievement is lower secondary education or less (Lower-Secondary), upper secondary (Upper-Secondary), post-secondary including pre-vocational or vocational education but not tertiary (Post-Secondary) and tertiary

QUALIFICATION AND SKILL MISMATCHES... 167
education (Tertiary). In our sample, the relative size of these groups is 13 per cent, 39 per cent, 11 per cent and 37 per cent, respectively.
To account for the effect of labour market transitions and worker background on the likelihood of mismatch, we incorporate in the analysis information on the worker’s situation before entering the current job. Specifically, we define five dummies to capture whether prior to the current job the individual was employed in another job (Employed, 65 per cent of the sample), self-employed (Self-employed, about 4 per cent), unemployed (Unemployed, some 12 per cent), receiving education or training (Education, about 15 per cent) or not working (Notworking, about 4 per cent).
4.2.3. Job characteristics
Changes in mismatch status can be due to changes occupation and tasks performed at the job. To account for this fact, we include controls for the respondent’s occupation before entering the current job. Specifically, we define 3 dummy variables to capture whether the previous occupation is the same as the current one (Same, 13 per cent of the sample), similar (Similar, 34 per cent) or different (Different, 45 per cent). Another variable captures whether the current job is the respondent’s first job (Firstjob, 8 per cent).
The model also includes controls for the type of organization (Private, Public, Non-profit and Other), the type of labour contract held by the individual (Full-time against Part-time) and the duration of it (Indefinite, Fixed term, Not formal and Other). Most individuals work in private firms (65 per cent), full-time (82 per cent) and have a permanent contract (84 per cent). Controls for firm size are also included. Almost 60 per cent of the sample works in firms with less than 100 workers. Another variable, Tenure, captures years at the firm. About 50 per cent of the sample workers has between 2 and 10 years of tenure. Finally, the ESJ asks individuals how often their job involves i) non-routine situations, ii) learning new things, iii) choosing yourself the way of proceeding and iv) work as a team. Since task variety and unpredictability can be associated with qualification and skills mismatches, we incorporate this information into the analysis. Specifically, we define four dummy variables capturing whether the described scenario occurs “usually” or “always”. The proportion of the sample usually or always involved in non-routine situations (Non-Routine), learning new things (Learning), choosing themselves how to proceed (Autonomy) and working as a team (Team) is 60 per cent, 52 per cent, 70 per cent and 72 per cent, respectively.
4.2.4. Country characteristics
We include variables reflecting macroeconomic fluctuations and both the demand for and supply of labour. It has been stated that larger shares of graduates entering the labour force will inevitably result in more overeducation (Livingstone, 1998).

168 CUADERNOS ECONÓMICOS DE ICE N.O 95
Therefore, we control for the number of students enrolled in tertiary education (%Tertiary). Moreover, to capture the orientation (general versus specific) of the educational system, we also account for the number of students enrolled in vocational programmes (%Vocational). We also include demand effects, as skill-biased technological change and an increasing supply of skilled workers may create its own demand. There is no presumption that the countries with an oversupply of skilled workers are exactly those with a relatively high share of skilled workers. To control for demand effects, we include the labour force shares of working females (%Females), part-time (%Parttime) and temporary (%Temporary) workers, the shares of employment in two sectors (%PublicAd for public administration and %Manufacturing for manufacturing sector), the unemployment rate (Unemp_rate) and the participation rate (Part_rate). As pointed out in Davia et al. (2017), variables such as the share of temporary and part-time workers should be included in the model to capture the effects of labour market flexibility on overqualification, on the basis that countries with higher employment shares of temporary and/or part-time workers are generally viewed as having an increased capacity to respond to labour market disequilibria.
In order to pick up the effects of skill biased technological change -which is generally associated with a shift in the relative demand away from high skilled to low skilled labour and in many countries a general hollowing out of mid-skilled occupations-, we also include the ratio of workers employed in professional occupations to workers in low-skilled occupations (Ratio) and the gross domestic expenditure on R&D (R&D). Finally, the stance of the business cycle influences the extent to which individuals manage to get a good match. During macroeconomic shocks employers change selection criteria for new hires, while existing employees are assigned to other tasks or fired. Furthermore, job search models predict that longer-than-expected search durations urge job seekers to accept a simple job and to continue pursuing a more suitable position while working (Dolado et al., 2009). In our model, the macroeconomic scenario is already captured by the unemployment rate and by the inclusion of GDP per capita (GDP).
5. Results
Given our descriptive results, among mismatches the most prevalent one corresponds to situations of overqualification and overskilling. For this reason, in this section we will focus the analysis of determinants in such type of mismatch.
5.1. Qualification mismatches
In Table 6 we examine the determinants of overqualification mismatches. As described in Section 3, Model 1 (the null model) does not include any explanatory variable and is used as a benchmark against which to compare the results. When

QUALIFICATION AND SKILL MISMATCHES... 169
TABL
E 6
ESTI
MAT
ION
RES
ULT
S
Ove
rqua
lifica
tion
to g
et th
e jo
bO
verq
ualifi
catio
n to
do
the
job
Ove
rski
lling
Mod
el 1
Mod
el 2
Mod
el 3
Mod
el 1
Mod
el 2
Mod
el 3
Mod
el 1
Mod
el 2
Mod
el 3
Ove
rski
ll_st
art
2.33
5***
2.33
4***
(0.0
31)
(0.0
31)
Ove
rski
ll_pr
ev0.
669*
**0.
668*
**(0
.028
)(0
.028
)In
divi
dual
cha
ract
erist
ics
Fem
ale
–0.0
68**
–0.0
69**
–0.0
67**
*–0
.068
***
–0.1
55**
*–0
.154
***
(0.0
27)
(0.0
27)
(0.0
26)
(0.0
26)
(0.0
27)
(0.0
27)
Age:
you
ng
Mid
lle a
ge0.
020
0.02
1–0
.022
–0.0
22–0
.071
**–0
.071
**(0
.030
)(0
.030
)(0
.029
)(0
.029
)(0
.030
)(0
.030
)O
ld a
ge–0
.059
–0.0
60–0
.144
***
–0.1
44**
*–0
.155
***
–0.1
56**
*(0
.045
)(0
.045
)(0
.044
)(0
.044
)(0
.045
)(0
.045
)Li
ve_o
wn
0.14
0***
0.14
1***
0.14
1***
0.14
1***
0.06
4*0.
062
(0.0
38)
(0.0
38)
(0.0
36)
(0.0
37)
(0.0
38)
(0.0
38)
Live
_chi
ldre
n–0
.047
*–0
.047
*–0
.064
**–0
.064
**–0
.070
**–0
.070
**(0
.029
)(0
.029
)(0
.028
)(0
.028
)(0
.028
)(0
.028
)Ed
ucat
ion:
Low
er-S
econ
dary
(ref
.)
Upp
er S
econ
dary
0.61
6***
0.61
5***
0.50
5***
0.50
3***
0.16
2***
0.16
2***
(0.0
52)
(0.0
52)
(0.0
50)
(0.0
50)
(0.0
47)
(0.0
47)
Post
Sec
onda
ry1.
626*
**1.
625*
**1.
541*
**1.
541*
**0.
172*
**0.
169*
**(0
.060
)(0
.060
)(0
.058
)(0
.058
)(0
.058
)(0
.058
)Te
rtiar
y1.
407*
**1.
407*
**1.
340*
**1.
339*
**0.
318*
**0.
318*
**(0
.051
)(0
.051
)(0
.049
)(0
.049
)(0
.047
)(0
.047
)
SOU
RC
E: E
urop
ean
Skill
s and
Jobs
Sur
vey
(ESJ
S).
NO
TE: *
** p
< 0
.01,
**
p <
0.05
, * p
< 0
.1.

170 CUADERNOS ECONÓMICOS DE ICE N.O 95
TABL
E 6
(Con
t.)ES
TIM
ATIO
N R
ESU
LTS
Ove
rqua
lifica
tion
to g
et th
e jo
bO
verq
ualifi
catio
n to
do
the
job
Ove
rski
lling
Mod
el 1
Mod
el 2
Mod
el 3
Mod
el 1
Mod
el 2
Mod
el 3
Mod
el 1
Mod
el 2
Mod
el 3
Prev
ious
stat
us: E
mpl
oyed
(ref
.)Se
lf-em
ploy
ed0.
116*
0.11
6*0.
012
0.01
20.
150*
*0.
152*
*(0
.063
)(0
.063
)(0
.062
)(0
.062
)(0
.064
)(0
.064
)Ed
ucat
ion
–0.0
68–0
.069
–0.1
22**
*–0
.123
***
0.06
40.
062
(0.0
47)
(0.0
47)
(0.0
45)
(0.0
45)
(0.0
45)
(0.0
45)
Une
mpl
oyed
0.
329*
**0.
329*
**0.
280*
**0.
280*
**0.
130*
**0.
127*
**(0
.039
)(0
.039
)(0
.038
)(0
.038
)(0
.041
)(0
.041
)N
otw
orki
ng0.
273*
**0.
271*
**0.
207*
**0.
206*
**0.
028
0.03
0(0
.068
)(0
.068
)(0
.067
)(0
.067
)(0
.072
)(0
.072
)Jo
b ch
arac
teri
stic
sPr
evio
us jo
b: F
irst
job
(ref
.)Sa
me
–0.2
00**
*–0
.201
***
–0.2
03**
*–0
.203
***
–0.0
59–0
.059
(0.0
68)
(0.0
68)
(0.0
66)
(0.0
66)
(0.0
66)
(0.0
66)
Sim
ilar
–0.2
32**
*–0
.234
***
–0.1
88**
*–0
.189
***
0.04
90.
047
(0.0
62)
(0.0
62)
(0.0
60)
(0.0
60)
(0.0
61)
(0.0
61)
Diff
eren
t0.
317*
**0.
315*
**0.
345*
**0.
343*
**0.
191*
**0.
190*
**(0
.060
)(0
.060
)(0
.058
)(0
.058
)(0
.059
)(0
.059
)C
ontr
act:
Inde
finite
/per
man
ent (
ref.)
Fixe
dter
m/te
mpo
rary
–0.2
40**
*–0
.239
***
–0.3
21**
*–0
.321
***
0.04
60.
046
(0.0
32)
(0.0
32)
(0.0
31)
(0.0
31)
(0.0
31)
(0.0
31)
Nof
orm
al–0
.387
***
–0.3
86**
*–0
.392
***
–0.3
92**
*–0
.115
*–0
.117
*(0
.070
)(0
.070
)(0
.067
)(0
.067
)(0
.069
)(0
.069
)O
ther
–0.0
10–0
.010
–0.0
07–0
.007
–0.0
63–0
.061
(0.0
61)
(0.0
61)
(0.0
59)
(0.0
59)
(0.0
62)
(0.0
61)
SOU
RC
E: E
urop
ean
skill
s and
jobs
surv
ey (E
SJS)
.N
OTE
: ***
p <
0.0
1, *
* p
< 0.
05, *
p <
0.1
.

QUALIFICATION AND SKILL MISMATCHES... 171
TABL
E 6
(Con
t.)ES
TIM
ATIO
N R
ESU
LTS
Ove
rqua
lifica
tion
to g
et th
e jo
bO
verq
ualifi
catio
n to
do
the
job
Ove
rski
lling
Mod
el 1
Mod
el 2
Mod
el 3
Mod
el 1
Mod
el 2
Mod
el 3
Mod
el 1
Mod
el 2
Mod
el 3
Part
-tim
e (r
ef.)
Full-
time
–0.3
18**
*–0
.320
***
–0.3
05**
*–0
.307
***
–0.1
37**
*–0
.133
***
(0.0
37)
(0.0
37)
(0.0
36)
(0.0
36)
(0.0
38)
(0.0
38)
Con
trac
t: An
inde
finite
/per
man
ent
cont
ract
(ref
.)
A fi
xed
term
/tem
pora
ry c
ontra
ct
0.07
0*0.
069*
0.06
30.
062
–0.0
37–0
.039
(0.0
42)
(0.0
42)
(0.0
40)
(0.0
40)
(0.0
43)
(0.0
43)
I do
not h
ave
a fo
rmal
con
tract
0.42
9***
0.43
1***
0.39
3***
0.39
4***
–0.0
54–0
.058
(0.0
75)
(0.0
75)
(0.0
74)
(0.0
74)
(0.0
82)
(0.0
82)
Oth
er
0.46
1***
0.45
9***
0.40
5***
0.40
4***
0.06
60.
064
(0.1
09)
(0.1
09)
(0.1
09)
(0.1
09)
(0.1
19)
(0.1
19)
Size
: 1-9
wor
kers
(ref
.)
10 to
49
wor
kers
–0.2
11**
*–0
.210
***
–0.1
88**
*–0
.188
***
0.05
60.
054
(0.0
36)
(0.0
36)
(0.0
36)
(0.0
36)
(0.0
38)
(0.0
38)
50 to
99
wor
kers
–0.2
09**
*–0
.208
***
–0.1
78**
*–0
.178
***
0.02
20.
019
(0.0
46)
(0.0
46)
(0.0
45)
(0.0
45)
(0.0
47)
(0.0
47)
100
to 2
49 w
orke
rs–0
.280
***
–0.2
78**
*–0
.202
***
–0.2
02**
*0.
052
0.04
9(0
.046
)(0
.046
)(0
.045
)(0
.045
)(0
.047
)(0
.047
)20
to 4
99 w
orke
rs–0
.387
***
–0.3
86**
*–0
.353
***
–0.3
53**
*0.
082
0.07
9(0
.056
)(0
.056
)(0
.054
)(0
.054
)(0
.055
)(0
.055
)
SOU
RC
E: E
urop
ean
skill
s and
jobs
surv
ey (E
SJS)
.N
OTE
: ***
p <
0.0
1, *
* p
< 0.
05, *
p <
0.1
.

172 CUADERNOS ECONÓMICOS DE ICE N.O 95
TABL
E 6
(Con
t.)ES
TIM
ATIO
N R
ESU
LTS
Ove
rqua
lifica
tion
to g
et th
e jo
bO
verq
ualifi
catio
n to
do
the
job
Ove
rski
lling
Mod
el 1
Mod
el 2
Mod
el 3
Mod
el 1
Mod
el 2
Mod
el 3
Mod
el 1
Mod
el 2
Mod
el 3
500
or m
ore
–0.3
24**
*–0
.323
***
–0.2
31**
*–0
.231
***
0.11
6**
0.11
2**
(0.0
45)
(0.0
45)
(0.0
44)
(0.0
44)
(0.0
45)
(0.0
45)
It va
ries
–0.0
27–0
.027
–0.1
07–0
.108
0.05
60.
054
(0.1
57)
(0.1
57)
(0.1
56)
(0.1
56)
(0.1
59)
(0.1
59)
Tenu
re: L
ess t
han
1 ye
ar (r
ef.)
One
yea
r–0
.052
–0.0
52–0
.106
–0.1
060.
032
0.03
2(0
.074
)(0
.074
)(0
.072
)(0
.072
)(0
.080
)(0
.080
)2
to 5
yea
rs–0
.098
**–0
.098
**–0
.154
***
–0.1
54**
*0.
137*
**0.
135*
**(0
.046
)(0
.046
)(0
.044
)(0
.044
)(0
.049
)(0
.049
)6
to 1
0 ye
ars
–0.1
42**
*–0
.141
***
–0.2
72**
*–0
.271
***
0.14
8***
0.14
6***
(0.0
49)
(0.0
49)
(0.0
48)
(0.0
48)
(0.0
52)
(0.0
52)
11 to
15
year
s–0
.391
***
–0.3
89**
*–0
.451
***
–0.4
49**
*0.
061
0.05
7(0
.056
)(0
.056
)(0
.054
)(0
.054
)(0
.058
)(0
.058
)M
ore
than
15
year
s–0
.619
***
–0.6
17**
*–0
.651
***
–0.6
50**
*0.
052
0.04
8(0
.057
)(0
.057
)(0
.055
)(0
.055
)(0
.058
)(0
.058
)H
ow o
ften
your
job
invo
lve
Non
-rut
ine
–0.1
21**
*–0
.121
***
–0.1
35**
*–0
.135
***
0.14
0***
0.14
0***
(0.0
28)
(0.0
28)
(0.0
27)
(0.0
27)
(0.0
28)
(0.0
28)
Lear
ning
–0.4
43**
*–0
.444
***
–0.4
81**
*–0
.481
***
–0.2
83**
*–0
.282
***
(0.0
28)
(0.0
28)
(0.0
27)
(0.0
27)
(0.0
28)
(0.0
28)
Aut
onom
y–0
.266
***
–0.2
67**
*–0
.294
***
-0.2
96**
*0.
096*
**0.
093*
**(0
.028
)(0
.028
)(0
.028
)(0
.028
)(0
.029
)(0
.029
)Te
am0.
025
0.02
5–0
.017
–0.0
17–0
.100
***
–0.1
00**
*(0
.029
)(0
.029
)(0
.028
)(0
.028
)(0
.029
)(0
.029
)
SOU
RC
E: E
urop
ean
skill
s and
jobs
surv
ey (E
SJS)
.N
OTE
: ***
p <
0.0
1, *
* p
< 0.
05, *
p <
0.1
.

QUALIFICATION AND SKILL MISMATCHES... 173
TABL
E 6
(Con
t.)ES
TIM
ATIO
N R
ESU
LTS
Ove
rqua
lifica
tion
to g
et th
e jo
bO
verq
ualifi
catio
n to
do
the
job
Ove
rski
lling
Mod
el 1
Mod
el 2
Mod
el 3
Mod
el 1
Mod
el 2
Mod
el 3
Mod
el 1
Mod
el 2
Mod
el 3
Cou
ntry
cha
ract
erist
ics
GD
P0.
016
0.00
60.
004
(0.0
20)
(0.0
19)
(0.0
12)
R&D
–0.0
000.
000
0.00
0(0
.001
)(0
.000
)(0
.000
)U
nem
p_ra
te–0
.045
–0.0
49*
–0.0
09(0
.028
)(0
.027
)(0
.017
)Pa
rt_r
ate
0.09
8**
0.09
2**
0.06
8**
(0.0
46)
(0.0
44)
(0.0
28)
%Te
rtia
ry0.
029
0.03
2*0.
003
(0.0
18)
(0.0
18)
(0.0
11)
%Fe
mal
es–0
.043
–0.0
49–0
.044
**(0
.034
)(0
.032
)(0
.021
)%
Man
ufac
turi
ng0.
037
0.05
4–0
.010
(0.0
38)
(0.0
36)
(0.0
23)
%Pa
rttim
e–0
.019
***
–0.0
21**
*–0
.003
(0.0
06)
(0.0
06)
(0.0
04)
%Pu
blic
Ad–0
.228
*–0
.199
0.06
8(0
.130
)(0
.124
)(0
.076
)%
Tem
pora
ry0.
011*
**0.
010*
**0.
002
(0.0
04)
(0.0
04)
(0.0
02)
SOU
RC
E: E
urop
ean
skill
s and
jobs
surv
ey (E
SJS)
.N
OTE
: ***
p <
0.0
1, *
* p
< 0.
05, *
p <
0.1
.

174 CUADERNOS ECONÓMICOS DE ICE N.O 95
TABL
E 6
(Con
t.)ES
TIM
ATIO
N R
ESU
LTS
Ove
rqua
lifica
tion
to g
et th
e jo
bO
verq
ualifi
catio
n to
do
the
job
Ove
rski
lling
Mod
el 1
Mod
el 2
Mod
el 3
Mod
el 1
Mod
el 2
Mod
el 3
Mod
el 1
Mod
el 2
Mod
el 3
%Vo
catio
nal
0.12
00.
092
0.05
7(0
.094
)(0
.090
)(0
.056
)Ra
tio–3
.081
**–2
.286
–0.4
63(1
.485
)(1
.423
)(0
.896
)C
onst
–1.1
63**
*–1
.093
***
–8.7
94**
–1.0
26**
*–0
.719
***
–9.1
66**
*–0
.554
***
–1.4
87**
*–2
987
(0.0
69)
(0.1
25)
–358
8(0
.066
)(0
.121
)–3
441
(0.0
72)
(0.1
08)
–215
4σ̂2 u j
0.12
9***
0.16
7***
0.08
6***
0.11
7***
0.15
8***
0.07
9***
0.14
0***
0.05
5***
0.02
7***
(0
.037
)(0
.046
)(0
.024
)(0
.033
)(0
.044
)(0
.022
)(0
.039
)(0
.017
)(0
.009
)V
PC3.
8%4.
8%2.
6%3.
4%4.
6%2.
3%4.
1%1.
6%0.
8%O
bser
vatio
ns
36,3
9736
,397
36,3
9736
,397
36,3
9736
,397
36,3
9736
,397
36,3
97N
umbe
r of g
roup
s28
2828
2828
2828
2828
SOU
RC
E: E
urop
ean
skill
s and
jobs
surv
ey (E
SJS)
.N
OTE
: ***
p <
0.0
1, *
* p
< 0.
05, *
p <
0.1
.
QUALIFICATION AND SKILL MISMATCHES... 175
it comes to qualifications to get the job, in the null model the estimated between-state variance is 0.129, whereas 3.8 per cent of the variation in overqualification is attributable to differences between countries (VPC). In the case of the qualifications to do the job, the estimated between-state variance and the VPC are slightly lower (0.117 and 3.4 per cent).
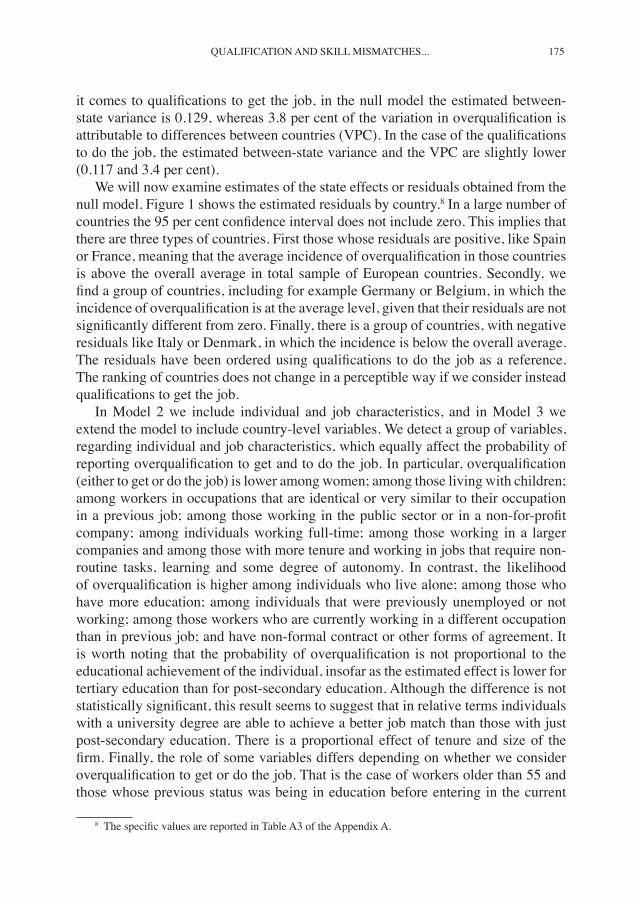
We will now examine estimates of the state effects or residuals obtained from the null model. Figure 1 shows the estimated residuals by country.8 In a large number of countries the 95 per cent confidence interval does not include zero. This implies that there are three types of countries. First those whose residuals are positive, like Spain or France, meaning that the average incidence of overqualification in those countries is above the overall average in total sample of European countries. Secondly, we find a group of countries, including for example Germany or Belgium, in which the incidence of overqualification is at the average level, given that their residuals are not significantly different from zero. Finally, there is a group of countries, with negative residuals like Italy or Denmark, in which the incidence is below the overall average. The residuals have been ordered using qualifications to do the job as a reference. The ranking of countries does not change in a perceptible way if we consider instead qualifications to get the job.
In Model 2 we include individual and job characteristics, and in Model 3 we extend the model to include country-level variables. We detect a group of variables, regarding individual and job characteristics, which equally affect the probability of reporting overqualification to get and to do the job. In particular, overqualification (either to get or do the job) is lower among women; among those living with children; among workers in occupations that are identical or very similar to their occupation in a previous job; among those working in the public sector or in a non-for-profit company; among individuals working full-time; among those working in a larger companies and among those with more tenure and working in jobs that require non-routine tasks, learning and some degree of autonomy. In contrast, the likelihood of overqualification is higher among individuals who live alone; among those who have more education; among individuals that were previously unemployed or not working; among those workers who are currently working in a different occupation than in previous job; and have non-formal contract or other forms of agreement. It is worth noting that the probability of overqualification is not proportional to the educational achievement of the individual, insofar as the estimated effect is lower for tertiary education than for post-secondary education. Although the difference is not statistically significant, this result seems to suggest that in relative terms individuals with a university degree are able to achieve a better job match than those with just post-secondary education. There is a proportional effect of tenure and size of the firm. Finally, the role of some variables differs depending on whether we consider overqualification to get or do the job. That is the case of workers older than 55 and those whose previous status was being in education before entering in the current
8 The specific values are reported in Table A3 of the Appendix A.

176 CUADERNOS ECONÓMICOS DE ICE N.O 95
job. They experience only a lower probability of being overqualified to do the job, but not to get it. Those workers who were self-employed before entering the current job faces a higher probability of being overqualified only to get the job.
Finally, in terms of country characteristics, we find that individuals in countries with a larger share of part-time jobs, a larger percentage of public servants and a higher ratio of professionals to low skill workers are less likely to report overqualification, whereas higher participation rates and shares of temporary contracts are associated positively with overqualification. We do not find relevant differences in terms of overqualification to get and to do the job, the exception being the unemployment rate. In the former case, the coefficient fails to be significant, whereas in the latter case it is negative and significant at the 10 per cent level.
Finally, we have some extra insight of this analysis. We have reported before, that in the null model (Model 1) there was an estimated between-state variance is 0.129, whereas 3.8 per cent of the variation in overqualification is attributable to differences between countries (VPC). Now, once we have controlled for individual, job and country characteristics, we observe that estimated variance goes down to 0.086, and the unexplained variation in overqualification has declined a 47 per cent in both types of overqualification. We observe that the driver of such a decline are the country characteristics and not the individual or job characteristics. In fact, this type of variables increases the VPC meaning that such features are not equally distributed among countries.
-1,2
-1,0
-0,8
-0,6
-0,4
-0,2
0,0
0,2
0,4
0,6
0,8
1,0
1,2
LU NL IT FI DK SE RO BG DE HR GR AT MT HU PT IE LV SI BE LT CZ PL CY ES SK EE UK FR
Overqualif_get Overqualif_do
FIGURE 1QUALIFICATION MISMATCHES (COUNTRY RESIDUALS AT NULL MODEL)
SOURCE: European skills and jobs survey (ESJS).NOTE: Austria (AT), Belgium (BE), Bulgaria (BG), Croatia (HR), Cyprus (CY), Czech Republic (CZ), Den-
mark (DK), Estonia (EE), Finland (FI), France (FR), Germany (DE), Greece (GR), Hungary (HU), Ireland (IE), Italy (IT), Latvia (LV), Lithuania (LT), Luxembourg (LU), Malta (MT), Netherlands (NL), Poland (PL), Portugal (PT), Romania (RO), Slovakia (SK), Slovenia (SI), Spain (ES), Sweden (SE) and United Kingdom (UK).

QUALIFICATION AND SKILL MISMATCHES... 177
Graphically these figures imply that the trend for residuals is flatter (see Figure 2 panels A and B)9 and the number of countries whose variation is aligned with the overall average increases. There is a group of four countries that remains to
-1,2
-1,0
-0,8
-0,6
-0,4
-0,2
0,0
0,2
0,4
0,6
0,8
1,0
1,2
LU NL FI RO IT HR LV PT MT HU GR BE SI BG SE DE AT CY CZ IE LT SK PL ES EE UK FR
Model 1 Model 3
DK
-1,2
-1,0
-0,8
-0,6
-0,4
-0,2
0,0
0,2
0,4
0,6
0,8
1,0
1,2
LT LV EE MT BG LU PT RO CZ HR BE FR HU SI IT DK SE CY SK NL PL FI IE ES DE AT GR UK
Model 1 Model 3
9 The specific values are reported in Table A3 of the Appendix A.
SOURCE: European skills and jobs survey (ESJS).NOTE: Austria (AT), Belgium (BE), Bulgaria (BG), Croatia (HR), Cyprus (CY), Czech Republic (CZ), Den-
mark (DK), Estonia (EE), Finland (FI), France (FR), Germany (DE), Greece (GR), Hungary (HU), Ireland (IE), Italy (IT), Latvia (LV), Lithuania (LT), Luxembourg (LU), Malta (MT), Netherlands (NL), Poland (PL), Portugal (PT), Romania (RO), Slovakia (SK), Slovenia (SI), Spain (ES), Sweden (SE) and United Kingdom (UK).
FIGURE 2OVERQUALIFICATION (COUNTRY RESIDUALS EVOLUTION)
Panel A. Overqualification to get the job
Panel B. Overqualification to do the job

178 CUADERNOS ECONÓMICOS DE ICE N.O 95
be above the average incidence of over-qualification even after controlling for all characteristics. They are Estonia, Slovakia, United Kingdom and France, possibly reflecting different labour and educational markets. On the contrary, Finland and Bulgaria remain to be below the overall average incidence. The case of Spain, like other countries like Poland or Belgium, shows that, a priori, the incidence of overqualification was above the overall average in Europe, but after controlling for different characteristics, the incidence is below the average.
5.2. Skill mismatches
We replicate the analysis for overskilling at the current job. As documented in Section 4.2.1, overskilling tends to be a self-perpetuating state and, therefore, a previous overskilling situation may have effects on the probability of current overskilling that go over and beyond the effects arising from personal, labour and country characteristics. To account for this fact, we include in the specification controls for overskilling at the start of the job and in a previous job.
In the null model (Model 1) we see that the estimated between-state variance is 0.140, and 4.1 per cent of the unexplained variation in overskilling is attributable to differences between countries (VPC). Note that those values are slightly larger than in the case of overqualification.
We find that the previous status in terms of overskilling exert a large and highly significant effect. The larger coefficient associated with overskilling at the start of the current job suggests that skills mismatches self-perpetuate, especially if a person remains in the same job. This finding confirms what we descriptively found in terms of transitions.
In terms of individual characteristics, we find that the likelihood of overskilling is lower among women, middle and old individuals, those living with children, working in a non-profit organization, working full-time and in jobs that require constant learning and team work. In contrast, the incidence of overskilling rises among individuals with more education, who previously were self-employed or unemployed, currently working in a different occupation than in the previous job, in large firms (more than 500 workers), with average tenure (6-15 years), and in jobs that require non-routine tasks and some degree of autonomy.
In terms of country characteristics, we find that individuals leaving in countries with a higher ratio of female workers and lower participation rate are less likely to report overskilling. This result indicates that factors that stimulate female participation may also simultaneously influence skills mismatches. We also find that, unlike in the case of qualification mismatches, the share of temporary and part-time workers is not significantly related with skills mismatches. Since these variables are a proxy of labour market flexibility, this observation seems to suggest that skills gaps occur regardless of structural labour market conditions. Finally, it is worth noting that labour market participation, a supply factor, consistently determines the two forms of mismatch.

QUALIFICATION AND SKILL MISMATCHES... 179
Once we controlled for individual, job and country characteristics, we observe that estimated variance goes down from 0.14 to 0.027. This effect is larger than in the case of overqualification. In particular, we find that the VPC goes from 4.1 to almost zero (0.8 per cent), which implies a higher decline than before. Note that in this case, the individual and job characteristics also contribute to this decline and almost equally than country characteristics.
Graphically, these figures imply that the trend for residuals is mostly flat (see Figure 3).10 Few countries are now presenting residuals different from zero. The case of United Kingdom again shows that, a priori, the incidence of overskilling was higher than the overall average, and that it also remains after controlling for all characteristics.
10 The specific values are reported in Table A3 of the Appendix A.
-1,2
-1,0
-0,8
-0,6
-0,4
-0,2
0,0
0,2
0,4
0,6
0,8
1,0
1,2
LT LV EE MT BG LU PT RO CZ HR BE FR HU SI IT DK SE CY SK NL PL FI IE ES DE AT GR UK
Model 1 Model 3
FIGURE 3OVERSKILLING TO DO THE JOB (COUNTRY RESIDUALS EVOLUTION)
SOURCE: European skills and jobs survey (ESJS).NOTE: Austria (AT), Belgium (BE), Bulgaria (BG), Croatia (HR), Cyprus (CY), Czech Republic (CZ), Den-
mark (DK), Estonia (EE), Finland (FI), France (FR), Germany (DE), Greece (GR), Hungary (HU), Ireland (IE), Italy (IT), Latvia (LV), Lithuania (LT), Luxembourg (LU), Malta (MT), Netherlands (NL), Poland (PL), Portugal (PT), Romania (RO), Slovakia (SK), Slovenia (SI), Spain (ES), Sweden (SE) and United Kingdom (UK).
180 CUADERNOS ECONÓMICOS DE ICE N.O 95
6. Conclusions and discussion
There is evidence that a large part of the working population is job mismatched in terms of qualifications and/or skills. However, overqualification and skill mismatches refer to quite different phenomena. Measures of overqualification may not capture the extent to which worker’s skills are utilized in employment and workers with excess qualifications may still lack skills that are necessary on the job. Moreover, the labour market consequences of these two distinct phenomena may differ. On top of that, overqualification is closely related to education achievement, while overskilling is more prone to capture work-related human capital.
Using the ESJ data set, we find that more than half of the population are matched not only in terms of qualification but also in terms of skills. Among those who are mismatched in terms of qualifications, two out of three are overqualified for the whole sample of workers and all of them are overqualified if we restrict to only tertiary educated workers. Therefore, the incidence of underqualification only arises when workers are less than tertiary educated. We find that there is no evidence of significant different patterns in the incidence of qualification mismatch to get the job and to do the job, meaning that we do not find evidence of credentialism, i.e., employers requesting a higher degree than needed at the time of hiring relative to what is the genuine qualification level of the job. In terms of those presenting skill mismatches, we find that overskilling is more prevalent at the current job than when starting the job, while for underskilling we find just the opposite. These patterns are suggestive of a process of on-the-job learning, whereby workers acquire and develop new skills at their jobs.
We have some information about transition among different skill mismatch statuses. Our data suggest that overskilling and being skill matched are absorbing states. In other words, these two phenomena are more permanent than temporary. Additionally, the more frequent transition for underskilling is to be skill matched, following by to be overskilled.
In terms of joint incidence of qualifications and skill mismatches, we find that population is concentrated among matched in both dimensions or having excess of both or a combination. The only exception arises at current job, since the group of workers who are matched in terms of qualifications but who are underskilled is as large as the other groups. This observation might suggest that jobs requires tasks and skills that are beyond the skills and knowledge one may acquire through formal education and training.
The analysis of the determinants of both overqualification and overskilling shows that it is worth exploring qualification and skills mismatches separately, for they are associated with different worker profiles and phenomena. There are many interesting differences between the individual and job determinants of overqualification and overskilling. Firstly, we find that the gender coefficient more than doubles when we switch from the determinants of overqualification to the determinants of overskilling, a result that suggests that gender is relatively more relevant to account for skills

QUALIFICATION AND SKILL MISMATCHES... 181
mismatches. Secondly, schooling is the most important factor behind qualification mismatches. However, it is only moderately associated with the likelihood of overskilling and, in this case, it is relatively less important than other factors. This result suggests that the skills acquired in formal education help but are not sufficient to meet the requirements of a job. Thirdly, while having worked in a similar occupation in the past reduces the chances of being currently overqualified, it does not significantly affect the probability of current overskilling. To put it different, when individuals switch between similar jobs, they tend to improve their match in terms of educational achievement but do not significantly improve their match in terms of skills. This result confirms the notion that new jobs are associated with new demands and requirements, regardless of the educational entry requirements. Fourthly, the type of job contract is unrelated with the likelihood of overskilling, whereas it influences largely the chances of being overqualified. This result suggests that skills mismatches are evenly spread across workers with very different backgrounds and engagements with their firms, whereas qualification mismatches are heavily concentrated among those with non-formal contracts. Fifthly, public jobs prevent individuals from being overqualified, whereas they are not significantly associated with the likelihood of overskilling. This result is probably due to the fact that in the public sector education is used as a screening device to assign individuals to mid and high-level jobs. However, jobs require skills and knowledge that are over and beyond those provided by formal education. Finally, we find that jobs that demand non-routine tasks are positively associated with the likelihood of skills mismatch, whereas they are associated with a better match in terms of schooling. We may deduce that high-level jobs, which require more creativity and problem-solving skills, are mostly taken by high-educated individuals who, therefore, end up in matched jobs. However, these workers experience skills shortages and knowledge gaps when they encounter the non-routine tasks associated with the job. In this respect, we find that team work helps to reduce skills shortage problems, whereas it does not significantly alter the chances of being overqualified.
Our findings concerning country characteristics also suggest the interest of the analysis of both mismatches. In the case of overqualification, results indicate that a number of factors appear to consistently influence cross-country variations. Variables such as the share of temporary and part-time workers were included in the model to capture the effects of labour market flexibility on overqualification on the basis that countries with higher employment shares of temporary and/or part-time workers are generally viewed as having an increased capacity to respond to labour market disequilibria. We find that the two variables are significant, although with opposite signs. We also find that, unlike in the case of qualification mismatches, the share of temporary and part-time workers is not significantly related with skills mismatches. Since these variables are a proxy of labour market flexibility, this observation seems to suggest that skills gaps occur regardless of structural labour market conditions.
Our results on the ratio of professionals to low-skilled workers can be reflecting that it is not clear how cycles affect different types of workers. For instance, cyclical

182 CUADERNOS ECONÓMICOS DE ICE N.O 95
fluctuations particularly affect newcomers on the labour market. Since most workers in our sample have labour market experience and permanent contracts, it is likely that only a small fraction of them is truly affected by macroeconomic fluctuations. Verhaest and Van der Velden (2013) state that the business cycle and the relative supply of educated workers are two important factors in explaining cross-country differences in overqualification. Graduates that enter the labour market during a recession and/or face fierce competition from other highly educated individuals are much more likely to be overeducated in their first job.
We do not find any effect of the share of female workers on overqualification, as in Davia (2017). However, our intuition is that the effect pointed out by those authors is that factors that stimulate female participation may also simultaneously influence mismatches. Their explanation is that labour markets that pro-actively pursue policies in the areas of childcare and family conciliation enable females to remain in the labour market without having to downgrade. But there is also evidence to suggest that women are more prone to accept mismatched jobs in exchange of other advantages, including job proximity, hours flexibility and job quality (McGoldrick and Robst, 1996). Our results seem to reflect that these two effects may be offsetting each other. However, for the case of overskilling, we find that individuals living in countries with a higher ratio of female workers and lower participation rate are less likely to report overskilling. This result indicates that the idea that factors that stimulate female participation may also simultaneously influence skill mismatches dominates the other effect of the willingness to accept any job by women.
Finally, the last difference among mismatches has to do with how various types of characteristics explain cross country variance of mismatch incidence. In particular, as for overqualification, only country characteristics help to explain this variance, whereas in the case of overskilling, both types of characteristics, individual and job together with country characteristics, equally help to reduce unexplained variance.
References
[1] ACOSTA-BALLESTEROS, J.; OSORNO DEL ROSAL, M. P. and RODRÍGUEZ-RODRÍGUEZ, O. M. (2018). «Overeducation of Young Workers in Spain: How Much Does the First Job Matter?». Social Indicators Research, 138 (1), 109-139.
[2] BAERT, S.; COCKX, B. and VERHAEST, D. (2013). «Overeducation at the start of the career: stepping stone or trap?». Labour Economics, 25, 123-140.
[3] BÁRCENA, E.; BUDRÍA, S. and MORO-EGIDO, A. I. (2012). «Skill mismatches and wages among European university graduates». Applied Economics Letters, 19 (15), 1471–1475.
[4] BARONE, C. and Ortiz, L. (2011). «Overeducation among European University Graduates: A Comparative Analysis of its Incidence and the Importance of Higher Education Differentiation». Higher Education, 61 (3), 325-337.
[5] BATTU, H. and Zakariya, Z. (2015). «Overskilling and Overeducation In Malaysia». Discussion Paper in Economics No. 15-20. University of Aberdeen and Centre for European Labour Market Research

QUALIFICATION AND SKILL MISMATCHES... 183
[6] BELFIELD, C. (2010). «Over-education: What influence does the workplace have?». Economics of Education Review, 29 (2), 236-245.
[7] BRYAN, M. L. and Jenkins, S. P. (2013). «Regression analysis of country effects using multilevel data: a cautionary tale». IZA Discussion Papers 7583. Institute for the Study of Labor (IZA).
[8] BUCHEL, F. and MERTENS, A. (2004). «Overeducation, Underducation, and the Theory of Career Mobility». Applied Economics, 36 (8), 803-816.
[9] BUDRÍA, S. and MORO-EGIDO, A. I. (2008). «Education, Over-education and Wage Inequality: Evidence for Spain». Economics of Education Review, 27, 332-341.
[10] BUDRÍA, S. and MORO-EGIDO, A. I. (2009). «The overeducation phenomenon in Europe». Revista Internacional de Sociología, 67 (2), 329-345.
[11] BUDRÍA, S. and Moro-Egido, A. I. (2014). «Overqualification, skill mismatches and wages in private sector employment in Europe». Technological and Economic Development of Economy, 2014, 20 (3), 457-483
[12] CEDEFOP (2015). «Skills, Qualifications and Jobs in the EU: The Making of a Perfect Match?: Evidence from Cedefop’s European Skills and Jobs Survey». Cedefop Reference Series 3072.
[13] CHEVALIER, A. (2003). «Measuring mismatch». Economica, 70, 509-531.[14] CONGREGADO, E.; Iglesias, J.; Millán, J. M. and Román, C. (2016). «Incidence,
Effects, Dynamics and Routes out of Overqualification in Europe: A Comprehensive Analysis Distinguishing by Employment Status, Applied Economics, 48(5), 411-445.
[15] DAVIA, M.; McGUINNES, S. and O’CONNELL, P. (2017). «Determinants of regional differences in rates of overeducation in Europe». Social Science Research, 63, 67-80.
[16] DEKKER, R.; de GRIP, A. and HEIJKE, H. (2002). «The effects of training and overeducation on career mobility in a segmented labour market». International Journal of Manpower, 23 (2), 106-125.
[17] DOLADO, J.; JANSEN, M. and JIMENO, J. (2009). «On-the-job search in a matching model with heterogeneous jobs and workers». Economic Journal, 119, 200-228.
[18] DOLTON, P. and VIGNOLES, A. (2000). «The Incidence and Effects of Over-education in the UK Graduate Labour Market». Economics of Education Review, 19, 179-198.
[19] EUROPEAN COMMISSION (2015). Measuring Skills Mismatch. European Commission Analytical Web Note 7/2015.
[20] FLISI, S.; GOGLIO, V.; MERONI, E.; RODRIGUES, M. and VERA-TOSCANO, E. (2014). Occupational mismatch in Europe: Understanding Overeducation and Overskilling for Policy Making, JRC Science and Policy Reports, European Commission, Luxemburg, ISSN 1831-9424.
[21] FREI, C. and SOUSA-POZA, A. (2012). «Overqualification: permanent or transitory?». Applied Economics, 44 (14), 1837-1847.
[22] GREEN, F. and ZHU, Y, (2010). «Overqualification, Job Dissatisfaction, and Increasing Dispersion in the Returns to Graduate Education». Oxford Economic Papers, 62 (4), 740-763.
[23] GREEN, F.; McINTOSH, S. and VIGNOLES, A. (2002). «The Utilization of Education and Skills: Evidence from Britain». The Manchester School, 70 (60), 792-811.
[24] GROOT, W. and VAN DEN BRINKS, H. (2000). «Education, Training, and Employability». Applied Economics, 32, 573-581.

184 CUADERNOS ECONÓMICOS DE ICE N.O 95
[25] ILO REPORT Skills mismatch in Europe, Statistics Brief September 2014International Labour Organization
[26] JOVANOVIC, B. (1979). «Job Matching and the Theory of Turnover». Journal of Political Economy, 87, 972-990.
[27] LIVINGSTONE, D. (1998). The Education-Jobs Gap: Under-employment or Economic Democracy. Oxford: Westview Press.
[28] MAHY, B.; RYCX, F. and VERMEYLEN, G. (2015). «Educational Mismatch and Firm Productivity: Do Skills, Technology and Uncertainty Matter?». De Economist, 163(2), 233-262.
[29] McGOLDRICK, K. and ROBST, J. (1996). «Gender Differences in Over-education: A Test of the Theory of Differential Over-qualification». American Economic Review AEA Conference. American Economic Association.
[30] McGOWAN, M. A. and ANDREWS, D. (2015). «Skill mismatch and public policy in OECD countries». Economics Department Working Papers No. 1210
[31] MAVROMARAS, K. and McGUINNESS, S. (2012). «Overskilling Dynamics and Education Pathways». Economics of Education Review, 31 (5), 619-628.
[32] MAVROMARAS, K.; McGUINNESS, S. and FOK, Y. K. (2009). «Assessing the incidence and wage effects of overskilling in the Australian labour market». Economic Record, 85(268), 60-72.
[33] MAVROMARAS, K.; McGUINNESS, S. and WOODEN, M. (2007). «Overskilling in the Australian Labour Market». Australian Economic Review, 40 (3), 307-312.
[34] MAVROMARAS, K.; McGUINNESS, S.; O’LEARY, N.; SLOANE, P. and WEI, Z. (2010). «Job Mismatches and Labour Market Outcomes: Panel Evidence on Australian University Graduates». IZA Working Paper 5083.
[35] MAVROMARAS, K.; McGUINNESS, S.; O’LEARY, N.; SLOANE, P. and FOK, Y. K. (2010). «The problem of overskilling in Australia and Britain». Manchester School, 78 (3), 219-241.
[36] MAVROMARAS, K.; Sloane, P. and WEI, Z. (2012). «The Role of Education Pathways in the Relationship between Job Mismatch, Wages and Job Satisfaction: A Panel Estimation Approach». Education Economics, 20 (3), 303-321.
[37] MAVROMARAS, K.; SLOANE, P. and WEI, Z. (2015). «The Scarring Effects of Unemployment, Low Pay and Skills Under-Utilization in Australia Compared». Applied Economics, 47 (23), 2413-2429.
[38] McGUINESS, S. (2003a). «Graduate overeducation as a sheepskin effect: evidence from Northern Ireland». Applied Economics, 35, 597-608.
[39] McGUINESS, S. (2003b). «University quality and labour market outcomes». Applied Economics, 35, 1943-1955.
[40] McGUINNESS, S. (2006). «Overeducation in the Labour Market». Journal of Economic Surveys, 20 (3), 387-418.
[41] McGUINNESS, S. and BENNETT, J (2007). «Overeducation and the Graduate Labour Market: A Quantile Regression Approach». Economics of Education Review, 26 (5), 521-531.
[42] McGUINNESS, S. and POULIAKAS, K. (2016). «Deconstructing Theories of Overeducation in Europe: A Wage Decomposition Approach». Discussion Paper No. 9698 February 2016 IZA.

QUALIFICATION AND SKILL MISMATCHES... 185
[43] McGUINNESS, S. and SLOANE, P. (2011). «Labour Market Mismatch among UK Graduates: An Analysis Using REFLEX Data». Economics of Education Review, 30 (1), 130-145.
[44] McGUINNESS, S. and WOODEN, M. (2009). «Overskilling, Job Insecurity and Career Mobility». Industrial Relations, 48 (2), 265-286.
[45] McGUINNESS, S.; BERGIN, A. and WHELAN, A. (2017a). «Overeducation in Europe: Trends, Convergence and Drivers». Iza Discussion Papers Series N. 10678.
[46] McGUINNESS, S.; POULIAKAS, K. and REDMOND, P. (2017b). «How Useful Is the Concept of Skills Mismatch?». IZA DP 10786.
[47] ORTIZ, L. and KUCEL, A. (2008). «Do Fields of Study Matter for Over-education?: The Cases of Spain and Germany». International Journal of Comparative Sociology, 49 (5), 305-327.
[48] PIPER, A. (2015). «Heaven Knows I’m Miserable Now: Overeducation and Reduced Life Satisfaction. Education Economics, 23(6), 677-692.
[49] QUINN, M. A. and RUBB, S. (2006). «Mexico’s Labor Market: The importance of education-occupation matching on wages and productivity in developing countries». Economics of Education Review, 25 (2), 147-156.
[50] RABE-HESKETH, S. and SKRONDAL, A. (2012). Multilevel and Longitudinal Modeling Using Stata (Third Edition). College Station, TX: Stata Press.
[51] SANCHEZ-SANCHEZ, N. and McGUINESS, S. (2015). «Decomposing the Impacts of Overeducation and Overskilling on Earnings and Job Satisfaction: An Analysis using REFLEX Data». Education Economics, 23 (4), 419-432.
[52] SATTINGER, M. (1993). «Assignment models of the distribution of earnings». Journal of Economic Literature, XXXI, 831-880.
[53] SPENCE, M. (1973). «Job market signaling». Quarterly Journal of Economics, 87 (3), 355-374.
[54] SUMMERFIELD, F. and THEODOSSIOU, I. (2017). «The effects of macroeconomic conditions at graduation on overeducation» Economic Inquiry, 55 (3), 1370-1387.
[55] VERHAEST, D. and OMEY, E. (2009). «Objective over-education and worker well-being: A shadow price approach». Journal of Economic Psychology, 30 (3), 469-481.
[56] VERHAEST, D. and OMEY, E. (2012). «Over-Education, Under-education and Earnings: Further evidence on the Importance of Ability and Measurement Bias». Journal of Labor Resources, 33, 76-90.
[57] VERHAEST, D. and VAN DER VELDEN, R. (2013). «Cross-country differences in graduate overeducation». European Sociological Review, 29 (3), 642-653.
[58] VERHAEST, D.; SCHATTEMAN, T. and VAN TRIER, W. (2015). «Overeducation in the Early Career of Secondary Education Graduates: An Analysis Using Sequence Techniques». Young, 23 (4), 336-356.

186 CUADERNOS ECONÓMICOS DE ICE N.O 95
APPENDIXTABLE A.1
INCIDENCE OF QUALIFICATION MISMATCHES BY COUNTRY
Country Matchqua-lif_get
Overqua-lif_get
Underqua-lif_get Country Matchqua-
lif_doOverqua-
lif_doUnderqua-
lif_doFR 0.42 0.37 0.22 PT 0.41 0.22 0.37PT 0.51 0.21 0.28 FR 0.43 0.38 0.20IE 0.51 0.27 0.22 IE 0.50 0.33 0.17EE 0.52 0.35 0.13 EE 0.50 0.36 0.14HR 0.52 0.40 0.08 UK 0.51 0.43 0.06IT 0.53 0.14 0.32 AT 0.52 0.36 0.12
UK 0.54 0.37 0.09 CZ 0.54 0.40 0.06CY 0.55 0.30 0.14 IT 0.54 0.19 0.27AT 0.57 0.30 0.13 HR 0.54 0.38 0.08CZ 0.57 0.36 0.06 CY 0.55 0.32 0.14LV 0.57 0.27 0.15 LV 0.56 0.28 0.16MT 0.57 0.19 0.24 SE 0.57 0.25 0.18LT 0.60 0.31 0.09 ES 0.57 0.29 0.14ES 0.60 0.26 0.14 LT 0.57 0.34 0.09SI 0.60 0.25 0.15 SI 0.57 0.28 0.15BE 0.60 0.23 0.16 MT 0.58 0.23 0.19SE 0.61 0.18 0.21 PL 0.58 0.27 0.15SK 0.61 0.30 0.09 DE 0.61 0.26 0.13PL 0.61 0.25 0.14 BE 0.61 0.23 0.16GR 0.64 0.22 0.14 GR 0.62 0.24 0.14FI 0.65 0.18 0.17 FI 0.63 0.21 0.16
HU 0.65 0.28 0.07 DK 0.63 0.22 0.15NL 0.66 0.14 0.20 SK 0.63 0.31 0.06DK 0.66 0.21 0.13 NL 0.64 0.14 0.22DE 0.69 0.19 0.11 BG 0.65 0.26 0.09BG 0.70 0.19 0.11 HU 0.65 0.29 0.05RO 0.70 0.19 0.11 RO 0.70 0.19 0.11LU 0.84 0.10 0.06 LU 0.80 0.14 0.07
SOURCE: European skills and jobs survey (ESJS).NOTE: Austria (AT), Belgium (BE), Bulgaria (BG), Croatia (HR), Cyprus (CY), Czech Republic (CZ), Den-
mark (DK), Estonia (EE), Finland (FI), France (FR), Germany (DE), Greece (GR), Hungary (HU), Ireland (IE), Italy (IT), Latvia (LV), Lithuania (LT), Luxembourg (LU), Malta (MT), Netherlands (NL), Poland (PL), Portugal (PT), Romania (RO), Slovakia (SK), Slovenia (SI), Spain (ES), Sweden (SE) and United Kingdom (UK).

QUALIFICATION AND SKILL MISMATCHES... 187
TABL
E A
.2IN
CID
ENC
E O
F SK
ILL
MIS
MAT
CH
ES B
Y C
OU
NTR
Y
Cur
rent
job
Star
ting
curr
ent j
obPr
evio
us jo
bC
ount
ryM
atch
skill
Ove
rski
llU
nder
skill
Cou
ntry
Mat
chsk
illO
vers
kill
Und
ersk
illC
ount
ryM
atch
skill
Ove
rski
llU
nder
skill
AT0.
410.
540.
05U
K0.
400.
380.
22AT
0.50
0.38
0.12
UK
0.44
0.52
0.05
IE0.
430.
300.
27G
R0.
510.
370.
11G
R0.
450.
490.
06FI
0.43
0.28
0.29
UK
0.53
0.38
0.09
IE0.
480.
440.
08AT
0.44
0.37
0.20
IE0.
540.
340.
12FI
0.49
0.41
0.10
GR
0.45
0.36
0.19
HR
0.54
0.37
0.09
DE
0.49
0.46
0.04
SK0.
450.
230.
32FI
0.55
0.30
0.15
SK0.
520.
420.
07C
Y0.
450.
270.
28ES
0.55
0.34
0.10
ES0.
530.
430.
04C
Z0.
460.
220.
32D
E0.
560.
340.
10C
Y0.
530.
400.
06LT
0.51
0.11
0.38
PL0.
570.
310.
13H
U0.
550.
380.
07EE
0.51
0.12
0.37
CZ
0.57
0.30
0.13
PL0.
550.
390.
05D
E0.
520.
310.
18C
Y0.
570.
280.
15C
Z0.
560.
360.
09ES
0.52
0.32
0.17
SK0.
580.
290.
13N
L0.
560.
390.
06PL
0.52
0.27
0.21
DK
0.58
0.29
0.12
SE0.
560.
370.
07FR
0.53
0.24
0.23
FR0.
580.
270.
15D
K0.
570.
380.
05D
K0.
530.
210.
26B
E0.
590.
300.
12H
R0.
580.
420.
01LV
0.53
0.10
0.36
MT
0.59
0.29
0.12
SI0.
590.
360.
05H
U0.
540.
260.
21IT
0.60
0.29
0.11
FR0.
600.
340.
06H
R0.
540.
270.
19N
L0.
610.
280.
11IT
0.61
0.35
0.04
BE
0.54
0.27
0.19
SI0.
620.
280.
10B
E0.
610.
340.
05SE
0.56
0.24
0.20
LT0.
640.
200.
16EE
0.63
0.23
0.14
IT0.
560.
240.
20H
U0.
640.
280.
08LU
0.66
0.31
0.03
BG
0.57
0.17
0.25
BG
0.65
0.26
0.09
BG
0.66
0.27
0.07
NL
0.58
0.23
0.18
SE0.
660.
260.
08M
T0.
670.
220.
11M
T0.
580.
110.
31EE
0.66
0.22
0.12
RO
0.68
0.26
0.06
RO
0.61
0.14
0.25
RO
0.69
0.19
0.12
LT0.
690.
200.
11SI
0.61
0.23
0.16
LV0.
710.
150.
14LV
0.69
0.21
0.10
PT0.
610.
170.
22PT
0.72
0.23
0.05
PT0.
710.
250.
03LU
0.71
0.18
0.11
LU0.
730.
180.
09
SOU
RC
E: E
urop
ean
skill
s and
jobs
surv
ey (E
SJS)
. N
OTE
: Aus
tria
(AT)
, Bel
gium
(BE)
, Bul
garia
(BG
), C
roat
ia (H
R),
Cyp
rus
(CY
), C
zech
Rep
ublic
(CZ)
, Den
mar
k (D
K),
Esto
nia
(EE)
, Fin
land
(FI)
, Fr
ance
(FR
), G
erm
any
(DE)
, Gre
ece (
GR
), H
unga
ry (H
U),
Irel
and
(IE)
, Ita
ly (I
T), L
atvi
a (LV
), Li
thua
nia (
LT),
Luxe
mbo
urg
(LU
), M
alta
(MT)
, Net
herla
nds
(NL)
, Pol
and
(PL)
, Por
tuga
l (PT
), R
oman
ia (R
O),
Slov
akia
(SK
), Sl
oven
ia (S
I), S
pain
(ES)
, Sw
eden
(SE)
and
Uni
ted
Kin
gdom
(UK
).

188 CUADERNOS ECONÓMICOS DE ICE N.O 95
TABLE A3RESIDUALS BY COUNTRY
Null Model (Model 1) Full Model (Model 3)Overqua-
lif_doOverqua-
lif_getOver-
skillingOverqua-
lif_doOverqua-
lif_getOver-
skillingLU –0.81 –0.95 –0.28 –0.23 –0.22 –0.05
(0.13) (0.15) (0.10) (0.15) (0.13) (0.10)NL –0.60 –0.52 0.20 –0.05 –0.16 0.04
(0.08) (0.08) (0.06) (0.08) (0.08) (0.07)DK –0.34 –0.31 0.07 0.21 0.16 –0.06
(0.09) (0.09) (0.08) (0.10) (0.09) (0.08)FI –0.28 –0.33 0.23 –0.42 –0.41 0.00
(0.06) (0.06) (0.05) (0.06) (0.06) (0.06)RO –0.28 –0.19 –0.25 0.02 –0.04 0.14
(0.07) (0.07) (0.06) (0.07) (0.07) (0.07)IT –0.25 –0.38 0.05 0.01 0.14 –0.05
(0.05) (0.05) (0.04) (0.06) (0.05) (0.05)HR –0.24 –0.11 –0.09 0.23 0.22 0.03
(0.08) (0.08) (0.07) (0.09) (0.09) (0.08)LV –0.16 0.00 –0.66 –0.35 –0.43 –0.15
(0.08) (0.08) (0.08) (0.08) (0.08) (0.08)PT –0.14 –0.02 –0.25 –0.08 –0.09 –0.10
(0.07) (0.07) (0.06) (0.07) (0.07) (0.07)HU –0.09 –0.03 0.00 0.17 0.17 0.11
(0.07) (0.07) (0.06) (0.07) (0.07) (0.07)MT –0.09 –0.03 –0.60 –0.09 –0.13 –0.33
(0.11) (0.11) (0.11) 0.12 (0.11) (0.10)GR –0.07 –0.08 0.59 –0.02 –0.03 0.08
(0.06) (0.06) (0.05) (0.06) (0.06) (0.06)BE –0.07 0.06 –0.03 –0.15 –0.35 –0.22
(0.07) (0.07) (0.06) (0.07) (0.07) (0.07)SI 0.00 0.01 0.03 –0.16 –0.09 0.13
(0.08) (0.08) (0.08) (0.09) (0.09) (0.08)BG 0.01 –0.18 –0.38 –0.34 –0.08 –0.06
(0.08) (0.08) (0.08) (0.08) (0.08) (0.08)SE 0.02 –0.22 0.11 –0.16 –0.07 –0.08
(0.08) (0.09) (0.07) (0.09) (0.08) (0.08)DE 0.06 –0.12 0.43 –0.02 0.01 –0.02
(0.04) (0.04) (0.04) (0.04) (0.04) (0.04)AT 0.09 –0.05 0.54 0.04 0.05 0.24
(0.08) (0.08) (0.07) (0.09) (0.08) (0.08)CY 0.12 0.27 0.17 0.20 0.09 0.19
(0.11) (0.11) (0.10) (0.11) (0.11) (0.10)CZ 0.16 0.21 –0.16 –0.04 –0.08 –0.06
(0.06) (0.06) (0.06) (0.07) (0.07) (0.07)IE 0.18 –0.01 0.33 –0.15 0.02 0.18
(0.08) (0.08) (0.07) (0.08) (0.08) (0.08)LT 0.19 0.21 –0.72 –0.10 –0.08 –0.14
(0.08) (0.08) (0.08) (0.08) (0.08) (0.08)SK 0.21 0.30 0.17 0.15 0.12 0.24
(0.08) (0.08) (0.07) (0.08) (0.08) (0.08)PL 0.22 0.23 0.20 –0.28 –0.25 0.12
(0.04) (0.04) (0.04) (0.04) (0.04) (0.04)ES 0.27 0.30 0.37 –0.10 –0.10 –0.21
(0.04) (0.04) (0.04) (0.04) (0.04) (0.04)EE 0.32 0.43 –0.65 0.16 0.13 –0.17
(0.08) (0.08) (0.08) (0.08) (0.08) (0.08)UK 0.73 0.58 0.61 0.50 0.66 0.24
(0.04) (0.04) (0.04) (0.04) (0.04) (0.04)FR 0.85 0.92 –0.03 1.05 0.88 –0.05
(0.04) (0.04) (0.04) (0.04) (0.04) (0.05)SOURCE: European skills and jobs survey (ESJS)