Embed Size (px)
Citation preview

QoS AWARE MAC LAYER SCHEDULING IN LTE
White Paper
2 | P a g e Mymo Wireless Technology Pvt Ltd
Introduction: In this paper we have developed scheduling algorithms for the 3GPP LTE networks that can meet the
quality of service requirements for the multimedia traffic of a user. Our objective is to not only achieve
radio resource utilization but also guarantee the traffic requirements.
To ensure the competitiveness of UMTS for the coming years, the concept of UMTS long term evolution
has been introduced (LTE) in 3GPP. As per the specifications, LTE targets to provide a maximum of 100
Mbps downlink and 50 Mbps uplink speed when using a bandwidth of 20 MHz. Other than this, the
primary LTE requirements include scalable bandwidth of 5,10,1,5,20 MHz, also bandwidth of less than 5
MHz shall be supported for more flexibility, interworking with the existing UTRAN/GERAN systems and
non 3GPP systems shall be ensured. In existing CDMA and WCDMA based cellular systems, the voice
service is still provided with circuit-switched technique, however LTE is an all-IP system, meaning that
all the services including voice will be provided using packet-switching techniques. The downlink
transmission scheme for LTE is based on OFDM (Orthogonal Frequency Division Multiplexing), wherein
the available spectrum is split into several subcarriers and each of the subcarriers are modulated
independently by a stream of data. For uplink transmission, LTE uses SC-FDM (Special carrier frequency
division multiplexing) which has better peak to average power ratio as compared to an OFDMA signal.
The 3GPP long term evolution networks dubbed as the future of the next generation networks aims to
provide various mobile multimedia services with enhanced performances in terms of high data rate, low
latency and packet optimized radio access technology The increasing demand for a host of multimedia
services in the LTE networks presents a challenge for ensuring the QoS (quality of service) to a user. The
unit of transmission resources in a LTE network is the resource block. The scheduling algorithm run by
the MAC (Media access control) layer which decides the allocation of the resource blocks to individual
UEs can significantly affect the QoS for each user. The most important of these services is the VoIP
which puts a stern restriction on the end to end delay and the packet loss rate. Another type of traffic
which is the non real time video though with a variable bit rate has a less stringent requirement on its
delay performance. So, there is a need for scheduling these services not only based on user channel
states but also on the user services. This paper presents some algorithms for the MAC layer scheduling
that meets the requirement of these services in a multi user scenario and their relative performance
has been compared based on simulations.
In the following sections, we explain the resource block structure and characteristics, the different QoS
classes that are to be taken into account during scheduling. Downlink transmission is the main target in
the paper.
Frame structure:
For FDD mode, the frame structure of LTE is defined as the following. Each frame is of 10 ms equally
divided into 20 slots of 0.5 ms each, wherein a pair of consecutive slots is termed as subframe, i.e. each
subframe is of 1ms. So, one radio frame consists of 10 subframes. The subcarriers in LTE have a constant
spacing of ∆f=15KHz. In the frequency domain, 12 subcarriers form one resource block, and on time

3 | P a g e Mymo Wireless Technology Pvt Ltd
scale 0.5 ms.Each resource block in turn is a representation of 6 or 7 OFDM symbols, depending on
whether extended or normal cyclic prefix is extended.
The OFDM technique used in downlink transmission by base station, eNodeB allows data symbols to be
independently modulated and transmitted over a large number of closely spaced orthogonal
subcarriers. In LTE, downlink modulation schemes QPSK, 16QAM and 64QAM are available. In the time
domain, a guard symbol is added to each symbol to combat inter-OFDM-symbol-interference due to
channel delay spread. This guard interval is a cyclic prefix which is inserted prior to each OFDM symbol.
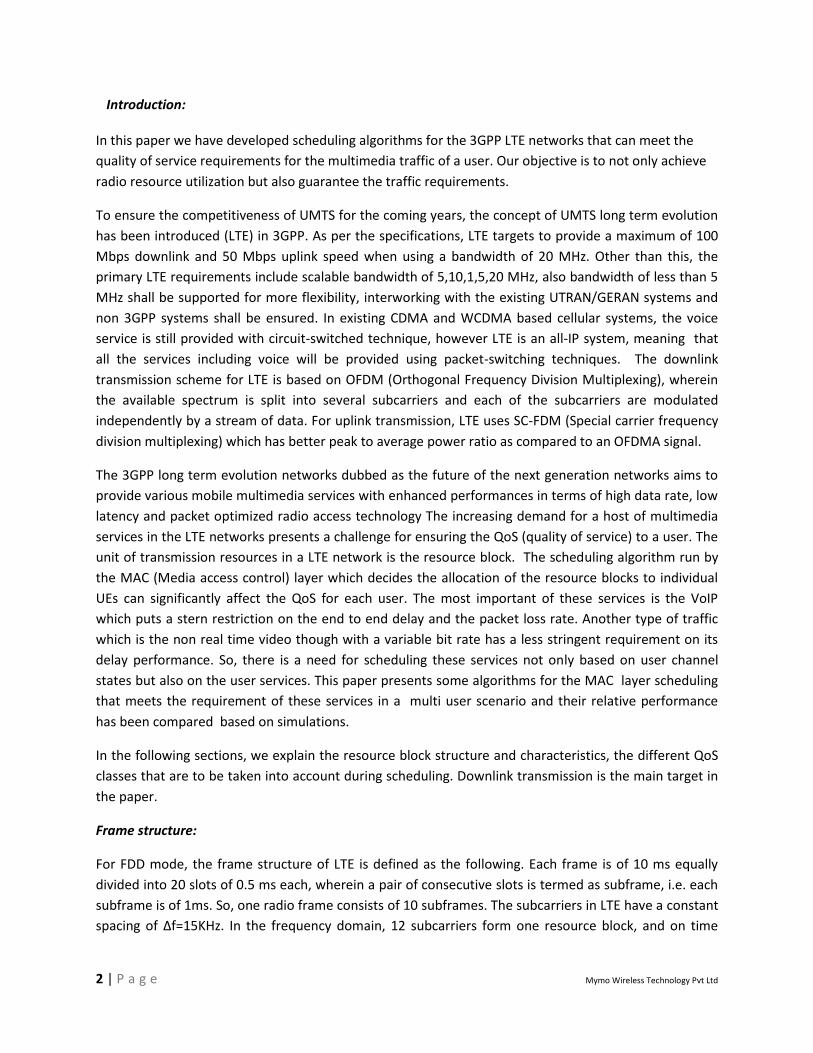
The transmission unit in LTE networks is a Resource Block which has both time and frequency
components. Each UE is assigned blocks depending upon its requirements. Note that control channels
like PDCCH etc. have not been shown in the figure [] but have been included in the simulation.
Resource Block Diagram
A user is allotted a
minimum chunk of 6
resource blocks
Freq
uen
cy (
ban
dw
idth
of
3 M
Hz)
UE 1
UE 2
UE 3
4 | P a g e Mymo Wireless Technology Pvt Ltd
Data is allocated to the UEs in terms of resource blocks i.e. one UE can be allocated integer multiples of
one resource block in the frequency domain. As per the 3GPP standards [], a UE is to be assigned in
multiples of 6 resource blocks. Four our case, we define this chunk as a collection 3 resource blocks
separated by 0.5 ms. In the time domain, the scheduling decision can be made after every 1ms. The
scheduling decision is done by eNodeB. The downlink MAC scheduler determines the number of
resource blocks to be allotted to each UE at every Transmission time Interval (TTI) which is typically of
1ms. From now onwards we will be using the term resource block for the actual collection of six
resource blocks.
Channel Feedback:
The wireless channel environment between the base station (eNodeB) and the user mobile terminals is
responsible for determining the amount of data bits that can be carried by one resource block because
LTE uses Adaptive Modulation and Coding (AMC) which changes them and coding schemes as per the
changing environment. The channel feedback is fed by each UE to the eNodeB in terms of the Channel
Quality Indicator value (CQI) which is the range of 0-15. This mapping from the received SINR to the CQI
value is based on minimizing the received error probability. For example, a CQI value of 15 indicates an
excellent channel and hence a higher modulation and coding rate, i.e more bits/user could be sent.
Each user gives a feedback of 15 integer values representing the channel strength in the corresponding
frequency bands. The feedback delay in our case is assumed to be 10ms, which is still a good
representation of a slow fading channel. Depending on the number of the resource blocks allocated to a
user, its current modulation and coding order can be set as minimum value of the CQI values received
previously for those resource blocks. This could decrease the capacity of the RB’s but will ensure lower
probability of error.
Quality of Service:
The concept of QoS has been developed to ensure a quality to the services provided to a user. This has
recently gained importance due to the IP based model of traffic switching in almost all the current
networks. Real time voice and video are examples of services that require a certain bandwidth to be
delivered without much delay. In order to distinguish the types of traffic and treat them in accordance
with a predefined QoS policy, each Service Data Flow (SDF) is associated with one and only one QoS
Class Identifier (QCI). The QCI is scalar that is used as a reference to node specific parameters that
control packet forwarding treatment (e.g. scheduling weights, admission thresholds, queue
management thresholds, link layer protocol configuration, etc.) by the eNodeB. According to [3], the
1 ms 10 ms
Time (One frame of 10ms)

5 | P a g e Mymo Wireless Technology Pvt Ltd
standardized QCI parameters are: Resource Type (GBR or Non-GBR),Priority, Packet Delay Budget and
Packet Error Loss Rate. And the The one-to-one mapping of standardized QCI values to standardized
characteristics is given in [3].
QCI Resource Type
Priority Packet Delay
Budget (NOTE 1)
Packet Error Loss Rate
(NOTE 2)
Example Services
1
2 100 ms 10-2
Conversational Voice
2
GBR
4 150 ms 10-3
Conversational Video (Live Streaming)
3
3 50 ms 10-3
Real Time Gaming
4
5 300 ms 10-6
Non-Conversational Video (Buffered Streaming)
5
1 100 ms 10-6
IMS Signalling
6
6
300 ms
10-6
Video (Buffered Streaming) TCP-based (e.g., www, e-mail, chat, ftp, p2p file sharing, progressive video, etc.)
7
Non-GBR 7
100 ms
10-3
Voice, Video (Live Streaming) Interactive Gaming
8
8
300 ms
10-6
Video (Buffered Streaming) TCP-based (e.g., www, e-mail, chat, ftp, p2p file
9
9 sharing, progressive video, etc.)
User Traffic:
The users in the simulations act by the same scheme of events, i.e. they all engage in a multi-media
communication session. This has been done to make capacity and performance analysis more easily
accomplishable. The IP traffic generated in this session is mixed and consists of data originating from
different types of services. The following are the two traffic types produced by each user: VoIP traffic
for a voice conversation and a real-time video traffic. Since we are considering the D/L scenario, there
are queues for each of these services at the eNodeB. We assume that eNodeBs have separate
transmission queues for each voice and video for each UE. For simplicity the queue capacity has been
considered to be very large and there is no admission control at higher levels. Also since we only assume
a MAC and a PHY layer, the SDU’s generated have raw data along with the MAC layer payload like CRC
bits etc. Thus we can say that the task of MAC scheduler is resource block allotment to the transmission
queues. By doing it this way, QoS provision as per different traffic types becomes simple.

6 | P a g e Mymo Wireless Technology Pvt Ltd
VoIP model:
Voice activity for different UEs is modeled using a two state Markov Model. The probability of a user
transitioning from an off state(0) to on state(1) is given by P01 and the probability of transition from 1 to
0 is given by P10. Voice activity factor is defined as the probability that a user is in on state which is given
by ⋋= P01 /(P01 + P10 )
For the simulations, transition probabilities are set such that voice activity factor of 0.32 is obtained. The
following values probabilities are used :
P01 = 0.01 P10 = 0.0215 P11 = 0.9785 P00 = 0.99
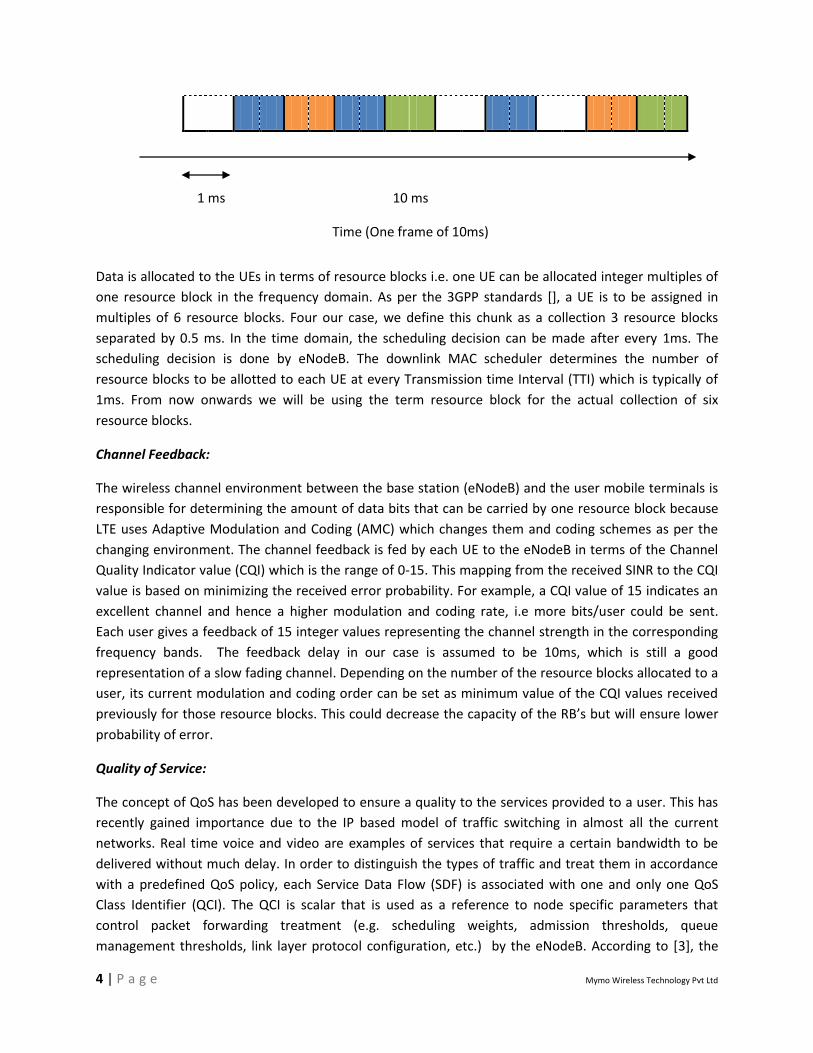
The speech model is updated at the voice encoder frame rate. For an AMR voice encoder, the update
interval is 20ms. Further, speech frames are created by the AMR encoder are encapsulated by various
headers to create VoIP packets. The following table gives details on the assumed header sizes and
ultimately the payload size of each VoIP packet.
Data Type
Full rate
(12.2 kbps)
SID
AMR payload
(bits)
248 40
7 | P a g e Mymo Wireless Technology Pvt Ltd
AMR full rate VoIP user typically generates a new 39
byte voice packet every 20 ms along with the associated
headers when in voice active state or, a 13 byte silence
descriptor (SID) packet every 160ms in voice inactive state
Using the steady state equation: Πp=p would yield P0 = and P1 =
Mean Bit Rate i.e. the average bits every 20 ms can be defined as the expectation value of the packet
size at steady state.
Mean bits/20 ms = E[Packet size] /20 ms
= ((P0X + P1X 39 ) X 8) /20 ms = 0.0054 Mbps
RTP/UDP/IP
Header (bits)
24 24
PDCP header
(bits)
16 16
RLC Header
(bits)
8 8
CRC/UEID
(bits)
16 16
VoIP packet
(Bytes)
39 13

8 | P a g e Mymo Wireless Technology Pvt Ltd
So, the mean bit rate in steady state for each user is 54 bits in 10ms. Note that other traffic associated
with a VoIP call like SIP signaling and presence traffic, though very important has been neglected in our
throughput analysis. Also note the absence of RTCP and ROHC packets.
Video model:
The real time video model used in our simulation describes the steady state of video streaming traffic
from the network as seen by the base station without considering the latency of starting up the calls.
A video streaming session is defined as the entire video streaming call time, which is equal to the
simulation time for this model. Each frame of video data arrives at a regular interval T determined by
the number of frames per second (fps). Each frame is decomposed into a fixed number of slices, each
transmitted as a single packet. The size of these packets/slices is distributed as a truncated Pareto.
Encoding delay, Dc, at the video encoder introduces delay intervals between the packets of a frame.
These intervals are modeled by a truncated Pareto distribution. Thus each video frame has 8 slices
which are treated as packets.
Using a source video rate of 64 kbps, the video traffic model parameters are defined in the following
table:
Table - Video Streaming Traffic Model Parameters [2]
Information types
Inter-arrival time between the beginning of each frame
Number of packets (slices)
in a frame
Packet (slice) size Inter-arrival time between packets (slices) in a frame
Distribution Deterministic (Based on 10fps)
Deterministic Truncated Pareto (Mean= 100bytes, Max= 250bytes)
Truncated Pareto (Mean= 6ms, Max=
12.5ms)
Distribution Parameters
100ms 8 K = 40bytes
= 1.2
K = 2.5ms
= 1.2
Physical Model :
The physical model that we used as a test bed for our simulations considering downlink scenario
constituted one eNodeB and multiple UEs. We used multiuser Single input single output system. The LTE
downlink physical resource can be represented by a time-frequency resource grid in which each
resource element corresponds to one OFDM subcarrier over one OFDM symbol interval. These resource
elements are grouped into resource blocks that consists of six or seven OFDM symbols and twelve
consecutive subcarriers corresponding to a nominal resource block bandwidth of 180 KHz. This allows
for a very flexible resource allocation in a multi-user scenario. The user data is generated depending
upon the previous Acknowledgment (ACK) signal. If previous user data transfer block (TB) was not
acknowledged, the stored TB is retransmitted using a Hybrid Automatic repeat request (HARQ) scheme.
9 | P a g e Mymo Wireless Technology Pvt Ltd
Then a Cyclic redundancy Check (CRC) is calculated and appended to each user’s TB. The data of each
user is independently encoded using a turbo encoder with Quadrature permutation Polynomial (QPP)-
based interleaving. Each block of coded bits is then interleaved and rate is matched with a target rate
depending upon the received Channel quality Index (CQI) user feedback. The rate matching process
already includes the HARQ. The encoding process is followed by the data modulation which maps the
channel-encoded TB to complex modulating symbols. Depending on the CQI, a modulation scheme is
selected for the corresponding resource block, which could be 4-QAM, 16-QAM and 64-QAM for
Downlink Shared Channel (DL-SCH).The channel model used is a PedB channel model with variable SNR.
Each UE receives the signal transmitted by the eNodeB and performs the reverse physical layer
processing of the transmitter.
Scheduling:
The basic time unit in LTE network, known as a subframe or Time Transmission Interval (TTI) is 1ms.
Improved over the HSDPA TTI of 2ms (UMTS Release-5), a smaller subframe means more robust
downlink scheduling by the eNodeB which is done every TTI. The MAC scheduler in an access network
has been known to perform better when cross layer information is available []. Here also we assume
that the QCI parameters for each service flow are available to the MAC layer. So the scheduling policy
not only has to consider the user channel states but also the service classes for a user and thus improve
radio resource utilization.
For overall system optimization, resource block allocation for both uplink and downlink should be
considered jointly. However, in a TDD mode we can consider them separately (neglecting the boundary
between the uplink and downlink). We develop scheduling schemes based on a basic principle. Since the
real time services are delay sensitive, the eNodeB will try to satisfy them first within a subframe. As
defined above these services also require a GBR support along with a packet delay budget. We claim
that by scheduling this traffic first we provide the best possible solution that can meet their QoS
requirements. These services could be VoIP traffic or live video traffic. Once the allocation to these users
is done, we proceed to satisfy the next class of traffic that is of lower priority and is more delay tolerant.
It could be buffered video or simple data traffic like email, ftp etc (TCP based). Apart from considering
the user service classes, we also have the input of channel states of each user. Our algorithms will
combine these two inputs to achieve the goal of meeting the QoS requirements of users.
The rationale behind the described scheme is based purely on the the predicted service mix in the next
generation networks. It is estimated that nearly 70% of all services in the LTE network will be VoIP,
around 20 % for data traffic and the rest by video. Given this scenario, it is obvious to give priority to
VoIP users over others to achieve maximum user satisfaction. Though the VoIP traffic may be non
intensive, it still puts a stringent condition on the frame delay and thereby occupying a high priority.
Video could be made of different classes, it may be an intensive live teleconferencing traffic or a non
buffered streaming based. Here we assume that the former would be treated in the same fashion as
VoIP while the latter could come next but above the best effort services like HTTP etc.

10 | P a g e Mymo Wireless Technology Pvt Ltd
In the following sections we formulate an optimization problem for allocation of resources to different
UEs. Thereafter, algorithms have been provided to solve this problem.
Problem Formulation:
Let I be the number of users and J be the number of Resource Blocks in one TTI. Pi (t) be the VoIP
demand of user i at time t, similarly Ei (t) be the Video demand of user i at time t.
We define a matrix alloc such that
alloc (i,j)
Ωi = current adaptive modulation coding index for user i
υij = channel feedback of AMC index of jth RB for user i
Nij = capacity of a jth RB of user i (which will depend on current channel state but has been calculated on
basis of previous channel state feedback values)
Where
Objective Minimize
Subject to:
A number of approaches could be used to solve this discrete optimization problem including linear
programming (once the objective is formulated as linear function). However given that the scheduling is
done every 1ms, the complexity for solving this optimization problem will rise exponentially as the
number of users and the number of RB’s per TTI become large. So in order to provide real time on line
solution we adopt a heuristic algorithm that performs close to the optimal solution [4]. The performance
of this scheme has been compared with the basic round robin allocation.
The objective function defined above is merely for throughput optimization and fails to take into
account the QoS requirements of individual service. Expressing these restrictions mathematically is not
feasible and neither is solving them. So instead of increasing the complexity of the scheduler, we adopt
a sub optimal approach of dividing the user services into classes and then applying the heuristic
algorithm on them. This would imply that we will first try to satisfy the VoIP demand of users and once
11 | P a g e Mymo Wireless Technology Pvt Ltd
this demand is met for all users, we proceed to meet their video demand and so on. The approach
described above is very intuitive but we maintain that such a scheme will indeed satisfy the QoS
requirements for most of the services. By allocating the VoIP traffic first to the best resource blocks, we
inherently give the best possible service to the VoIP users who are the largest constituent of the overall
traffic.
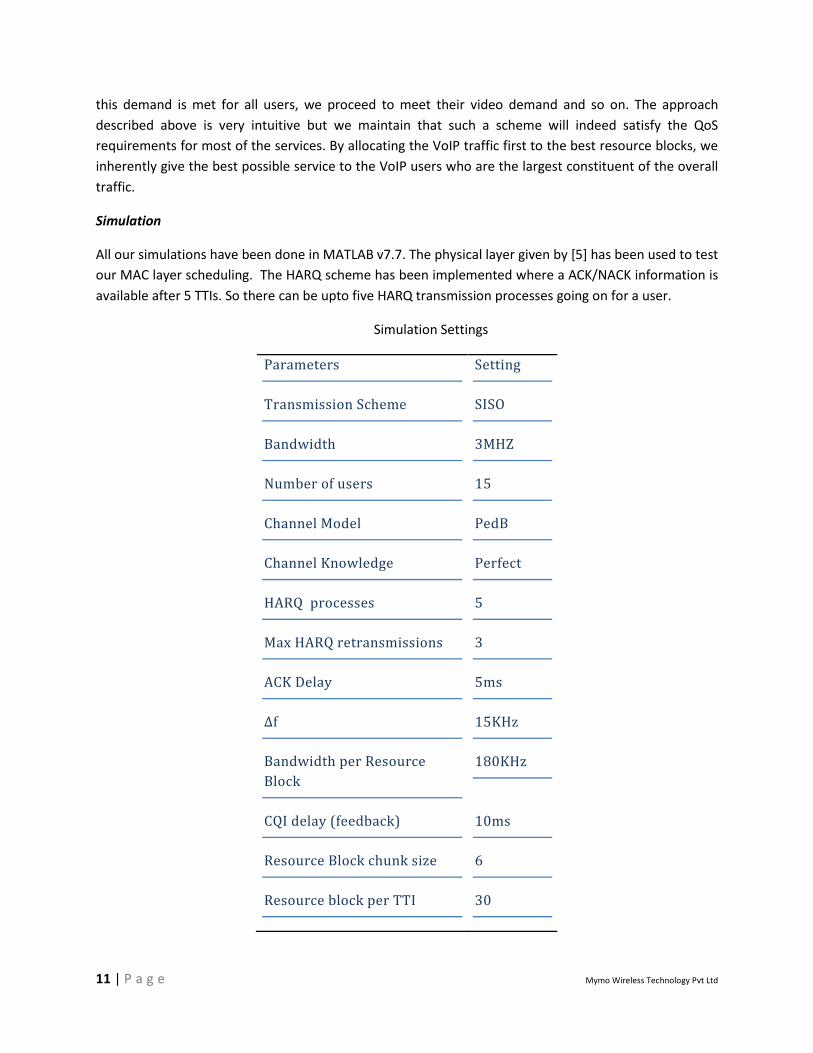
Simulation
All our simulations have been done in MATLAB v7.7. The physical layer given by [5] has been used to test
our MAC layer scheduling. The HARQ scheme has been implemented where a ACK/NACK information is
available after 5 TTIs. So there can be upto five HARQ transmission processes going on for a user.
Simulation Settings
Parameters Setting
Transmission Scheme SISO
Bandwidth 3MHZ
Number of users 15
Channel Model PedB
Channel Knowledge Perfect
HARQ processes 5
Max HARQ retransmissions 3
ACK Delay 5ms
∆f 15KHz
Bandwidth per Resource
Block
180KHz
CQI delay (feedback) 10ms
Resource Block chunk size 6
Resource block per TTI 30

12 | P a g e Mymo Wireless Technology Pvt Ltd
Simulation Time 8000 ms
Traffic Load (VoIP:Video) 10%:90%
Algorithms:
1. Randomized Round Robin
According to this scheme, we generate a random permutation of all UEs after every 3 TTI’s and
allocate the 15 RB’s in the next 3 subframes to each UEs based upon the permutation. This is
improved over static round robin scheme where a same RB goes to a user after 3 subframes. A
resource block of a user in a subframe will be alloted to the video traffic only if the there are no
packets in the VoIP queue.
2. Heuristic approach
STEPS
At time t,
1) For all j=1….J
2) S= i | Pi (t) > 0
3) Check if S GOTO step 4 ; otherwise GOTO step 9
4) Find i s.t. i S and i= arg max Wij (t)
5) alloc(i,j) = 1
6) Pi (t) = Pi (t) – Wi,j
7) Check if Pi (t) 0, then S=S – i
8) GOTO step 1
9) V = i | Ei (t) > 0
10) Check if V GOTO step 11 ; otherwise GOTO step 16
11) Find i s.t. i V and i = arg max Wij (t)
12) alloc(i,j) = 1
13) Ei (t) = Ei (t) - Wij
14) Check if Ei (t) 0, then V=V – i
15) GOTO step 1
16) i = arg max ( υij where alloc (i,j) = 1)
17) END
For AMC
1) For all i=1…..I
2) Ωi = min j s.t. alloc (i,j) = 1 [υij]

13 | P a g e Mymo Wireless Technology Pvt Ltd
In the above algorithm S is the set of users having a non zero voice demand and correspondingly for
video we have the set V. Note that the algorithm allocates resource blocks for video users only when the
set S is empty. If both the VoIP and the Video demand are met, we allocate the remaining blocks to
users who have the highest capacity on them. The latter scheme will improve the performance as will be
explained later.
Once the user allocation on the resource blocks has been done, the next step is to map the allocation on
the adaptive coding and modulation scheme for each user. The physical layer limitation allows a user to
have only a single AMC index. This implies that irrespective of the channel feedback, the modulation and
coding order is to be set to a minimum of all CQI values for the allocated resource blocks to a user.
Reducing the AMC order could be counteractive to the scheduling algorithm as the demand may no
longer be met due to lowered capacity. But setting the order to minimum will reduce the probability of
error in transmission among all frequency bands and ultimately meet the throughput demand. In this
situation, assigning the unused blocks to users with best possible channel states preferably those who
have been scheduled in the present subframe will further improve the performance. This is due to the
fact that the user data will now also be spread over better subcarriers.
Figure 1 below shows the throughput performance for both VoIP and video traffic. According to our
scheduling policy resource blocks are allocated for video only after the VoIP queues are empty. The
implications are clearly visible at bad channel conditions where only VoIP demand is met. Gradually as
the channel capacity increases, video packets occupy the rest of the blocks in a subframe which results
in improved video throughput. While the round robin and the heuristic approach can both meet the
VoIP load at somewhat good SNR, the difference in their performance can be gauged at very low SNR
levels or at high load conditions like in that of video. The heuristic approach aimed at improving the
resource utilization is useful at either low SNR levels or at intensive traffic conditions. Note that the
video traffic levels have been maintained high to test the capacity results of the scheduling algorithms.
In real life, VoIP will form the chunk of user traffic.
14 | P a g e Mymo Wireless Technology Pvt Ltd
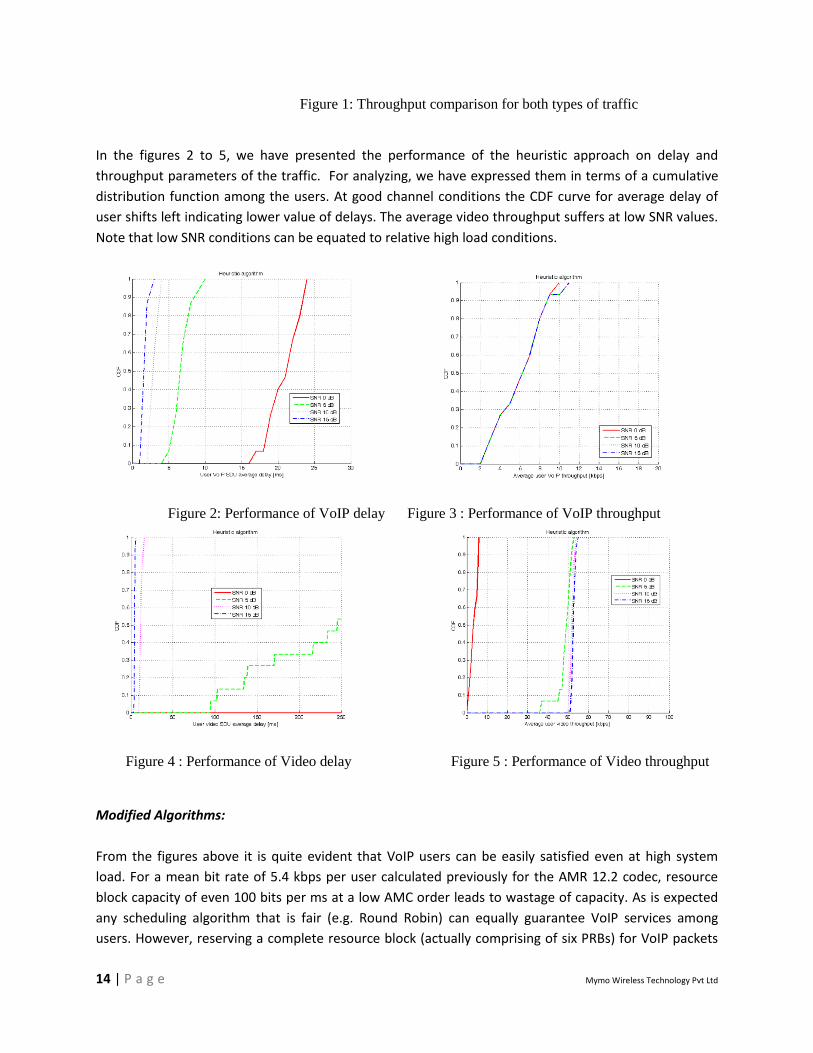
Figure 1: Throughput comparison for both types of traffic
In the figures 2 to 5, we have presented the performance of the heuristic approach on delay and
throughput parameters of the traffic. For analyzing, we have expressed them in terms of a cumulative
distribution function among the users. At good channel conditions the CDF curve for average delay of
user shifts left indicating lower value of delays. The average video throughput suffers at low SNR values.
Note that low SNR conditions can be equated to relative high load conditions.
Figure 2: Performance of VoIP delay Figure 3 : Performance of VoIP throughput
Figure 4 : Performance of Video delay Figure 5 : Performance of Video throughput
Modified Algorithms:
From the figures above it is quite evident that VoIP users can be easily satisfied even at high system
load. For a mean bit rate of 5.4 kbps per user calculated previously for the AMR 12.2 codec, resource
block capacity of even 100 bits per ms at a low AMC order leads to wastage of capacity. As is expected
any scheduling algorithm that is fair (e.g. Round Robin) can equally guarantee VoIP services among
users. However, reserving a complete resource block (actually comprising of six PRBs) for VoIP packets
15 | P a g e Mymo Wireless Technology Pvt Ltd
can lead to unutilized good subcarriers which are now loaded by data bits padded with zeros. This could
also be case with video packets which unlike VoIP packets can be of varying size. Smaller video frames
occupying a complete resource block at good channel conditions will lower resource utilization. The
problem of resource utilization can be neglected at light system load, but can affect throughput
performance at high loads. Wasting resources for VoIP traffic could lead to degradation of other user
services.
Any policy to overcome these shortcomings should also consider the QoS requirements of the traffic.
VoIP packets being delay sensitive cannot be buffered at the eNodeB. On the other hand, video frames
can tolerate some delay. Taking this into account we devise the following scheme:
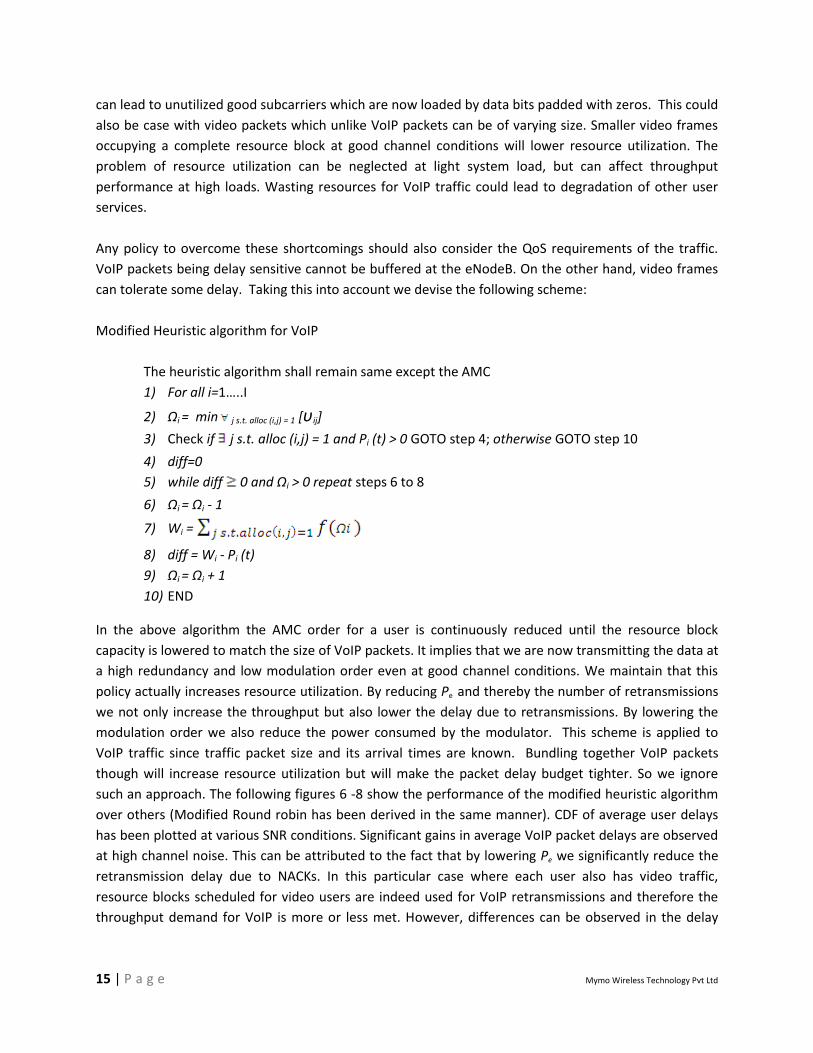
Modified Heuristic algorithm for VoIP
The heuristic algorithm shall remain same except the AMC
1) For all i=1…..I
2) Ωi = min j s.t. alloc (i,j) = 1 [υij]
3) Check if j s.t. alloc (i,j) = 1 and Pi (t) > 0 GOTO step 4; otherwise GOTO step 10
4) diff=0
5) while diff 0 and Ωi > 0 repeat steps 6 to 8
6) Ωi = Ωi - 1
7) Wi =
8) diff = Wi - Pi (t)
9) Ωi = Ωi + 1
10) END
In the above algorithm the AMC order for a user is continuously reduced until the resource block
capacity is lowered to match the size of VoIP packets. It implies that we are now transmitting the data at
a high redundancy and low modulation order even at good channel conditions. We maintain that this
policy actually increases resource utilization. By reducing Pe and thereby the number of retransmissions
we not only increase the throughput but also lower the delay due to retransmissions. By lowering the
modulation order we also reduce the power consumed by the modulator. This scheme is applied to
VoIP traffic since traffic packet size and its arrival times are known. Bundling together VoIP packets
though will increase resource utilization but will make the packet delay budget tighter. So we ignore
such an approach. The following figures 6 -8 show the performance of the modified heuristic algorithm
over others (Modified Round robin has been derived in the same manner). CDF of average user delays
has been plotted at various SNR conditions. Significant gains in average VoIP packet delays are observed
at high channel noise. This can be attributed to the fact that by lowering Pe we significantly reduce the
retransmission delay due to NACKs. In this particular case where each user also has video traffic,
resource blocks scheduled for video users are indeed used for VoIP retransmissions and therefore the
throughput demand for VoIP is more or less met. However, differences can be observed in the delay

16 | P a g e Mymo Wireless Technology Pvt Ltd
performance where each retransmission after a ACK/NACK delay of 5ms significantly adds to delay
overhead.
Figure 6 Figure 7
Figure 8 Figure 9
Figure 9 shows the affect of the modified AMC on the average Video packet delays. The slight
degradation in delay is due to the fact that by lowering the AMC order for a user in a subframe, we also
lower the capacity of the video resource blocks allotted to that user in the subframe. But such
degradation is farfetched since we have considered a high video load. In practice, the probability of a
user being scheduled for both VoIP and video in a subframe is quite less.

17 | P a g e Mymo Wireless Technology Pvt Ltd
Bundled Packet scheduling for Video:
By bundling video packets we can avoid allocating a complete resource block to a smaller video packet.
The delay introduced by bundling is significantly less than the packet delay budget as encoding delay
between video slices is quite negligible. However, bundling of packets for users whose channel is bad
could actually degrade the performance. Video packets are of varying size among which the larger slice
is of more importance (e.g. I frame) than the others (e.g. P,B frames) for decoding. And aggregating
large packets could again deteriorate performance and induce further delay to critical frames. To avoid
this, we bundle packets for users who have good channels and whose current demand of video packets
is low. These two could be jointly expressed by modifying the STEP 9 of the heuristic algorithm as
V = i | bundle_index(i) = 8 or Ei (t) > αNij
Where bundle_index(i) is the current video packet number in the queue and can vary from 1 to 8. This is
needed to ensure that once a video frame (comprising eight packets) has arrived, it needs to be
scheduled. α is a constant which has been introduced to take care of bad channel states or presence of a
large packet in the video queue. In our case it is set to 0.33.
Figure 10 Figure 11
18 | P a g e Mymo Wireless Technology Pvt Ltd
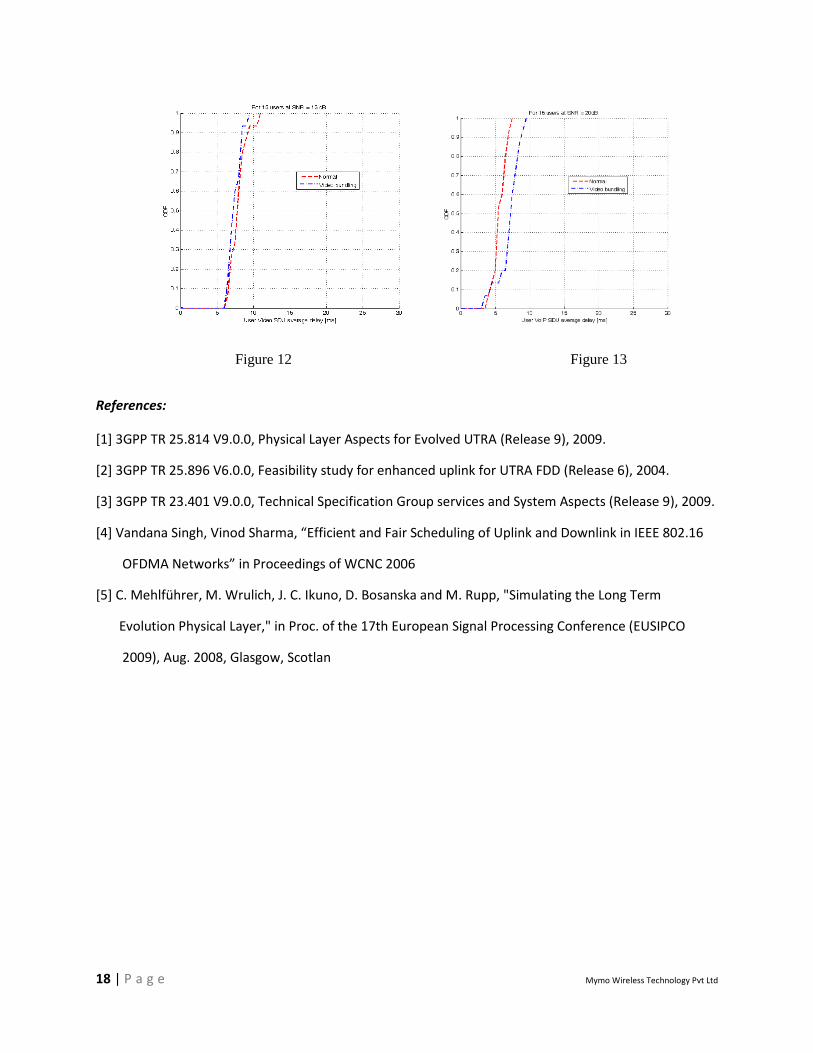
Figure 12 Figure 13
References:
[1] 3GPP TR 25.814 V9.0.0, Physical Layer Aspects for Evolved UTRA (Release 9), 2009.
[2] 3GPP TR 25.896 V6.0.0, Feasibility study for enhanced uplink for UTRA FDD (Release 6), 2004.
[3] 3GPP TR 23.401 V9.0.0, Technical Specification Group services and System Aspects (Release 9), 2009.
[4] Vandana Singh, Vinod Sharma, “Efficient and Fair Scheduling of Uplink and Downlink in IEEE 802.16
OFDMA Networks” in Proceedings of WCNC 2006
[5] C. Mehlführer, M. Wrulich, J. C. Ikuno, D. Bosanska and M. Rupp, "Simulating the Long Term
Evolution Physical Layer," in Proc. of the 17th European Signal Processing Conference (EUSIPCO
2009), Aug. 2008, Glasgow, Scotlan