Embed Size (px)
Citation preview

QNT 351 Entire Course
Entire Course Download Link:
https://uopcourses.com/category/qnt-351/
QNT 351 Week 1 Connect Problem Set 1.Which of the following is an example of a continuous variable?Tons of concrete to complete a parking garageNumber of students in a statistics classZip codes of shoppersRankings of baseball teams in a league
2.The incomes of 50 loan applicants are obtained. Which level of measurement is income?NominalOrdinalIntervalRatio
3.The members of each basketball team wear numbers on their jerseys. What scale of measurement are these numbers considered?NominalOrdinalIntervalRatio
4.The reported unemployment is 5.5% of the population. What measurement scale is used to measure unemployment?

NominalOrdinalInterval or ratioDescriptive
5.The Nielsen Ratings break down the number of people watching a particular television show by age. What level of measurement is age?NominalOrdinalIntervalRatio
6. An example of a qualitative variable is _________________.Number of children in a familyWeight of a personColor of ink in a penMiles between oil changes
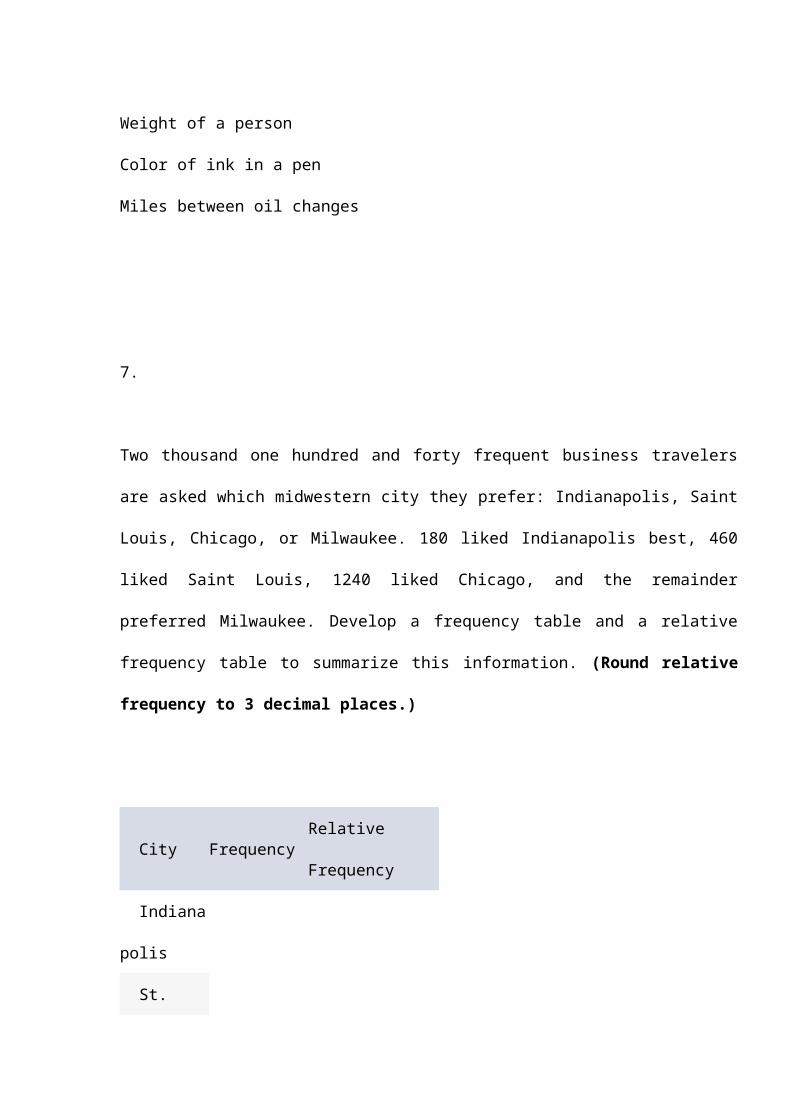
7. Two thousand one hundred and forty frequent business travelers are asked which midwestern city they prefer: Indianapolis, Saint Louis, Chicago, or Milwaukee. 180 liked Indianapolis best, 460 liked Saint Louis, 1240 liked Chicago, and the remainder preferred Milwaukee. Develop a frequency table and a relative frequency table to summarize this information. (Round relative frequency to 3 decimal places.) City Frequency Relative Frequency Indianapolis St. Louis Chicago Milwaukee

8. The Cambridge Power and Light Company selected a random sample of 20 residential customers. Following are the amounts, to the nearest dollar, the customers were charged for electrical service last month:
9. Consider these five values a population: 6, 3, 5, 3, and 6.
a. Determine the mean of the population. (Round your answer to 1 decimal place.)
b. Determine the variance of the population. (Round your answer to 2 decimal places.)
10. An investor buys 100 shares of AT&T stock and records its price change daily. Which concept of probability would you use to estimate the probability of an individual event? Probability of an individual eventEmpiricalClassical
QNT 351 Week 2 Connect Problem Set
1.Award: 10 out of 10.00 points The director of admissions at Kinzua University in Nova Scotia estimated the distribution of student admissions for the fall semester on the basis of past experience.
Admissions Probability1,070 0.3 1,280 0.1 1,660 0.6
1. What is the expected number of admissions for the fall semester?
Expected number of admissions 2. Compute the variance and the standard deviation of the number of admissions. (Round your
standard deviation to 2 decimal places.)
Variance Standard deviation
2.Award: 10 out of 10.00 points The Internal Revenue Service is studying the category of charitable contributions. A sample of 26 returns is selected from young couples between the ages of 20 and 35 who had an adjusted gross income of more than $100,000. Of these 26 returns, 6 had charitable contributions of more than $1,000. Suppose 5 of these returns are selected for a comprehensive audit. a You should use the hypergeometric distribution is appropriate. Because b. What is the probability exactly one of the five audited had a charitable deduction of more
than $1,000? (Round your answer to 4 decimal places.)
Probability c. What is the probability at least one of the audited returns had a charitable contribution of
more than $1,000? (Round your answer to 4 decimal places.)
Probability

3.Award: 10 out of 10.00 points According to the "January theory," if the stock market is up for the month of January, it will be up for the year. If it is down in January, it will be down for the year. According to an article in The Wall Street Journal, this theory held for 25 out of the last 34 years. Suppose there is no truth to this theory; that is, the probability it is either up or down is 0.5. What is the probability this could occur by chance? (Round your answer to 6 decimal places.) Probability
4.Award: 10 out of 10.00 points Customers experiencing technical difficulty with their internet cable hookup may call an 800 number for technical support. It takes the technician between 150 seconds and 13 minutes to resolve the problem. The distribution of this support time follows the uniform distribution. a. What are the values for a and b in minutes? (Do not round your intermediate calculations.
Round your answers to 1 decimal place.)
a b
b-1.What is the mean time to resolve the problem? (Do not round your intermediate
calculations. Round your answer to 2 decimal places.)
Mean b-2.What is the standard deviation of the time? (Do not round your intermediate calculations.
Round your answer to 2 decimal places.)

Standard deviation
c. What percent of the problems take more than 5 minutes to resolve? (Do not round your
intermediate calculations. Round your answer to 2 decimal places.)
Percent d. Suppose we wish to find the middle 50% of the problem-solving times. What are the end
points of these two times? (Do not round your intermediate calculations. Round your answers to 3 decimal places.)
End point 1 End point 2
5.Award: 10 out of 10.00 points A normal population has a mean of 20 and a standard deviation of 5. a. Compute the z value associated with 24. (Round your answer to 2 decimal places.)
Z b. What proportion of the population is between 20 and 24? (Round z-score computation to 2
decimal places and your final answer to 4 decimal places.)
Proportion c. What proportion of the population is less than 18? (Round z-score computation to 2
decimal places and your final answer to 4 decimal places.)
Proportion
6.Award: 10 out of 10.00 points

Assume that the hourly cost to operate a commercial airplane follows the normal distribution with a mean of $2,306 per hour and a standard deviation of $258. What is the operating cost for the lowest 1% of the airplanes? (Round z value to 2 decimal places and round final answer to nearest whole dollar.) Operating cost
7.Award: 10 out of 10.00 points The manufacturer of a laser printer reports the mean number of pages a cartridge will print before it needs replacing is 12,350. The distribution of pages printed per cartridge closely follows the normal probability distribution and the standard deviation is 670 pages. The manufacturer wants to provide guidelines to potential customers as to how long they can expect a cartridge to last. How many pages should the manufacturer advertise for each cartridge if it wants to be correct 99 percent of the time? (Round z value to 2 decimal places. Round your answer to the nearest whole number.) Pages
8.Award: 8 out of 10.00 points A study of long-distance phone calls made from General Electric Corporate Headquarters in Fairfield, Connecticut, revealed the length of the calls, in minutes, follows the normal probability distribution. The mean length of time per call was 4.90 minutes and the standard deviation was 0.40 minutes. a. What fraction of the calls last between 4.90 and 5.60 minutes? (Round z-score computation
to 2 decimal places and your final answer to 4 decimal places.)

Fraction of calls b. What fraction of the calls last more than 5.60 minutes? (Round z-score computation to 2
decimal places and your final answer to 4 decimal places.)
Fraction of calls c. What fraction of the calls last between 5.60 and 6.50 minutes? (Round z-score computation
to 2 decimal places and your final answer to 4 decimal places.)
Fraction of calls d. What fraction of the calls last between 4.50 and 6.50 minutes? (Round z-score computation
to 2 decimal places and your final answer to 4 decimal places.)
Fraction of calls e. As part of her report to the president, the director of communications would like to report the
length of the longest (in duration) 5 percent of the calls. What is this time? (Round z-score computation to 2 decimal places and your final answer to 2 decimal places.)
Duration
9.Award: 10 out of 10.00 points A population consists of the following five values: 9, 11, 15, 17, and 20. a. List all samples of size 3, and compute the mean of each sample. (Round your mean value
to 2 decimal places.)
Sample Values Sum Mean
b. Compute the mean of the distribution of sample means and the population mean. (Round
your answers to 2 decimal places.)
Sample means Population mean

10.Award: 10 out of 10.00 points The mean age at which men in the United States marry for the first time follows the normal distribution with a mean of 24.1 years. The standard deviation of the distribution is 2.5 years. For a random sample of 66 men, what is the likelihood that the age at which they were married for the first time is less than 24.6 years? (Round z value to 2 decimal places. Round your answer to 4 decimal places.) Probability
QNT 351 Week 3 Connect Problem Set
Score:70/70Points100%
1.A sample of 43 observations is selected from a normal population. The sample mean is 30, and the population standard deviation is 3. Conduct the following test of hypothesis using the 0.05 significance level. H0 : μ ≤ 29H1 : μ > 29
a. Is this a one- or two-tailed test?
b.What is the decision rule? (Round your answer to 3 decimal places.)
c. What is the value of the test statistic? (Round your answer to 2

decimal places.)
d.What is your decision regarding H0?
e.What is the p-value? (Round your answer to 4 decimal places.)
p-value
2. At the time she was hired as a server at the Grumney Family Restaurant, Beth Brigden was told, “You can average $86 a day in tips.” Assume the population of daily tips is normally distributed with a standard deviation of $3.81. Over the first 48 days she was employed at the restaurant, the mean daily amount of her tips was $87.07. At the 0.02 significance level, can Ms. Brigden conclude that her daily tips average more than $86? a. State the null hypothesis and the alternate hypothesis. b. State the decision rule.
c. Compute the value of the test statistic. (Round your answer to 2 decimal places.)
Value of the test statistic
d. What is your decision regarding H0?

e. What is the p-value? (Round your answer to 4 decimal places.)
3. The Rocky Mountain district sales manager of Rath Publishing Inc., a college textbook publishing company, claims that the sales representatives make an average of 43 sales calls per week on professors. Several reps say that this estimate is too low. To investigate, a random sample of 41 sales representatives reveals that the mean number of calls made last week was 44. The standard deviation of the sample is 2.9 calls. Using the 0.100 significance level, can we conclude that the mean number of calls per salesperson per week is more than 43? H0 : μ ≤ 43H1 : μ > 43 1. Compute the value of the test statistic. (Round your answer to 3 decimal
places.)
Value of the test statistic
2. What is your decision regarding H0?
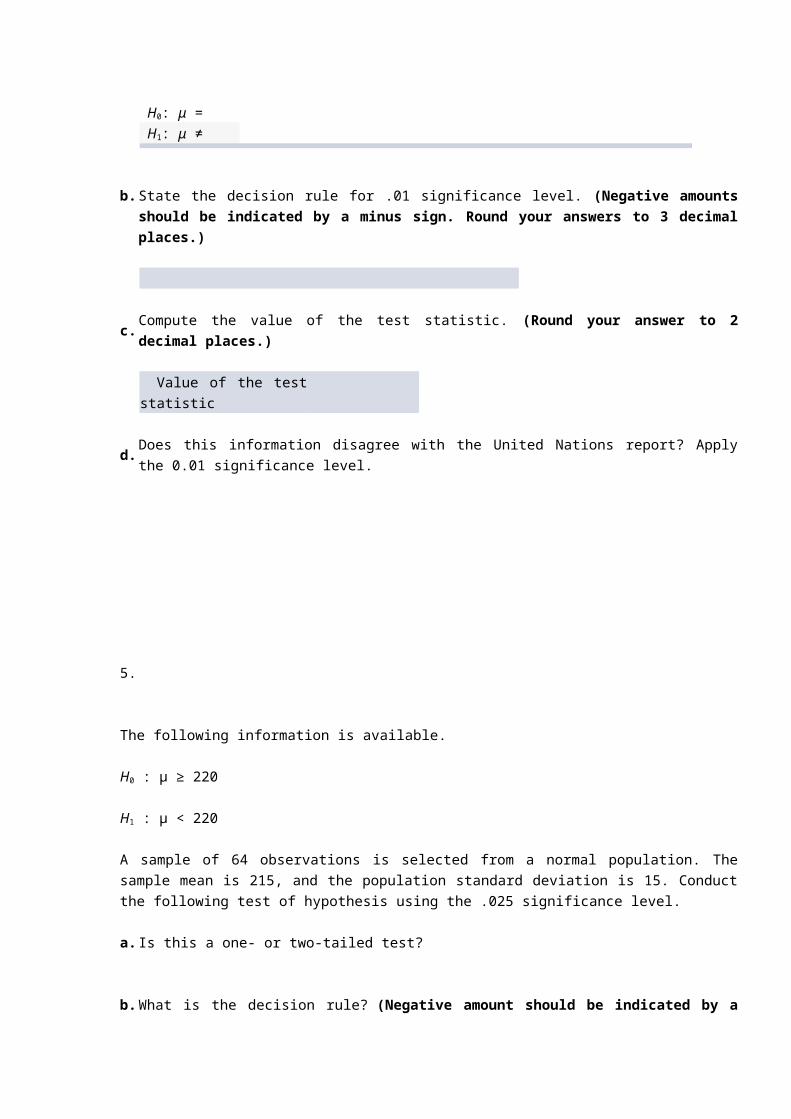
4. A United Nations report shows the mean family income for Mexican migrants to the United States is $27,150 per year. A FLOC (Farm Labor Organizing Committee) evaluation of 30 Mexican family units reveals a mean to be $29,500 with a sample standard deviation of $11,150. Does this information disagree with the United Nations report? Apply the 0.01 significance level.
a. State the null hypothesis and the alternate hypothesis.

H0: μ = H1: μ ≠
b. State the decision rule for .01 significance level. (Negative amounts should be indicated by a minus sign. Round your answers to 3 decimal places.)
c. Compute the value of the test statistic. (Round your answer to 2 decimal places.)
Value of the test statistic
d. Does this information disagree with the United Nations report? Apply the 0.01 significance level.
5. The following information is available. H0 : μ ≥ 220 H1 : μ < 220 A sample of 64 observations is selected from a normal population. The sample mean is 215, and the population standard deviation is 15. Conduct the following test of hypothesis using the .025 significance level. a. Is this a one- or two-tailed test? b. What is the decision rule? (Negative amount should be indicated by a minus
sign. Round your answer to 2 decimal places.)

c. What is the value of the test statistic? (Negative amount should be indicated by
a minus sign. Round your answer to 3 decimal places.) d. What is your decision regarding H0? e. What is the p-value? (Round your answer to 4 decimal places.)
6. Given the following hypotheses: H0 : μ ≤ 10H1 : μ > 10 A random sample of 10 observations is selected from a normal population. The sample mean was 12 and the sample standard deviation 3. Using the .05 significance level: a. State the decision rule. (Round your answer to 3 decimal places.)
Reject H0 if t > b. Compute the value of the test statistic. (Round your answer to 3 decimal
places.)
Value of the test statistic c. What is your decision regarding the null hypothesis?

7. Given the following hypotheses:
H0 : μ = 400
H1 : μ ≠ 400
A random sample of 12 observations is selected from a normal population. The sample mean was 407 and the sample standard deviation 6. Using the .01 significance level:
a. State the decision rule. (Negative amount should be indicated by a minus sign. Round your answers to 3 decimal places.)
b. Compute the value of the test statistic. (Round your answer to 3 decimal places.)
Value of the test statistic
c. What is your decision regarding the null hypothesis?
QNT 351 Week 4 Connect Problem Set
1.

The production department of Celltronics International wants to explore the relationship between the number of employees who assemble a subassembly and the number produced. As an experiment, 2 employees were assigned to assemble the subassemblies. They produced 6 during a one-hour period. Then 4 employees assembled them. They produced 10 during a one-hour period. The complete set of paired observations follows.
Number ofAssemblers
One-HourProduction (units)
2 64 101 45 183 12
The dependent variable is production; that is, it is assumed that different levels of production result from a different number of employees.
b. A scatter diagram is provided below. Based on it, does there appear to be any relationship between the number of assemblers and production?
, as the number of assemblers , so does the production.
c. Compute the correlation coefficient. (Negative amounts should be indicated by a minus sign. Round sx, sy and r to 3 decimal places.)

X Y ( )2 ( )2 ( )(
2 6 -4 16
4 10 1 1
1 4 -6 36
5 18 2 4
3 12 2 0
= = sx =
sy = r =
2.value:1.00 points The following sample observations were randomly selected. (Round your answers to 2 decimal places.) X:4 5 3 6 10Y:9.8 10.6 9 16.4 19.6 a.
The regression equation is = + X

b. When X is 7 this gives =
3.value:10.00 points Bi-lo Appliance Super-Store has outlets in several large metropolitan areas in New England. The general sales manager aired a commercial for a digital camera on selected local TV stations prior to a sale starting on Saturday and ending Sunday. She obtained the information for Saturday–Sunday digital camera sales at the various outlets and paired it with the number of times the advertisement was shown on the local TV stations. The purpose is to find whether there is any relationship between the number of times the advertisement was aired and digital camera sales. The pairings are: Location of Number of Saturday–Sunday Sales TV Station Airings ($ thousands) Providence 4 15 Springfield 2 8 New Haven 5 21 Boston 6 24 Hartford 3 17
Click here for the Excel Data File
a. What is the dependent variable? is the dependent variable. c. Determine the correlation coefficient. (Round your answer to 2 decimal places.)
Coefficient of correlation
d. Interpret these statistical measures.
The statistical measures obtained here indicate correlation between the variables.

4.value:10.00 points The owner of Maumee Ford-Mercury-Volvo wants to study the relationship between the age of a car and its selling price. Listed below is a random sample of 12 used cars sold at the dealership during the last year.
CarAge (years)
Selling Price ($000) Car
Age (years)
Selling Price ($000)
1 9 8.1 7 8 7.62 7 6.0 8 11 8.03 11 3.6 9 10 8.04 12 4.0 10 12 6.05 8 5.0 11 6 8.66 7 10.0 12 6 8.0
Click here for the Excel Data File a. If we want to estimate selling price on the basis of the age of the car, which variable is the
dependent variable and which is the independent variable? is the independent variable and is the dependent variable. b-1. Determine the correlation coefficient. (Negative amounts should be indicated by a minus
sign. Round your answers to 3 decimal places.)
X Y ( )2 ( )2 ( )(
9.0 8.1 1.192 0.007 1.420 0.099
7.0 6.0 -0.908 3.674 0.825 1.741
11.0 3.6 2.083 4.340 10.945 -6.892
12.0 4.0 3.083 9.507 8.458 -8.967
8.0 5.0 -0.917 -1.908 3.642 1.749

7.0 10.0 -1.917 3.092 9.558 -5.926
8.0 7.6 -0.917 0.692 0.840 -0.634
11.0 8.0 2.083 1.092 4.340 2.274
10.0 8.0 1.083 1.092 1.174 1.192
12.0 6.0 3.083 -0.908 9.507 0.825
6.0 8.6 -2.917 1.692 8.507 2.862 -4.934 6.0 8.0 -2.917 1.092 8.507 1.192 -3.184
107.000 82.900
= = sx = sy =
r =
b-2. Determine the coefficient of determination. (Round your answer to 3 decimal places.)
c. Interpret the correlation coefficient. Does it surprise you that the correlation coefficient is
negative? (Round your answer to nearest whole number.)
correlation between age of car and selling price. So, % of the variation in the
selling price is explained by the variation in the age of the car.

5.value:10.00 points Pennsylvania Refining Company is studying the relationship between the pump price of gasoline and the number of gallons sold. For a sample of 20 stations last Tuesday, the correlation was .78. At the .01 significance level, is the correlation in the population greater than zero? (Round your answer to 3 decimal places.)
The test statistic is .
Decision: H0: ρ ≤ 0
QNT 351 Week 2 LT Assignment
QNT 351: Learning Teams Problem Sets
IMPORTANT:Showing your work and how you reached the answer is critical in receiving your grade...simply putting down values as the final answer will not earn you any points.
Week 2 LT AssignmentsChapter 1 4. For each of the following, determine whether the group is a sample or a population.
a. The participants in a study of a new cholesterol drug.b. The drivers who received a speeding ticket in Kansas City
last month.c. Those on welfare in Cook County (Chicago), Illinois.d. The 30 stocks reported as a part of the Dow Jones Industrial

Average.
8. For the following questions, would you collect information using a sample or a population?Why?
a. Statistics 201 is a course taught at a university. Professor A. Verage has taught nearly1,500 students in the course over the past 5 years. You would like to know the averagegrade for the course.b. As part of a research project, you need to report the average profitability of the numberone corporation in the Fortune 500 for the past 10 years.c. You are looking forward to graduation and your first job as a salesperson for one offive large pharmaceutical corporations. Planning for your interviews, you will need toknow about each company’s mission, profitability, products, and markets.d. You are shopping for a new MP3 music player such as the Apple iPod. The manufacturersadvertise the number of music tracks that can be stored in the memory. Usually,the advertisers assume relatively short, popular music to estimate the number oftracks that can be stored. You, however, like Broadway musical tunes and they aremuch longer. You would like to estimate how many Broadway tunes will fit on yourMP3 player.
12. Utilize the concepts of sample and population to describe how a presidential election isunlike an “exit” poll of the electorate.
16. AVX Stereo Equipment, Inc., recently began a “no-hassles” return policy. A sample of500 customers who had recently returned items showed 400 thought the policy wasfair, 32 thought it took too long to complete the transaction, and the rest had no opinion.On the basis of this information, make an inference about customer reaction to thenew policy

18. The following chart depicts the average amounts spent by consumers on holiday gifts.Write a brief report summarizing the amounts spent during the holidays. Be sure toinclude the total amount spent, and the percent spent by each group.
QNT 351 Week 3 LT Assignment
Week 3 LT Assignments1. The events X and Y are mutually exclusive. Suppose P(X) _ .05 and P(Y) _ .02. What isthe probability of either X or Y occurring? What is the probability that neither X nor Y willhappen?
2. Let P(X) _ .55 and P(Y) _ .35. Assume the probability that they both occur is .20. Whatis the probability of either X or Y occurring?
3. Suppose P(X1) = .75 and P(Y2|X1) = .40. What is the joint probability of X1 and Y2?
4. Refer to the following table.

a. Determine P(A1).
b. Determine P(B1|A2).
c. Determine P(B2 and A3).
5. Berdine’s Chicken Factory has several stores in the Hilton Head, South Carolina, area. Wheninterviewing applicants for server positions, the owner would like to include information onthe amount of tip a server can expect to earn per check (or bill). A study of 500 recentchecks indicated the server earned the following amounts in tips per 8-hour shift.
Amount of Tip Number$0 up to $ 20 20020 up to 50 10050 up to 100 75100 up to 200 75200 or more 50Total 500
a. What is the probability of a tip of $200 or more?b. Are the categories “$0 up to $20,” “$20 up to $50,” and so on considered mutuallyexclusive?c. If the probabilities associated with each outcome were totaled, what would that total be?d. What is the probability of a tip of up to $50?e. What is the probability of a tip of less than $200?
QNT 351 Week 4 LT Assignment
Week 4 LT Assignments
1. The following hypotheses are given.
H0: π = .40
H1: π ≠ .40
A sample of 120 observations revealed that p = .30. At the .05 significance level, can the null hypothesis be rejected?
a. State the decision rule.
b. Compute the value of the test statistic.
c. What is your decision regarding the null hypothesis?
For the following Problems, use the 6 step hypothesis testing
2. The manufacturer of the X-15 steel-belted radial truck tire claims that the mean mileage the tire can be driven before the tread wears out is 60,000 miles. Assume the mileage wear follows the normal distribution and the standard deviation of the distribution is 5,000 miles. Crosset Truck Company bought 48 tires and found that the mean mileage for its trucks is 59,500 miles. Is Crosset’s experience different from that claimed by the manufacturer at the .05 significance level?
3. The waiting time for customers at MacBurger Restaurants follows a normal distribution with a population standard deviation of 1 minute. At the Warren Road MacBurger, the quality-assurance department sampled 50 customers and found that the mean waiting time was 2.75 minutes. At the .05 significance level, can we conclude that the mean waiting time is less than 3 minutes?
4. The null and alternate hypotheses are:
H0: π1 = π2
H1: π1 ≠ π2
A sample of 200 observations from the first population indicated that x1 is 170. A sample of 150 observations from the second population revealed x2 to be 110. Use the .05 significance level to test the hypothesis.
a. State the decision rule.
b. Compute the pooled proportion.
c. Compute the value of the test statistic.
d. What is your decision regarding the null hypothesis?

5. The null and alternate hypotheses are:
H0: μ1 = μ2
H1: μ1 ≠ μ2
A random sample of 10 observations from one population revealed a sample mean of 23 and a sample standard deviation of 4. A random sample of 8 observations from another population revealed a sample mean of 26 and a sample standard deviation of 5. At the .05 significance level, is there a difference between the population means?
QNT 351 Week 5 LT Assignment
Week 5 LT Assignments
1. The city council of Pine Bluffs is considering increasing the number of police in an effort to reduce crime. Before making a final decision, the council asked the chief of police to survey other cities of similar size to determine the relationship between the number of police and the number of crimes reported. The chief gathered the following sample information.
a. Which variable is the dependent variable and which is the independent variable? Hint: Which of the following makes better sense: Cities with more police have fewer crimes, or cities with fewer crimes have more police? Explain your choice.
b. Draw a scatter diagram.
c. Determine the correlation coefficient.
d. Interpret the correlation coefficient. Does it surprise you that the correlation coefficient is negative?

2. Pennsylvania Refining Company is studying the relationship between the pump price of gasoline and the number of gallons sold. For a sample of 20 stations last Tuesday, the correlation was .78. At the .01 significance level, is the correlation in the population greater than zero?
3. A study of 20 worldwide financial institutions showed the correlation between their assets and pretax profit to be .86. At the .05 significance level, can we conclude that there is positive correlation in the population?
4. The following sample observations were randomly selected.
5. Refer to the following table
Determine the correlation coefficient and interpret the relationship between x and y.