Embed Size (px)
Citation preview
1 QlikTech in THE BI SURVEY 12 Q
likTech in THE B
I SUR
VEY
THE
BI SURVEY 11 SURVEY
The Customer Verdict The world’s largest survey of business intelligence software users
1211
This document is a specially produced summary by BARC of the headline results for QlikTech
This document is not to be shared, distributed or reproduced in any way without first purchasing licensing rights and the express prior permission of BARC.
2 QlikTech in THE BI SURVEY 12
Table of Contents
QlikTech in THE BI SURVEY 12 .............................................................................................. 3
QlikTech overview ............................................................................................................... 3
QlikTech customer responses ............................................................................................. 3
Product usage ................................................................................................................... 4
Customer demographics ................................................................................................... 4
Product penetration .......................................................................................................... 4
Number of users ............................................................................................................... 4
Peer Groups ............................................................................................................................. 5
Survey Results for QlikTech ..................................................................................................... 6
KPI Results for QlikTech in Peer Group “BI Giants” ............................................................ 6
KPI Results for QlikTech in Peer Group “Dashboard vendor” ........................................... 10
KPI Results for QlikTech in Peer Group “Visual Analysis and Data Discovery
vendor” .............................................................................................................................. 12
KPI Results for QlikTech in Peer Group “Small and Medium Projects vendor” ................. 14
Summary ................................................................................................................................ 16
Marketing Statements ............................................................................................................ 16
3 QlikTech in THE BI SURVEY 12
QlikTech in THE BI SURVEY 12 QlikTech overview QlikView is the main product of QlikTech, an American company originally founded in
the Swedish university town of Lund in 1993 as a consulting company. Its
headquarters moved to Pennsylvania in 2005 after it raised funds from several venture
capital firms. QlikTech went public in 2010.
QlikTech has grown very quickly. The company says it has more than 26,000
customers in 100 countries and more than $320m revenue in 2011, targeting to break
the $400m barrier in 2012. QlikTech is commonly cited as a competitor by other
vendors we speak with. It has very successfully addressed the self service BI
requirements of business users in both functionality and go-to-market.
QlikTech customer responses QlikTech has featured in The BI Survey for several years. It had the highest
participation, with 172 respondents reporting on their experiences with the tool. About
60 percent of participants said they were using QlikTech version 10 and nearly 30
percent version 11. The rest of the respondents used older versions.
4 QlikTech in THE BI SURVEY 12
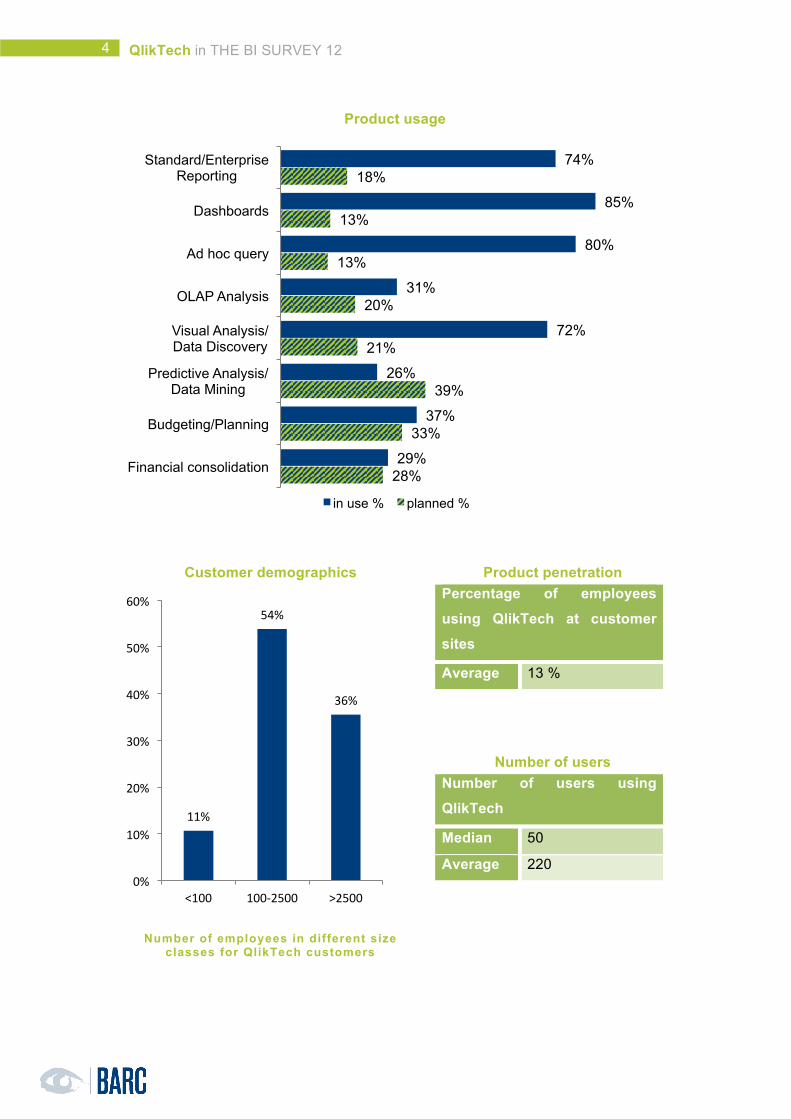
Product usage
Customer demographics
Number of employees in different size classes for QlikTech customers
Product penetration Percentage of employees
using QlikTech at customer
sites
Average 13 %
Number of users Number of users using
QlikTech
Median 50
Average 220
74%
85%
80%
31%
72%
26%
37%
29%
18%
13%
13%
20%
21%
39%
33%
28%
Standard/Enterprise Reporting
Dashboards
Ad hoc query
OLAP Analysis
Visual Analysis/ Data Discovery
Predictive Analysis/ Data Mining
Budgeting/Planning
Financial consolidation
in use % planned %
11%
54%
36%
0%
10%
20%
30%
40%
50%
60%
<100 100-‐2500 >2500
5 QlikTech in THE BI SURVEY 12
Peer Groups
Peer groups are used to ensure similar products are compared against each other
both in fairness to the vendor and for the benefit of the customer. The groups are
essential to allow fair and useful comparisons of products that are likely to compete.
The peer groups are primarily data-driven and based on how customers say they
use the product.
QlikTech features in the following peer groups:
- BI Giants
- Dashboard vendor
- Visual Analysis and Data Discovery vendor
- Small and Medium Projects vendor
For more details on the KPIs, see the ‘KPIs and Dashboards’ document.

6 QlikTech in THE BI SURVEY 12
Survey Results for QlikTech
KPI Results for QlikTech in Peer Group “BI Giants”
Top ranked BI Giant in visual analysis
The tool offers appealing visual representations and dashboards which is a key feature of QlikTech. It also offers the ability to analyze data in an associative way and is therefore different than the usual OLAP analysis tools.
Top ranked BI Giant in innovation
QlikTech scored very well in visual analysis and mobile BI. These are both trends that QlikTech addressed early on, leading to an excellent result in the innovation category.
0.32 0.37
0.40 0.51
0.56 0.67
0.81 0.90
1.00 1.09
1.15 1.21 1.23
2.16
0.31
SAP BW (13) Microsoft SSRS (12)
Infor (11) IBM Cognos BI (10)
SAP BO WebI (9) Oracle OBIEE (8) MicroStrategy (7)
Information Builders (6) Average
IBM Cognos TM1 (5) Oracle Essbase (4) Microsoft SSAS (3) Microsoft Excel (2)
QlikTech (1)
min
2.17 max
1.00
0.44 0.48
0.67 0.68
0.70 0.72
0.87 0.95
1.00 1.00 1.00
1.14 1.55
1.63
0.43
SAP BO WebI (13) Microsoft SSRS (12) IBM Cognos BI (11)
SAP BW (10) IBM Cognos TM1 (9)
Oracle Essbase (8) Infor (7)
Microsoft SSAS (6) Average
Information Builders (5) Oracle OBIEE (4) MicroStrategy (3)
Microsoft Excel (2) QlikTech (1)
min
1.64 max
1.00
7 QlikTech in THE BI SURVEY 12
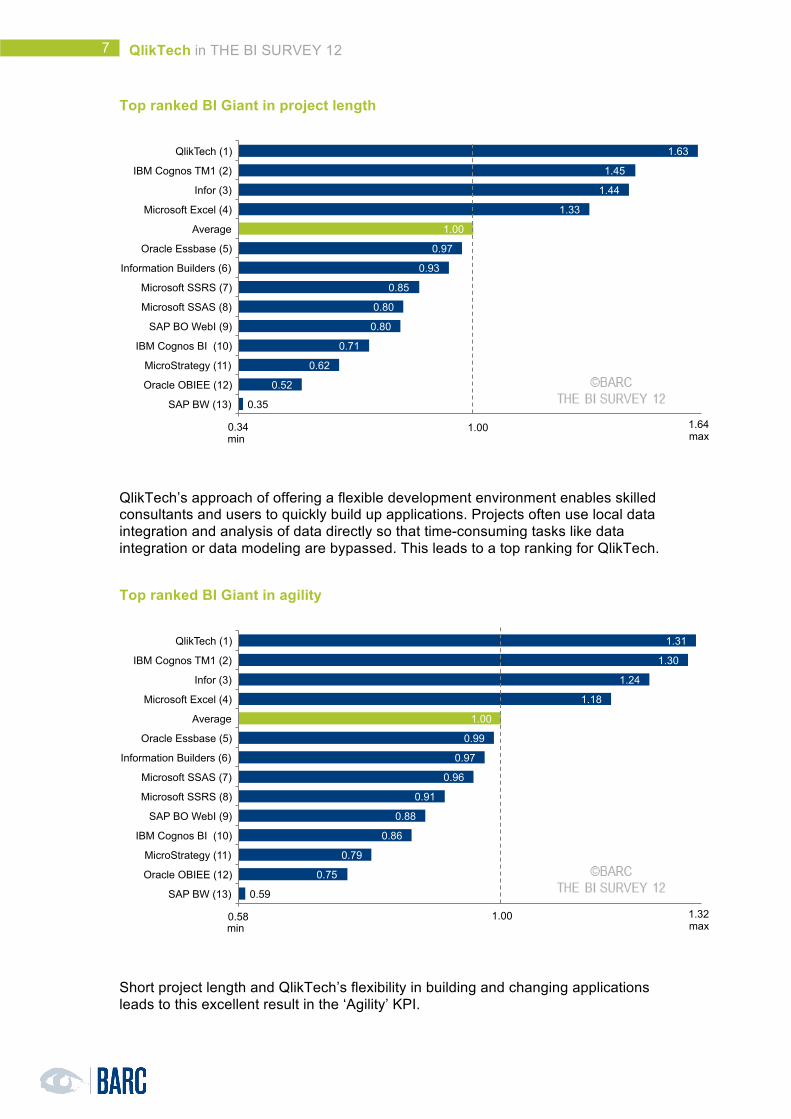
Top ranked BI Giant in project length
QlikTech’s approach of offering a flexible development environment enables skilled consultants and users to quickly build up applications. Projects often use local data integration and analysis of data directly so that time-consuming tasks like data integration or data modeling are bypassed. This leads to a top ranking for QlikTech.
Top ranked BI Giant in agility
Short project length and QlikTech’s flexibility in building and changing applications leads to this excellent result in the ‘Agility’ KPI.
0.35
0.52
0.62
0.71
0.80
0.80
0.85
0.93
0.97
1.00
1.33
1.44
1.45
1.63
0.34
SAP BW (13)
Oracle OBIEE (12)
MicroStrategy (11)
IBM Cognos BI (10)
SAP BO WebI (9)
Microsoft SSAS (8)
Microsoft SSRS (7)
Information Builders (6)
Oracle Essbase (5)
Average
Microsoft Excel (4)
Infor (3)
IBM Cognos TM1 (2)
QlikTech (1)
1.64 max
min
1.00
0.59
0.75
0.79
0.86
0.88
0.91
0.96
0.97
0.99
1.00
1.18
1.24
1.30
1.31
0.58
SAP BW (13)
Oracle OBIEE (12)
MicroStrategy (11)
IBM Cognos BI (10)
SAP BO WebI (9)
Microsoft SSRS (8)
Microsoft SSAS (7)
Information Builders (6)
Oracle Essbase (5)
Average
Microsoft Excel (4)
Infor (3)
IBM Cognos TM1 (2)
QlikTech (1)
1.32 max
min
1.00

8 QlikTech in THE BI SURVEY 12
Leading BI Giant in business achievement
Leading BI Giant in competitiveness
Competitiveness is an aggregate of competitive win rate and standardization. QlikTech is competitive in this area due to its agility in sales situations. The sales process is targeted towards a short proof of concept and can show rapid benefits to the customer. QlikTech also uses a large partner network efficiently. This network is an excellent asset for the vendor.
0.84
0.86
0.88
0.88
0.97
0.98
1.00
1.01
1.02
1.06
1.08
1.08
1.16
1.19
0.83
Oracle OBIEE (13)
SAP BO WebI (12)
IBM Cognos BI (11)
SAP BW (10)
Microsoft Excel (9)
Microsoft SSRS (8)
Average
Infor (7)
MicroStrategy (6)
Microsoft SSAS (5)
QlikTech (4)
Information Builders (3)
IBM Cognos TM1 (2)
Oracle Essbase (1)
1.20 max
min
1.00
0.76
0.81
0.88
0.90
0.92
0.97
1.00
1.00
1.01
1.06
1.08
1.10
1.13
0.75
IBM Cognos BI (12)
IBM Cognos TM1 (11)
Oracle OBIEE (10)
Oracle Essbase (9)
Infor (8)
MicroStrategy (7)
Average
Information Builders (6)
QlikTech (5)
SAP BW (4)
Microsoft SSAS (3)
Microsoft SSRS (2)
SAP BO WebI (1)
1.14 max
min
1.00
9 QlikTech in THE BI SURVEY 12
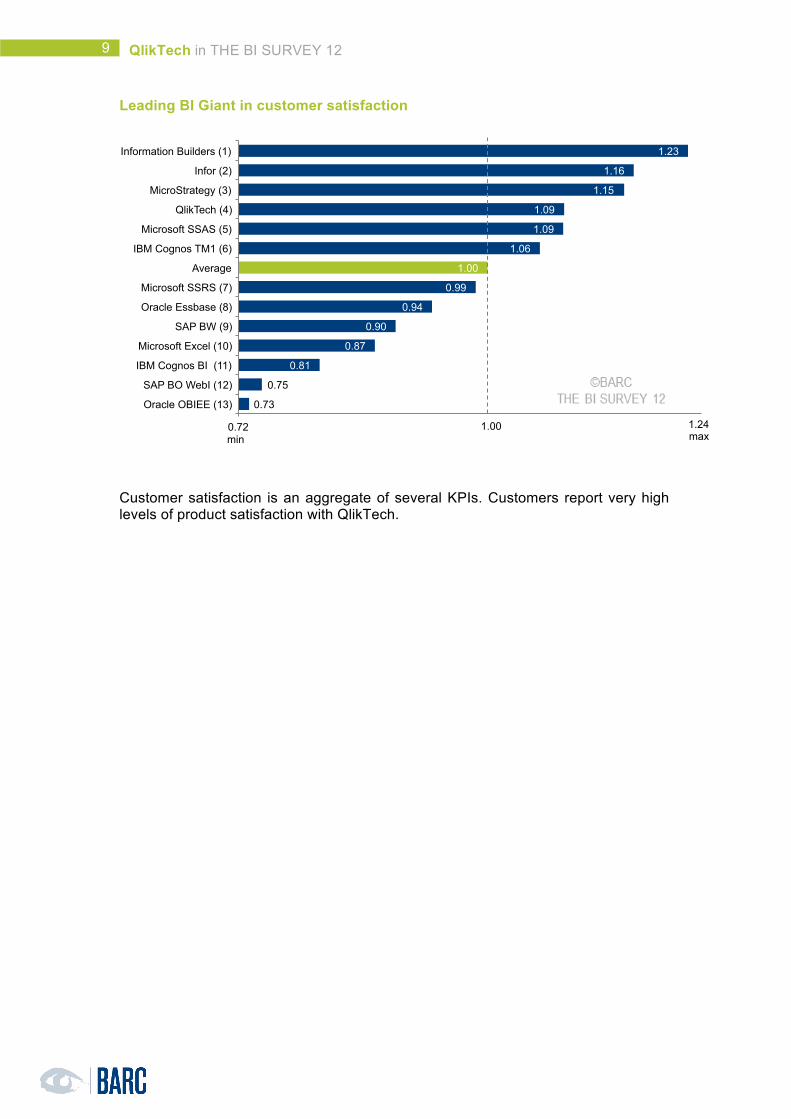
Leading BI Giant in customer satisfaction
Customer satisfaction is an aggregate of several KPIs. Customers report very high levels of product satisfaction with QlikTech.
0.73
0.75
0.81
0.87
0.90
0.94
0.99
1.00
1.06
1.09
1.09
1.15
1.16
1.23
0.72
Oracle OBIEE (13)
SAP BO WebI (12)
IBM Cognos BI (11)
Microsoft Excel (10)
SAP BW (9)
Oracle Essbase (8)
Microsoft SSRS (7)
Average
IBM Cognos TM1 (6)
Microsoft SSAS (5)
QlikTech (4)
MicroStrategy (3)
Infor (2)
Information Builders (1)
1.24 max
min
1.00

10 QlikTech in THE BI SURVEY 12
KPI Results for QlikTech in Peer Group “Dashboard vendor”
Leading Dashboard vendor in innovation
One of QlikTech’s strengths is its ability to bring dashboards to mobile devices. This, together with good capabilities for visual analysis, means that customers see QlikTech as an innovative vendor.
Leading Dashboard vendor in performance satisfaction
This result is due to QlikTech’s inbuilt, in-memory database and its very fast response times.
0.59
0.63
0.68
0.70
0.75
1.00
1.00
1.10
1.27
2.81
0.58
Decisyon (9)
Oracle OBIEE (8)
Information Builders (7)
BOARD (6)
MicroStrategy (5)
Arcplan (4)
Average
QlikTech (3)
Dimensional Insight (2)
Yellowfin (1)
2.82 max
min
1.00
0.90
0.90
0.94
0.97
1.00
1.02
1.03
1.05
1.06
1.08
0.89
MicroStrategy (9)
Decisyon (8)
Oracle OBIEE (7)
Arcplan (6)
Average
BOARD (5)
Dimensional Insight (4)
Yellowfin (3)
QlikTech (2)
Information Builders (1)
1.09 max
min
1.00
11 QlikTech in THE BI SURVEY 12
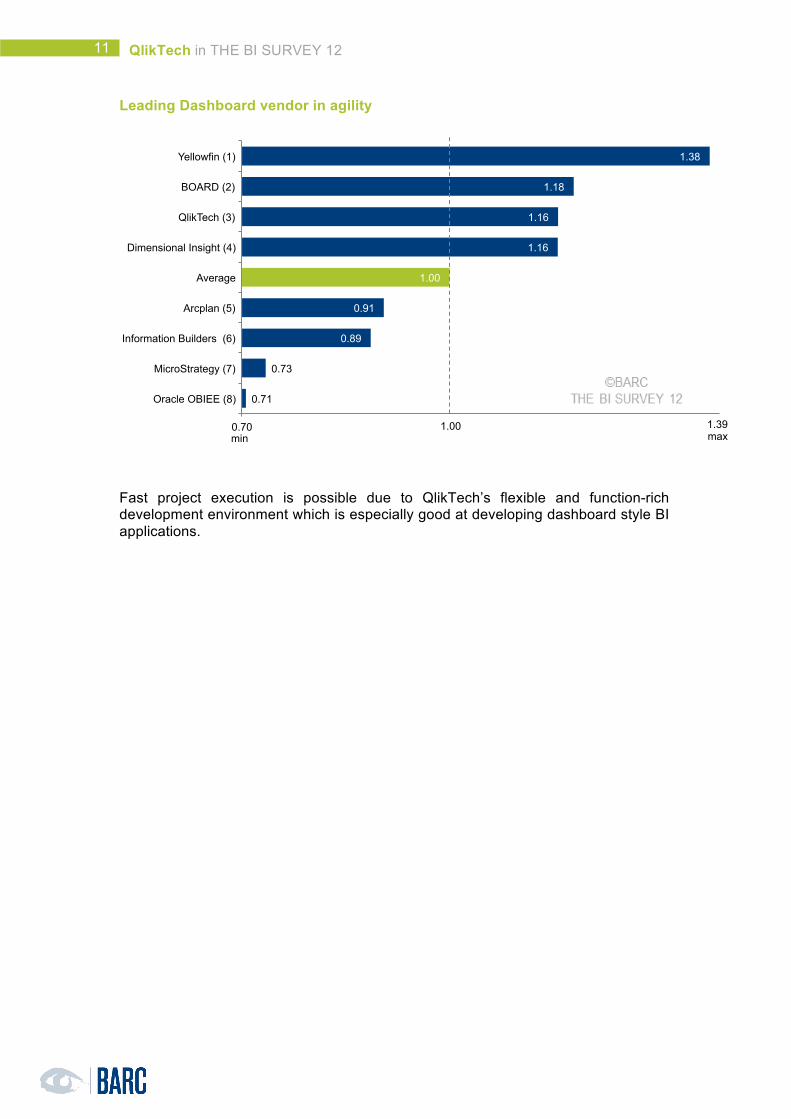
Leading Dashboard vendor in agility
Fast project execution is possible due to QlikTech’s flexible and function-rich development environment which is especially good at developing dashboard style BI applications.
0.71
0.73
0.89
0.91
1.00
1.16
1.16
1.18
1.38
0.70
Oracle OBIEE (8)
MicroStrategy (7)
Information Builders (6)
Arcplan (5)
Average
Dimensional Insight (4)
QlikTech (3)
BOARD (2)
Yellowfin (1)
1.39 max
min
1.00
12 QlikTech in THE BI SURVEY 12
KPI Results for QlikTech in Peer Group “Visual Analysis and Data Discovery vendor”
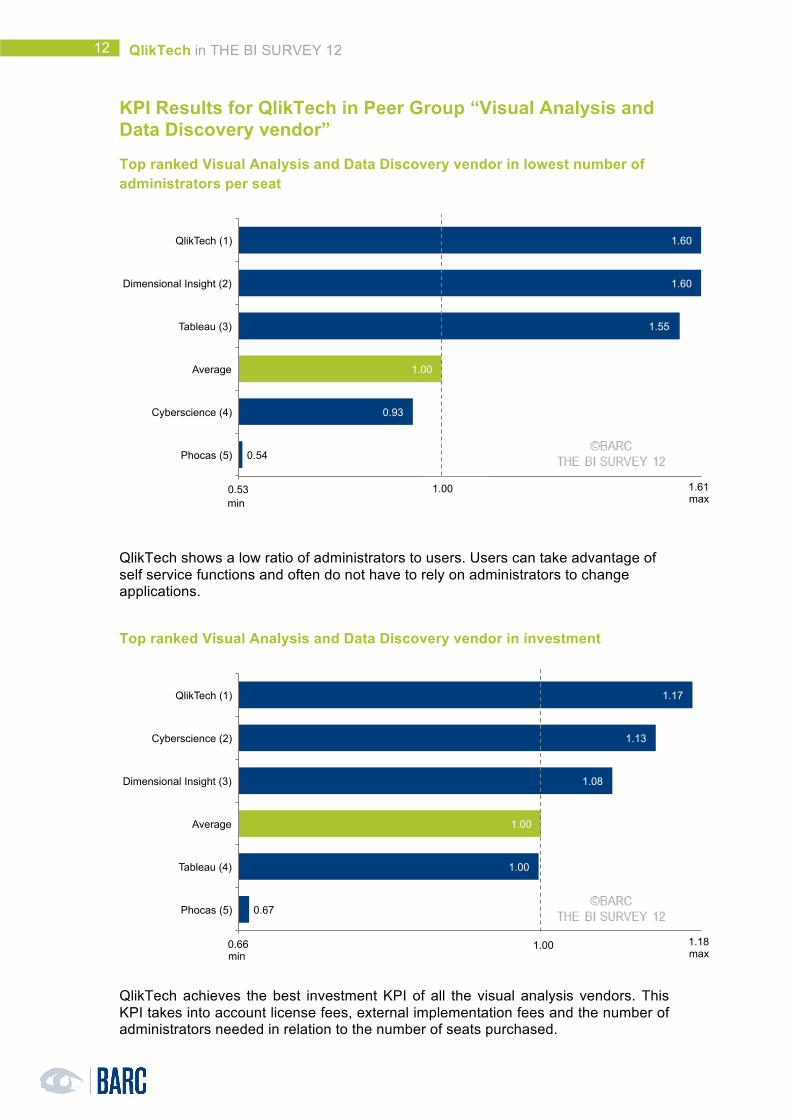
Top ranked Visual Analysis and Data Discovery vendor in lowest number of administrators per seat
QlikTech shows a low ratio of administrators to users. Users can take advantage of self service functions and often do not have to rely on administrators to change applications.
Top ranked Visual Analysis and Data Discovery vendor in investment
QlikTech achieves the best investment KPI of all the visual analysis vendors. This KPI takes into account license fees, external implementation fees and the number of administrators needed in relation to the number of seats purchased.
0.54
0.93
1.00
1.55
1.60
1.60
0.53
Phocas (5)
Cyberscience (4)
Average
Tableau (3)
Dimensional Insight (2)
QlikTech (1)
1.61 max
min
1.00
0.67
1.00
1.00
1.08
1.13
1.17
0.66
Phocas (5)
Tableau (4)
Average
Dimensional Insight (3)
Cyberscience (2)
QlikTech (1)
1.18 max
min
1.00
13 QlikTech in THE BI SURVEY 12
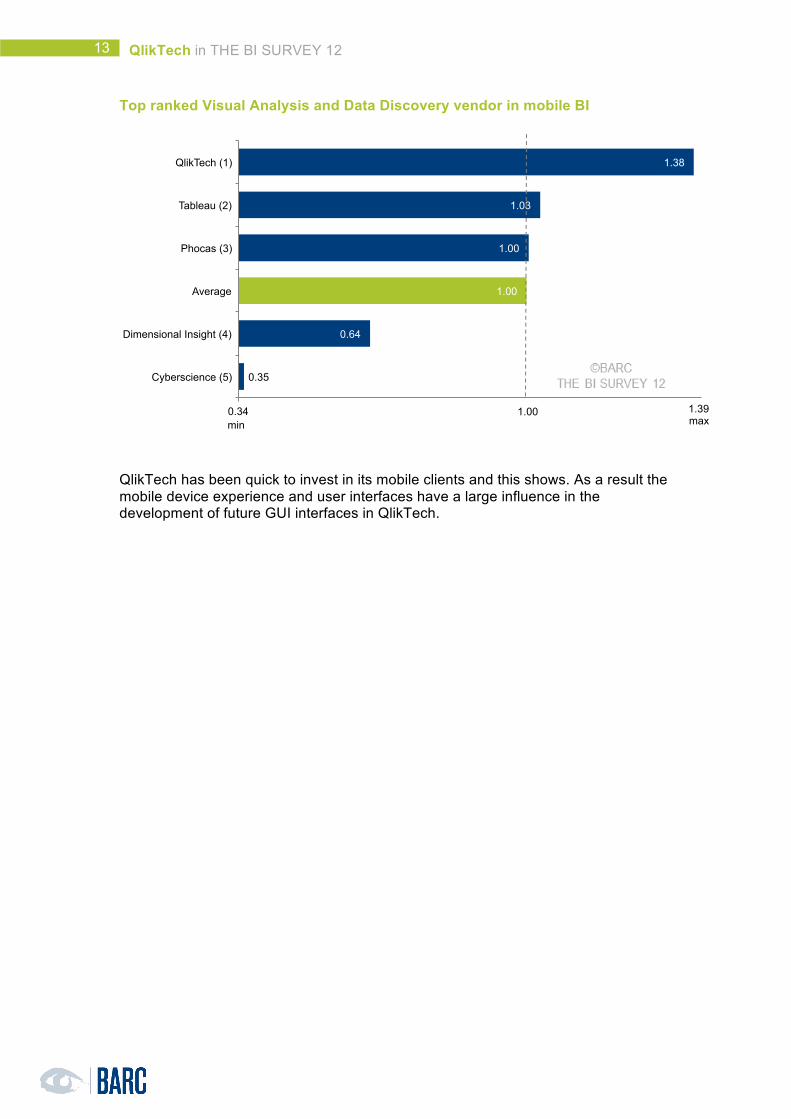
Top ranked Visual Analysis and Data Discovery vendor in mobile BI
QlikTech has been quick to invest in its mobile clients and this shows. As a result the mobile device experience and user interfaces have a large influence in the development of future GUI interfaces in QlikTech.
0.35
0.64
1.00
1.00
1.03
1.38
0.34
Cyberscience (5)
Dimensional Insight (4)
Average
Phocas (3)
Tableau (2)
QlikTech (1)
1.39 max
min
1.00
14 QlikTech in THE BI SURVEY 12
KPI Results for QlikTech in Peer Group “Small and Medium Projects vendor”
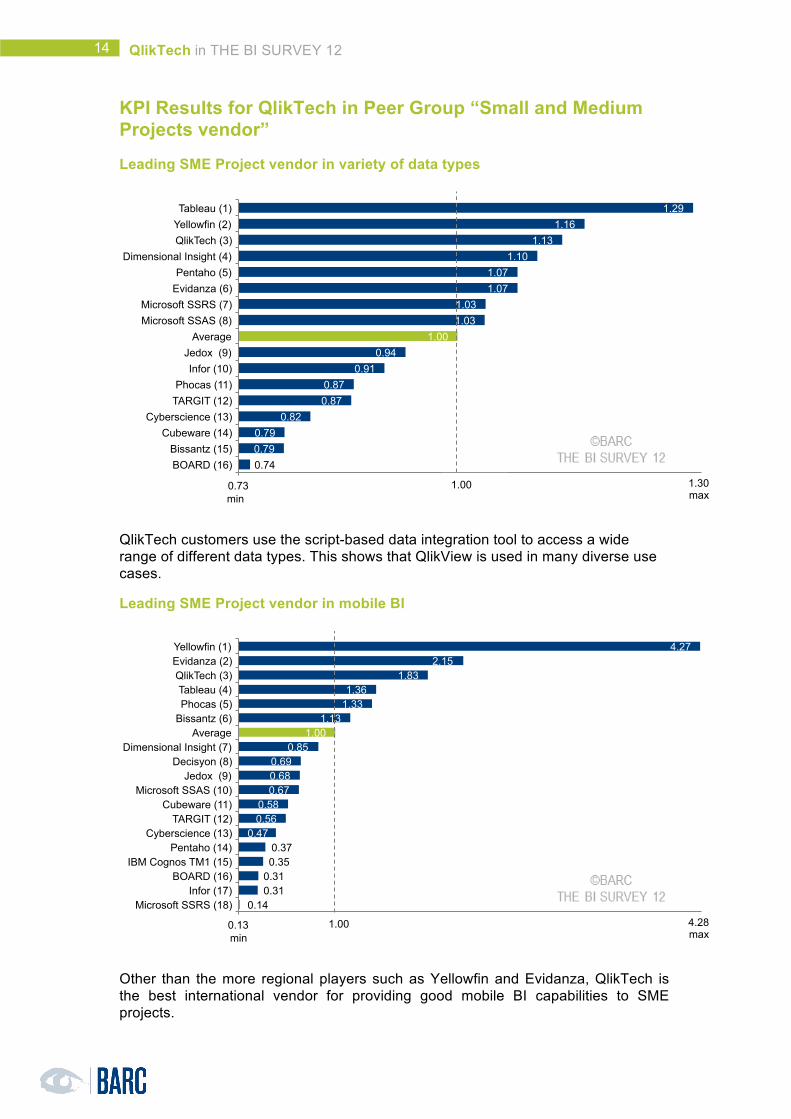
Leading SME Project vendor in variety of data types
QlikTech customers use the script-based data integration tool to access a wide range of different data types. This shows that QlikView is used in many diverse use cases.
Leading SME Project vendor in mobile BI
Other than the more regional players such as Yellowfin and Evidanza, QlikTech is the best international vendor for providing good mobile BI capabilities to SME projects.
0.74 0.79 0.79
0.82 0.87 0.87
0.91 0.94
1.00 1.03 1.03
1.07 1.07
1.10 1.13
1.16 1.29
0.73
BOARD (16) Bissantz (15)
Cubeware (14) Cyberscience (13)
TARGIT (12) Phocas (11)
Infor (10) Jedox (9)
Average Microsoft SSAS (8) Microsoft SSRS (7)
Evidanza (6) Pentaho (5)
Dimensional Insight (4) QlikTech (3) Yellowfin (2) Tableau (1)
1.30 max
min
1.00
0.14 0.31 0.31 0.35 0.37
0.47 0.56 0.58
0.67 0.68 0.69
0.85 1.00
1.13 1.33 1.36
1.83 2.15
4.27
0.13
Microsoft SSRS (18) Infor (17)
BOARD (16) IBM Cognos TM1 (15)
Pentaho (14) Cyberscience (13)
TARGIT (12) Cubeware (11)
Microsoft SSAS (10) Jedox (9)
Decisyon (8) Dimensional Insight (7)
Average Bissantz (6) Phocas (5) Tableau (4)
QlikTech (3) Evidanza (2) Yellowfin (1)
4.28 max
min
1.00
15 QlikTech in THE BI SURVEY 12
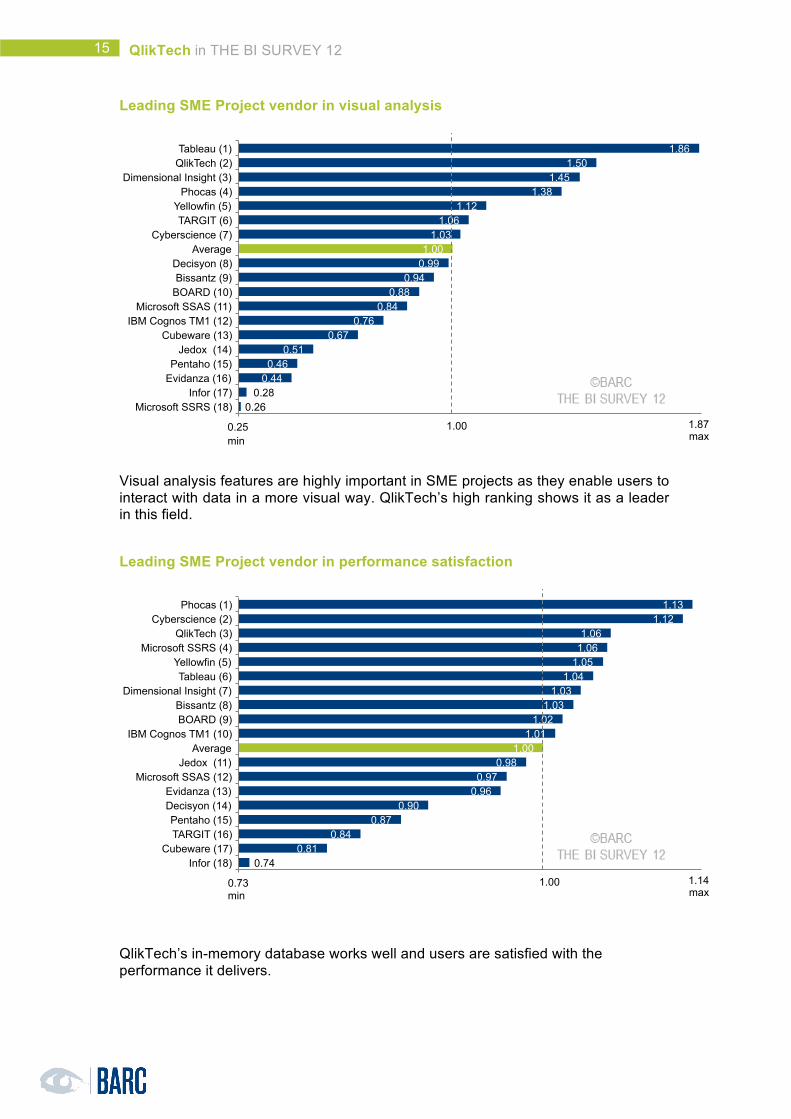
Leading SME Project vendor in visual analysis
Visual analysis features are highly important in SME projects as they enable users to interact with data in a more visual way. QlikTech’s high ranking shows it as a leader in this field.
Leading SME Project vendor in performance satisfaction
QlikTech’s in-memory database works well and users are satisfied with the performance it delivers.
0.26 0.28
0.44 0.46
0.51 0.67
0.76 0.84
0.88 0.94
0.99 1.00
1.03 1.06
1.12 1.38
1.45 1.50
1.86
0.25
Microsoft SSRS (18) Infor (17)
Evidanza (16) Pentaho (15)
Jedox (14) Cubeware (13)
IBM Cognos TM1 (12) Microsoft SSAS (11)
BOARD (10) Bissantz (9)
Decisyon (8) Average
Cyberscience (7) TARGIT (6)
Yellowfin (5) Phocas (4)
Dimensional Insight (3) QlikTech (2) Tableau (1)
1.87 max
min
1.00
0.74 0.81
0.84 0.87
0.90 0.96 0.97
0.98 1.00
1.01 1.02
1.03 1.03
1.04 1.05 1.06 1.06
1.12 1.13
0.73
Infor (18) Cubeware (17)
TARGIT (16) Pentaho (15)
Decisyon (14) Evidanza (13)
Microsoft SSAS (12) Jedox (11)
Average IBM Cognos TM1 (10)
BOARD (9) Bissantz (8)
Dimensional Insight (7) Tableau (6)
Yellowfin (5) Microsoft SSRS (4)
QlikTech (3) Cyberscience (2)
Phocas (1)
1.14 max
min
1.00
16 QlikTech in THE BI SURVEY 12
Summary
The results shown here illustrate that a well thought out and executed go-to-market
strategy can deliver real value to customers. QlikTech scores well in a variety of
areas but it tops the list when it comes to visual analysis, mobile BI and self service
features that serve for agility in BI projects. Compared to other Visual BI and Data
Discovery tools it has the best investment ratios when it comes to license fees,
external implementation spend and administrators needed per seat.
Marketing Statements BI Giant Leading BI Giant in business benefits achieved
Leading BI Giant in goal achievement
Leading BI Giant in business achievement
Leading BI Giant in lowest investment per seat
Leading BI Giant in investment
Leading BI Giant in proportion of employees index
Leading BI Giant in variety of data types
Leading BI Giant in functional scope
Leading BI Giant in competitiveness
Leading BI Giant in user recommendation
Leading BI Giant in cloud BI
Leading BI Giant in mobile BI
Top ranked BI Giant in visual analysis
Top ranked BI Giant in innovation
Leading BI Giant in performance satisfaction
Leading BI Giant in product satisfaction
Leading BI Giant in vendor support
Leading BI Giant in customer satisfaction
Top ranked BI Giant in project length
Top ranked BI Giant in agility
17 QlikTech in THE BI SURVEY 12
Dashboard vendor Leading Dashboard vendor in lowest investment per seat
Leading Dashboard vendor in investment
Leading Dashboard vendor in variety of data types
Leading Dashboard vendor in functional scope
Leading Dashboard vendor in user recommendation
Leading Dashboard vendor in mobile BI
Top ranked Dashboard vendor in visual analysis
Leading Dashboard vendor in innovation
Leading Dashboard vendor in performance satisfaction
Leading Dashboard vendor in project length
Leading Dashboard vendor in agility
Visual Analysis and Data Discovery Leading Visual Analysis and Data Discovery vendor in lowest investment per seat
Top ranked Visual Analysis and Data Discovery vendor in lowest number of
administrators per seat
Top ranked Visual Analysis and Data Discovery vendor in investment
Leading Visual Analysis and Data Discovery vendor in variety of data types
Leading Visual Analysis and Data Discovery vendor in strategic selection
Leading Visual Analysis and Data Discovery vendor in user recommendation
Top ranked Visual Analysis and Data Discovery vendor in mobile BI
Leading Visual Analysis and Data Discovery vendor in visual analysis
Leading Visual Analysis and Data Discovery vendor in performance satisfaction
Leading Visual Analysis and Data Discovery vendor in product satisfaction
18 QlikTech in THE BI SURVEY 12
Small and Medium Projects vendor Leading SME Project vendor in lowest investment per seat
Leading SME Project vendor in lowest number of administrators per seat
Leading SME Project vendor in variety of data types
Leading SME Project vendor in strategic selection
Leading SME Project vendor in mobile BI
Leading SME Project vendor in visual analysis
Leading SME Project vendor in performance satisfaction
19 QlikTech in THE BI SURVEY 12
Copyright © BARC GmbH 2012. All rights reserved. Business Application Research Center - BARC GmbH Steinbachtal 2b 97082 Würzburg Germany +49 (0)931 880651-0