Embed Size (px)
Citation preview

©Copyright Australian Development Strategies 2009 1
Queensland State Election Report - March 21, 2009
Australian Development Strategies Pty Ltd
Sponsored by
©Copyright Australian Development Strategies 2009 2
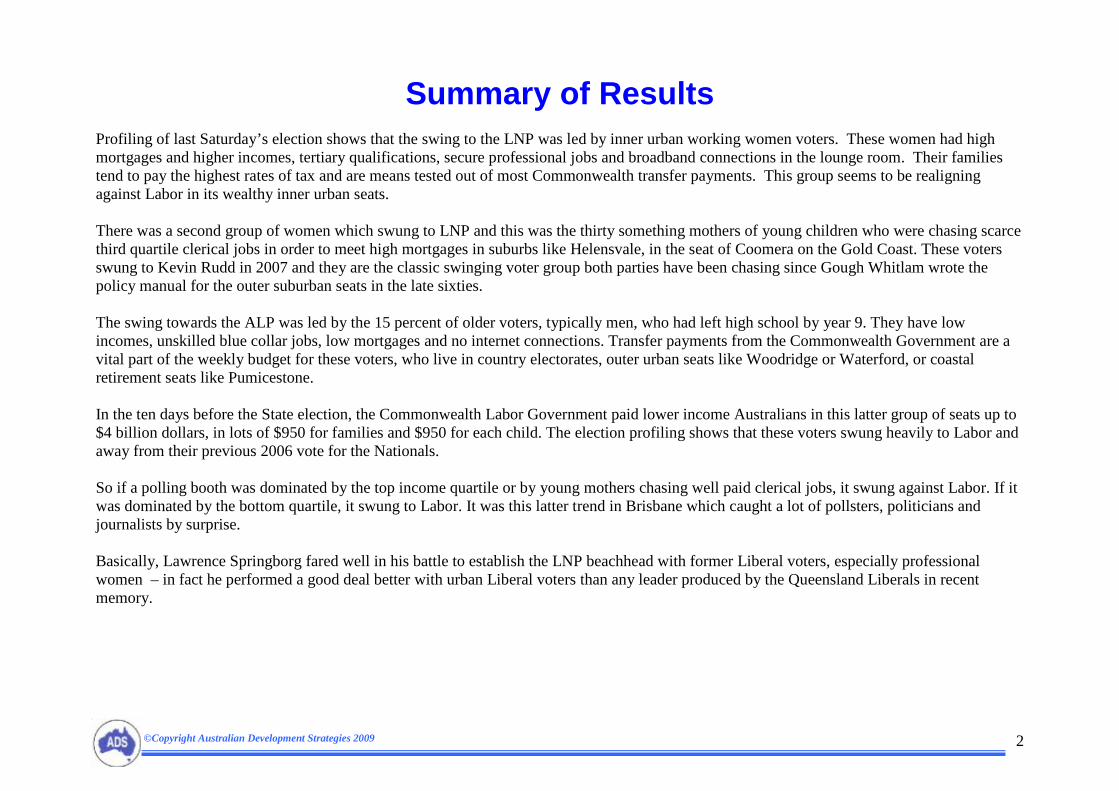
Summary of Results Profiling of last Saturday’s election shows that the swing to the LNP was led by inner urban working women voters. These women had high mortgages and higher incomes, tertiary qualifications, secure professional jobs and broadband connections in the lounge room. Their families tend to pay the highest rates of tax and are means tested out of most Commonwealth transfer payments. This group seems to be realigning against Labor in its wealthy inner urban seats. There was a second group of women which swung to LNP and this was the thirty something mothers of young children who were chasing scarce third quartile clerical jobs in order to meet high mortgages in suburbs like Helensvale, in the seat of Coomera on the Gold Coast. These voters swung to Kevin Rudd in 2007 and they are the classic swinging voter group both parties have been chasing since Gough Whitlam wrote the policy manual for the outer suburban seats in the late sixties. The swing towards the ALP was led by the 15 percent of older voters, typically men, who had left high school by year 9. They have low incomes, unskilled blue collar jobs, low mortgages and no internet connections. Transfer payments from the Commonwealth Government are a vital part of the weekly budget for these voters, who live in country electorates, outer urban seats like Woodridge or Waterford, or coastal retirement seats like Pumicestone. In the ten days before the State election, the Commonwealth Labor Government paid lower income Australians in this latter group of seats up to $4 billion dollars, in lots of $950 for families and $950 for each child. The election profiling shows that these voters swung heavily to Labor and away from their previous 2006 vote for the Nationals. So if a polling booth was dominated by the top income quartile or by young mothers chasing well paid clerical jobs, it swung against Labor. If it was dominated by the bottom quartile, it swung to Labor. It was this latter trend in Brisbane which caught a lot of pollsters, politicians and journalists by surprise. Basically, Lawrence Springborg fared well in his battle to establish the LNP beachhead with former Liberal voters, especially professional women – in fact he performed a good deal better with urban Liberal voters than any leader produced by the Queensland Liberals in recent memory.

©Copyright Australian Development Strategies 2009 3
His problem lay in the rebranding of the former National Party as the Liberal National Party and the associated alienation of unskilled blue collar men who had been prone to support the Nationals in both country and outer urban blue collar seats before 1998. These voters flirted with Pauline Hanson’s One Nation in 1998 and then moved into the group of one in eight Queenslanders voting for both Beattie Labor and the Howard Liberals. Last election this group tended to support Kevin Rudd and in normal circumstances we would have expected them to switch their vote to non Labor at the State level, to make sure they had a State Government to fight Canberra on their behalf. This is the same cycle of political attrition which eventually ground out every State and Territory Liberal Government under John Howard. But not yet in Queensland. The Family Tax beneficiaries of the stimulus swung to Labor; the rich, who seem to resent paying the bill for the stimulus, swung against Labor, as did the young mothers with big mortgages chasing clerical jobs in the current downturn. Labor suffered a net loss of about 4.5 percent primary and preferred vote and ended the election weekend with a slight lead in primary and preferred votes over the LNP but a strong working majority of seats. In terms of predictions, the more detailed demographic regression modelling of the results in each seat explained more of the variation in the 2009 vote than the conventional swing pendulum. This means we could measure the impact of local issues and the value of individual candidates and campaigns, in terms of votes won and lost. The model’s predicted votes showed the worst two results for Labor were in Nicklin and Gympie – basically accounted for by local opposition to Labor’s Traveston Dam – an issue that overwhelmed party profiles in the region. And two seats were predicted as losses for Labor, but won solely by the personal votes of popular sitting Labor Members – Toowoomba North (Kerry Shine) and Broadwater (Peta-Kaye Croft). Similarly, the swing in the seat of Everton looked pretty impressive at over nine percent, but half of this could be put down to the loss of the personal vote of retiring ALP member Rod Welford. The seat that got away from the LNP was Cook, which was a LNP win on the predicted vote and swing, but this is a notoriously difficult seat in which to campaign and the sitting member has a great advantage. Two seats still in the balance at March 31 were Redlands and Chatsworth, which the model correctly predicted on election weekend were too close to call. We also carried out a case study involving modelling of the votes and swings for the ten Gold Coast City seats. Both Coomera and Southport were notional Gold Coast Labor seats in 2006 and were on 58.3 percent ALP 2PP and 58.1 percent ALP 2PP respectively, after the redistribution. So both seats needed swings of a little over eight percent to be lost to the LNP. The swing pendulum had Coomera as the seat at

©Copyright Australian Development Strategies 2009 4
the tipping point of the pendulum – in other words, if Labor had lost Coomera, it would have suffered a big enough swing to lose a majority of seats (including Southport) and we would see a change of Government. Well, Coomera was lost with a correctly predicted swing from the model of some ten percent, more than double that of Southport, but the Government didn’t fall, because swings are never uniform. In this case the big swing in Coomera came about for the simple reason that there were a lot more young families in Coomera paying high mortgages than there were in Southport. Young home buyers with big mortgages need two incomes and this can be a problem for politically volatile 30-34 year old mothers of two children, especially when unemployment is eroding the sort of skilled white collar jobs they are chasing. We know this is happening in seats like Coomera right across Australia, because we are currently profiling both ABS monthly unemployment figures and Fitch Ratings home loan arrears’ summaries. The Coomera suburb of Helensvale, in fact, now has the highest level of 30 day plus arrears (7.8 percent) of any postcode in Australia, as shown in the last Fitch Ratings Report showing mortgage delinquency by postcode. It is little wonder the Coomera predicted swing was the highest of all the Gold Coast seats and one of the highest in the state (third after Cook and Indooroopilly). These young Coomera families swung heavily to Kevin Rudd in 2007, but they swung heavily against Anna Bligh in 2009. The clear message from the recent polls and the Queensland election is that big federal transfer payments drive up the Labor vote, at both state and federal levels, but that the impact dissipates as the money is spent. Higher interest rates however, can last for a long time, along with the political pain they cause in young home buyer seats and to the politicians seen as being responsible - as John Howard and Peter Costello would both know. So the Queensland State poll points to two future problems for the Federal Labor Government. The first is continued swings against Labor in wealthier inner city seats where there seems more than a little downward envy at massive transfer payments. The second is unemployment-driven mortgage stress in outer suburban white collar seats like Coomera. On the up side for the Rudd Government, you wouldn’t want to stand between a voter and a bucket of money, but the Government would be foolish to think that the gratitude will be long lasting, or do anything other than engender a sense of entitlement, such as we are already seeing from pensioners who “missed out” on the March transfer payments.

©Copyright Australian Development Strategies 2009 5
Methodology
The analysis takes as its starting point the Elaborate database assembled by the principals of ADS over 35 years of demographic profiling of economic, social and political behaviour. Elaborate uses Census and modelled data, from a range of sources, including the Australian Bureau of Statistics, Labor Force Statistics, Household Expenditure Surveys, the Australian Taxation Office and Centrelink.
The Database contains some 500 variables and includes a core of basic variables including Age, Income, Occupation, Industry, Home Ownership, Household Type, Mortgage and Rent, Travel to Work, Vehicles, Employment Status, Religion, Internet Use, Current Education, Education Level Attained, Field of Study, Qualifications, Language Spoken at Home and Family Type.
The primary units in the Database are Census Collectors Districts, or CCDs, comprising about 220 household neighbourhoods, which are small enough to provide a fine grained demographic picture of Australia, through 38,000 CCDs. Other units include polling booth catchments, postcodes, and state and federal electoral boundaries. We always try to use the smallest units we can find, but in federal and state elections, this creates problems with the allocation of non-booth votes to spatial boundaries.
We use SPSS Statistical analysis to compare this Elaborate database, with appropriate dependent variables, in this case, ALP 2PP 2009 vote and the 2006-2009 2PP swing. These correlations provide the basis of the stereotype tables and the correlation charts in the results section below.
Relevant correlations are then processed in an SPSS package in a Step-Wise Multiple Linear Regression, to generate regression equations which use the demographic picture of vote and swing, to predict what level of vote and swing there should be in each state seat. The difference between the predicted and observed votes, the residual, is then calculated.

©Copyright Australian Development Strategies 2009 6
Stereotypes
Tables below show selected top positive and negative correlations between database variables and political variables in the analysis, with the means for each variable for Australia. Each table is a brief snapshot of the party’s typical voter. The Australian means enable the reader to gauge the significance of each variable in the stereotype. What we are looking for here is strong correlations with bigger groups. Correlations are a descriptive tool only, and not necessarily analytical. But they tell you a lot about your target voters in your key seats and if you attract the votes of enough of them in key seats, you win the election. For example, we see in Table 1, that families with no internet connection in 2009 lived in booths which swung strongly to the ALP, and families with broadband lived in booths which swung strongly to the LNP. The web wasn’t a political driver here, or a causal factor; instead a lack of internet is a tag for lower income families who draw on family tax payments and live in the country or in low income outer urban seats, whereas the families with broadband tend to live in wealthier city suburbs. So the internet status is a clue to tell us what we should be looking at and testing in the more detailed analysis. As always, it’s about the money. Governments pass laws to take money from some voters and spend it on other voters and, while the recipients tend to be pretty sanguine about this relationship, the ones paying the money can get a little agitated if they feel themselves missing out. The above families without the web were the major beneficiaries of the fiscal stimulus in December and March. They swung towards the Labor Government at the election. So what about those paying the bill for this Government generosity? In Table 2, we see persons paying $3000 plus per month for their mortgage in 2006 comprised the variable most strongly correlated with the swing against Labor and this variable seems to have had some causal value in the current analysis. It was first into the follow up regression analysis and it remained for all steps when we carried out a detailed study of the swing. As we said, this election was all about the money. In this case, the money paid directly to voters from the Commonwealth.
©Copyright Australian Development Strategies 2009 7
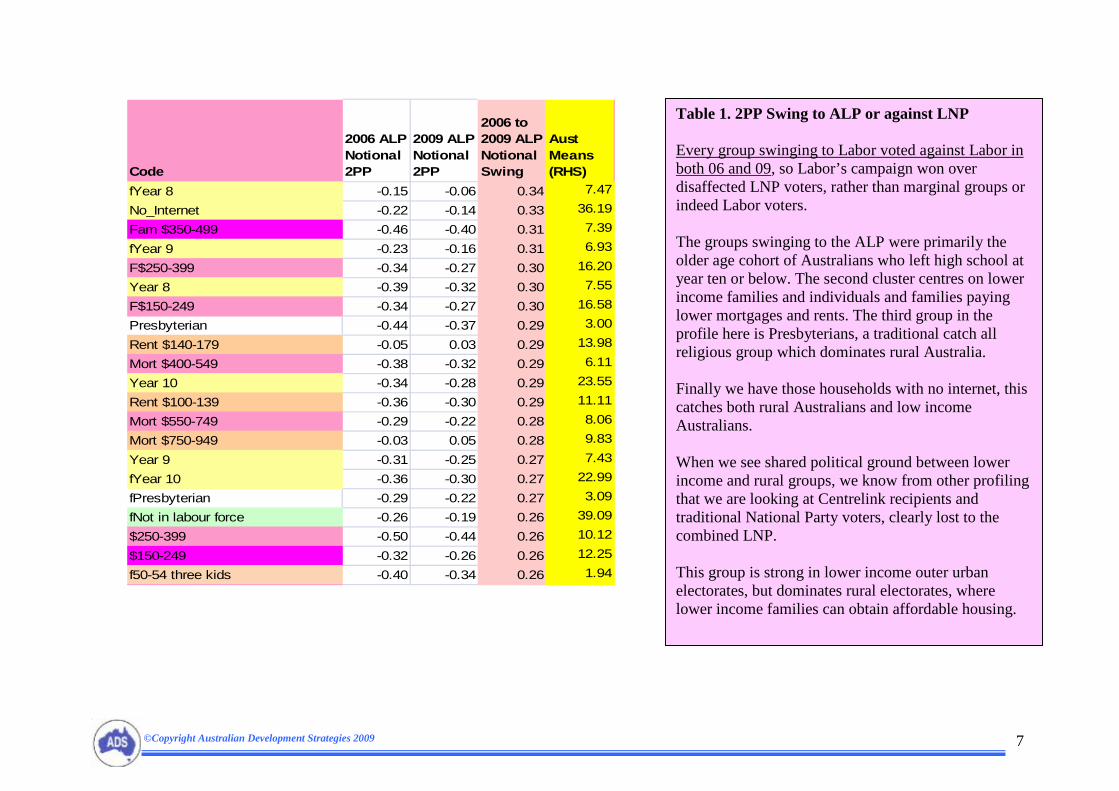
Table 1. 2PP Swing to ALP or against LNP Every group swinging to Labor voted against Labor in both 06 and 09, so Labor’s campaign won over disaffected LNP voters, rather than marginal groups or indeed Labor voters. The groups swinging to the ALP were primarily the older age cohort of Australians who left high school at year ten or below. The second cluster centres on lower income families and individuals and families paying lower mortgages and rents. The third group in the profile here is Presbyterians, a traditional catch all religious group which dominates rural Australia. Finally we have those households with no internet, this catches both rural Australians and low income Australians. When we see shared political ground between lower income and rural groups, we know from other profiling that we are looking at Centrelink recipients and traditional National Party voters, clearly lost to the combined LNP. This group is strong in lower income outer urban electorates, but dominates rural electorates, where lower income families can obtain affordable housing.
Code
2006 ALP Notional 2PP
2009 ALP Notional 2PP
2006 to 2009 ALP Notional Swing
Aust Means (RHS)
fYear 8 -0.15 -0.06 0.34 7.47
No_Internet -0.22 -0.14 0.33 36.19
Fam $350-499 -0.46 -0.40 0.31 7.39
fYear 9 -0.23 -0.16 0.31 6.93
F$250-399 -0.34 -0.27 0.30 16.20
Year 8 -0.39 -0.32 0.30 7.55
F$150-249 -0.34 -0.27 0.30 16.58
Presbyterian -0.44 -0.37 0.29 3.00
Rent $140-179 -0.05 0.03 0.29 13.98
Mort $400-549 -0.38 -0.32 0.29 6.11
Year 10 -0.34 -0.28 0.29 23.55
Rent $100-139 -0.36 -0.30 0.29 11.11
Mort $550-749 -0.29 -0.22 0.28 8.06
Mort $750-949 -0.03 0.05 0.28 9.83
Year 9 -0.31 -0.25 0.27 7.43
fYear 10 -0.36 -0.30 0.27 22.99
fPresbyterian -0.29 -0.22 0.27 3.09
fNot in labour force -0.26 -0.19 0.26 39.09
$250-399 -0.50 -0.44 0.26 10.12
$150-249 -0.32 -0.26 0.26 12.25
f50-54 three kids -0.40 -0.34 0.26 1.94

©Copyright Australian Development Strategies 2009 8
Table 2. Swing against ALP or towards LNP. There is a reason why the previous chart featured shades of pink and light brown, as these are the colours we use to code the bottom two quartiles for income related variables. This chart features a lot blue, which we use to code the top two quartiles for income related variables, such as income itself, mortgage and rent. We see here the total flip side of the earlier stereotype: the well paid, the cosmopolitan with a splash of high achieving Asian and US born, the city based with Broadband connections and public transport use, the well educated, including University students, and those paying the top seven percent of mortgages. If we see finance workers, combined with top incomes, top mortgages and management and commerce tertiary qualifications, we are clearly looking at a stereotype of the top end of the demographic pyramid living in the top priced inner city homes and apartments – the group which has not fared well from recent unemployment increases and which perhaps has some downward envy at the targeting of stimulus payments towards the bottom quartile. Whatever the motivations, the ALP lost support in its richer inner city seats against the new LNP although the group of top mortgage payers was neutral in 06, swinging LNP in 06 to 09 and almost significantly negative in 09. Labor will find it harder to win its inner city seats if this pattern persists, as most working class Labor voters left the inner city Labor seats over the past 30 years, to be replaced by wealthy professionals seeking a CBD centred lifestyle.
Code
2006 ALP Notional 2PP
2009 ALP Notional 2PP
2006 to 2009 ALP Notional Swing
Aust Means (RHS)
Mort $3000+ -0.01 -0.12 -0.39 7.23
Broadband 0.43 0.36 -0.33 37.33
fSingapore 0.15 0.06 -0.33 0.21
Indonesia 0.20 0.12 -0.33 0.22
fYear 12 0.27 0.19 -0.31 42.08
Finance 0.23 0.15 -0.31 2.91
Italian 0.08 0.00 -0.31 1.49
Med indiv income 0.36 0.29 -0.31 $483
Med mortgage 0.21 0.14 -0.30 $1,300
Med hhold inc 0.32 0.25 -0.30 $1,030
fUSA -0.09 -0.18 -0.30 0.32
Year 12 0.31 0.24 -0.30 40.21
fosManagement & Commerce 0.23 0.16 -0.29 11.03
Indonesian 0.12 0.05 -0.29 0.18
Med family inc 0.29 0.22 -0.29 $1,215
fIndonesian 0.18 0.10 -0.29 0.21
Employed part time 0.03 -0.05 -0.28 10.84
F$2000+ -0.07 -0.15 -0.28 1.51
fMalaysia 0.23 0.16 -0.27 0.47
Italy 0.07 0.00 -0.27 1.01
F$1600-1999 0.15 0.08 -0.27 1.23
Train 0.44 0.38 -0.27 3.00
Singapore 0.15 0.08 -0.27 0.17
University 0.24 0.18 -0.27 3.60

©Copyright Australian Development Strategies 2009 9
Table 3. ALP 2009 2PP vote. This is the stereotype of the typical groups of Labor voters in 2009. As the reader can see, it’s very close to the 2006 stereotype (correlation plus 0.96). The State ALP in 06 and 09 dominated the third quartile income and mortgage groups and the ALP support tapered off in the second and top quartiles. The strength of both the Howard Battler and Beattie profiles lay in their ability to attract support from the bottom two quartiles and Kevin Rudd won considerable support from this group. We don’t see any signs of the Table 1 groups swinging to Labor from 06 to 09 in this stereotype as these groups simply became less strongly identified with the LNP. The huge third income quartile female clerical and admin group highlighted in red is now the major source of support for the ALP, rather than its former base of skilled blue collar men. Some more traditional Labor voters remain however in the bottom half of the income range and can also be seen in the big transport and wholesale groups, as well as state public housing tenants. One interesting strategic group here is the couples in their early thirties – this is traditionally the key outer urban group of swinging voters, responsible for one third of the swings across all seats since the 1960s. Parties need it to win elections. This swinging voter group supported Labor in both 06 and 09, although that support declined significantly – this basically means Labor lost the campaign where it needed to win but held onto enough support to survive.
Code
2006 ALP Notional 2PP
2009 ALP Notional 2PP
2006 to 2009 ALP Notional Swing
Aust Means (RHS)
Mort $1400-1599 0.63 0.59 -0.22 7.26
Rented State 0.53 0.57 0.07 3.97
fTagalog ex Fil 0.54 0.55 -0.04 0.27
Clerical & administrative 0.56 0.55 -0.14 5.92
Fam $1400-1699 0.54 0.53 -0.10 7.81
fClerical & administrative 0.53 0.53 -0.10 23.63
Transport 0.46 0.52 0.15 6.49
fPhilippines 0.51 0.52 -0.04 0.70
TAFE 0.49 0.52 0.01 2.10
Wholesale 0.47 0.52 0.08 4.91
F$600-799 0.55 0.50 -0.25 9.42
fSpanish 0.51 0.50 -0.14 0.44
Single Parent kids over 15 0.46 0.49 0.05 7.03
fMormons 0.46 0.49 0.05 0.25
Philippines 0.50 0.49 -0.11 0.35
fFiji 0.49 0.49 -0.08 0.22
f30-34 one kid 0.51 0.48 -0.17 1.66
Mort $1200-1399 0.46 0.48 0.00 9.58
$800-999 0.49 0.47 -0.14 9.22
30-34 0.51 0.47 -0.20 6.93
f30-34 0.50 0.47 -0.18 7.07

©Copyright Australian Development Strategies 2009 10
Table 4. LNP 2PP Vote. The point to note here is that the strongest LNP voters, or weakest ALP voters, with one exception (Managers) all swung to the ALP. So the LNP lost across the board support from its heartland voters, especially from the traditional National Party stereotype. This charts reads like a demographic map of the former National Party – the older farmers in agriculture, called managers in the occupation chart, working at home, usually as lone couples after the kids have moved to the cities, living in homes they’ve long since paid off, or in lower rent homes if they are on Centrelink. The only reason that Managers would not have swung to Labor as well, is that this group includes senior administrators and small business types in the urban areas and these well paid groups swung back to the LNP. No broadband is available for these voters so they make do with dial up. They tend to register as Anglicans in the census. The interesting footnote here is the presence of female Field of Study persons such as doctors and nurses (we can only tell here that they studied in the health area) and teachers. This voting profile conflicts with Industry charts shown later, due to the presence of more ALP oriented non professionals working in those industries.
Code
2006 ALP Notional 2PP
2009 ALP Notional 2PP
2006 to 2009 ALP Notional Swing
Aust Means (RHS)
Worked at home -0.68 -0.69 0.07 6.00
Managers -0.64 -0.67 -0.02 17.45
Fully Owned -0.69 -0.66 0.21 34.96
60-64 -0.62 -0.61 0.11 5.19
fManagers -0.60 -0.61 0.05 11.13
p55-64 Married -0.61 -0.60 0.12 9.86
Two Person Home -0.58 -0.59 0.06 34.45
65-69 -0.62 -0.59 0.20 4.07
f60-64 -0.59 -0.57 0.17 4.98
fosAgriculture & Environment -0.57 -0.56 0.13 4.09
f60-64 three kids -0.59 -0.56 0.21 1.55
Med age -0.58 -0.55 0.16 37.63
Med age -0.58 -0.55 0.16 37.63
Dial up -0.57 -0.55 0.15 22.56
Agriculture\ forestry & fishing -0.55 -0.55 0.11 6.77
fosfEducation -0.54 -0.54 0.09 11.81
p65-74 Married -0.57 -0.54 0.20 5.88
55-59 -0.54 -0.54 0.10 6.52
f55-59 -0.53 -0.51 0.14 6.40
Mort Not Stated -0.50 -0.50 0.05 9.42
Family no kids -0.49 -0.50 0.01 39.40
f65-69 three kids -0.52 -0.50 0.16 1.22
fAnglican -0.51 -0.49 0.14 19.51
fAgriculture\ forestry & fishing -0.50 -0.49 0.11 4.06
Anglican -0.50 -0.48 0.13 18.10
Rent $0-49 -0.47 -0.47 0.07 9.46
fosfHealth -0.48 -0.47 0.09 14.26
Fam $1-149 -0.50 -0.47 0.17 1.18

©Copyright Australian Development Strategies 2009 11
Correlation charts The correlation charts below show the strength of the relationship between votes and the Elaborate Database, for most of the 500 variables, presented in various categories, starting with Current Education. The charts are in standard excel format, with correlations for the ALP 2PP votes shown in light pink bars or lines, with the 2PP 2006-2009 Swing shown in dark pink. The Australian means for each corresponding variable are shown below in yellow, with the relevant figure on the right axis.
Correlation charts should be read the same way as the worm debating chart – the zero line is neutral and the score heightens as the correlation increases its distance above or below the zero line. Correlations above the line indicate a positive relationship and correlations below the line show a negative relationship. The significance levels vary according to the number of pairs and we would advise the reader not to get too excited about any correlations below plus or minus .20. Similarly, the reader should be cautious about high correlations from variables with a very low mean, from the more esoteric religions, or unusual countries of birth or languages spoken at home. This is an arbitrary call, but, if it’s less than about half of one percent of the population, it’s usually pretty meaningless. In summary, we are looking in the charts for longer vertical bars or trend lines, above or below 0.20, consistent patterns across each chart and big population numbers. The descriptive information for each chart will tend to be found in the explanatory boxes within the charts themselves, with the important ones highlighted in colour. The information alongside the table number will tend to be more in the nature of comments or conclusions. When this is highlighted in colour, it is very important in terms of its contribution to the total profile. If the stereotype tables are snapshots, the following charts can be seen as small pictures, which can then be combined to make up a fine-grained demographic portrait of each political variable under scrutiny. We emphasize that we’re looking here at what happened to the actual votes, in terms of who lived in what area, we’re not looking survey results from an opinion poll. So causality has to be inferred. But at least we know we’re dealing with the total population rather than a sample, and we are able to break it up into credible and reasonably objective units for preliminary analysis and subsequent attitudinal research.

©Copyright Australian Development Strategies 2009 12
0.00
5.00
10.00
15.00
20.00
25.00
30.00
35.00
40.00
-0.80
-0.60
-0.40
-0.20
0.00
0.20
0.40
0.60
Current Education
2006 ALP Notional 2PP 2009 ALP Notional 2PP 2006 to 2009 ALP Notional Swing Aust Means (RHS)
University Students were the only Current Ed group to significantly swing in 2009 - against Labor (in urban seats).
TAFE studentsand parents of Catholic students supported Labor in 06 and 09 - but did not swing to Labor.
Chart 1. University students swung strongly to the LNP Leader who left school at 14. This could simply be a reflection of the
swing towards the LNP of wealthier parents of University students, but it’s worth further study.
©Copyright Australian Development Strategies 2009 13
0.00
20.00
40.00
60.00
80.00
100.00
120.00
140.00
160.00
180.00
-0.80
-0.60
-0.40
-0.20
0.00
0.20
0.40
0.60
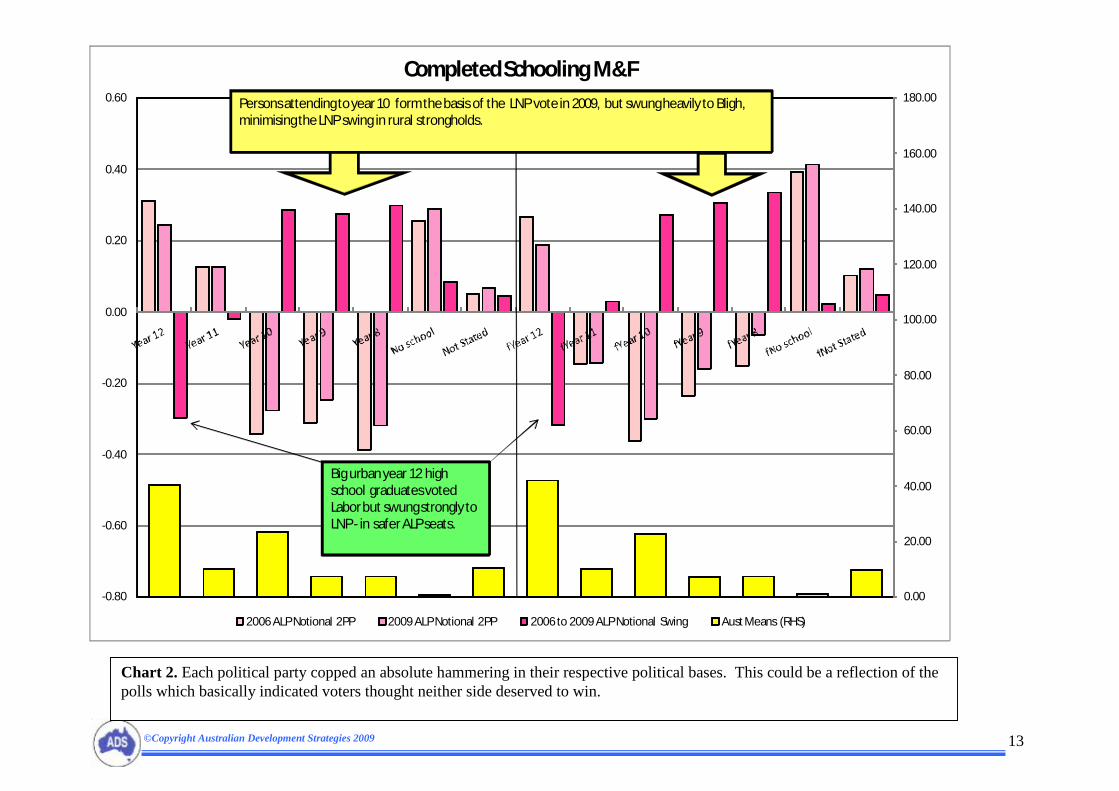
Completed Schooling M&F
2006 ALP Notional 2PP 2009 ALP Notional 2PP 2006 to 2009 ALP Notional Swing Aust Means (RHS)
Persons attending to year 10 form the basis of the LNP vote in 2009, but swung heavily to Bligh, minimising the LNP swing in rural strongholds.
Big urban year 12 high school graduates voted Labor but swung strongly to LNP - in safer ALP seats.
Chart 2. Each political party copped an absolute hammering in their respective political bases. This could be a reflection of the polls which basically indicated voters thought neither side deserved to win.

©Copyright Australian Development Strategies 2009 14
0.00
10.00
20.00
30.00
40.00
50.00
60.00
70.00
80.00
-0.80
-0.60
-0.40
-0.20
0.00
0.20
0.40
0.60
0-4 5-9 10-14 15-19 20-24 25-29 30-34 35-39 40-44 45-49 50-54 55-59 60-64 65-69 70-74 75-79 80+
Age Male
Aust Means (RHS) 2006 ALP Notional 2PP 2009 ALP Notional 2PP 2006 to 2009 ALP Notional Swing
ALP vote dropped with 20somethings in strong ALP inner city areas.
ALP vote rose in older areas, typically LNP strongholds in rural seats.
Chart 3. There was a big pro LNP swing in the city seats from younger ALP groups – including the very important thirty something men - and a low swing to the LNP in the country seats from older LNP voters.

©Copyright Australian Development Strategies 2009 15
0.00
10.00
20.00
30.00
40.00
50.00
60.00
70.00
80.00
-0.80
-0.60
-0.40
-0.20
0.00
0.20
0.40
0.60
f0-4 f5-9 f10-14 f15-19 f20-24 f25-29 f30-34 f35-39 f40-44 f45-49 f50-54 f55-59 f60-64 f65-69 f70-74 f75-79 f80+
Age Female
Aust Means (RHS) 2006 ALP Notional 2PP 2009 ALP Notional 2PP 2006 to 2009 ALP Notional Swing
Female Age chart behaved same as for Males - there was regression towards the normal in both LNP and ALP strongholds, minimising impact in marginal seats.
Chart 4. We see here some signs of a marginal swing to the LNP from the volatile group of 30 something women. What we need
to study more closely is the break down between women with and without children, in the following chart.

©Copyright Australian Development Strategies 2009 16
0.00
5.00
10.00
15.00
20.00
25.00
30.00
35.00
40.00
-0.80
-0.60
-0.40
-0.20
0.00
0.20
0.40
0.60
Kids by Age of Mother
2006 ALP Notional 2PP 2009 ALP Notional 2PP 2006 to 2009 ALP Notional Swing Aust Means (RHS)
Women voters aged less than 39 tended to live in stronger Labor seats, but those with no children and more secure jobs swung heavily against the Bligh Government - in exactly the same fashionthat we saw in November 2007.
But unlike 2007, those 'working families' with children, did not swing to state Labor in outer urban seats - at least not to a significant degree.
Chart 5. Bligh Labor lost heavily among professional women with secure jobs and no kids, as did Kevin Rudd in late 2007. But
unlike Rudd, Bligh failed to win over significant swings from the outer urban “working families” captured by Rudd. In fact there are signs here of this swinging voter demographic moving to the LNP. The regression analysis below takes this further.

©Copyright Australian Development Strategies 2009 17
0.00
10.00
20.00
30.00
40.00
50.00
60.00
70.00
80.00
-0.60
-0.40
-0.20
0.00
0.20
0.40
0.60
Income Male
Aust Means (RHS) 2006 ALP Notional 2PP 2009 ALP Notional 2PP 2006 to 2009 ALP Notional Swing
Labor picked up swings from low income LNP strongholds which received big Centrelink payments in the election period, but lost support in higher income Labor strongholds, where they had worked out who was paying for the bonuses.
Chart 6. Labor won swings from the (formerly) solid National Party group of Centrelink recipients and unskilled blue collar workers, which is why the swings against Labor were low in both working class and rural seats, but lost heavily in top quartiles.

©Copyright Australian Development Strategies 2009 18
0.00
10.00
20.00
30.00
40.00
50.00
60.00
70.00
80.00
-0.40
-0.30
-0.20
-0.10
0.00
0.10
0.20
0.30
0.40
0.50
0.60
Income Female
Aust Means (RHS) 2006 ALP Notional 2PP 2009 ALP Notional 2PP 2006 to 2009 ALP Notional Swing
Election eve cash transfer payments from the national Labor Government gained big swings for State Labor from welfare linked male and female income groups -as shown here - and foreshadowed by the six percent jump in State Labor's December 08 Newspoll vote during the Christmas transfer payments.
The swing here against Labor in the professional pro ALP urban booths was countered by a pro Labor swing in poorer areas - typically rural, but often just down the hill from wealthier urban neighborhoods.
Chart 7. Perhaps well paid women don’t like paying taxes for the economic stimulus. Or the chart could show disaffection with the State ALP. Or both. Before the election, payments were concentrated on those groups in the bottom three quartiles.

©Copyright Australian Development Strategies 2009 19
0.00
10.00
20.00
30.00
40.00
50.00
60.00
70.00
80.00
-0.60
-0.40
-0.20
0.00
0.20
0.40
0.60
Family Income
Aust Means (RHS) 2006 ALP Notional 2PP 2009 ALP Notional 2PP 2006 to 2009 ALP Notional Swing
Familieson Welfare still supported LNP in their safe rural seats in 09, but swung strongly to ALP 06-09.
Unskilledblue collar workers and self employed tradies swung to ALP in outer urban seats
Wealthy professionalfamilies swung to LNP in safe ALP inner urban seats
Chart 8. Labor lost votes where it could afford to lose them – in its safer, rich inner city seats. Labor won enough support to protect its marginal outer urban and country seats from the traditional lower paid National Party voters lost to the new LNP.

©Copyright Australian Development Strategies 2009 20
0.00
50.00
100.00
150.00
200.00
250.00
-0.80
-0.60
-0.40
-0.20
0.00
0.20
0.40
0.60
Birthplace Male
2006 ALP Notional 2PP 2009 ALP Notional 2PP 2006 to 2009 ALP Notional Swing Aust Means (RHS)
ALP lost support heavily from its urban ethnic strongholds, but gained the big former National rural demographic - Australian born.
Chart 9. LNP gains a more cosmopolitan profile from Labor, while Labor wins the WASPs from the old Nationals.

©Copyright Australian Development Strategies 2009 21
0.00
50.00
100.00
150.00
200.00
250.00
-0.80
-0.60
-0.40
-0.20
0.00
0.20
0.40
0.60
Birthplace Female
2006 ALP Notional 2PP 2009 ALP Notional 2PP 2006 to 2009 ALP Notional Swing Aust Means (RHS)
Chart 10. Same as for males. This swing to Labor from the huge Australian born group provided a big flat gross swing to Labor across all seats which was countered by gross swings the other way from migrant groups and the urban rich.

©Copyright Australian Development Strategies 2009 22
0.00
10.00
20.00
30.00
40.00
50.00
60.00
70.00
80.00
90.00
100.00
-0.80
-0.60
-0.40
-0.20
0.00
0.20
0.40
0.60
Religion Male
2006 ALP Notional 2PP 2009 ALP Notional 2PP 2006 to 2009 ALP Notional Swing Aust Means (RHS)
Labormade significant gains from National strongholds of Presbyterian and Uniting Church followers.
Chart 11. Not a lot happening here, apart from Labor picking up some traditionally strong LNP religious groups.

©Copyright Australian Development Strategies 2009 23
Chart 12. Same as for males, except females in the Salvation Army liked Labor. And we know the Brethren apparently don’t vote, but they show up in the profiles as having some influence, perhaps with neighbors.
0.00
10.00
20.00
30.00
40.00
50.00
60.00
70.00
80.00
90.00
100.00
-0.80
-0.60
-0.40
-0.20
0.00
0.20
0.40
0.60
Religion Female
2006 ALP Notional 2PP 2009 ALP Notional 2PP 2006 to 2009 ALP Notional Swing Aust Means (RHS)

©Copyright Australian Development Strategies 2009 24
0.00
50.00
100.00
150.00
200.00
-1.00
-0.80
-0.60
-0.40
-0.20
0.00
0.20
0.40
0.60
Language at Home Males
2006 ALP Notional 2PP 2009 ALP Notional 2PP 2006 to 2009 ALP Notional Swing Aust Means (RHS)
Confirms Birthplace charts - LNP made big gains across broad ethnic base of Labor supporters in the cities, but failed to hold its rural base of English speaking, Australian born.
Chart 13. ALP moved more towards mainstream Australian born and English speaking groups in 09, losing some of its diverse
ethnic composition to a more cosmopolitan LNP.

©Copyright Australian Development Strategies 2009 25
0.00
50.00
100.00
150.00
200.00
-1.00
-0.80
-0.60
-0.40
-0.20
0.00
0.20
0.40
0.60
Language at Home Females
2006 ALP Notional 2PP 2009 ALP Notional 2PP 2006 to 2009 ALP Notional Swing Aust Means (RHS)
Chart 14. Pretty much the same as for males. Same comments apply.

©Copyright Australian Development Strategies 2009 26
0.00
20.00
40.00
60.00
80.00
100.00
120.00
140.00
160.00
180.00
200.00
-0.80
-0.60
-0.40
-0.20
0.00
0.20
0.40
0.60
Internet Connection
2006 ALP Notional 2PP 2009 ALP Notional 2PP 2006 to 2009 ALP Notional Swing Aust Means (RHS)
Labor won heavily from welfare-linked no internet group.
Labor lost heavily from urban based professional group of broadband subscribers - who remained strong Labor voters, but less so in 09.
Chart 15. One in three Australian families didn’t have the internet at Census time, August 2006 and these Australians tended to be on transfer payments or in unskilled blue collar jobs and living in low income outer urban or rural suburbs. They swung to Labor in 09, which is why the anti Labor swings tended to be smaller in the working class outer urban and old National Party rural seats.

©Copyright Australian Development Strategies 2009 27
0.00
20.00
40.00
60.00
80.00
100.00
120.00
140.00
160.00
180.00
200.00
-0.80
-0.60
-0.40
-0.20
0.00
0.20
0.40
Qualifications M&F
2006 ALP Notional 2PP 2009 ALP Notional 2PP 2006 to 2009 ALP Notional Swing Aust Means (RHS)
Laborgained swings from booths containing skilled and semi skilled blue collar workers with certificate qualifications, and lost votes from booths in professional suburbs with high proportion of tertiary graduates.
Chart 16. The Certificate qualified males are a big blue collar group which swung to Labor. Males and females with tertiary
qualifications swung towards the Springborg led LNP. Leaving school at 14 did Springborg no harm winning a larger share of the graduate vote than had been won by the old Queensland State Liberal Party, when it was led by a GP.

©Copyright Australian Development Strategies 2009 28
0.00
20.00
40.00
60.00
80.00
100.00
120.00
140.00
160.00
180.00
200.00
-0.80
-0.60
-0.40
-0.20
0.00
0.20
0.40
Employment M&F
2006 ALP Notional 2PP 2009 ALP Notional 2PP 2006 to 2009 ALP Notional Swing Aust Means (RHS)
Labor's policy on employment , plus bonus payments from Commonwealth, drove non sign swings to Labor from unemployed males. Female workers however swung to the LNP across the board.
Chart 17. Men working part time swung strongly to the LNP. The only thing stopping a wipeout in terms of significant swings for State Labor from Labor oriented working women was … well … nothing really. Women not in the workforce swung to ALP.

©Copyright Australian Development Strategies 2009 29
0.00
20.00
40.00
60.00
80.00
100.00
120.00
140.00
160.00
180.00
200.00
-0.80
-0.60
-0.40
-0.20
0.00
0.20
0.40
0.60
Field of Study Male
2006 ALP Notional 2PP 2009 ALP Notional 2PP 2006 to 2009 ALP Notional Swing Aust Means (RHS)
Rounds out qualification table - biggest swings against Labor were from males with Science, IT and Management profiles.
Chart 18. The field of study table is pretty equalitarian and includes certificate courses with University degrees, so chippies are
in with architects. Science and Commerce tend to be straight University courses and swung strongly to Springborg.

©Copyright Australian Development Strategies 2009 30
0.00
20.00
40.00
60.00
80.00
100.00
120.00
140.00
160.00
180.00
200.00
-0.80
-0.60
-0.40
-0.20
0.00
0.20
0.40
0.60
Field of Study Female
2006 ALP Notional 2PP 2009 ALP Notional 2PP 2006 to 2009 ALP Notional Swing Aust Means (RHS)
The key female fieldsof study for Labor are Management and Society and Culture. These are big groups (RHS) and strongly pro Labor, but they swung to the new LNP in 09.
Chart 19. There’s some pretty strong bases of 06 and 09 support for State Labor here from women with IT, Management and
Arts FOS’s and for the LNP from Ag, Education and Health FOS’s. They all tended to swing back towards the norm.

©Copyright Australian Development Strategies 2009 31
0.00
50.00
100.00
150.00
200.00
-0.80
-0.60
-0.40
-0.20
0.00
0.20
0.40
0.60
0.80
Occupation Male
2006 ALP Notional 2PP 2009 ALP Notional 2PP 2006 to 2009 ALP Notional Swing Aust Means (RHS)
Managers (farmers and small businessmen) are the old National Party base of support, along with Labourers, in both the country and city seats.
Labor won the blue collar component of this old National Party profile across all seats, but the farmers stuck to the LNP.
In the seventies, Labor'sprofile was 0.8 for Tradies and 0.2 for Clerks. In the past 30 years, the profiles have reversed and Clerks - especially females - now provide the strongest profile for ALP MPs in urban seats.
While the LNP lost its laborers in the bush, it won professionals and service industry workers in the city. The problem for the LNP in 09 wasn't that it didn't win enough urban workers but that it lost too many rural workers.
Chart 20. The LNP hung onto its Managers (Farmers) but lost its skilled and unskilled blue collar workers in both the city and in the country. The professionals it did win in the city tended to live in the safer inner urban seats.

©Copyright Australian Development Strategies 2009 32
0.00
50.00
100.00
150.00
200.00
-0.80
-0.60
-0.40
-0.20
0.00
0.20
0.40
0.60
Occupation Female
2006 ALP Notional 2PP 2009 ALP Notional 2PP 2006 to 2009 ALP Notional Swing Aust Means (RHS)
Labor won swings from femaleLaborers (such as cleaners), who have not been hit by unemployment growth, but who would have received significant welfare bonuses leading up to the election.
The gain of support for the LNP from the very large group (RHS) of professional men and women shows that the LNP did cut it with the urban middle class.
Labor's votes for its urban seats now come heavily from female clerks - a huge group (RHS), while the LNP and Coalition votes come from managers who are self employed or farmers.
Female clerks are being hit heavily by recent unemploymentgrowth, but showed no signs of swinging to the ALP.
Chart 21.This is the pointy end of the charts, where description comes closest to analysis. Labor seems to have narrowly hung on to Government because it won the support of women in unskilled jobs in the outer suburban marginals.
©Copyright Australian Development Strategies 2009 33
0.00
5.00
10.00
15.00
20.00
25.00
30.00
35.00
40.00
-0.80
-0.60
-0.40
-0.20
0.00
0.20
0.40
0.60
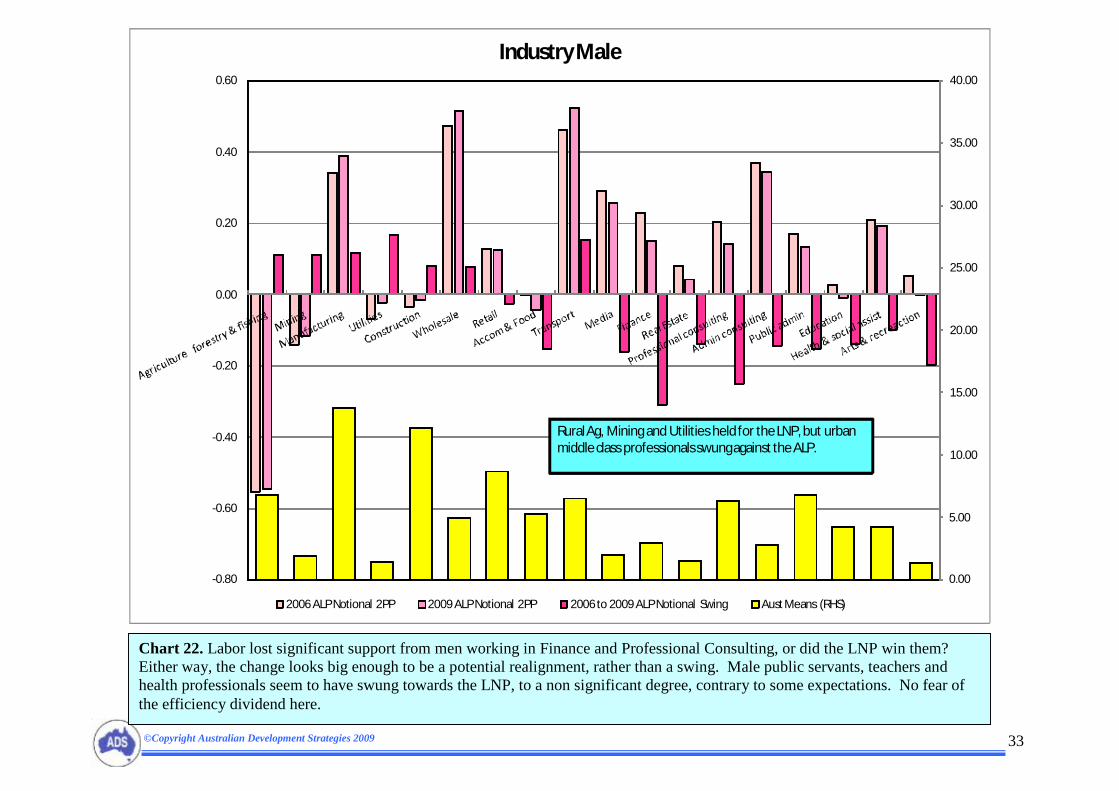
Industry Male
2006 ALP Notional 2PP 2009 ALP Notional 2PP 2006 to 2009 ALP Notional Swing Aust Means (RHS)
Rural Ag, Mining and Utilities held for the LNP, but urban middle class professionals swung against the ALP.
Chart 22. Labor lost significant support from men working in Finance and Professional Consulting, or did the LNP win them?
Either way, the change looks big enough to be a potential realignment, rather than a swing. Male public servants, teachers and health professionals seem to have swung towards the LNP, to a non significant degree, contrary to some expectations. No fear of the efficiency dividend here.

©Copyright Australian Development Strategies 2009 34
0.00
5.00
10.00
15.00
20.00
25.00
30.00
35.00
40.00
-0.80
-0.60
-0.40
-0.20
0.00
0.20
0.40
0.60
Industry Female
2006 ALP Notional 2PP 2009 ALP Notional 2PP 2006 to 2009 ALP Notional Swing Aust Means (RHS)
Females in finance and consulting urban style jobs swung heavily to the LNP.
Chart 23. The losses for Labor from Finance and Consulting were statistically and politically significant in the urban seats. There was a mild, non significant, swing to the LNP from Labor oriented female public admin workers, obviously not afraid of efficiency dividends. The ALP campaign certainly failed to generate significant swings on this issue with the target group.

©Copyright Australian Development Strategies 2009 35
0.00
20.00
40.00
60.00
80.00
100.00
120.00
140.00
160.00
180.00
200.00
-0.80
-0.60
-0.40
-0.20
0.00
0.20
0.40
0.60
Commute to Work
2006 ALP Notional 2PP 2009 ALP Notional 2PP 2006 to 2009 ALP Notional Swing Aust Means (RHS)
Car as passenger commuters is a strong welfare group, which swungto ALP.
Worked at home group tends to be farmers.
Public transport users swung strongly to LNP - another sign of support for LNP in inner city.
Neither party wonthe huge outer urban car as commuter group.
Chart 24. We know from our other profiling that lack of internet and sharing a ride to work are pretty good signs of a strong
Centrelink profile and the earlier income charts confirm this. Labor won this group and lost its inner to mid urban voters using public transport. The huge outer urban car as driver group sat on the fence.

©Copyright Australian Development Strategies 2009 36
0.00
20.00
40.00
60.00
80.00
100.00
120.00
140.00
160.00
180.00
200.00
-1.00
-0.80
-0.60
-0.40
-0.20
0.00
0.20
0.40
0.60
Tenure
2006 ALP Notional 2PP 2009 ALP Notional 2PP 2006 to 2009 ALP Notional Swing Aust Means (RHS)
Big home owner group tends to be a traditional supporter of NationalParty and some support was lost here by the LNP, presumably in the bush.
Chart 25. Home owners, an older and more conservative group, swung to the ALP, although to a barely significant degree. Home
buyers tend to be older and/or living in the country.

©Copyright Australian Development Strategies 2009 37
0.00
50.00
100.00
150.00
200.00
-0.80
-0.60
-0.40
-0.20
0.00
0.20
0.40
0.60
Family Type
2006 ALP Notional 2PP 2009 ALP Notional 2PP 2006 to 2009 ALP Notional Swing Aust Means (RHS)
A big Centrelink group with a non sign swing to Labor.
Chart 26. No significant swings here, but signs of the Centrelink swings we saw elsewhere. Single parents aren’t necessarily on welfare.

©Copyright Australian Development Strategies 2009 38
0.00
20.00
40.00
60.00
80.00
100.00
120.00
140.00
160.00
180.00
200.00
-1.00
-0.80
-0.60
-0.40
-0.20
0.00
0.20
0.40
0.60
Family Size
2006 ALP Notional 2PP 2009 ALP Notional 2PP 2006 to 2009 ALP Notional Swing Aust Means (RHS)
Chart 27. All this chart tells us is that couples with no child at home vote conservative and that couples with one (younger) child at home vote Labor. There’s a pretty wide range of lifestyles, life cycles and political allegiances at work here – the two person home could be a young gay couple in a CBD apartment or empty nesters retired at Tin Can Bay.

©Copyright Australian Development Strategies 2009 39
0.00
10.00
20.00
30.00
40.00
50.00
60.00
70.00
80.00
-0.60
-0.40
-0.20
0.00
0.20
0.40
0.60
0.80
Mort $1-249 Mort $250-399
Mort $400-549
Mort $550-749
Mort $750-949
Mort $950-1199
Mort $1200-1399
Mort $1400-1599
Mort $1600-1999
Mort $2000-2999
Mort $3000+
Monthly Mortgage
Aust Means (RHS) 2006 ALP Notional 2PP 2009 ALP Notional 2PP 2006 to 2009 ALP Notional Swing
Unemploymentgrowth is hitting this mortgage quartile the hardest, driving down top end house prices and votes for state Labor in 09.
Unemployment profile to December had been falling across the bottom half of the mortgage market.
Together with First Home subsidies, this has been propping up the bottom end of the housing market, and these voters swung to Labor in 09.
Chart 28. This chart highlights the strongest correlation in the analysis – top mortgages of $3000 plus per month. Suburbs with
median house prices above about $700,000 swung to the LNP. Suburbs containing homes worth below $350,000, had swings to the LNP which were very low.

©Copyright Australian Development Strategies 2009 40
0.00
10.00
20.00
30.00
40.00
50.00
60.00
70.00
80.00
-0.60
-0.40
-0.20
0.00
0.20
0.40
0.60
Weekly Rent
Aust Means (RHS) 2006 ALP Notional 2PP 2009 ALP Notional 2PP 2006 to 2009 ALP Notional Swing
More regression to the normal here, with lower rent LNP groups swinging to Labor and higher rent Labor groups swinging to the LNP.
Chart 29. Similar to mortgage chart. Top quartile ALP renters swung to the LNP. Second quartile swung to the ALP.

©Copyright Australian Development Strategies 2009 41
$483
$1,215
$1,030
$1,300
$192$0
$500
$1,000
$1,500
$2,000
$2,500
$3,000
-1.00
-0.80
-0.60
-0.40
-0.20
0.00
0.20
0.40
Family Budgets
2006 ALP Notional 2PP 2009 ALP Notional 2PP 2006 to 2009 ALP Notional Swing Aust Means (RHS)
As every income and expenditure figure increases, the ALP 06 vote increases, but the anti ALP 06-09 swing also increases, pulling down 09 ALP vote.
Chart 30. Chart shows pretty clearly that ALP vote was strong among higher income groups in 06 and that this support declined strongly in 09, falling to statistically insignificant levels in 09 for top mortgage payers. This is looking ominous for Federal Labor in its wealthy inner city electorates if stimulus payments and commodity price declines push up interest rates in 2010.

©Copyright Australian Development Strategies 2009 42
0.00
20.00
40.00
60.00
80.00
100.00
120.00
140.00
160.00
180.00
200.00
-0.60
-0.50
-0.40
-0.30
-0.20
-0.10
0.00
0.10
0.20
0.30
0.40
Number of cars at home
2006 ALP Notional 2PP 2009 ALP Notional 2PP 2006 to 2009 ALP Notional Swing Aust Means (RHS)
Labor vote falls as the number of cars increases. Basically farmers and rich families owns lots of cars.
No significant swings however.
Chart 31. Nothing significant with the swings here.

©Copyright Australian Development Strategies 2009 43
Regression Analysis
Background to Elaborate Model We’ve been profiling elections with regression analysis for 35 years and we finally have a model that explains the variation in the vote marginally better than the Pendulum. This is progress of sorts – our Elaborate Model explained 96 percent of the variance in the 2PP 2009 vote, while the 2006 2PP ALP vote – the basis for the Pendulum - explained 92 percent. The Elaborate Model has some advantages over the pendulum in that, over time, it can measure the personal vote of a sitting member and work out the impact when that member retires and use this to make more useful predictions – such as when we predicted the loss of Cowan at the last Federal Election. In the shorter term, we can also make some estimates about the impact of local issues and the value of individual campaigns, in terms of votes and seats won and lost. The variance explained by the swing model is usually about half that explained by the vote model and in this case, it was 40 percent. This is because the vote model is explaining what happened, but the swing modelling looks at what could have been. Factors like an outstanding candidate or an indifferent campaign by one party, low enrolment numbers, poor turnout, high informals - or even the old fashioned donkey vote, all come into play when we look at why a seat had a swing of four percent, instead of, say six percent. Even with these limitations, the swing model is far superior to the assumptions of uniform swing made in the application of the old fashioned pendulum. State Election – Traveston Dam and personal votes The model’s predicted votes showed the worst two results for Labor were in Nicklin and Gympie – basically accounted for by local opposition to Labor’s Traveston Dam – an issue that overwhelmed party profiles in the region. And two seats were predicted as losses for Labor, but won solely by the personal votes of popular sitting Labor Members – Toowoomba North (Kerry Shine) and Broadwater (Peta-Kaye Croft). Similarly, the swing in the seat of Everton looked pretty impressive at over nine percent, but half of this could be put down to the loss of the personal vote of retiring ALP member Rod Welford.

©Copyright Australian Development Strategies 2009 44
The seat that got away for the LNP was Cook, which was a LNP win on the predicted vote and swing, but this is a notoriously difficult seat in which to campaign and get out the vote and the sitting member has a great advantage. Two seats still in the balance Redlands was predicted win on both the vote and the swing, while Chatsworth was a predicted Labor win on the vote, but a lost opportunity for the LNP on the predicted swing, which could have been over five percent, given the income and house prices across the seat. Of the four seats won by Independents, Nicklin and Nanango will never be won by Labor candidates and Gladstone has grown into a marginal LNP seat due to the erosion of Labor’s skilled working class base over the past 30 years and is likely to be held by the LNP even when Liz Cunningham eventually retires. The same erosion of Labor’s base vote applies to Maryborough, only more so. It’s now a safe LNP seat, whenever Chris Foley retires. Gold Coast City and the lost pendulum We are including below a map showing the value that can be obtained from profiling and modelling vote and swing for one region of interest: the Gold Coast City. On the Gold Coast we have ten state seats. Modelling predicted the biggest swing amongst these seats against Labor, of 9.4 percent, would be in Coomera and the swing was actually 10.3 percent. The modelling predicted the smallest swing of 2.6 percent would be in Southport and the figure was actually 4.3 percent. Both Coomera and Southport were notional Labor seats in 2006 after the redistribution and were on 58.3 percent 2PP and 58.1 percent 2PP respectively. So both seats needed swings of a little over eight percent to be lost to the LNP. Those using the swing pendulum and the average swing model to predict election outcomes had Coomera as the seat at the tipping point of the pendulum – in other words, if Labor lost Coomera it would have suffered a big enough swing to lose a majority of seats including Southport and we would see a change of Government. Well, Coomera was lost with a swing more than double that of Southport, but the Government didn’t fall, because swings are never uniform. The big swing in Coomera came about for the simple reason that there were a lot more young families in Coomera paying high mortgages than there were in Southport. Young home buyers with big mortgages need two incomes and this can be a problem for politically volatile 30-34 year old mothers of two children, especially when unemployment is eroding the sort of skilled white collar jobs they are chasing. We know this is happening in seats like Coomera right across Australia, because we are currently profiling both ABS Labour Force monthly unemployment figures and Fitch Ratings home loan arrears’ summaries.

©Copyright Australian Development Strategies 2009 45
The Coomera suburb of Helensvale, in fact, now has the highest level of 30 day plus mortgage arrears (7.8 percent) of any postcode in Australia, as shown in the last Fitch Ratings Report showing mortgage delinquency by postcode. So Coomera’s Helensvale residents were suffering the highest levels of mortgage stress of any postcode in Australia for the six months ending September 2008. It is little wonder the Coomera predicted swing was the highest of all the Gold Coast seats and one of the highest in the state (third after Cook and Indooroopilly). These young Coomera families swung heavily to Kevin Rudd in 2007, but they swung heavily against Anna Bligh in 2009. From profiling both mortgage arrears and unemployment, ADS knows that there’s two variables right at the top of the ladder when it comes to home loan arrears: one is female clerks and the other is those recently unemployed and the two are linked, in that female clerks are finding it hard to get jobs in the current downturn. Connecting a very few dots here leads to the conclusion that the Federal Labor Government is cruising for a bruising in 2010 if its massive transfer payments and international commodity price falls drive up the deficit to the extent that interest rates have to rise before the next Federal election, to prop up the Aussie dollar. The clear message from the recent polls and the Queensland election is that big federal transfer payments drive up the Labor vote, at both state and federal levels, but that the impact dissipates as the money is spent. Higher interest rates however, can last for a long time, along with the political pain they cause in young home buyer seats and to the politicians seen as being responsible - as John Howard and Peter Costello would both know. So the Queensland State poll points to a two future problems for the Federal Labor Government – continued swings against Labor in wealthier inner city seats where there seems more than a little downward envy at massive transfer payments, and unemployment-driven mortgage stress in outer suburban white collar seats like Coomera. On the up side, you wouldn’t want to stand between a voter and bucket of money, but the Government would be foolish to think that the gratitude will be long lasting, or do anything other than engender a sense of entitlement.

©Copyright Australian Development Strategies 2009 46
Map 1. This is a map showing the predicted swings to the ALP between 2006 and 2009 by CCD, within the Gold Coast City boundaries. Each CCD contains about 220 homes and is the basic Census unit used by the Australian Bureau of Statistics. The swings towards Labor are shown by blue CCDs and the swings to the LNP are shown by red CCDs. Key demographic groups driving the red swing against Labor were mortgagees in the top seven percent range and young 30-34 year old mothers with two children. This last group is classic swinging voters. Seats such as Coomera contained high proportions of these two demographics and hence swung strongly against Labor. Seats such as Southport contained smaller proportions of these two demographics and recorded much smaller swing against Labor. So both seats started the campaign on 58 percent but Coomera was lost to Labor, whereas Southport was retained by Labor. When the regression analysis was applied to the CCDs within the Gold Coast, the range of swings increased as there is much greater demographic and political variation across the smaller CCD than across the larger State seats. This procedure enables us to generate a fine grained picture of the patterns of swing by describing the swinging voters at the 09 election in some detail.