Embed Size (px)
Citation preview

International Journal of Service Management and Sustainability (IJSMS), Vol. 1 No. 1 Dec 2016
76
InternationalJournalofServiceManagementandSustainability(IJSMS),Vo.1No.1Dec2016
QFD APPROACH FOR QUALITY IMPROVEMENT OF A SUSTAINABLE PRODUCT-SERVICE SYSTEM
Nur Indrianti1, Devika Kumala2 and Tri WIbawa3
1,3Department of Industrial Engineering, Universitas Pembangunan Nasional “Veteran”
Yogyakarta, Jl. Babarsari 2 Tambakbayan, Yogyakarta, 55281, Indonesia 2PT NOK INDONESIA, MM 2100 Industrial Town, Jl. Sulawesi II Blok F-3, Cikarang Barat,
bekasi 17529, Jawa Barat, Indonesia
[email protected]; [email protected]; [email protected]
ABSTRACT Increasing awareness of the importance of services has given rise to the concept of product-service system where goods and services are sold as an integrated package to customers. On the other hand, the emerging sustainability concept has escalated the demand for sustainability for industries. Consequently, it is necessary to build strategies that lead the company to achieve sustainability goals while keeping competitiveness. Drawing on the necessity service and sustainability concept in the quality improvement of the product-service system, this study aims to develop a systematic design tool by filling the gap to the previous studies. We used Quality Function Deployment (QFD) approach by considering customer requirements (VoC) and stakeholder requirements (VoSt), instead of VoC only, based on the service and sustainability dimensions. We refer to the proposed QFD approach as QFDSPS. We introduce service productivity index (SPI) to measure the performance of the system. Thus, in the proposed methodology, the strategies for quality improvement were defined as subject to VoC, VoSt, and SPI. The methodology was implemented in a Javanese restaurant which meets the characteristics of a product-service system. The result shows that the proposed method can be implemented. The implications due to the implementation of the method are also discussed. Keywords: QFD; HOQ; product-service system; sustainability; service productivity index; HOQSPS INTRODUCTION Today, businesses realise that services have become an integral part of modern society. Consequently, more and more companies are adding value to their core business by offering various services. These circumstances have given rise to a concept where goods and services tend be sold as an integrated package to customers (Kim, 2011). The three most common terms used to express service characteristics are intangibility, uno-actu-principle (“in one act”), and integration of external factors (Meier, Roy & Seliger, 2010). The quality of services is represented by the gap between consumer perception and consumer expectation. It is usually measured using service quality (servqual approach). In the SERVQUAL concept, there are five dimensions of service quality namely; tangible, responsiveness, assurance, empathy, and reliability (Parasuraman, Zeithaml & Berry, 1988). Observing that services are broadly controlled by the customer, designing effective service by taking customer requirements as the focus becomes essential. In this regard, a number of approaches for effective service design have been developed and one recent approach for
InternationalJournalofServiceManagementandSustainability(IJSMS),Vo.1No.1Dec2016
designing services is Quality Function Deployment (QFD) which provides a methodology that takes costumers’ requirements as the main driver in the design process. The most principal phase of QFD is the use of the House of Quality (HOQ), which translates the customer’s requirements into design specifications. On the other hand, the emerging concept of sustainable development has escalated the demand for sustainability for manufacturing and service providers. Thus, in addition to SERVQUAL dimensions, addressing the sustainability dimensions (social, environmental, and economic) in service design is a significant requirement. In terms of environmental aspect, modified QFD is referred to as Quality Function Deployment for Environment (QFDE) (De Camillis, Raggi & Petti, 2004). QFDE aims to support the designer in the early stages of Design for Environment (DfE) of assembled goods with a high degree of freedom in design. The work of De Camillis et al. (2004) was further expanded in the context of Total Quality Management (QFDE modified version) and Total Quality Environmental Management (Comprehensive QFDE, C-QFDE). C-QFDE accommodates Life Cycle Assessment (LCA) process to progress continuously in eco-efficiency and achieve eco-label. Lam (2015) has focussed on the modifications to QFD in terms of services and environmental aspects. The study proposed hybrid analytical approach, combining both Quality Function Deployment (QFD) and Analytical Network Process (ANP) for guiding shipping companies’ design in a sustainable maritime supply chain. The ANP was used to handle the hierarchical network of interrelationships among the attributes, particularly social, environmental and economic issues. Drawing on the necessity service concept in service design, Goldstein, Johnston, Duffy and Rao (2002) introduced the concept of service design that covers both “WHAT” (i.e. “what is to be done for customers”) and HOW (i.e. “how this is to be achieved”) aspects of service design. WHAT aspect deals with service design and the HOW aspect deals with the service delivery design. Acknowledging the argument of Goldstein et al. (2002), Chowdhury and Quaddus (2016) developed a multi-phased QFD based optimization to sustainable service design. The study proposed “sustainable service concept” which considers service design and service delivery design linking them with the attainment of social, environmental and economic goals of the organization. The methodology used was the multi-phased 0–1 optimization model within the fuzzy quality function deployment (QFD) approach. The model was applied to the health service design in Bangladesh. As described above, QFD has been progressively modified by taking environmental aspects, services, and sustainable service into consideration. Those modified QFDs are mostly concerned on customer focus, whereas, the goal is to achieve sustainability dimensions (social, environmental, and economic) which cannot be separated from stakeholder involvement. In addition, previous studies fall short of addressing the selection of appropriate strategies taking cost and performance into consideration, whereas, system performance is one of the important factors to be considered in quality improvement. To fill the gap, this study aims to modify the QFD, particularly HOQ, to be a systematic tool in the design of sustainable product-service system. By focusing on product-service system, we expect that the modified QFD could be applied more widely not only in services but also in combined

International Journal of Service Management and Sustainability (IJSMS), Vol. 1 No. 1 Dec 2016
77
InternationalJournalofServiceManagementandSustainability(IJSMS),Vo.1No.1Dec2016
QFD APPROACH FOR QUALITY IMPROVEMENT OF A SUSTAINABLE PRODUCT-SERVICE SYSTEM
Nur Indrianti1, Devika Kumala2 and Tri WIbawa3
1,3Department of Industrial Engineering, Universitas Pembangunan Nasional “Veteran”
Yogyakarta, Jl. Babarsari 2 Tambakbayan, Yogyakarta, 55281, Indonesia 2PT NOK INDONESIA, MM 2100 Industrial Town, Jl. Sulawesi II Blok F-3, Cikarang Barat,
bekasi 17529, Jawa Barat, Indonesia
[email protected]; [email protected]; [email protected]
ABSTRACT Increasing awareness of the importance of services has given rise to the concept of product-service system where goods and services are sold as an integrated package to customers. On the other hand, the emerging sustainability concept has escalated the demand for sustainability for industries. Consequently, it is necessary to build strategies that lead the company to achieve sustainability goals while keeping competitiveness. Drawing on the necessity service and sustainability concept in the quality improvement of the product-service system, this study aims to develop a systematic design tool by filling the gap to the previous studies. We used Quality Function Deployment (QFD) approach by considering customer requirements (VoC) and stakeholder requirements (VoSt), instead of VoC only, based on the service and sustainability dimensions. We refer to the proposed QFD approach as QFDSPS. We introduce service productivity index (SPI) to measure the performance of the system. Thus, in the proposed methodology, the strategies for quality improvement were defined as subject to VoC, VoSt, and SPI. The methodology was implemented in a Javanese restaurant which meets the characteristics of a product-service system. The result shows that the proposed method can be implemented. The implications due to the implementation of the method are also discussed. Keywords: QFD; HOQ; product-service system; sustainability; service productivity index; HOQSPS INTRODUCTION Today, businesses realise that services have become an integral part of modern society. Consequently, more and more companies are adding value to their core business by offering various services. These circumstances have given rise to a concept where goods and services tend be sold as an integrated package to customers (Kim, 2011). The three most common terms used to express service characteristics are intangibility, uno-actu-principle (“in one act”), and integration of external factors (Meier, Roy & Seliger, 2010). The quality of services is represented by the gap between consumer perception and consumer expectation. It is usually measured using service quality (servqual approach). In the SERVQUAL concept, there are five dimensions of service quality namely; tangible, responsiveness, assurance, empathy, and reliability (Parasuraman, Zeithaml & Berry, 1988). Observing that services are broadly controlled by the customer, designing effective service by taking customer requirements as the focus becomes essential. In this regard, a number of approaches for effective service design have been developed and one recent approach for
InternationalJournalofServiceManagementandSustainability(IJSMS),Vo.1No.1Dec2016
designing services is Quality Function Deployment (QFD) which provides a methodology that takes costumers’ requirements as the main driver in the design process. The most principal phase of QFD is the use of the House of Quality (HOQ), which translates the customer’s requirements into design specifications. On the other hand, the emerging concept of sustainable development has escalated the demand for sustainability for manufacturing and service providers. Thus, in addition to SERVQUAL dimensions, addressing the sustainability dimensions (social, environmental, and economic) in service design is a significant requirement. In terms of environmental aspect, modified QFD is referred to as Quality Function Deployment for Environment (QFDE) (De Camillis, Raggi & Petti, 2004). QFDE aims to support the designer in the early stages of Design for Environment (DfE) of assembled goods with a high degree of freedom in design. The work of De Camillis et al. (2004) was further expanded in the context of Total Quality Management (QFDE modified version) and Total Quality Environmental Management (Comprehensive QFDE, C-QFDE). C-QFDE accommodates Life Cycle Assessment (LCA) process to progress continuously in eco-efficiency and achieve eco-label. Lam (2015) has focussed on the modifications to QFD in terms of services and environmental aspects. The study proposed hybrid analytical approach, combining both Quality Function Deployment (QFD) and Analytical Network Process (ANP) for guiding shipping companies’ design in a sustainable maritime supply chain. The ANP was used to handle the hierarchical network of interrelationships among the attributes, particularly social, environmental and economic issues. Drawing on the necessity service concept in service design, Goldstein, Johnston, Duffy and Rao (2002) introduced the concept of service design that covers both “WHAT” (i.e. “what is to be done for customers”) and HOW (i.e. “how this is to be achieved”) aspects of service design. WHAT aspect deals with service design and the HOW aspect deals with the service delivery design. Acknowledging the argument of Goldstein et al. (2002), Chowdhury and Quaddus (2016) developed a multi-phased QFD based optimization to sustainable service design. The study proposed “sustainable service concept” which considers service design and service delivery design linking them with the attainment of social, environmental and economic goals of the organization. The methodology used was the multi-phased 0–1 optimization model within the fuzzy quality function deployment (QFD) approach. The model was applied to the health service design in Bangladesh. As described above, QFD has been progressively modified by taking environmental aspects, services, and sustainable service into consideration. Those modified QFDs are mostly concerned on customer focus, whereas, the goal is to achieve sustainability dimensions (social, environmental, and economic) which cannot be separated from stakeholder involvement. In addition, previous studies fall short of addressing the selection of appropriate strategies taking cost and performance into consideration, whereas, system performance is one of the important factors to be considered in quality improvement. To fill the gap, this study aims to modify the QFD, particularly HOQ, to be a systematic tool in the design of sustainable product-service system. By focusing on product-service system, we expect that the modified QFD could be applied more widely not only in services but also in combined

International Journal of Service Management and Sustainability (IJSMS), Vol. 1 No. 1 Dec 2016
78
InternationalJournalofServiceManagementandSustainability(IJSMS),Vo.1No.1Dec2016
product-service system. This is done by introducing the concept of service productivity that indicates company performance, while maintaining the voices of the customer (VoC) and stakeholder (VoSt). We argue that considering service productivity index in the design phase, especially in strategy selection phase, will lead the system to reach sustainability goals while enhancing its competitiveness. This paper is organised as follows. The next section presents the literature review in the QFD area, followed by the conceptual development and its application sections. Next, the results are presented with a discussion whereby theoretical and managerial implications are stated. Finally, the paper ends with conclusions of the study. LITERATURE REVIEW Sustainability in Services The concept of sustainable development was introduced in the ‘Brundtland Report’ of the World Commission on Environment and Development (WCED) as “development that meets the needs of the present without compromising the ability of future generations to meet their own needs”. The three pillars of sustainable development include economic development, social development, and environmental protection (WCED, 2002). In other words, sustainability can also be regarded as a system that is economically effective, environmentally sustainable and socially fair (Busset, 2014; Douallea, Medinia, Bouchera & Laforesta, 2015). To achieve the goal of sustainable development, sustainability is therefore used as a driver for industries to produce more sustainable goods and services. Consequently, in addition to cost and quality, sustainability criteria must be considered since the very beginning of product or service development. According to Hallstedt and Thompson (2011) and Hallstedt, Thompson and Lindahl (2013), there are eight key elements for successfully implementing a strategic sustainability perspective. The basic concept of the strategy is applying sustainability responsibilities in every phase of the product development, in terms of product innovation process, procurement, product life cycle, product assessment, and organisational support. In businesses perspective, sustainability means sustaining and expanding economic growth, shareholders’ value, prestige, corporate reputation, customer relationships, and the quality of products and services (Szekely & Knirsch, 2005). At the beginning, the implementation of the concept of sustainability in the industry was mostly focused in the manufacturing sector. In this case, sustainable manufacturing strategies were developed for company levels and industrial levels, such as Design for Sustainability, Design for Environment, and Eco-Industrial Park. The implementation of sustainability in services has brought out the concept of sustainable services, which refers to “the service offering the tasks embedded with economic, social and environmental protection elements that are so far still non-existence especially to the existing traditional, conventional and competing offers in the market” (Tseng & Huang, 2016). The increasing awareness of the importance of services as a complement of a product gave rise to the concept of product-service system (PSS) which tends to increase not only market share, but also customer satisfaction (Beuren, Ferreira & Miguel, 2013). In fulfilling customer needs while meeting sustainability criteria, Goedkoop, Van Hellen, Te Riele and Rommens
InternationalJournalofServiceManagementandSustainability(IJSMS),Vo.1No.1Dec2016
(1999) defined the PSS as “product(s) and service(s) combined in a system to deliver required user functionality in a way that reduces the impact on the environment”. Hence, PSS can be a potential strategy to deliver social well-being and economic prosperity while reduces environmental impact. With regard to PSS assessment, Doualle et al. (2015) analysed methods and tools that guide stakeholders of the PSS throughout a life cycle perspective. In addition, a wide range of studies in PSS involving design, production, and consumption perspectives have been done (Chowdhury & Quaddus, 2016; Mylan, 2015; Maxwell, Sheate & Van Der Vorst, 2006; Paulo & Miguel, 2016). Quality Function Deployment Quality function deployment (QFD) is an overall concept that gives an understanding to translate customer requirements into technical language at every step of product development. QFD aims to transform customer requirements of a product into engineering characteristics, process specifications, and production requirements. The QFD can be implemented through four phases, i.e. product planning, product development, process planning, and production planning (Pahl, Wallace & Blessing, 2007). QFD was first implemented in Japan in the late 1960s and early 1970s (Chan & Wu, 2002). At that time, QFD was used to improve process planning of an item in a manufacturing industry. Stages in the QFD method are as follows (Cross, 1994): 1) Identifying customer and producer requirements for attributes of a product that will be
developed. 2) Determining relative importance of each attribute. 3) Evaluating attributes on a competitor's product. 4) Describing product attributes matrix on engineering characteristics. 5) Identifying relationship between engineering characteristics and product attributes. 6) Identifying relevant relationships between engineering characteristics. 7) Setting targets to be achieved on engineering characteristics
Because of its widespread applicability to determine suitable strategies, QFD has been used in various area of design. With regard to service characteristics, Mazur (1993) developed a comprehensive QFD for service industries to support service organization. Another modified QFD was for logistics service design, which is called fuzzy QFD, has been developed by Battani and Rizzio (2006). However, Aurich, Fuchs and Wagenknecht (2006) revamped QFD for designing technical product and service system. In the area of sustainable product design QFD has been adapted especially for ecological design of product and service (Wolniak & Sȩdek, 2009; Sakao, Watanabe & Shimomura, 2003; An, Lee & Park, 2008). House of Quality The main tool used for most of the QFD phases is ‘house of quality’ (HOQ). The HOQ transfers the degree of importance in the customer requirements (CRs) (the WHATs) into design requirements (DRs) (the HOWs). The structure of genuine HOQ is composed of several parts that can be seen in Figure 1. Each part of HOQ can be explained as follows: 1) Customer requirements (WHATs), provides an overview of the exact specifications based
on consumer requirements. It is divided in two columns. The first column is for the

International Journal of Service Management and Sustainability (IJSMS), Vol. 1 No. 1 Dec 2016
79
InternationalJournalofServiceManagementandSustainability(IJSMS),Vo.1No.1Dec2016
product-service system. This is done by introducing the concept of service productivity that indicates company performance, while maintaining the voices of the customer (VoC) and stakeholder (VoSt). We argue that considering service productivity index in the design phase, especially in strategy selection phase, will lead the system to reach sustainability goals while enhancing its competitiveness. This paper is organised as follows. The next section presents the literature review in the QFD area, followed by the conceptual development and its application sections. Next, the results are presented with a discussion whereby theoretical and managerial implications are stated. Finally, the paper ends with conclusions of the study. LITERATURE REVIEW Sustainability in Services The concept of sustainable development was introduced in the ‘Brundtland Report’ of the World Commission on Environment and Development (WCED) as “development that meets the needs of the present without compromising the ability of future generations to meet their own needs”. The three pillars of sustainable development include economic development, social development, and environmental protection (WCED, 2002). In other words, sustainability can also be regarded as a system that is economically effective, environmentally sustainable and socially fair (Busset, 2014; Douallea, Medinia, Bouchera & Laforesta, 2015). To achieve the goal of sustainable development, sustainability is therefore used as a driver for industries to produce more sustainable goods and services. Consequently, in addition to cost and quality, sustainability criteria must be considered since the very beginning of product or service development. According to Hallstedt and Thompson (2011) and Hallstedt, Thompson and Lindahl (2013), there are eight key elements for successfully implementing a strategic sustainability perspective. The basic concept of the strategy is applying sustainability responsibilities in every phase of the product development, in terms of product innovation process, procurement, product life cycle, product assessment, and organisational support. In businesses perspective, sustainability means sustaining and expanding economic growth, shareholders’ value, prestige, corporate reputation, customer relationships, and the quality of products and services (Szekely & Knirsch, 2005). At the beginning, the implementation of the concept of sustainability in the industry was mostly focused in the manufacturing sector. In this case, sustainable manufacturing strategies were developed for company levels and industrial levels, such as Design for Sustainability, Design for Environment, and Eco-Industrial Park. The implementation of sustainability in services has brought out the concept of sustainable services, which refers to “the service offering the tasks embedded with economic, social and environmental protection elements that are so far still non-existence especially to the existing traditional, conventional and competing offers in the market” (Tseng & Huang, 2016). The increasing awareness of the importance of services as a complement of a product gave rise to the concept of product-service system (PSS) which tends to increase not only market share, but also customer satisfaction (Beuren, Ferreira & Miguel, 2013). In fulfilling customer needs while meeting sustainability criteria, Goedkoop, Van Hellen, Te Riele and Rommens
InternationalJournalofServiceManagementandSustainability(IJSMS),Vo.1No.1Dec2016
(1999) defined the PSS as “product(s) and service(s) combined in a system to deliver required user functionality in a way that reduces the impact on the environment”. Hence, PSS can be a potential strategy to deliver social well-being and economic prosperity while reduces environmental impact. With regard to PSS assessment, Doualle et al. (2015) analysed methods and tools that guide stakeholders of the PSS throughout a life cycle perspective. In addition, a wide range of studies in PSS involving design, production, and consumption perspectives have been done (Chowdhury & Quaddus, 2016; Mylan, 2015; Maxwell, Sheate & Van Der Vorst, 2006; Paulo & Miguel, 2016). Quality Function Deployment Quality function deployment (QFD) is an overall concept that gives an understanding to translate customer requirements into technical language at every step of product development. QFD aims to transform customer requirements of a product into engineering characteristics, process specifications, and production requirements. The QFD can be implemented through four phases, i.e. product planning, product development, process planning, and production planning (Pahl, Wallace & Blessing, 2007). QFD was first implemented in Japan in the late 1960s and early 1970s (Chan & Wu, 2002). At that time, QFD was used to improve process planning of an item in a manufacturing industry. Stages in the QFD method are as follows (Cross, 1994): 1) Identifying customer and producer requirements for attributes of a product that will be
developed. 2) Determining relative importance of each attribute. 3) Evaluating attributes on a competitor's product. 4) Describing product attributes matrix on engineering characteristics. 5) Identifying relationship between engineering characteristics and product attributes. 6) Identifying relevant relationships between engineering characteristics. 7) Setting targets to be achieved on engineering characteristics
Because of its widespread applicability to determine suitable strategies, QFD has been used in various area of design. With regard to service characteristics, Mazur (1993) developed a comprehensive QFD for service industries to support service organization. Another modified QFD was for logistics service design, which is called fuzzy QFD, has been developed by Battani and Rizzio (2006). However, Aurich, Fuchs and Wagenknecht (2006) revamped QFD for designing technical product and service system. In the area of sustainable product design QFD has been adapted especially for ecological design of product and service (Wolniak & Sȩdek, 2009; Sakao, Watanabe & Shimomura, 2003; An, Lee & Park, 2008). House of Quality The main tool used for most of the QFD phases is ‘house of quality’ (HOQ). The HOQ transfers the degree of importance in the customer requirements (CRs) (the WHATs) into design requirements (DRs) (the HOWs). The structure of genuine HOQ is composed of several parts that can be seen in Figure 1. Each part of HOQ can be explained as follows: 1) Customer requirements (WHATs), provides an overview of the exact specifications based
on consumer requirements. It is divided in two columns. The first column is for the

International Journal of Service Management and Sustainability (IJSMS), Vol. 1 No. 1 Dec 2016
80
InternationalJournalofServiceManagementandSustainability(IJSMS),Vo.1No.1Dec2016
customers’ requirements and the second is for the coefficient that reflects the importance of each costumer requirement.
2) Planning matrix, contains information about relative importance of customer requirements and the level of customer satisfaction.
3) Technical or engineering characteristics (HOWs), is the adjustment of valuable qualitative consumer requirements that are translated into quantitative values.
4) Relationship matrix, is an indication level of engineering characteristics that influence customer satisfaction for each customer requirement.
5) Correlations matrix, illustrates the interdependence between engineering characteristics and to capture the opportunities among the various engineering parameters.
6) Technical characteristics importance ranking, is a priority on the engineering characteristics by providing information to produce innovation of a product design or new systems.
4.Relationshipmatrix
3.Technicalcharacteristics
6.Technicalcharacteristicsimportancerankings
1.Customer
requ
irement
2.Plann
ing
matrix
5.Correlations
(Source: Bergquist & Abeysekera, 1996; Yang, Khan, Sadiq & Amyotte, 2011)
Figure 1: House of Quality
CONCEPTUAL DEVELOPMENT We then developed QFD, particularly extending the HOQ phase, for sustainable product-service system. The modified HOQ is presented in Figure 2 and is referred to it as HOQSPS. The approach is made up of fifteen steps. In Figure 2, the areas with dark background indicate the modifications to the original HOQ.
Correlation
VoiceofCustomer(VoC)
1
VoiceofStakeholder
(VoSt)1 Cu
stomeran
dstake
holde
rsa
tisfacti
on
`
2
Dimen
siona
lweig
ht
3
Gap
4
Relationshipmatrix
Glob
alwe
ight
5
Engineeringcharacteristics 7
9
Satis
facti
onin
dex
10
Targetva
lue
11
Satis
facti
onle
vel
6
Estimatedcustomerandstakeholdersatisfaction
12
Costandrevenueratio 13
Estimatedqualityimprovement 14
ServiceProductivityIndex 15
Figure 2: Modified HOQ for Sustainable Product-Service System
InternationalJournalofServiceManagementandSustainability(IJSMS),Vo.1No.1Dec2016
The steps for constructing HOQSPS are specified as follows: Step 1. Identify voice of customer (VoC) and voice of stakeholder (VoSt). Step 2. Determine customer and stakeholder satisfaction (Si) of each attribute (using Likert
scale). Step 3. Determine the dimensional weight (Wdi) of VoC and VoSt.
Dimensional weight denotes the capability of each dimension. Step 4. Determine the global weight (Wgi).
The global weight of each attribute indicates its position so that strategies to improve the quality of the system can be defined.
Step 5. Determine the gap of each attribute. A gap occurs when the ideal situation expected by the customer is not met. The gap is defined as the difference between perception and expectation of service.
Step 6. Determine the importance level of each attribute (AIi). The value of AIi is a weighted Si and represents the degree of interest of each attribute.
Step 7. Determine alternative solutions (engineering characteristics). Alternative solutions are defined based on the gap and importance level and
structured as an engineering characteristics matrix. Once the attribute is selected, the alternative solutions to improve the quality of the attribute can be determined.
Step 8. Develop VoC-VoSt relationship matrix. In this step, the engineering characteristics will be linked to the selected attributes in the area of VoC and VoSt.
Step 9. Develop correlation matrix that shows the relationship among alternative solutions. Step 10. Determine customer and stakeholder satisfaction index (SIi).
Based on VoC-VoSt relationship level, the customer and stakeholder satisfaction index is estimated and expressed as a new matrix. Satisfaction index of selected attribute i is estimated using the following equation:
SIi= Wgi ∙t .................................................................................. (1) where t is numerical value based on the strength of the relationship.
Step 11. Determine target value (TVi). Target value is a management policy that describes the expected quality improvement of the selected attributes when an alternative solution is implemented. The target value of selected attribute i can be calculated as follows:
TVi= (1 + ∆mi) ∙Si ..................................................................... (2) where ∆mi is the expected quality improvement of attribute i (proportional to the current value of Si).
Step 12. Estimate customer and stakeholder satisfaction(ESu). Given the alternative solution be applied to the system for quality improvement, it is necessary to estimate how far the level of satisfaction can be perceived by customers and stakeholders. One activity is possible to solve some problems. Hence, the estimated customer and stakeholder satisfaction of a strategy is the sum of satisfaction index of the influenced attributes.
Step 13. Determine cost and revenue ratio (C/R). Cost and revenue ratio is calculated using the following equation:
C/R = !"#∆!&"#∆& .............................................................................. (3)
where: Co : current operating cost ∆C : strategy implementation cost Ro : current income
International Journal of Service Management and Sustainability (IJSMS), Vol. 1 No. 1 Dec 2016
81
InternationalJournalofServiceManagementandSustainability(IJSMS),Vo.1No.1Dec2016
customers’ requirements and the second is for the coefficient that reflects the importance of each costumer requirement.
2) Planning matrix, contains information about relative importance of customer requirements and the level of customer satisfaction.
3) Technical or engineering characteristics (HOWs), is the adjustment of valuable qualitative consumer requirements that are translated into quantitative values.
4) Relationship matrix, is an indication level of engineering characteristics that influence customer satisfaction for each customer requirement.
5) Correlations matrix, illustrates the interdependence between engineering characteristics and to capture the opportunities among the various engineering parameters.
6) Technical characteristics importance ranking, is a priority on the engineering characteristics by providing information to produce innovation of a product design or new systems.
4.Relationshipmatrix
3.Technicalcharacteristics
6.Technicalcharacteristicsimportancerankings
1.Customer
requ
irement
2.Plann
ing
matrix
5.Correlations
(Source: Bergquist & Abeysekera, 1996; Yang, Khan, Sadiq & Amyotte, 2011)
Figure 1: House of Quality
CONCEPTUAL DEVELOPMENT We then developed QFD, particularly extending the HOQ phase, for sustainable product-service system. The modified HOQ is presented in Figure 2 and is referred to it as HOQSPS. The approach is made up of fifteen steps. In Figure 2, the areas with dark background indicate the modifications to the original HOQ.
Correlation
VoiceofCustomer(VoC)
1
VoiceofStakeholder
(VoSt)1 Cu
stomeran
dstake
holde
rsa
tisfacti
on
`
2
Dimen
siona
lweig
ht
3
Gap
4
Relationshipmatrix
Glob
alwe
ight
5
Engineeringcharacteristics 7
9
Satis
facti
onin
dex
10
Targetva
lue
11
Satis
facti
onle
vel
6
Estimatedcustomerandstakeholdersatisfaction
12
Costandrevenueratio 13
Estimatedqualityimprovement 14
ServiceProductivityIndex 15
Figure 2: Modified HOQ for Sustainable Product-Service System
InternationalJournalofServiceManagementandSustainability(IJSMS),Vo.1No.1Dec2016
The steps for constructing HOQSPS are specified as follows: Step 1. Identify voice of customer (VoC) and voice of stakeholder (VoSt). Step 2. Determine customer and stakeholder satisfaction (Si) of each attribute (using Likert
scale). Step 3. Determine the dimensional weight (Wdi) of VoC and VoSt.
Dimensional weight denotes the capability of each dimension. Step 4. Determine the global weight (Wgi).
The global weight of each attribute indicates its position so that strategies to improve the quality of the system can be defined.
Step 5. Determine the gap of each attribute. A gap occurs when the ideal situation expected by the customer is not met. The gap is defined as the difference between perception and expectation of service.
Step 6. Determine the importance level of each attribute (AIi). The value of AIi is a weighted Si and represents the degree of interest of each attribute.
Step 7. Determine alternative solutions (engineering characteristics). Alternative solutions are defined based on the gap and importance level and
structured as an engineering characteristics matrix. Once the attribute is selected, the alternative solutions to improve the quality of the attribute can be determined.
Step 8. Develop VoC-VoSt relationship matrix. In this step, the engineering characteristics will be linked to the selected attributes in the area of VoC and VoSt.
Step 9. Develop correlation matrix that shows the relationship among alternative solutions. Step 10. Determine customer and stakeholder satisfaction index (SIi).
Based on VoC-VoSt relationship level, the customer and stakeholder satisfaction index is estimated and expressed as a new matrix. Satisfaction index of selected attribute i is estimated using the following equation:
SIi= Wgi ∙t .................................................................................. (1) where t is numerical value based on the strength of the relationship.
Step 11. Determine target value (TVi). Target value is a management policy that describes the expected quality improvement of the selected attributes when an alternative solution is implemented. The target value of selected attribute i can be calculated as follows:
TVi= (1 + ∆mi) ∙Si ..................................................................... (2) where ∆mi is the expected quality improvement of attribute i (proportional to the current value of Si).
Step 12. Estimate customer and stakeholder satisfaction(ESu). Given the alternative solution be applied to the system for quality improvement, it is necessary to estimate how far the level of satisfaction can be perceived by customers and stakeholders. One activity is possible to solve some problems. Hence, the estimated customer and stakeholder satisfaction of a strategy is the sum of satisfaction index of the influenced attributes.
Step 13. Determine cost and revenue ratio (C/R). Cost and revenue ratio is calculated using the following equation:
C/R = !"#∆!&"#∆& .............................................................................. (3)
where: Co : current operating cost ∆C : strategy implementation cost Ro : current income

International Journal of Service Management and Sustainability (IJSMS), Vol. 1 No. 1 Dec 2016
82
InternationalJournalofServiceManagementandSustainability(IJSMS),Vo.1No.1Dec2016
∆R : additional income due to the implemented strategy. The lower the ratio value the more efficient the system. Step 14. Estimate quality improvement (EQu).
The estimation of quality improvement is used to predict how much quality can be improved due to the implementation of the strategies. The value of (EQu) is the sum of TVi influenced by the strategy.
Step 15. Determine Service Productivity Index (SPI). Productivity is defined as the ratio between output and inputs. As argued by Fornell (2003), productivity should be predicted to identify a way to improve the quality of goods and services. In this study, we refer to Indrianti (2012a), hence the SPI is calculated as follows.
Service Productivity Index (SPI) = !""!#$%&!'!((!""%#%!'#) = !"#$%&'(#)$*#+*!)$*%,
!%#$#/('.',"' (4)
The higher the value of SPI the more effectively and efficiently the system. METHODOLOGY: MODEL APPLICATION To examine the HOQSPS that was developed in this study, we used a restaurant as a case study. We chose a restaurant since it meets the characteristics of product-service system. We selected a Javanese restaurant located in Sleman District, Yogyakarta Special Region, Indonesia. The restaurant provides traditional Indonesian food such as grilled chicken, grilled fish, and Indonesian vegetable. Referring to the previous section, the HOQSPS was developed through the following steps: Step 1. The attributes that served as voice of customers and voice of stakeholders were
defined based on Indrianti (2012b). We selected the attributes with the number of respondents who provided important votes of more than 50%. The attributes is shown in Table 1below. It can be seen that sustainability aspects were taken into account.
Table 1 : Voice of Customers and Voice of Stakeholders
VoC-T1 Foodpresentationandplatingtools VoC-A4 Taste
VoC-T2Theavailabilityofroomforspecialpurposes(meetingroom,etc.) VoC-A5
Cleanlinessofdinningandkitchensupportingfacilities
VoC-T3 Thebeautyoftheenvironment VoC-E1 Entertainment
VoC-T4 Artandcreativityforfooddisplay VoC-E2 Hospitality
VoC-T5 Roomlighting VoC-Rl1 Order(size)flexibility
VoC-T6 Cleanlinessofservinguntensils VoC-Rl2 Menuvariety
VoC-T7Completenessofsupportingfacilitiesforpersonalneeds(toilet,sink,nursery,prayerrooms,etc.)
VoC-Rl3 Variationsinthewayfororderingfood
VoC-T8 Completenessofservinguntensils Tangible VoSt-T1 Thebeautyoftheenvironment
Responsiveness VoC-R1 Responsiveness(timeandeasetoorder) VoSt-E1 Noiselevel
VoC-A1 Parkingarea VoSt-E2 Socialresponsibilityprogram
VoC-A2 Comfort(roomlayout,theventilationsystem) Assurance VoSt-A1 Parkingarea
VoC-A3 Qualityofrawmaterial
Voiceofcustomer
Assurance
Dimension No Description
Empathy
Dimension No Description
Tangible
Reliability
Voiceof
stakeh
olde
r
Empathy
Assurance
Voiceofcustomer
Modified from Indrianti (2012b)
The attributes were then used for the other steps, particularly to determine the satisfaction level of each attribute. The data was obtained by distributing a set of questionnaires. Customer respondents were determined using non-probability sampling, while the stakeholder respondents were determined using convenience
InternationalJournalofServiceManagementandSustainability(IJSMS),Vo.1No.1Dec2016
sampling. We selected 5 residents who live near the restaurant as stakeholder respondents. Assuming 95% confidence level and 10% of sampling error, the minimum required sample size is 97 (Fitzsimmons & Fitzsimmons, 2004).
Step 2. We used 5-Likert scale to determine customer and stakeholder satisfaction of each attribute (Si). Score 1 means very bad and 5 means very good. Statistical tests included validity and reliability tests using SPSS 20. Validity test resulted in rcalculated>rtable for each item in the questionnaire, so the questionnaire instrument are valid.
Questionnaire reliability was tested using Cronbanch’s value of alpha (α). The calculation resulted in 0.928 of Cronbanch's alpha value. According to Nunnaly, (1978), the test with value of alpha (α) 0.7 and above is usually acceptable. Thus, the set of questionnaires used this study was reliable.
Step 3. The dimensional weight (Wdi) of VoC and VoSt were calculated based on the results of step 2.
Step 4. The global weight (Wdi) was calculated based on the results of step 2. Step 5. In this step, we considered ‘5’ as the ideal expectation of service. Step 6. To determine the importance level of each attribute we used 4-Likert scale ranging
from 1 (very unimportant) to 4 (very important). We invited 127 customer respondents and 93 stakeholder respondents. Afterwards, normalization into 5-scale was done in order to have similar scale used in previous steps.
The results of step 2 to 6 can be seen in Table 2.
Table 2 : Satisfaction Level, Gap, and Importance Level of Each Attribute
VoC-T1 3.938 0.126 0.0158 5 -1.062 2.890 3.612 17VoC-T2 3.711 0.119 0.0149 5 -1.289 1.425 1.781 23VoC-T3 4.227 0.136 0.0169 5 -0.773 3.189 3.986 10VoC-T4 3.639 0.117 0.0146 5 -1.361 2.417 3.022 21VoC-T5 3.763 0.121 0.0151 5 -1.237 2.622 3.278 19VoC-T6 3.876 0.124 0.0155 5 -1.124 3.575 4.469 5VoC-T7 4.000 0.128 0.0160 5 -1.000 3.575 4.469 6VoC-T8 4.021 0.129 0.0161 5 -0.979 2.969 3.711 16
Responsiveness
VoC-R1 3.866 1.000 0.1250 5 -1.134 3.591 4.488 4VoC-A1 3.773 0.195 0.0244 5 -1.227 2.984 3.730 15VoC-A2 3.990 0.206 0.0258 5 -1.010 3.488 4.360 8VoC-A3 3.804 0.197 0.0246 5 -1.196 3.567 4.459 7VoC-A4 3.794 0.196 0.0245 5 -1.206 3.803 4.754 2VoC-A5 3.979 0.206 0.0257 5 -1.021 3.803 4.754 3VoC-E1 3.268 0.450 0.0562 5 -1.732 1.984 2.480 22VoC-E2 4.000 0.550 0.0688 5 -1.000 3.811 4.764 1VoC-Rl1 3.825 0.332 0.0414 5 -1.175 2.567 3.209 20VoC-Rl2 3.866 0.335 0.0419 5 -1.134 3.157 3.947 14VoC-Rl3 3.845 0.333 0.0417 5 -1.155 3.409 4.262 9
Tangible VoSt-T1 4.000 1.000 0.1250 5 -1.000 3.189 3.986 11VoSt-E1 4.000 0.556 0.0694 5 -1.000 3.165 3.956 12VoSt-E2 3.200 0.444 0.0556 5 -1.800 2.835 3.544 18
Assurance VoSt-A1 4.000 1.000 0.1250 5 -1.000 3.165 3.956 13
Globalweight
DimensionalweightDimension No
Voic
eof
cust
omer
Tangible
Assurance
Empathy
ReliabilityVo
iceof
stakeholder
Empathy
Satisfactionlevel
Expec-tation Gap
Levelofimportance
(4scale)
Normali-zation
Importancepriority

International Journal of Service Management and Sustainability (IJSMS), Vol. 1 No. 1 Dec 2016
83
InternationalJournalofServiceManagementandSustainability(IJSMS),Vo.1No.1Dec2016
∆R : additional income due to the implemented strategy. The lower the ratio value the more efficient the system. Step 14. Estimate quality improvement (EQu).
The estimation of quality improvement is used to predict how much quality can be improved due to the implementation of the strategies. The value of (EQu) is the sum of TVi influenced by the strategy.
Step 15. Determine Service Productivity Index (SPI). Productivity is defined as the ratio between output and inputs. As argued by Fornell (2003), productivity should be predicted to identify a way to improve the quality of goods and services. In this study, we refer to Indrianti (2012a), hence the SPI is calculated as follows.
Service Productivity Index (SPI) = !""!#$%&!'!((!""%#%!'#) = !"#$%&'(#)$*#+*!)$*%,
!%#$#/('.',"' (4)
The higher the value of SPI the more effectively and efficiently the system. METHODOLOGY: MODEL APPLICATION To examine the HOQSPS that was developed in this study, we used a restaurant as a case study. We chose a restaurant since it meets the characteristics of product-service system. We selected a Javanese restaurant located in Sleman District, Yogyakarta Special Region, Indonesia. The restaurant provides traditional Indonesian food such as grilled chicken, grilled fish, and Indonesian vegetable. Referring to the previous section, the HOQSPS was developed through the following steps: Step 1. The attributes that served as voice of customers and voice of stakeholders were
defined based on Indrianti (2012b). We selected the attributes with the number of respondents who provided important votes of more than 50%. The attributes is shown in Table 1below. It can be seen that sustainability aspects were taken into account.
Table 1 : Voice of Customers and Voice of Stakeholders
VoC-T1 Foodpresentationandplatingtools VoC-A4 Taste
VoC-T2Theavailabilityofroomforspecialpurposes(meetingroom,etc.) VoC-A5
Cleanlinessofdinningandkitchensupportingfacilities
VoC-T3 Thebeautyoftheenvironment VoC-E1 Entertainment
VoC-T4 Artandcreativityforfooddisplay VoC-E2 Hospitality
VoC-T5 Roomlighting VoC-Rl1 Order(size)flexibility
VoC-T6 Cleanlinessofservinguntensils VoC-Rl2 Menuvariety
VoC-T7Completenessofsupportingfacilitiesforpersonalneeds(toilet,sink,nursery,prayerrooms,etc.)
VoC-Rl3 Variationsinthewayfororderingfood
VoC-T8 Completenessofservinguntensils Tangible VoSt-T1 Thebeautyoftheenvironment
Responsiveness VoC-R1 Responsiveness(timeandeasetoorder) VoSt-E1 Noiselevel
VoC-A1 Parkingarea VoSt-E2 Socialresponsibilityprogram
VoC-A2 Comfort(roomlayout,theventilationsystem) Assurance VoSt-A1 Parkingarea
VoC-A3 Qualityofrawmaterial
Voiceofcustomer
Assurance
Dimension No Description
Empathy
Dimension No Description
Tangible
Reliability
Voiceof
stakeh
olde
r
Empathy
Assurance
Voiceofcustomer
Modified from Indrianti (2012b)
The attributes were then used for the other steps, particularly to determine the satisfaction level of each attribute. The data was obtained by distributing a set of questionnaires. Customer respondents were determined using non-probability sampling, while the stakeholder respondents were determined using convenience
InternationalJournalofServiceManagementandSustainability(IJSMS),Vo.1No.1Dec2016
sampling. We selected 5 residents who live near the restaurant as stakeholder respondents. Assuming 95% confidence level and 10% of sampling error, the minimum required sample size is 97 (Fitzsimmons & Fitzsimmons, 2004).
Step 2. We used 5-Likert scale to determine customer and stakeholder satisfaction of each attribute (Si). Score 1 means very bad and 5 means very good. Statistical tests included validity and reliability tests using SPSS 20. Validity test resulted in rcalculated>rtable for each item in the questionnaire, so the questionnaire instrument are valid.
Questionnaire reliability was tested using Cronbanch’s value of alpha (α). The calculation resulted in 0.928 of Cronbanch's alpha value. According to Nunnaly, (1978), the test with value of alpha (α) 0.7 and above is usually acceptable. Thus, the set of questionnaires used this study was reliable.
Step 3. The dimensional weight (Wdi) of VoC and VoSt were calculated based on the results of step 2.
Step 4. The global weight (Wdi) was calculated based on the results of step 2. Step 5. In this step, we considered ‘5’ as the ideal expectation of service. Step 6. To determine the importance level of each attribute we used 4-Likert scale ranging
from 1 (very unimportant) to 4 (very important). We invited 127 customer respondents and 93 stakeholder respondents. Afterwards, normalization into 5-scale was done in order to have similar scale used in previous steps.
The results of step 2 to 6 can be seen in Table 2.
Table 2 : Satisfaction Level, Gap, and Importance Level of Each Attribute
VoC-T1 3.938 0.126 0.0158 5 -1.062 2.890 3.612 17VoC-T2 3.711 0.119 0.0149 5 -1.289 1.425 1.781 23VoC-T3 4.227 0.136 0.0169 5 -0.773 3.189 3.986 10VoC-T4 3.639 0.117 0.0146 5 -1.361 2.417 3.022 21VoC-T5 3.763 0.121 0.0151 5 -1.237 2.622 3.278 19VoC-T6 3.876 0.124 0.0155 5 -1.124 3.575 4.469 5VoC-T7 4.000 0.128 0.0160 5 -1.000 3.575 4.469 6VoC-T8 4.021 0.129 0.0161 5 -0.979 2.969 3.711 16
Responsiveness
VoC-R1 3.866 1.000 0.1250 5 -1.134 3.591 4.488 4VoC-A1 3.773 0.195 0.0244 5 -1.227 2.984 3.730 15VoC-A2 3.990 0.206 0.0258 5 -1.010 3.488 4.360 8VoC-A3 3.804 0.197 0.0246 5 -1.196 3.567 4.459 7VoC-A4 3.794 0.196 0.0245 5 -1.206 3.803 4.754 2VoC-A5 3.979 0.206 0.0257 5 -1.021 3.803 4.754 3VoC-E1 3.268 0.450 0.0562 5 -1.732 1.984 2.480 22VoC-E2 4.000 0.550 0.0688 5 -1.000 3.811 4.764 1VoC-Rl1 3.825 0.332 0.0414 5 -1.175 2.567 3.209 20VoC-Rl2 3.866 0.335 0.0419 5 -1.134 3.157 3.947 14VoC-Rl3 3.845 0.333 0.0417 5 -1.155 3.409 4.262 9
Tangible VoSt-T1 4.000 1.000 0.1250 5 -1.000 3.189 3.986 11VoSt-E1 4.000 0.556 0.0694 5 -1.000 3.165 3.956 12VoSt-E2 3.200 0.444 0.0556 5 -1.800 2.835 3.544 18
Assurance VoSt-A1 4.000 1.000 0.1250 5 -1.000 3.165 3.956 13
Globalweight
DimensionalweightDimension No
Voic
eof
cust
omer
Tangible
Assurance
Empathy
Reliability
Voiceof
stakeholder
Empathy
Satisfactionlevel
Expec-tation Gap
Levelofimportance
(4scale)
Normali-zation
Importancepriority

International Journal of Service Management and Sustainability (IJSMS), Vol. 1 No. 1 Dec 2016
84
InternationalJournalofServiceManagementandSustainability(IJSMS),Vo.1No.1Dec2016
Step 7. With regard to the previous results presented in Table 2, the alternative solutions were defined by interviewing the restaurant manager. Table 3 shows the alternative solutions of each selected attributes. It is shown that not all of attributes were important and needed to be improved. On the other hand, one alternative solution could influence more than one of the attributes. The replacement of serving equipment did not become prioritized strategy as it only influenced one attribute.
Table 3 : Selected Attribute for Quality Improvement
Developmeetingroom
Developproductionhouse
2 VoC-T1 Foodpresentationandplatingtools Employeetraining
3 VoC-R1 Responsiveness(timeandeasetoorder) Employeetraining
Developmeetingroom
DevelopproductionhouseDevelopproductionhouse
Employeetraining
Developproductionhouse
Employeetraining
Replacementofservingequipment
Employeetraining
Developproductionhouse
Employeetraining
9 VoC-T3 Thebeautyoftheenvironment Developproductionhouse
Menuvariety8
VoC-T2
VoC-A2
VoC-A3
VoC-A4
VoC-A5
VoC-Rl2
Priority Alternativesolutions
Cleanlinessofservinguntensils
No Description
1
4
5
6
7
Roomcomformt
Theavailabilityofroomforspecialpurpuses
Qualityofrawmaterial
Taste
Step 8. We developed VoC-VoSt relationship matrix. The correlations were classified into strong, middle, and weak relationships.
Step 9. We determined the correlation matrix among the proposed strategies. Step 10. Satisfaction index was determined based on the relationship matrix and global
weight. The relationship level was translated into numerical value as follows: 1 is for “may have relationship”, 3 is for “middle relationship”, and 9 is for “strong relationship”. For example, satisfaction index for VoC-T2 is (0.0149 x 9) + (0.0149 x 9) = 0.26.
Step 11. The management wished to get increasing quality of 20%. The calculation results of satisfaction index and target value of each selected attribute is presented in Table 4
Table 4 : Satisfaction Index and Target Value of Selected Attributes
Dimension No.AtributSatisfaction
Index TargetValue
VoC-T2 0.268 4.454
VoC-T4 0.044 4.367
Responsiveness VoC-R1 1.125 4.639
VoC-A2 0.103 4.788
VoC-A3 0.295 4.565
VoC-A4 0.098 4.553
VoC-A5 0.309 4.775
Reliability VoC-Rl2 0.251 4.639
Voice
of
stakeho
lder
Tangible VoSt-T1 0.375 4.800
Voice
ofcustomer
Tangible
Assurance
InternationalJournalofServiceManagementandSustainability(IJSMS),Vo.1No.1Dec2016
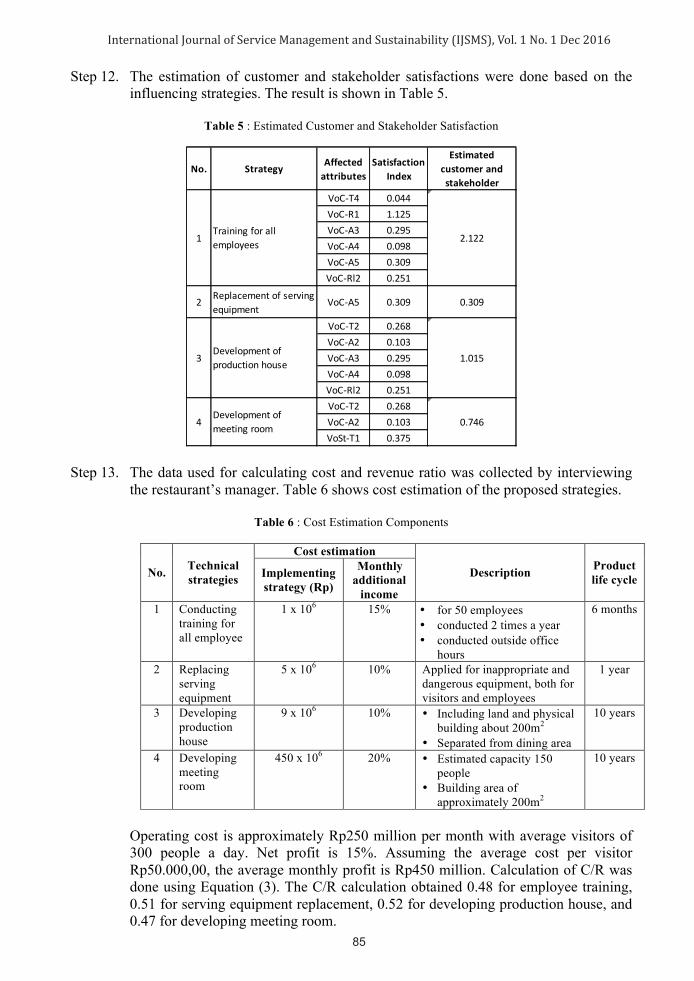
Step 12. The estimation of customer and stakeholder satisfactions were done based on the influencing strategies. The result is shown in Table 5.
Table 5 : Estimated Customer and Stakeholder Satisfaction
No. Strategy Affectedattributes
SatisfactionIndex
EstimatedcustomerandstakeholdersatisfactionsVoC-T4 0.044
VoC-R1 1.125VoC-A3 0.295VoC-A4 0.098VoC-A5 0.309VoC-Rl2 0.251
2 Replacementofservingequipment
VoC-A5 0.309 0.309
VoC-T2 0.268VoC-A2 0.103VoC-A3 0.295VoC-A4 0.098VoC-Rl2 0.251VoC-T2 0.268VoC-A2 0.103VoSt-T1 0.375
1Trainingforallemployees 2.122
3Developmentofproductionhouse 1.015
4Developmentofmeetingroom 0.746
Step 13. The data used for calculating cost and revenue ratio was collected by interviewing the restaurant’s manager. Table 6 shows cost estimation of the proposed strategies.
Table 6 : Cost Estimation Components
No. Technical strategies
Cost estimation
Description Product life cycle Implementing
strategy (Rp)
Monthly additional
income 1 Conducting
training for all employee
1 x 10⁶
15% • for 50 employees • conducted 2 times a year • conducted outside office
hours
6 months
2 Replacing serving equipment
5 x 10⁶
10% Applied for inappropriate and dangerous equipment, both for visitors and employees
1 year
3 Developing production house
9 x 10⁶
10% • Including land and physical building about 200m2
• Separated from dining area
10 years
4 Developing meeting room
450 x 106
20% • Estimated capacity 150 people
• Building area of approximately 200m2
10 years
Operating cost is approximately Rp250 million per month with average visitors of 300 people a day. Net profit is 15%. Assuming the average cost per visitor Rp50.000,00, the average monthly profit is Rp450 million. Calculation of C/R was done using Equation (3). The C/R calculation obtained 0.48 for employee training, 0.51 for serving equipment replacement, 0.52 for developing production house, and 0.47 for developing meeting room.
International Journal of Service Management and Sustainability (IJSMS), Vol. 1 No. 1 Dec 2016
85
InternationalJournalofServiceManagementandSustainability(IJSMS),Vo.1No.1Dec2016
Step 7. With regard to the previous results presented in Table 2, the alternative solutions were defined by interviewing the restaurant manager. Table 3 shows the alternative solutions of each selected attributes. It is shown that not all of attributes were important and needed to be improved. On the other hand, one alternative solution could influence more than one of the attributes. The replacement of serving equipment did not become prioritized strategy as it only influenced one attribute.
Table 3 : Selected Attribute for Quality Improvement
Developmeetingroom
Developproductionhouse
2 VoC-T1 Foodpresentationandplatingtools Employeetraining
3 VoC-R1 Responsiveness(timeandeasetoorder) Employeetraining
Developmeetingroom
DevelopproductionhouseDevelopproductionhouse
Employeetraining
Developproductionhouse
Employeetraining
Replacementofservingequipment
Employeetraining
Developproductionhouse
Employeetraining
9 VoC-T3 Thebeautyoftheenvironment Developproductionhouse
Menuvariety8
VoC-T2
VoC-A2
VoC-A3
VoC-A4
VoC-A5
VoC-Rl2
Priority Alternativesolutions
Cleanlinessofservinguntensils
No Description
1
4
5
6
7
Roomcomformt
Theavailabilityofroomforspecialpurpuses
Qualityofrawmaterial
Taste
Step 8. We developed VoC-VoSt relationship matrix. The correlations were classified into strong, middle, and weak relationships.
Step 9. We determined the correlation matrix among the proposed strategies. Step 10. Satisfaction index was determined based on the relationship matrix and global
weight. The relationship level was translated into numerical value as follows: 1 is for “may have relationship”, 3 is for “middle relationship”, and 9 is for “strong relationship”. For example, satisfaction index for VoC-T2 is (0.0149 x 9) + (0.0149 x 9) = 0.26.
Step 11. The management wished to get increasing quality of 20%. The calculation results of satisfaction index and target value of each selected attribute is presented in Table 4
Table 4 : Satisfaction Index and Target Value of Selected Attributes
Dimension No.AtributSatisfaction
Index TargetValue
VoC-T2 0.268 4.454
VoC-T4 0.044 4.367
Responsiveness VoC-R1 1.125 4.639
VoC-A2 0.103 4.788
VoC-A3 0.295 4.565
VoC-A4 0.098 4.553
VoC-A5 0.309 4.775
Reliability VoC-Rl2 0.251 4.639
Voice
of
stakeho
lder
Tangible VoSt-T1 0.375 4.800
Voice
ofcustomer
Tangible
Assurance
InternationalJournalofServiceManagementandSustainability(IJSMS),Vo.1No.1Dec2016
Step 12. The estimation of customer and stakeholder satisfactions were done based on the influencing strategies. The result is shown in Table 5.
Table 5 : Estimated Customer and Stakeholder Satisfaction
No. Strategy Affectedattributes
SatisfactionIndex
EstimatedcustomerandstakeholdersatisfactionsVoC-T4 0.044
VoC-R1 1.125VoC-A3 0.295VoC-A4 0.098VoC-A5 0.309VoC-Rl2 0.251
2 Replacementofservingequipment
VoC-A5 0.309 0.309
VoC-T2 0.268VoC-A2 0.103VoC-A3 0.295VoC-A4 0.098VoC-Rl2 0.251VoC-T2 0.268VoC-A2 0.103VoSt-T1 0.375
1Trainingforallemployees 2.122
3Developmentofproductionhouse 1.015
4Developmentofmeetingroom 0.746
Step 13. The data used for calculating cost and revenue ratio was collected by interviewing the restaurant’s manager. Table 6 shows cost estimation of the proposed strategies.
Table 6 : Cost Estimation Components
No. Technical strategies
Cost estimation
Description Product life cycle Implementing
strategy (Rp)
Monthly additional
income 1 Conducting
training for all employee
1 x 10⁶
15% • for 50 employees • conducted 2 times a year • conducted outside office
hours
6 months
2 Replacing serving equipment
5 x 10⁶
10% Applied for inappropriate and dangerous equipment, both for visitors and employees
1 year
3 Developing production house
9 x 10⁶
10% • Including land and physical building about 200m2
• Separated from dining area
10 years
4 Developing meeting room
450 x 106
20% • Estimated capacity 150 people
• Building area of approximately 200m2
10 years
Operating cost is approximately Rp250 million per month with average visitors of 300 people a day. Net profit is 15%. Assuming the average cost per visitor Rp50.000,00, the average monthly profit is Rp450 million. Calculation of C/R was done using Equation (3). The C/R calculation obtained 0.48 for employee training, 0.51 for serving equipment replacement, 0.52 for developing production house, and 0.47 for developing meeting room.
International Journal of Service Management and Sustainability (IJSMS), Vol. 1 No. 1 Dec 2016
86
InternationalJournalofServiceManagementandSustainability(IJSMS),Vo.1No.1Dec2016
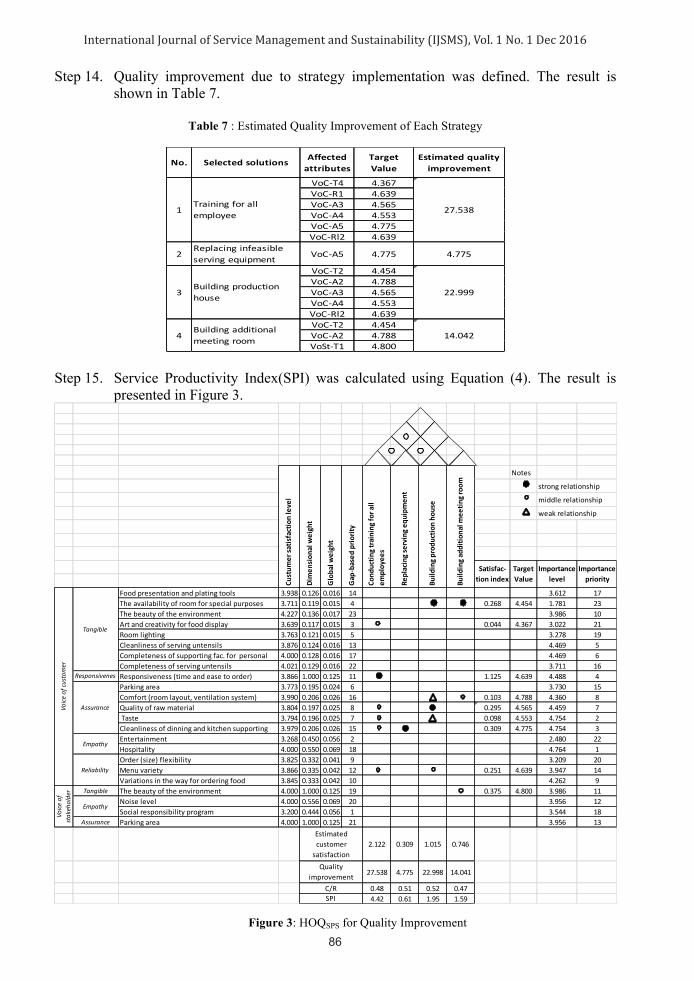
Step 14. Quality improvement due to strategy implementation was defined. The result is shown in Table 7.
Table 7 : Estimated Quality Improvement of Each Strategy
No. Selectedsolutions Affectedattributes
TargetValue
Estimatedqualityimprovement
VoC-T4 4.367VoC-R1 4.639VoC-A3 4.565VoC-A4 4.553VoC-A5 4.775VoC-Rl2 4.639
2Replacinginfeasibleservingequipment VoC-A5 4.775 4.775
VoC-T2 4.454VoC-A2 4.788VoC-A3 4.565VoC-A4 4.553VoC-Rl2 4.639VoC-T2 4.454VoC-A2 4.788VoSt-T1 4.800
1Trainingforallemployee 27.538
3Buildingproductionhouse 22.999
4Buildingadditionalmeetingroom 14.042
Step 15. Service Productivity Index(SPI) was calculated using Equation (4). The result is presented in Figure 3.
Notes
strongrelationship
middlerelationship
weakrelationship
Foodpresentationandplatingtools 3.938 0.126 0.016 14 3.612 17Theavailabilityofroomforspecialpurposes 3.711 0.119 0.015 4 0.268 4.454 1.781 23Thebeautyoftheenvironment 4.227 0.136 0.017 23 3.986 10Artandcreativityforfooddisplay 3.639 0.117 0.015 3 0.044 4.367 3.022 21Roomlighting 3.763 0.121 0.015 5 3.278 19Cleanlinessofservinguntensils 3.876 0.124 0.016 13 4.469 5Completenessofsupportingfac.forpersonal 4.000 0.128 0.016 17 4.469 6Completenessofservinguntensils 4.021 0.129 0.016 22 3.711 16
Responsiveness
Responsiveness(timeandeasetoorder) 3.866 1.000 0.125 11 1.125 4.639 4.488 4Parkingarea 3.773 0.195 0.024 6 3.730 15Comfort(roomlayout,ventilationsystem) 3.990 0.206 0.026 16 0.103 4.788 4.360 8Qualityofrawmaterial 3.804 0.197 0.025 8 0.295 4.565 4.459 7Taste 3.794 0.196 0.025 7 0.098 4.553 4.754 2Cleanlinessofdinningandkitchensupporting 3.979 0.206 0.026 15 0.309 4.775 4.754 3Entertainment 3.268 0.450 0.056 2 2.480 22Hospitality 4.000 0.550 0.069 18 4.764 1Order(size)flexibility 3.825 0.332 0.041 9 3.209 20Menuvariety 3.866 0.335 0.042 12 0.251 4.639 3.947 14Variationsinthewayfororderingfood 3.845 0.333 0.042 10 4.262 9
Tangible Thebeautyoftheenvironment 4.000 1.000 0.125 19 0.375 4.800 3.986 11Noiselevel 4.000 0.556 0.069 20 3.956 12Socialresponsibilityprogram 3.200 0.444 0.056 1 3.544 18
Assurance Parkingarea 4.000 1.000 0.125 21 3.956 13
2.122 0.309 1.015 0.746
27.538 4.775 22.998 14.041
0.48 0.51 0.52 0.474.42 0.61 1.95 1.59
Satisfac-tionindex
TargetValue
SPI
Voice
of
stakeholder
Voice
ofcustomer
Empathy
Reliability
Empathy
Dimen
sion
alw
eigh
t
Tangible
Assurance
Custum
ersa
tisfactionleve
l
Gap
-based
prio
rity
Globa
lweigh
t
Importancelevel
ImportancepriorityCo
nduc
tingtraining
fora
llem
ploy
ees
Build
ingad
ditio
nalm
eetin
groom
Build
ingprod
uctio
nho
use
Replacingse
rvingeq
uipm
ent
Estimatedcustomer
satisfactionQuality
improvementC/R
Figure 3: HOQSPS for Quality Improvement
InternationalJournalofServiceManagementandSustainability(IJSMS),Vo.1No.1Dec2016
DISCUSSION In this study we introduce service productivity index as an important criteria to determine strategy for quality improvement in product-service system. Based on the case study presented, the strategies for improving quality include: (1) conducting training for all employees, (2) replacing unfeasible serving and cooking tools, (3) building production house which is located in a separated area, and (4) building additional meeting room. The calculation obtained 0.56 of cost and revenue ratio which represents current efficiency level of the restaurant. The value of C/R from the implementation of each strategy compared to current condition can be seen in Figure 4. The figure shows that strategy 4 has the lowest C/R. This means that strategy 4 has the highest efficiency level. In contrast, strategy 3 has the lowest efficiency level.
0.48
0.510.52
0.47
0.42
0.44
0.46
0.48
0.5
0.52
0.54
0.56
0.58
1 2 3 4
C/R
Strategy
C/Rnewstrategy
C/Rcurrent
Figure 4: Current C/R Compared to Expected C/R
The value of C/R shows efficiency level of the implementation of a strategy in the view point of financial aspect, without showing the performance of overall system. System performance, however, is represented by SPI value. High customer satisfaction value and low C/R value will result in high system performance. Comparison between SPI, C/R, and customer satisfaction (Cs) can be seen in Figure 5 and 6.
4.42
0.61
1.951.59
2.122
0.309
1.0150.746
0
0.4
0.8
1.2
1.6
2
2.4
2.8
3.2
3.6
4
4.4
4.8
1 2 3 4
Inde
xStrategy
C/Rnewstrategy
SPInewstrategy
Csnewstrategy
Figure 5 : C/R, SPI, and Customer Satisfaction of Each Strategy

International Journal of Service Management and Sustainability (IJSMS), Vol. 1 No. 1 Dec 2016
87
InternationalJournalofServiceManagementandSustainability(IJSMS),Vo.1No.1Dec2016
Step 14. Quality improvement due to strategy implementation was defined. The result is shown in Table 7.
Table 7 : Estimated Quality Improvement of Each Strategy
No. Selectedsolutions Affectedattributes
TargetValue
Estimatedqualityimprovement
VoC-T4 4.367VoC-R1 4.639VoC-A3 4.565VoC-A4 4.553VoC-A5 4.775VoC-Rl2 4.639
2Replacinginfeasibleservingequipment VoC-A5 4.775 4.775
VoC-T2 4.454VoC-A2 4.788VoC-A3 4.565VoC-A4 4.553VoC-Rl2 4.639VoC-T2 4.454VoC-A2 4.788VoSt-T1 4.800
1Trainingforallemployee 27.538
3Buildingproductionhouse 22.999
4Buildingadditionalmeetingroom 14.042
Step 15. Service Productivity Index(SPI) was calculated using Equation (4). The result is presented in Figure 3.
Notes
strongrelationship
middlerelationship
weakrelationship
Foodpresentationandplatingtools 3.938 0.126 0.016 14 3.612 17Theavailabilityofroomforspecialpurposes 3.711 0.119 0.015 4 0.268 4.454 1.781 23Thebeautyoftheenvironment 4.227 0.136 0.017 23 3.986 10Artandcreativityforfooddisplay 3.639 0.117 0.015 3 0.044 4.367 3.022 21Roomlighting 3.763 0.121 0.015 5 3.278 19Cleanlinessofservinguntensils 3.876 0.124 0.016 13 4.469 5Completenessofsupportingfac.forpersonal 4.000 0.128 0.016 17 4.469 6Completenessofservinguntensils 4.021 0.129 0.016 22 3.711 16
Responsiveness
Responsiveness(timeandeasetoorder) 3.866 1.000 0.125 11 1.125 4.639 4.488 4Parkingarea 3.773 0.195 0.024 6 3.730 15Comfort(roomlayout,ventilationsystem) 3.990 0.206 0.026 16 0.103 4.788 4.360 8Qualityofrawmaterial 3.804 0.197 0.025 8 0.295 4.565 4.459 7Taste 3.794 0.196 0.025 7 0.098 4.553 4.754 2Cleanlinessofdinningandkitchensupporting 3.979 0.206 0.026 15 0.309 4.775 4.754 3Entertainment 3.268 0.450 0.056 2 2.480 22Hospitality 4.000 0.550 0.069 18 4.764 1Order(size)flexibility 3.825 0.332 0.041 9 3.209 20Menuvariety 3.866 0.335 0.042 12 0.251 4.639 3.947 14Variationsinthewayfororderingfood 3.845 0.333 0.042 10 4.262 9
Tangible Thebeautyoftheenvironment 4.000 1.000 0.125 19 0.375 4.800 3.986 11Noiselevel 4.000 0.556 0.069 20 3.956 12Socialresponsibilityprogram 3.200 0.444 0.056 1 3.544 18
Assurance Parkingarea 4.000 1.000 0.125 21 3.956 13
2.122 0.309 1.015 0.746
27.538 4.775 22.998 14.041
0.48 0.51 0.52 0.474.42 0.61 1.95 1.59
Satisfac-tionindex
TargetValue
SPI
Voice
of
stakeholder
Voice
ofcustomer
Empathy
Reliability
Empathy
Dimen
sion
alw
eigh
t
Tangible
Assurance
Custum
ersa
tisfactionleve
l
Gap
-based
prio
rity
Globa
lweigh
t
Importancelevel
ImportancepriorityCo
nduc
tingtraining
fora
llem
ploy
ees
Build
ingad
ditio
nalm
eetin
groom
Build
ingprod
uctio
nho
use
Replacingse
rvingeq
uipm
ent
Estimatedcustomer
satisfactionQuality
improvementC/R
Figure 3: HOQSPS for Quality Improvement
InternationalJournalofServiceManagementandSustainability(IJSMS),Vo.1No.1Dec2016
DISCUSSION In this study we introduce service productivity index as an important criteria to determine strategy for quality improvement in product-service system. Based on the case study presented, the strategies for improving quality include: (1) conducting training for all employees, (2) replacing unfeasible serving and cooking tools, (3) building production house which is located in a separated area, and (4) building additional meeting room. The calculation obtained 0.56 of cost and revenue ratio which represents current efficiency level of the restaurant. The value of C/R from the implementation of each strategy compared to current condition can be seen in Figure 4. The figure shows that strategy 4 has the lowest C/R. This means that strategy 4 has the highest efficiency level. In contrast, strategy 3 has the lowest efficiency level.
0.48
0.510.52
0.47
0.42
0.44
0.46
0.48
0.5
0.52
0.54
0.56
0.58
1 2 3 4
C/R
Strategy
C/Rnewstrategy
C/Rcurrent
Figure 4: Current C/R Compared to Expected C/R
The value of C/R shows efficiency level of the implementation of a strategy in the view point of financial aspect, without showing the performance of overall system. System performance, however, is represented by SPI value. High customer satisfaction value and low C/R value will result in high system performance. Comparison between SPI, C/R, and customer satisfaction (Cs) can be seen in Figure 5 and 6.
4.42
0.61
1.951.59
2.122
0.309
1.0150.746
0
0.4
0.8
1.2
1.6
2
2.4
2.8
3.2
3.6
4
4.4
4.8
1 2 3 4
Inde
x
Strategy
C/Rnewstrategy
SPInewstrategy
Csnewstrategy
Figure 5 : C/R, SPI, and Customer Satisfaction of Each Strategy

International Journal of Service Management and Sustainability (IJSMS), Vol. 1 No. 1 Dec 2016
88
InternationalJournalofServiceManagementandSustainability(IJSMS),Vo.1No.1Dec2016
4.42
0.61
1.95
1.59
2.122
0.309
1.015
0.7460.256
0.0260.132
0.166
3.79
0.55
1.811.33
0.0
0.5
1.0
1.5
2.0
2.5
3.0
3.5
4.0
4.5
1 2 3 4
Inde
x
Strategy
SPInewstrategy
Csnewstrategy
Cscurrent
SPIcurrent
Figure 6 : SPI of Each Strategy Low cost does not always result in low quality or vice versa. According to Figure 6, it can be seen that strategy 1, which has the lowest implementation cost, could improve customer satisfaction (Cs) from 0.256 to 2.122 (1.866) and SPI from 3.79 to 4.42 (0.63). The rise of Cs at this strategy is significant enough. Strategy 3, which is the strategy with the highest cost, could increase Cs by 0.884 and SPI by 0.14. This means that although strategy 3 has the highest cost but it resulted in increasing Cs and SPI far below strategy 1. The third strategy based on SPI value is strategy 4. It yielded increasing Cs from 0.166 to 0.746 and SPI from 1.33 to 1.59. The last priority is strategy 2, which could improve Cs from 0.026 to 0.309 and SPI from 0.55 to 0.61. The theoretical contribution of this study lies in our QFD approach of sustainable service concept by considering customer and stakeholder requirements and introducing service productivity index in the strategy selection phase. Methodologically, we have shown how our approach can be operated and applied. In terms of the managerial implications, the model developed in this study will therefore, help the management to decide and implement the portfolio of strategies that consider three- dimensional sustainability aspects of the social, environmental and economic goals within the limited budget. It is worth noting that . to estimate quality improvement, it should be based on the historical data. With the aid of strong data, the estimation of strategy impact will be more accurate. In addition, the implementation of a new strategy requires serious monitoring as it is used for evaluating the impact of the implementation of the strategy. Monitoring can be done periodically using questionnaires distributed to customers and stakeholders. Besides monitoring, evaluation is also necessary to do. This can be performed periodically after monitoring activity. The evaluation result can be used as a basis to conduct an assessment to determine the strengths and weaknesses of the company. In addition, it can be used for clustering strategy implementation, particularly for short term, middle term, or long-term goals.
InternationalJournalofServiceManagementandSustainability(IJSMS),Vo.1No.1Dec2016
CONCLUSION
We have modified QFD, particularly developing HOQ for a sustainable product-service system, named HOQSPS. The purposes of modification are to determine strategies for improving product-service system to achieve sustainability goals while keeping competitiveness. The concept is performed by implementing strategies to improve the quality of services, with regard to sustainability aspects and the implementation cost. In this case, we have selected strategies based on customer and stakeholder requirements and applied the concept of service productivity index to measure the performance of the system. HOQSPS that was developed in this study has been implemented in a Javanese restaurant located in the province Yogyakarta Special Region. We found that the high-cost strategy did not necessarily provide a significant impact on customer satisfaction and SPI. The result of the case study showed that the model could be implemented with some managerial implication such as monitoring and evaluation during the strategy implementation. The management should also keep the data of improvement trends due to strategy implementation. This is because the prediction of system improvement will be based on the historical data or company experiences. Regarding environmental aspect as one of the sustainability pillars, this study can be further developed by considering environmental performance of the system. Hence, there should be an integrated performance index taking services and environmental aspects into consideration. REFERENCES An, Y., Lee, S., & Park,Y. (2008). Development of an integrated product-service road-map
with QFD: a case study on mobile communications. Inernational Journal of Service .Industry Management, 19(5), 621–638.
Aurich, J., Fuchs, C., & Wagenknecht, C. (2006). Life cycle oriented design of technical product–service systems. Journal of .Cleaner Production, 14(17), 1480–1494.
Bergquist, K., & Abeysekara, J. (1996) Quality function deployment (QFD)- a means for developing usable products. International Journal of Industrial Ergonomics, 18(4), 269-275.
Beuren, F.H., Ferreira, M.G.G., & Miguel, P.A.C. (2013) Product-service systems: a literature review on integrated products and services. Journal of Cleaner Production, 47, 222–231.
Bottani, E., & Rizzi, A. (2006). Strategic management of logistics service: a fuzzy QFD approach., International Journal of Production Economics, 13, 585-599.
Busset, G. (2014). Approach for evaluation of systems sustainability guided by life cycle thinking: application to olive oil agroindustry.
Chan, L.K., & Wu, M.L. (2002). Quality function deployment: a literature review. European Journal of Operational Research, 143, 463-497.
Chowdhury, Md., M., H., & Quaddus, M.A. (2016), A multi-phased QFD based optimization approach to sustainable service design. Inernational Journal of Production Economics, 171, 165–178.
Cross, N. (1994), Engineering Design Methods: Strategies for Product Design, Second Edition, New York: John Wiley & Sons.

International Journal of Service Management and Sustainability (IJSMS), Vol. 1 No. 1 Dec 2016
89
InternationalJournalofServiceManagementandSustainability(IJSMS),Vo.1No.1Dec2016
4.42
0.61
1.95
1.59
2.122
0.309
1.015
0.7460.256
0.0260.132
0.166
3.79
0.55
1.811.33
0.0
0.5
1.0
1.5
2.0
2.5
3.0
3.5
4.0
4.5
1 2 3 4
Inde
x
Strategy
SPInewstrategy
Csnewstrategy
Cscurrent
SPIcurrent
Figure 6 : SPI of Each Strategy Low cost does not always result in low quality or vice versa. According to Figure 6, it can be seen that strategy 1, which has the lowest implementation cost, could improve customer satisfaction (Cs) from 0.256 to 2.122 (1.866) and SPI from 3.79 to 4.42 (0.63). The rise of Cs at this strategy is significant enough. Strategy 3, which is the strategy with the highest cost, could increase Cs by 0.884 and SPI by 0.14. This means that although strategy 3 has the highest cost but it resulted in increasing Cs and SPI far below strategy 1. The third strategy based on SPI value is strategy 4. It yielded increasing Cs from 0.166 to 0.746 and SPI from 1.33 to 1.59. The last priority is strategy 2, which could improve Cs from 0.026 to 0.309 and SPI from 0.55 to 0.61. The theoretical contribution of this study lies in our QFD approach of sustainable service concept by considering customer and stakeholder requirements and introducing service productivity index in the strategy selection phase. Methodologically, we have shown how our approach can be operated and applied. In terms of the managerial implications, the model developed in this study will therefore, help the management to decide and implement the portfolio of strategies that consider three- dimensional sustainability aspects of the social, environmental and economic goals within the limited budget. It is worth noting that . to estimate quality improvement, it should be based on the historical data. With the aid of strong data, the estimation of strategy impact will be more accurate. In addition, the implementation of a new strategy requires serious monitoring as it is used for evaluating the impact of the implementation of the strategy. Monitoring can be done periodically using questionnaires distributed to customers and stakeholders. Besides monitoring, evaluation is also necessary to do. This can be performed periodically after monitoring activity. The evaluation result can be used as a basis to conduct an assessment to determine the strengths and weaknesses of the company. In addition, it can be used for clustering strategy implementation, particularly for short term, middle term, or long-term goals.
InternationalJournalofServiceManagementandSustainability(IJSMS),Vo.1No.1Dec2016
CONCLUSION
We have modified QFD, particularly developing HOQ for a sustainable product-service system, named HOQSPS. The purposes of modification are to determine strategies for improving product-service system to achieve sustainability goals while keeping competitiveness. The concept is performed by implementing strategies to improve the quality of services, with regard to sustainability aspects and the implementation cost. In this case, we have selected strategies based on customer and stakeholder requirements and applied the concept of service productivity index to measure the performance of the system. HOQSPS that was developed in this study has been implemented in a Javanese restaurant located in the province Yogyakarta Special Region. We found that the high-cost strategy did not necessarily provide a significant impact on customer satisfaction and SPI. The result of the case study showed that the model could be implemented with some managerial implication such as monitoring and evaluation during the strategy implementation. The management should also keep the data of improvement trends due to strategy implementation. This is because the prediction of system improvement will be based on the historical data or company experiences. Regarding environmental aspect as one of the sustainability pillars, this study can be further developed by considering environmental performance of the system. Hence, there should be an integrated performance index taking services and environmental aspects into consideration. REFERENCES An, Y., Lee, S., & Park,Y. (2008). Development of an integrated product-service road-map
with QFD: a case study on mobile communications. Inernational Journal of Service .Industry Management, 19(5), 621–638.
Aurich, J., Fuchs, C., & Wagenknecht, C. (2006). Life cycle oriented design of technical product–service systems. Journal of .Cleaner Production, 14(17), 1480–1494.
Bergquist, K., & Abeysekara, J. (1996) Quality function deployment (QFD)- a means for developing usable products. International Journal of Industrial Ergonomics, 18(4), 269-275.
Beuren, F.H., Ferreira, M.G.G., & Miguel, P.A.C. (2013) Product-service systems: a literature review on integrated products and services. Journal of Cleaner Production, 47, 222–231.
Bottani, E., & Rizzi, A. (2006). Strategic management of logistics service: a fuzzy QFD approach., International Journal of Production Economics, 13, 585-599.
Busset, G. (2014). Approach for evaluation of systems sustainability guided by life cycle thinking: application to olive oil agroindustry.
Chan, L.K., & Wu, M.L. (2002). Quality function deployment: a literature review. European Journal of Operational Research, 143, 463-497.
Chowdhury, Md., M., H., & Quaddus, M.A. (2016), A multi-phased QFD based optimization approach to sustainable service design. Inernational Journal of Production Economics, 171, 165–178.
Cross, N. (1994), Engineering Design Methods: Strategies for Product Design, Second Edition, New York: John Wiley & Sons.

International Journal of Service Management and Sustainability (IJSMS), Vol. 1 No. 1 Dec 2016
90
InternationalJournalofServiceManagementandSustainability(IJSMS),Vo.1No.1Dec2016
De Camillis, C., Raggi, A., & Petti, L. (2004), Comprehensive QFDE for service organizations: proposal of a new tool to support a design for environment process for services. Proceedings of The Sixth International Conference on Ecobalance, 571-574, Tsukuba, Japan, 25-27 Oktober 2004.
Douallea, B., Medinia, K., Bouchera, X., & Laforesta, V. (2015). Investigating sustainability assessment methods of product-service systems. Procedia CIRP 30, 161 – 166.
Fitzsimmons, J., & Fitzsimmons, M. (2004). Service management: Operations, strategy, and information technology, Boston: McGraw-Hill.
Fornell, C. (2003). Boost stock performance, nation’s economy, Quality Progress, 62(2), 25-31.
Goedkoop, M., van Halen, C., te Riele, H., & Rommens, P. (1999). Product Service Systems, Ecological & Economic Basics. www.pre.nl/pss/default.htm,
Goldstein, S.M., Johnston, R., Duffy, J., & Rao, J.. (2002).The service concept: the missing link in service design research? Journal of Operations Management, 20(2), 121–134.
Hallstedt, S., Thompson, A., & Lindahl, P. (2013). Key elements for implementing a strategic sustainability perspective in the product innovation process. Journal of Cleaner Production, (51), 277-288.
Hallstedt, S.I., & Thompson, A.W. (2011). Sustainability-driven product development-some challenges and opportunities for the aero Industry, Proceedings of International Society for Airbreathing Engines (ISABE), Gothenburg, Sweden.
Indrianti, N. (2012a). An exploratory study of service productivity index for service industry evaluation. International Journal of Services, Economics and Management, 4(4), 331-343.
Indrianti, N. (2012b). QFD approach for evaluating and improving strategies of environmentally conscious integrated product and service, Paper Presented at the International Research Symposium in Service Management, Beijing, 3-7 Juli 2012.
Kim, J. (2011). Manufacturing or service? market saturation and cycles of over-investment as a clue to future of service economies. Technological Forecasting & Social Change, 78(201), 1345-1355.
Lam, J. S. L. (2015). Designing a sustainable maritime supply chain: A hybrid QFD–ANP approach. Transportation Research Part E, 78, 70–81.
Maxwell, D., Sheate, W., & van der Vorst, R. (2006). Functional and systems aspects of the sustainable product and service development approach for industry. Journal of Cleaner Production, 14(17),1466–79.
Mazur, G.H. (1993). QFD for service industries: from voice of customer to task deployment. The Fifth Symposium on Quality Function Deployment, Novi, Michigan, June 20-22 1993.
Meier, H., Roy, R., & Seliger, G. (2010) Industrial product service systems-IPS2, CIRP Annals-Manufacturing Technology, 59, 607-627.
Mylan, J. (2015). Understanding the Diffusion of Sustainable Product-Service Systems: Insights from the Sociology of Consumption and Practice Theory. Journal of Cleaner Production, 97, 13–20.
Nunnally, J. C. (1978). Psychometric Theory, 2nd ed., New York: McGraw-Hill. Pahl, G., Wallace, K., & Blessing, L.L. (2007). Engineering design: a systematic approach.
London: Springer Parasuraman, A., Zeithaml, V.A., & Berry, L.L. (1988). SERVQUAL: a multiple item-scale
for measuring consumer perceptions of service quality. Journal of Retailing, 64, 12-40.
InternationalJournalofServiceManagementandSustainability(IJSMS),Vo.1No.1Dec2016
Paulo, T.T.S., & Miguel, A.C. (2016). Exploring the consumption side of sustainable product-service systems (PSS): An empirical study and insights for PSS sustainable design. CIRP Journal of Manufacturing Science and Technology, 15, 74–81.
Sakao, T., Watanabe, K., & Shimomura, Y. (2003). A method to support environmentally conscious service design using Quality Function Deployment (QFD), Paper Presented at the Environmentally Conscious Design and Inverse Manufacturing, EcoDesign 3rd International Symposium.
Szekely, F., & Knirsch, M. (2005). Responsible leadership and corporate social responsibility: metrics for sustainable performance. European Management Journal, 23 (6), 628–647.
Tseng, T., & Huang, C. (2016), Sustainable service and energy provision based on agile rule induction. International Journal of Production Economics, 181, 273–288.
Wolniak, E.R., & Sȩdek, A. (2009). Using QFD method for the ecological designing of products and services. Qual.Quant, 43(4),695–701.
World Commission on Environment and Development (WCED) (2002). The Johannesburg Declaration on Sustainable Development, World Summit on Sustainable Development (WSSD), http://www.johannesburgsummit.org/
Yang, M., Khan, F.I., Sadiq, R., & Amyotte, P. (2011). A rought set-based quality function deployment (QFD) approach for envrionmental performance evaluation: a case of offshore oil and gas operations, Journal of Cleaner Production, 19,1513-1526.

International Journal of Service Management and Sustainability (IJSMS), Vol. 1 No. 1 Dec 2016
91
InternationalJournalofServiceManagementandSustainability(IJSMS),Vo.1No.1Dec2016
De Camillis, C., Raggi, A., & Petti, L. (2004), Comprehensive QFDE for service organizations: proposal of a new tool to support a design for environment process for services. Proceedings of The Sixth International Conference on Ecobalance, 571-574, Tsukuba, Japan, 25-27 Oktober 2004.
Douallea, B., Medinia, K., Bouchera, X., & Laforesta, V. (2015). Investigating sustainability assessment methods of product-service systems. Procedia CIRP 30, 161 – 166.
Fitzsimmons, J., & Fitzsimmons, M. (2004). Service management: Operations, strategy, and information technology, Boston: McGraw-Hill.
Fornell, C. (2003). Boost stock performance, nation’s economy, Quality Progress, 62(2), 25-31.
Goedkoop, M., van Halen, C., te Riele, H., & Rommens, P. (1999). Product Service Systems, Ecological & Economic Basics. www.pre.nl/pss/default.htm,
Goldstein, S.M., Johnston, R., Duffy, J., & Rao, J.. (2002).The service concept: the missing link in service design research? Journal of Operations Management, 20(2), 121–134.
Hallstedt, S., Thompson, A., & Lindahl, P. (2013). Key elements for implementing a strategic sustainability perspective in the product innovation process. Journal of Cleaner Production, (51), 277-288.
Hallstedt, S.I., & Thompson, A.W. (2011). Sustainability-driven product development-some challenges and opportunities for the aero Industry, Proceedings of International Society for Airbreathing Engines (ISABE), Gothenburg, Sweden.
Indrianti, N. (2012a). An exploratory study of service productivity index for service industry evaluation. International Journal of Services, Economics and Management, 4(4), 331-343.
Indrianti, N. (2012b). QFD approach for evaluating and improving strategies of environmentally conscious integrated product and service, Paper Presented at the International Research Symposium in Service Management, Beijing, 3-7 Juli 2012.
Kim, J. (2011). Manufacturing or service? market saturation and cycles of over-investment as a clue to future of service economies. Technological Forecasting & Social Change, 78(201), 1345-1355.
Lam, J. S. L. (2015). Designing a sustainable maritime supply chain: A hybrid QFD–ANP approach. Transportation Research Part E, 78, 70–81.
Maxwell, D., Sheate, W., & van der Vorst, R. (2006). Functional and systems aspects of the sustainable product and service development approach for industry. Journal of Cleaner Production, 14(17),1466–79.
Mazur, G.H. (1993). QFD for service industries: from voice of customer to task deployment. The Fifth Symposium on Quality Function Deployment, Novi, Michigan, June 20-22 1993.
Meier, H., Roy, R., & Seliger, G. (2010) Industrial product service systems-IPS2, CIRP Annals-Manufacturing Technology, 59, 607-627.
Mylan, J. (2015). Understanding the Diffusion of Sustainable Product-Service Systems: Insights from the Sociology of Consumption and Practice Theory. Journal of Cleaner Production, 97, 13–20.
Nunnally, J. C. (1978). Psychometric Theory, 2nd ed., New York: McGraw-Hill. Pahl, G., Wallace, K., & Blessing, L.L. (2007). Engineering design: a systematic approach.
London: Springer Parasuraman, A., Zeithaml, V.A., & Berry, L.L. (1988). SERVQUAL: a multiple item-scale
for measuring consumer perceptions of service quality. Journal of Retailing, 64, 12-40.
InternationalJournalofServiceManagementandSustainability(IJSMS),Vo.1No.1Dec2016
Paulo, T.T.S., & Miguel, A.C. (2016). Exploring the consumption side of sustainable product-service systems (PSS): An empirical study and insights for PSS sustainable design. CIRP Journal of Manufacturing Science and Technology, 15, 74–81.
Sakao, T., Watanabe, K., & Shimomura, Y. (2003). A method to support environmentally conscious service design using Quality Function Deployment (QFD), Paper Presented at the Environmentally Conscious Design and Inverse Manufacturing, EcoDesign 3rd International Symposium.
Szekely, F., & Knirsch, M. (2005). Responsible leadership and corporate social responsibility: metrics for sustainable performance. European Management Journal, 23 (6), 628–647.
Tseng, T., & Huang, C. (2016), Sustainable service and energy provision based on agile rule induction. International Journal of Production Economics, 181, 273–288.
Wolniak, E.R., & Sȩdek, A. (2009). Using QFD method for the ecological designing of products and services. Qual.Quant, 43(4),695–701.
World Commission on Environment and Development (WCED) (2002). The Johannesburg Declaration on Sustainable Development, World Summit on Sustainable Development (WSSD), http://www.johannesburgsummit.org/
Yang, M., Khan, F.I., Sadiq, R., & Amyotte, P. (2011). A rought set-based quality function deployment (QFD) approach for envrionmental performance evaluation: a case of offshore oil and gas operations, Journal of Cleaner Production, 19,1513-1526.


![Prezentare QFD Feliator[1]](https://img.dokumen.tips/doc/110x75/5571fe6e49795991699b5d22/prezentare-qfd-feliator1.jpg)


