Embed Size (px)
Citation preview

+
Qcancer: symptom based approach to early diagnosis
of cancer Julia Hippisley-Cox,
GP, Professor Epidemiology & Director ClinRisk Ltd

Acknowledgements
Co-authors
QResearch database
EMIS & contributing practices & User Group
University of Nottingham
ClinRisk (software)
Oxford University (independent validation)
Macmillan Cancer Support (funding implementation)
Copyright ClinRisk Ltd (2013) all rights reserved

Overview of talk on QCancer
QResearch database
Background on ClinRisk Scores
QCancer Model development
QCancer Model validation
QCancer Implementation
Pilot work with Macmillan and CRUK evaluation
Copyright ClinRisk Ltd (2013) all rights reserved

QResearch Database
www.qresearch.org
Over 700 general practices across the UK, 14 million patients
Not-for-profit venture between EMIS & Nottingham University
EMIS covers 56% of UK GP practices
Patient level pseudonymised database for research
Data linkage – deaths, deprivation, cancer, HES
Available for peer reviewed academic research where
outputs made publically available
Copyright ClinRisk Ltd (2013) all rights reserved

ClinRisk Scores –new family of Risk Prediction tools
Individual assessment
Who is most at risk of current or preventable disease?
Who is likely to benefit from interventions?
What is the balance of risks and benefits for my patient?
Enable informed consent and shared decisions
Population risk stratification
Identification of rank ordered list of patients for recall or reassurance
GP systems integration
Allow updates tool over time, audit of impact on services and outcomes
Availability
All published, publically available as free open source or professionally supported closed source software
Copyright ClinRisk Ltd (2013) all rights reserved

ClinRisk scores and national
guidance
Risk score Outcome NICE guidance Implementation
Qrisk.org 10 year risk of
CVD
Approved CG68 (2008)
QOF & DH vascular
screening program
All major GP
suppliers
Qdiabetes.org 10 year risk
diabetes
Approved PH38 (2012) EMIS (largest
supplier > 55%)
Qfracture.org 10yr risk of
fracture
Approved CG146
(2012)
QOF 2013
EMIS 2013 +
London CCGs
Qthrombosis.org Risk of VTE Relevant to CG92 EMIS 2013
Qcancer.org Current
cancer risk
Relevant to current
review
Pilot BMJ
informatica.
Later all suppliers
Copyright ClinRisk Ltd (2013) all rights reserved

Early diagnosis of cancer: The
problem
UK has relatively poor track record when compared with
other European countries
Partly due to late diagnosis with estimated 7,500+ lives lost
annually
Later diagnosis due to mixture of
late presentation by patient (alack awareness)
Late recognition by GP
Delays in secondary care
Copyright ClinRisk Ltd (2013) all rights reserved

Why symptoms based approach?
Many patients present with symptoms
GPs need to decide which patients to investigate and refer
Decision support tool must mirror setting where decisions made
Symptoms based approach needed (rather than cancer based)
Must account for multiple symptoms
Must have face clinical validity eg adjust for age, sex, smoking,
Family history
Need to be able to update to meet changing requirements,
populations, recorded data
Copyright ClinRisk Ltd (2013) all rights reserved
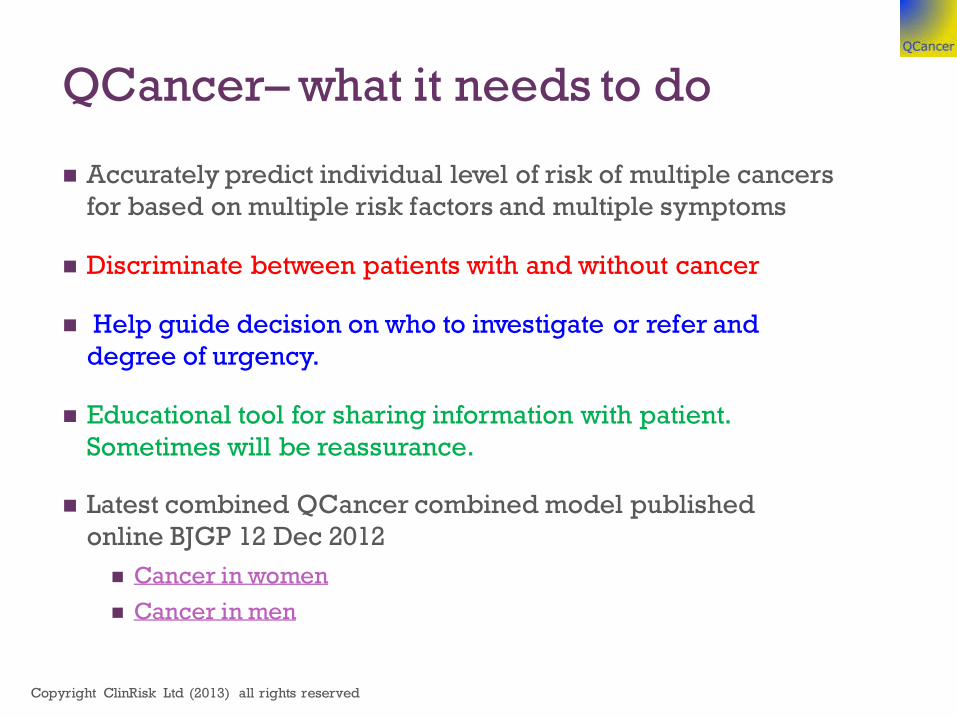
QCancer– what it needs to do
Accurately predict individual level of risk of multiple cancers
for based on multiple risk factors and multiple symptoms
Discriminate between patients with and without cancer
Help guide decision on who to investigate or refer and
degree of urgency.
Educational tool for sharing information with patient.
Sometimes will be reassurance.
Latest combined QCancer combined model published
online BJGP 12 Dec 2012
Cancer in women
Cancer in men
Copyright ClinRisk Ltd (2013) all rights reserved

Methods – development algorithm
Representative cohort from QResearch 2.5 million men &
women aged 25-89 years
cancer outcome - all new diagnoses on GP record or linked
deaths record in 2 years
Identify key symptoms
Identify key risk factors
Established methods to develop risk prediction algorithm
Measure of absolute risk of any cancer as well as by cancer
type
Copyright ClinRisk Ltd (2013) all rights reserved
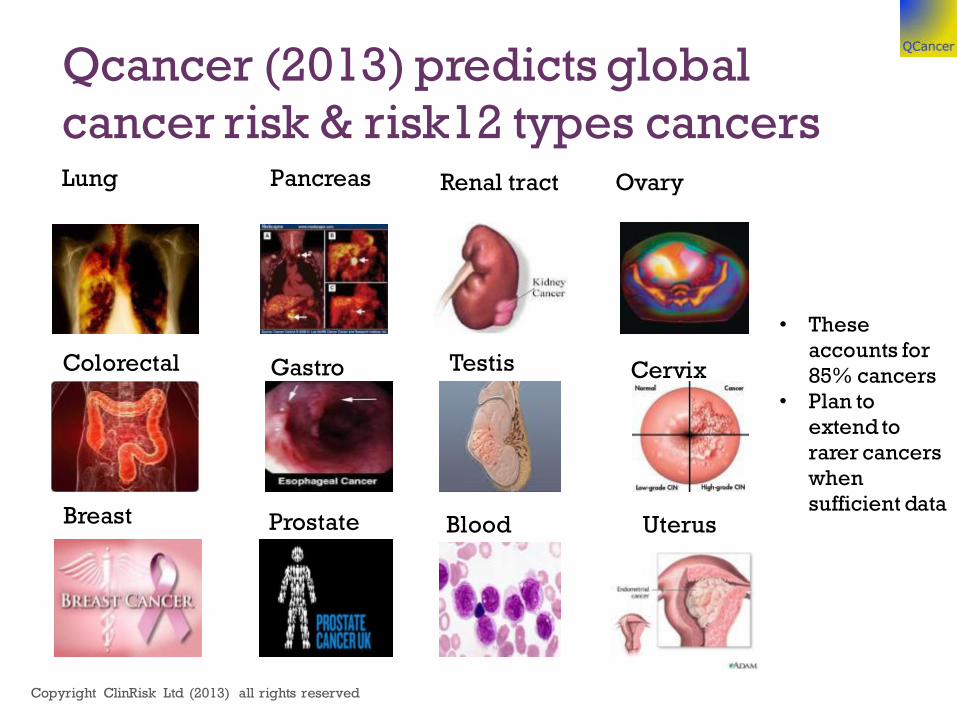
Qcancer (2013) predicts global
cancer risk & risk12 types cancers Pancreas Lung Renal tract Ovary
Colorectal Gastro Testis
Breast Prostate Blood
Cervix
Uterus
• These
accounts for
85% cancers
• Plan to
extend to
rarer cancers
when
sufficient data
Copyright ClinRisk Ltd (2013) all rights reserved

Independent risk factors in model
Age & sex
Smoking status
Deprivation score
Family history of cancer
COPD
Endometrial hyperplasia/polyp
Chronic pancreatitis
Type 2 diabetes
Anaemia (HB < 11g/DL)
Venous thromboembolism
Copyright ClinRisk Ltd (2013) all rights reserved
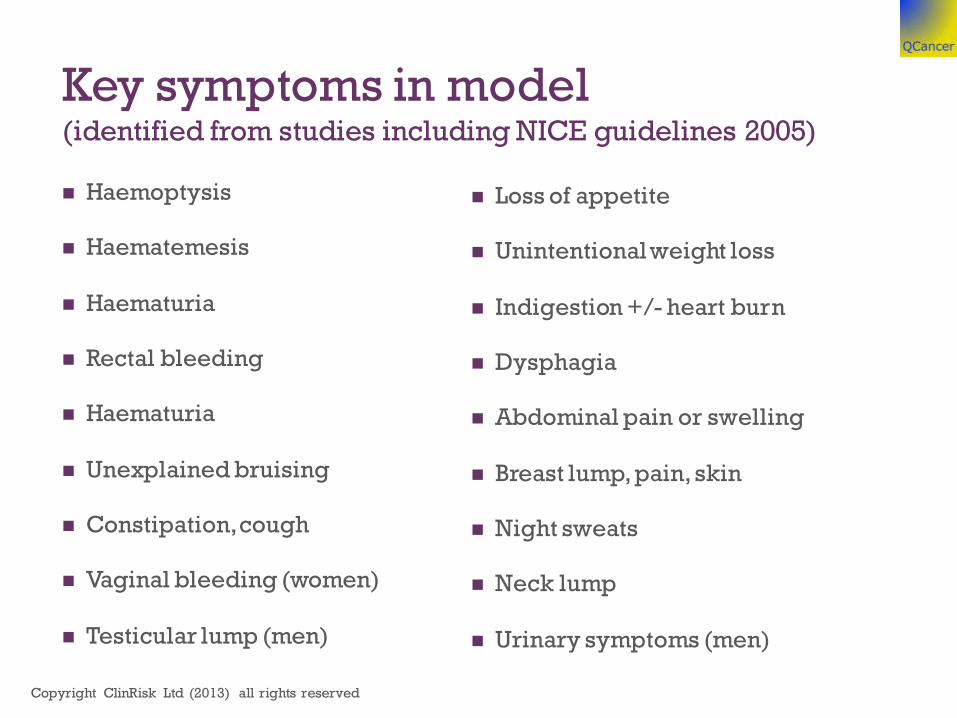
Key symptoms in model (identified from studies including NICE guidelines 2005)
Haemoptysis
Haematemesis
Haematuria
Rectal bleeding
Haematuria
Unexplained bruising
Constipation, cough
Vaginal bleeding (women)
Testicular lump (men)
Loss of appetite
Unintentional weight loss
Indigestion +/- heart burn
Dysphagia
Abdominal pain or swelling
Breast lump, pain, skin
Night sweats
Neck lump
Urinary symptoms (men)
Copyright ClinRisk Ltd (2013) all rights reserved

QCancer symptoms map women blood breast cervix CRC OG lung other ovary pancreas renal uterine Total
Abdo distension + + + 3
Abdo pain + + + + + + + + + 9
Anaemia + + + + + + + + 8
Appetite loss + + + + + + + 7
Breast lump + + 2
Breast pain + 1
Breast skin/nipple
changes
+ 1
Bruising + 1
Change in bowel + + + + 4
Constipation + + 2
Cough + 1
Dysphagia + + + + 4
Haematemesis + + + 3
Haematuria + + + + + + 6
Haemoptysis + 1
Heartburn + 1
Indigestion + + + + + + 6
IMB + + 2
Neck lump + + + 3
Night sweats + 1
PCB + 1
PMB + + + + + + + 7
Rectal bleed + 1
VTE + + + + + + + + + + 10
Weight loss + + + + + + + + 8
Total 10 5 7 9 9 9 4 0 8 7 5 n/a

blood CRC gastro lung other pancreas prostate renal testis total
Abdo distension + + + 3
Abdo pain + + + + + + + + 8
Anaemia + + + + + 5
Appetite loss + + + + + + + 7
Change in bowel + + 2
Constipation + + + 3
Cough + 1
Dysphagia + + + + + 5
Frequency + 1
Haematemesis + + + 3
Haematuria + + + + 4
Haemoptysis + + + 3
Heartburn + 1
Impotence + 1
Indigestion + + + + + 5
Neck lump + + + + 4
Night sweats + + + 3
Nocturia + 1
Rectal bleed + + 2
Retention + 1
Testicular lump + + + 3
Testicular pain + + 2
VTE + + + + + + 6
Weight loss + + + + + + + + 8
Grand Total 13 8 9 11 14 8 12 4 3 82
QCancer symptoms map men

Methods - validation is crucial
Essential to demonstrate the tools work and identify right
people in an efficient manner
Tested performance
separate sample of QResearch practices
external dataset (Vision practices) at Oxford University
Measures of discrimination - identifying those who do and
don’t have cancer
Measures of calibration - closeness of predicted risk to
observed risk
Measure performance – positive predictive value, negative
predictive value, sensitivity, specificity at different thresholds
Copyright ClinRisk Ltd (2013) all rights reserved

Gold standard validation Independent – not involving original study authors
External - test on cohort of patients not involved in original derivation
Essential step to check model
Identifies right patients
Works in other settings – transportability
Different from evaluation
QCancer validation by Oxford University (Collins & Altman) Collins GS, Altman DG. Identifying patients with undetected gastro-oesophageal cancer in primary
care: External validation of QCancer® (Gastro-Oesophageal). European journal of cancer, 2012
Collins GS, Altman DG. Identifying women with undetected ovarian cancer: independent and external validation of QCancer((R)) (Ovarian) prediction model. European journal of cancer care 2012 doi: 10.1111/ecc.12015.
Collins GS, Altman DG. Identifying patients with undetected colorectal cancer: an independent validation of QCancer (Colorectal). Br J Cancer 2012
Collins GS, Altman DG. Identifying patients with undetected renal tract cancer in primary care: An independent and external validation of QCancer (renal) prediction model. Cancer Epidemiology; 2012
Copyright ClinRisk Ltd (2013) all rights reserved

Validation Results Women:
Discrimination ROC values
Combined
symptoms model*
in separate
QResearch cohort
Individual
cancer models in
separate cohort
from QResearch
independent
external validation
in Vision data
any cancer 0.85 n/a In progress
lung 0.91 0.92 In press
colorectal 0.89 0.89 0.92
gastro 0.90 0.89 0.93
pancreas 0.87 0.84 In press
ovary 0.84 0.84 0.86
renal 0.90 0.91 0.92
breast 0.88 n/a In progress
blood 0.79 n/a In progress
uterus 0.91 n/a In progress
cervix 0.73 n/a In progress
other 0.82 n/a In progress
*reference: Symptoms and risk factors to identify women with suspected cancer in primary care; BJGP; 2013
Copyright ClinRisk Ltd (2013) all rights reserved
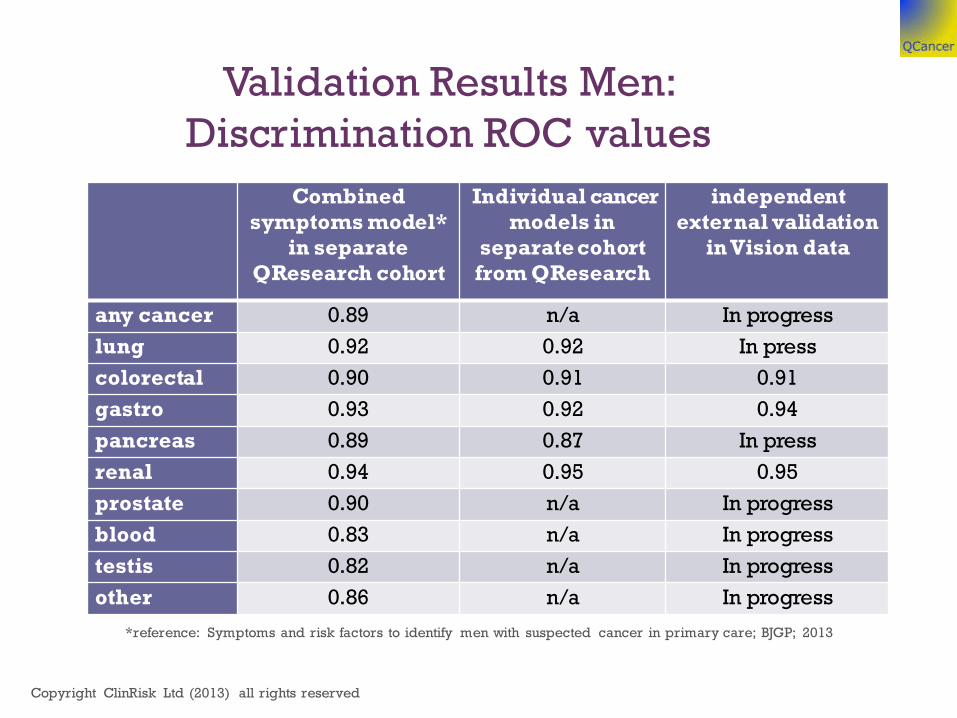
Combined
symptoms model*
in separate
QResearch cohort
Individual cancer
models in
separate cohort
from QResearch
independent
external validation
in Vision data
any cancer 0.89 n/a In progress
lung 0.92 0.92 In press
colorectal 0.90 0.91 0.91
gastro 0.93 0.92 0.94
pancreas 0.89 0.87 In press
renal 0.94 0.95 0.95
prostate 0.90 n/a In progress
blood 0.83 n/a In progress
testis 0.82 n/a In progress
other 0.86 n/a In progress
*reference: Symptoms and risk factors to identify men with suspected cancer in primary care; BJGP; 2013
Validation Results Men:
Discrimination ROC values
Copyright ClinRisk Ltd (2013) all rights reserved

Validation women calibration
mean predicted & observed risk 0.0
0.5
1.0
1.5
0 5 10
female
Observed risk Predicted risk
% r
isk
Tenth of predicted risk
Graphs by sex
lung
0.0
0.5
1.0
1.5
0 5 10
female
Observed risk Predicted risk
% r
isk
Tenth of predicted risk
Graphs by sex
colorectal
Copyright ClinRisk Ltd (2013) all rights reserved

Validation women calibration
mean predicted & observed risk 0.0
0.2
0.4
0.6
0 5 10
female
Observed risk Predicted risk
% r
isk
Tenth of predicted risk
Graphs by sex
gastro-oesophageal
0.0
0.2
0.4
0 5 10
female
Observed risk Predicted risk
% r
isk
Tenth of predicted risk
Graphs by sex
pancreas
Copyright ClinRisk Ltd (2013) all rights reserved

Validation women calibration
mean predicted & observed risk 0.0
0.2
0.4
0.6
0 5 10
female
Observed risk Predicted risk
% r
isk
Tenth of predicted risk
Graphs by sex
renal
0.0
0.5
0 5 10
female
Observed risk Predicted risk
% r
isk
Tenth of predicted risk
Graphs by sex
blood
Copyright ClinRisk Ltd (2013) all rights reserved

Validation women calibration
mean predicted & observed risk 0.0
0.2
0.4
0.6
0 5 10
female
Observed risk Predicted risk
% r
isk
Tenth of predicted risk
Graphs by sex
ovary
0.0
5.0
0 5 10
female
Observed risk Predicted risk
% r
isk
Tenth of predicted risk
Graphs by sex
breast
Copyright ClinRisk Ltd (2013) all rights reserved

Validation women calibration
mean predicted & observed risk 0.0
0.2
0.4
0.6
0 5 10
female
Observed risk Predicted risk
% r
isk
Tenth of predicted risk
Graphs by sex
uterus
0.0
0.1
0.2
0 5 10
female
Observed risk Predicted risk
% r
isk
Tenth of predicted risk
Graphs by sex
cervix
Copyright ClinRisk Ltd (2013) all rights reserved

Comparison strategies in
women based on top 10% risk Risk
threshold
%
Sensitivit
y (%)
Specificit
y
(%)
PPV
(%)
NPV
(%)
lung cancer 0.38 72.1 90.1 1.2 99.9
colorectal 0.35 68.2 90.1 1.4 99.9
gastro-oesoph 0.14 75.0 90.1 0.6 100.0
pancreas 0.12 67.9 90.0 0.4 100.0
ovarian 0.18 61.6 90.0 0.6 100.0
renal 0.10 76.7 90.0 0.6 100.0
breast 0.72 68.1 90.4 4.6 99.8
blood 0.22 44.0 90.0 0.5 99.9
uterine 0.10 83.7 90.1 0.7 100.0
cervical 0.05 54.5 90.0 0.2 100.0
other 0.55 19.4 90.0 0.1 100.0 Copyright ClinRisk Ltd (2013) all rights reserved

Comparison strategies in men
based on top 10% cancer risk
% threshold Sensitivity
(%)
specificity
(%)
PPV
(%)
NPV
(%)
lung 0.67 71.5 90.2 1.9 99.9
colorectal 0.45 69.5 90.2 1.8 99.9
gastro-oesoph 0.29 76.6 90.1 1.3 100.0
pancreas 0.10 70.1 90.0 0.4 100.0
renal tract 0.20 82.7 90.1 1.6 100.0
prostate 1.30 59.5 90.2 2.2 99.8
blood 0.27 49.0 90.1 0.6 99.9
testicular 0.02 67.1 90.0 0.2 100.0
other 0.66 27.0 90.0 0.1 100.0
Copyright ClinRisk Ltd (2013) all rights reserved

Web calculator www.qcancer.org
Publically available
Interactive
Gives global cancer risk
Risk of different cancer types
Visual display of absolute risk to help shared decision
making e.g. “of a 100 patients like 7 you. 20 will have cancer”
www.qcancer.org
Copyright ClinRisk Ltd (2013) all rights reserved

Using QCancer in practice – v similar
to QRISK2
Standalone tools
a. Web calculator
www.qcancer.org/2013/female/php
www.qcancer.org/2013/male/php
b. Windows desk top calculator
c. Iphone – simple calculator
Integrated into clinical system
a. Within consultation: GP with patients with symptoms
b. Batch: Run in batch mode to risk stratify entire practice or
PCT population
Copyright ClinRisk Ltd (2013) all rights reserved

GP systems integration
Batch processing
Similar to QRISK2 which is in 95% of GP practices– automatic
daily calculation of risk for all patients in practice based on
existing data.
Identify patients with symptoms/adverse risk profile without
follow up/diagnosis
Enables systematic recall or further investigation
Systematic approach - prioritise by level of risk.
Safety netting
Copyright ClinRisk Ltd (2013) all rights reserved