Embed Size (px)
Citation preview

Qatar Economic Outlook
2014-2015

Qatar Economic Outlook 2014–2015

Copyright 2014 by the Ministry of Development Planning and Statistics, Qatar.
Published June 2014.
Ministry of Development Planning and Statistics, QatarDoha TowerP.O. Box 1855Doha, Qatar
www.gsdp.gov.qa
The content of this publication may be freely reproduced for non-commercial purposes with attribution to the copyright holder.
DISCLAIMER: The views expressed in the Qatar Economic Outlook 2014–2015 reflect the professional assessment of staff members of the Ministry of Development Planning and Statistics (MDP&S). They do not necessarily represent the official views of MDP&S or of the State of Qatar. While every effort has been made to ensure the accuracy of all data and information, MDP&S accepts no responsibility for errors in sources or in their reporting. The data cut-off for this report was 1 June 2014.

iii
Foreword
This Qatar Economic Outlook 2014–2015 presents forecasts for 2014 and 2015 (part 1), and reviews activity in 2013 (part 2).
Its assessment reaffirms the perspective offered in previous releases: the non-hydrocarbon sector accounts for most of the economy’s expansion. This pattern will be maintained for the foreseeable future. The Ministry of Development Planning and Statistics expects that, despite a forecast decline in oil production in 2014, economic growth will remain robust at 6.3% in 2014. As production from Barzan comes on stream in 2015, and as investment activity in the non-hydrocarbon sector gathers pace, growth will accelerate to 7.8%.
Consumer price inflation is expected to be broadly stable in 2014. Strengthening domestic demand is expected to push it up in 2015, yet inflation is seen staying manageable as lower global commodity prices will help to keep domestic inflationary pressures in check.
On the fiscal side, the government has once again raised the budget for capital outlays in FY2014/15, but to make fiscal space for capital projects, planned recurrent budget outlays are only modestly up. The fiscal balance will continue recording comfortable surpluses, but these are set to narrow over the projection period.
Similarly, although the external current account surplus is seen drifting down in 2014 and 2015—following lower hydrocarbon export revenue and higher imports and foreign workers’ remittances—it will still remain sizeable as a proportion of GDP.
The main risks to the short- and medium-term outlook come from the possibility of weaker oil prices or escalating domestic project costs that could cut into the fiscal surplus.
This Qatar Economic Outlook 2014-2015 could not have been produced without the generous cooperation of other agencies. I would therefore like to thank the Qatar Central Bank; Qatar Petroleum; the Ministry of Municipality and Urban Planning; and the Ministry of Finance—for their unstinting cooperation in sharing information and data.
H.E. Dr. Saleh Al Nabit
Minister
Ministry of Development Planning and Statistics
June 2014

iv
Dr. Frank Harrigan led the team at the Ministry of Development Planning and Statistics. Inputs were provided by Sultan Khalid Al-Thani, Zeiad Abdel-Rahman, Christian Hiddink, Dr. Issa Ibrahim, Sylvie Maalouf, Thaddeus Malesa, Eugene McQuaid, Habib Millwala and Dr. Osama Noujoum. Research and administrative support was provided by Hissa Ahmed Al-Assiry, Noor Al-Kuwari and Haya Al-Semaiti.
The Economic Statistics and National Accounts Department, led by Hassan Mohammed Al-Emadi, provided invaluable data inputs and advice. Colleagues in the departments of Joint Services, led by Hamad Rashid Al-Athba, and Public Relations and Communications, led by Torfa Saad Al Zarraa, facilitated the production and launch of the report. Jonathan Aspin copy edited the report and designed the layout. Osama Al-Manasir assisted in designing Arabic graphics and layout. Ali Barazi translated the English version into Arabic.
Acknowledgements
v
Contents
Foreword iii
Acknowledgements iv
Qatar—Outlook at a glance 1Economic growth—set to stay healthy 1
Inflation—outlook stable 1
Fiscal balance—comfortable, but more taken up by public investment 1
External balance—large surpluses to taper a little 2
Risks to the outlook—mainly external 2
Part 1—Outlook for 2014 and 2015 3Capsule outlook 3
Economic prospects 3
Consensus forecasts 6
Global economic prospects 8
Prospects for energy and commodity markets 9
Annex—Forecasting economic growth in constant 2004 prices versus 2010 prices 13
Part 2—Performance in 2013 15GDP growth 15
Prices 19
Asset markets: Equities and property 20
Money supply and credit 21
Fiscal accounts 23
Fiscal balance and debt 25
External sector 26
Terms of trade and the real effective exchange rate 27
Glossary—Key economic concepts 29

vi
Qatar Economic Outlook 2014–2015
Tables
Qatar, outlook at a glance, 2014 and 2015 1
Table 1.1 Qatar, latest forecasts of key indicators 3
Table 1.2 Poll of economic forecasts for Qatar, 2014 and 2015, as of 1 June 2014 (%) 7
Boxes
Box 1.1 Forecast methodology and assumptions 4
Box 1.2 The diesel price hike: No major impact on consumer price inflation 5
Box 1.3 Capital expenditure and the “break-even” oil price 7
Box 1.4 Forecasts for inflation, 2014 and 2015 9
Box 1.5 Oil and gas consensus forecast 12
Box 2.1 Selected financial and institutional developments, 2013 20
Box 2.2 Overview of recent money growth and consumer price inflation in Qatar 21
Box 2.3 Open book fiscal accounting 23
Box 2.4 QP accounts consolidated with the budget 24
Box 2.5 Allocation of government expenditure 25

vii
Figures
Figure 1.1 Contributions to GDP growth, 2014 and 2015 (percentage points) 4
Figure 1.2 Share in GDP, 2014 and 2015 (%) 5
Figure 1.3 Sectoral growth in the economy, constant 2004 prices (%) 5
Figure 1.4 Global real GDP growth projections, IMF (%) 8
Figure 1.5 Regional real GDP growth projections (%) 9
Figure 1.6 Average weekly crude oil spot price ($ per barrel) 10
Figure 1.7 International crude oil and liquid fuels, global demand and supply 10
Figure 1.8 Average crude oil price ($ per barrel) 10
Figure 1.9 Natural gas price index (2005 = 100) 10
Figure 1.10 Spot price ratios: Crude oil to gas 11
Figure 1.11 Natural gas prices ($/mmbtu) 11
Figure 1.12 Non-fuel commodity price index (2005 = 100) 11
Figure 2.1 Nominal GDP ($ billion) 15
Figure 2.2 Qatar’s nominal and real GDP growth (%) 15
Figure 2.3 GCC real GDP growth, 2007–2013 (year-on-year change, %) 15
Figure 2.4 Expenditure side GDP, QR billion, current prices 16
Figure 2.5 Gross domestic savings rate (% of GDP) 16
Figure 2.6 Contributions to real GDP growth, expenditure (percentage points) 17
Figure 2.7 Hydrocarbons and non-hydrocarbons, share in real and nominal GDP (%) 17
Figure 2.8 Non-Qatari workers’ skills composition (%) 17
Figure 2.9 Contribution to real GDP growth, supply (percentage points) 17
Figure 2.10 Services subsector growth (%) 18
Figure 2.11 Indices for population, utilities and services (2009 = 100) 18
Figure 2.12 Construction output 18
Figure 2.13 Manufacturing output 18
Figure 2.14 Annual headline and core inflation (%) 19
Figure 2.15 Annual inflation (%) 19
Figure 2.16 Monthly headline inflation (year on year, %) 19
Figure 2.17 Producer price index growth (%) 19
Figure 2.18 GCC stock price indices and S&P Global index (year-on-year change, %) 20
Figure 2.19 QCB real estate price index 21

viii
Qatar Economic Outlook 2014–2015
Figure 2.20 Real estate rentals, Doha (QR per square metre per month) 21
Figure 2.21 Money supply (M2) 22
Figure 2.22 Contribution to money supply growth (percentage points) 22
Figure 2.23 Contribution to credit growth (percentage points) 22
Figure 2.24 Growth of commercial banks’ private sector credit (year on year, % change) 22
Figure 2.25 Private businesses credit by main sectors 23
Figure 2.26 Balance of deposits and credits for individuals, government and private sector 23
Figure 2.27 Composition of fiscal revenue and total revenue growth 23
Figure 2.28 Difference between actual and budget government revenue 24
Figure 2.29 Fiscal expenditure growth (%) 24
Figure 2.30 Difference between actual and budget government expenditure 24
Figure 2.31 Fiscal balance (% of GDP) 26
Figure 2.32 Total government debt 26
Figure 2.33 Total trade growth 26
Figure 2.34 Current account 26
Figure 2.35 Real effective exchange rate index (2005 = 100) 27
1
Qatar—Outlook at a glance
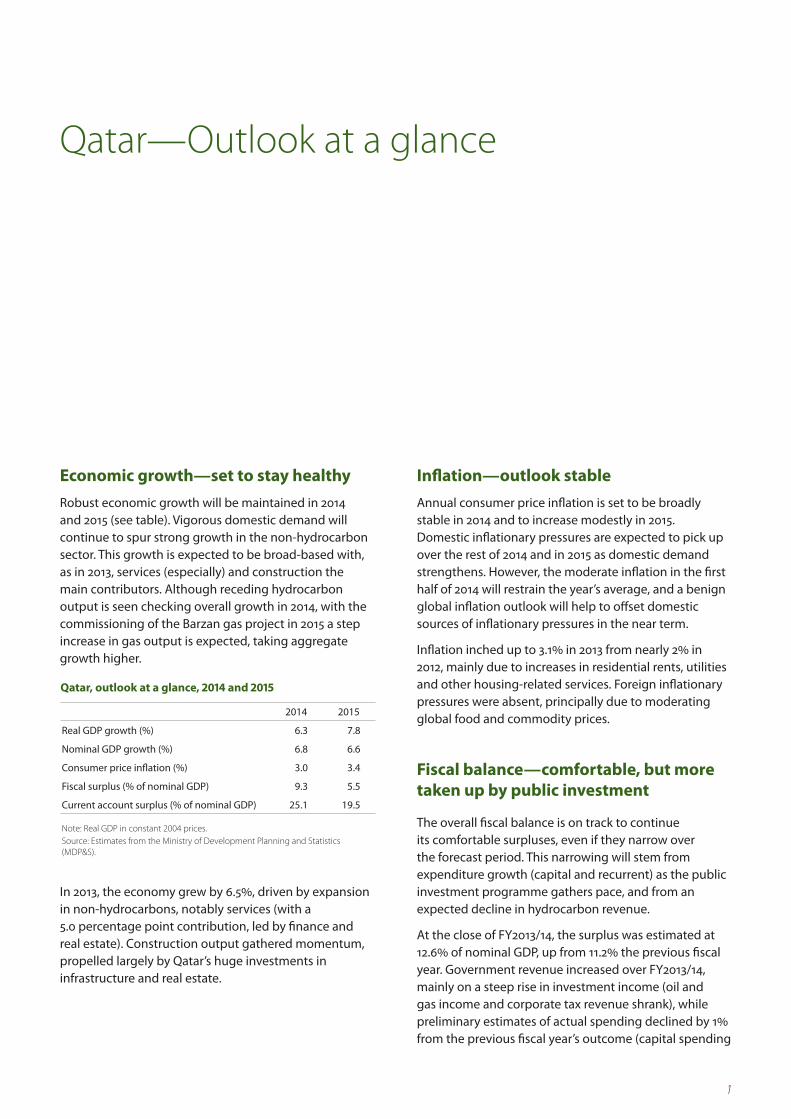
Economic growth—set to stay healthyRobust economic growth will be maintained in 2014 and 2015 (see table). Vigorous domestic demand will continue to spur strong growth in the non-hydrocarbon sector. This growth is expected to be broad-based with, as in 2013, services (especially) and construction the main contributors. Although receding hydrocarbon output is seen checking overall growth in 2014, with the commissioning of the Barzan gas project in 2015 a step increase in gas output is expected, taking aggregate growth higher.
In 2013, the economy grew by 6.5%, driven by expansion in non-hydrocarbons, notably services (with a 5.0 percentage point contribution, led by finance and real estate). Construction output gathered momentum, propelled largely by Qatar’s huge investments in infrastructure and real estate.
Qatar, outlook at a glance, 2014 and 2015
2014 2015
Real GDP growth (%) 6.3 7.8
Nominal GDP growth (%) 6.8 6.6
Consumer price inflation (%) 3.0 3.4
Fiscal surplus (% of nominal GDP) 9.3 5.5
Current account surplus (% of nominal GDP) 25.1 19.5
Note: Real GDP in constant 2004 prices.Source: Estimates from the Ministry of Development Planning and Statistics (MDP&S).
Inflation—outlook stableAnnual consumer price inflation is set to be broadly stable in 2014 and to increase modestly in 2015. Domestic inflationary pressures are expected to pick up over the rest of 2014 and in 2015 as domestic demand strengthens. However, the moderate inflation in the first half of 2014 will restrain the year’s average, and a benign global inflation outlook will help to offset domestic sources of inflationary pressures in the near term.
Inflation inched up to 3.1% in 2013 from nearly 2% in 2012, mainly due to increases in residential rents, utilities and other housing-related services. Foreign inflationary pressures were absent, principally due to moderating global food and commodity prices.
Fiscal balance—comfortable, but more taken up by public investment
The overall fiscal balance is on track to continue its comfortable surpluses, even if they narrow over the forecast period. This narrowing will stem from expenditure growth (capital and recurrent) as the public investment programme gathers pace, and from an expected decline in hydrocarbon revenue.
At the close of FY2013/14, the surplus was estimated at 12.6% of nominal GDP, up from 11.2% the previous fiscal year. Government revenue increased over FY2013/14, mainly on a steep rise in investment income (oil and gas income and corporate tax revenue shrank), while preliminary estimates of actual spending declined by 1% from the previous fiscal year’s outcome (capital spending

2
Qatar Economic Outlook 2014–2015
was up by 2.4%, but was outweighed by a 2.1% fall in current spending).
External balance—large surpluses to taper a little
The current account surplus is set to continue drifting down over the forecast period but to remain hefty as a share of GDP. The key factors are declining hydrocarbon export revenue, rising imports on stronger domestic demand, and higher foreign workers’ remittances (in line with projected expatriate population growth).
The 2013 trade surplus was sizeable at 52.1% of nominal GDP, though a shade down on 2012’s outcome. The current account surplus, too, was a little lower at 30.9% of nominal GDP. Service imports and remittances picked up, while merchandise export growth slowed.
Risks to the outlook—mainly externalThe main risks include the possibility of significantly weaker oil prices—reflecting moderating economic growth in emerging markets and expanding oil supply—and escalating domestic project costs that could cut into the fiscal surplus.

3
Part 1—Outlook for 2014 and 2015
Solid economic growth is expected in 2014 and 2015, driven by gathering expansion of the non-hydrocarbon economy. Accelerated growth of investment spending and continued fast population growth will propel overall momentum. Whereas flat gas production and receding oil output are expected to check overall growth in 2014, with the commissioning of the Barzan gas project in 2015, a step increase in gas output is anticipated, taking aggregate growth higher.
Consumer price inflation is expected to pick up in the second half of 2014 and may quicken in 2015, but moderate inflation in the first half of the year will restrain the year’s average. A benign global inflation outlook will help to offset domestic sources of inflationary pressure in the near term, but this offset could diminish as the global recovery gathers pace in 2015. Solid balance-of-payments surpluses are set to continue. And while an overall fiscal surplus again seems assured in 2014, it is poised to narrow in 2015.
Risks to the outlook include the possibility of much weaker oil prices—reflecting a combination of weakening economic growth in emerging markets and expanding oil supply—and escalating domestic project costs that could cut into the fiscal surplus.
Capsule outlookTable 1.1 provides a summary of the latest baseline forecasts from the Ministry of Development Planning and Statistics (MDP&S) for key macroeconomic indicators for the outlook period. The most notable departure from earlier expectations is the upward revision to the fiscal surplus, which largely reflects new accounting procedures that transfer all the financial surplus of Qatar Petroleum (QP) to the budget (box 2.4 in part 2). Previously, QP kept a large portion of this surplus or transferred it to other state (but off-budget) entities.
The table’s forecasts reflect the latest data and updated assumptions. The forecast methodology and assumptions are discussed in box 1.1.
Table 1.1 Qatar, latest forecasts of key indicators
2014 2015
Real GDP growth (%) 6.3 7.8
Nominal GDP growth (%) 6.8 6.6
Consumer price inflation (%) 3.0 3.4
Fiscal surplus (% of nominal GDP) 9.3 5.5
Current account surplus (% of nominal GDP) 25.1 19.5
Note: Real GDP in constant 2004 prices.Source: Estimates from MDP&S.
Economic prospects
Real economic activity
Economic growth, estimated using 2004 prices, is forecast to moderate slightly in 2014 to 6.3% (from 6.5% in 2013) before picking up to 7.8% in 2015. Use of a 2010 price basis would trim this estimate of aggregate growth, as it would give a lower weight to non-oil and gas output (defined as all economic activity other than upstream oil and gas production and other mining activities), which is now spearheading overall growth. (The Annex explains the impact that different price weights have on measured growth.) In 2015, continued robust expansion in non-hydrocarbon activities will be bolstered by growth of hydrocarbon production as output comes on stream from the Barzan project, although this boost will peter out once Barzan reaches full capacity.
Output from the hydrocarbon sector (including other mining activities) is set to contract in 2014, by 2.5%. Most of that shrinkage comes from declining production at maturing oil fields. Gas output is expected to be largely unchanged in 2014, having saturated capacity in 2013. In 2015, however, hydrocarbon output will expand—by a modest 0.5%—as the lift in gas production from Barzan more than offsets the continued decline in oil output.

4
Qatar Economic Outlook 2014–2015
Box 1.1 Forecast methodology and assumptionsThe forecasts of the Qatar Economic Outlook are derived from an internally consistent numerical representation of Qatar’s economy, based on standard economic accounting relationships. The framework is based on a flow-of-funds model of the economy in which all sources of funds from each sector equals that sector’s total use of funds. This representation has been calibrated and updated with known outcomes for 2013 and data revisions for 2011–2012. Where previously the Qatar Economic Outlook reported numbers using 2010 prices, this release adopts the price weights used in national accounts estimates (using 2004 prices). This change does not affect any of the nominal values reported.
The main forecast assumptions draw on a wide range of sources. Those for Qatar’s interest rates are based on the declared policy of Qatar Central Bank (QCB). Data on budgetary outcomes and prospects are derived from information obtained from the Ministry of Finance. Data for the years beyond the budget year draw on past trends in actual government revenue, expenditure and financing, but are adjusted based on information about likely departures from established trends and patterns. Assumptions about the external environment are anchored on forecasts of the International Monetary Fund (IMF) World Economic Outlook (WEO) and of the World Bank. The assumptions underpinning the baseline projections are shown in the box table.
Box table Forecast assumptions
2013a 2014 2015
Qatar
QCB’s overnight deposit rate (%) 0.75 0.75 0.75
Qatari riyal/$ exchange rate 3.64 3.64 3.64
Total budget spending (QR billion) 199.22 228.19 256.55Current 146.74 167.27 188.07Capital 52.47 60.92 68.48
External environment
Global growth (%) 3.01 3.59 3.88
US$ LIBOR, 6-month (%) 0.41 0.38 0.82
Crude oil export price, $ per barrel 107.66 107.04 102.00
Japanese LNG price, $ per million British thermal units (mmbtu)
16.00 15.80 15.00
a Preliminary estimates or actual.Source: Consolidated from various sources including QCB, Ministry of Finance, IMF and World Bank.
Figure 1.1 Contributions to GDP growth, 2014 and 2015 (percentage points)
Services
Manufacturing
Construction
Mining and quarrying
GDP
-1.0 -0.70.2
-2.0
1.7 1.01.9
1.2
0.40.5
0.60.8
5.4 6.1 5.3 6.7
Real GDP Nominal GDP Real GDP Nominal GDP
2014 2015
-2.0
0.0
2.0
4.0
6.0
8.0
10.0
6.36.8
7.8 6.6
Note: Rounding errors are attributed to agriculture, imputed bank services, import duties and electricity and water, which are not shown. Source: MDP&S estimates.
Click here for chart data
This impulse to hydrocarbon growth will be temporary though, tapering off from 2016.
Vigorous investment spending, an expansionary fiscal stance and a rising population will spur strong broad-based growth in the non-oil and gas sector in the forecast period. Services will be the largest contributor to growth, followed by construction, in both years (figure 1.1).
The share of services in aggregate output will rise steadily (figure 1.2). Financial services, real estate, transport and communications, and business services will all benefit from the large property-development and infrastructure projects. The demand for services from the trade and hospitality sector is also expected to grow healthily, in line with expected population growth and rising visitor numbers to the country. Additionally, the opening of Hamad International Airport in May 2014 will boost a range of logistical and service-support activities. Government services are expected to expand in keeping with population and economic growth in the wider non-oil and gas economy.
Construction activity is projected to expand by 14.1% in 2014, up from 13.6% in 2013, and may well accelerate a shade faster in 2015 (figure 1.3). The main driver is the government’s heavy investment in economic infrastructure, particularly local roads, expressways, the Doha metro and rail, and drains and sanitation,
at a pace that is likely to pick up over 2014 and 2015. The construction of new health centres and education facilities will also entail heavy spending. Private construction activity centred on residential and commercial real estate development, including new malls, hotels and labour accommodation, will also buttress construction growth.

5
Part 1 Outlook for 2014 and 2015
Figure 1.2 Share in GDP, 2014 and 2015 (%)
2014 2015
0
20
40
60
80
100
ManufacturingServicesConstructionMining and quarrying
Nominal GDPReal GDPNominal GDPReal GDP
8.9
12.7
43.0
37.4
9.6
5.5
36.1
50.3
8.8
13.5
44.9
34.8
9.8
6.2
40.1
45.3
Note: Rounding errors are attributed to agriculture, imputed bank services, import duties and electricity and water, which are not shown. Source: MDP&S estimates.
Click here for chart data
Figure 1.3 Sectoral growth in the economy, constant 2004 prices (%)
5.65.6
-4
0
4
8
12
1620152014
Electricityand water
ServicesManu-facturing
ConstructionMiningand
quarrying
Agriculture
14.514.1
6.8
3.9
12.413.3
0.5
-2.5
6.4
8.3
Source: MDP&S estimates.
Click here for chart data
Manufacturing, too, will grow but not as quickly as either services or construction, nor as fast as in the recent past. In 2014, its growth is seen moderating with declines in fertiliser and refined products. With global fertiliser prices falling, the opportunity costs of supplying feedstock to the industry is rising. Other segments of manufacturing will grow but more slowly than in recent years as production capacity tightens. In 2015, however, growth is set to come back higher on the back of a revival in output of refined products and petrochemicals, and as feedstock comes from Barzan. Growing demand by construction for cement and metals linked to the large capital projects should encourage some investment in new capacity, prompting manufacturing growth to recover some of its earlier impetus.
Nominal GDP
Qatar’s GDP deflator is susceptible to movements in hydrocarbon product prices, which are determined on international markets. Rising hydrocarbon prices tend to raise the growth rate of nominal GDP relative to that of real GDP—falling prices the opposite.
After 6.6% in 2013, nominal GDP growth is predicted to remain broadly stable at about 6.8% in 2014 and 6.6% in 2015. Lower oil volumes and prices will largely offset a projected uptick in non-hydrocarbon nominal output growth.
Inflation
Annual inflation, as measured by the change in the consumer price index, is expected to average 3.0% in 2014, similar to 2013’s outcome, and to increase modestly to 3.4% in 2015. It is likely that the impact on inflation of the recent hike in diesel fuel prices will be minor and short-lived (box 1.2). Over the rest of 2014 and through 2015, domestic inflationary pressures are projected to
Box 1.2 The diesel price hike: No major impact on consumer price inflation
Qatar Fuel (Wooqod) increased the retail price of diesel to QR1.5 a litre from QR1.0 at all fuel stations from 1 May 2014. It also raised the bulk price for projects—to local companies and joint ventures—to QR1.5 and QR1.8, respectively. Companies not based in Qatar will continue paying QR1.0.
Any impact of the diesel price increase on consumer price inflation will be temporary. As it represents a one-step upward shift in the price level, its direct impact on inflation will be confined to the remainder of 2014 and the first five months in 2015 due to the resulting base effect. This direct base effect is also expected to be minor, as the weight of diesel fuel in the consumer price index is small: most private vehicles—still the primary mode of transport—consume petrol (gasoline).
An increase in diesel prices may, though, have knock-on or indirect impacts on the cost of consumer goods through its effect on costs, though these impacts are also likely to be small. Many consumer goods are imported, and the physical size of the country means that goods are not transported over long distances by road. The diesel price hike may prompt some companies to abuse their market power—using them as an excuse to raise the price of final goods and services—but the government is set to be vigilant against unscrupulous practices.
This sanguine view is supported by earlier experience: although prices were raised in January 2011—diesel by 30% and gasoline by 25%—and despite the direct impact of petrol prices on consumers, consumer price inflation stayed under 2% in both 2011 and 2012.

6
Qatar Economic Outlook 2014–2015
gradually build as domestic demand strengthens. The vigorous growth of domestic demand will push up prices of non-tradable goods and services, including rentals, especially in affordable housing for low- to middle-income markets where availability is usually tighter. Conversely, global food and commodity prices are expected to moderate, while inflation in trading-partner countries should stay quiescent.
Risks of accelerating inflation seem contained at the moment, but consumer price pressures would pick up if imported inflation gathered pace. A global commodity supply shock, a depreciation of the US dollar or an unanticipated global demand recovery could take inflation up a notch.
Fiscal outlook
In calendar 2014—fiscal estimates and forecasts are made on a calendar-year basis; Ministry of Finance data are provided on a fiscal year basis (April to end-March the following year)—MDP&S expects the fiscal surplus to narrow to 9.3% of GDP and then to fall to 5.5% the following year, down from a preliminary estimate of a 12.9% surplus in 2013. This narrowing will be driven by a combination of expenditure growth (capital and recurrent), as the public investment programme gathers pace, and of the expected decline in hydrocarbon revenue (reflecting both declining output from maturing oil fields and lower hydrocarbon prices).
The mirror image of this narrowing is an expected widening of the non-hydrocarbon deficit as a share of GDP to about 9.2% and 11.1% in 2014 and 2015, from about 8.3% in 2013. This widening suggests an expansionary fiscal stance over the next two years, which will support growth of the non-oil and gas economy.
Balance of payments
The external current account surplus is expected to drift down in 2014 and 2015 but to remain sizeable at 25.1% and 19.5% of GDP. The key factors are the decline in hydrocarbon export revenue, higher imports that reflect stronger domestic demand, and higher foreign workers’ remittances in line with the expected growth in the expatriate population.
As the bulk of the current account surplus is recycled abroad as overseas investments, the current account surplus will be far greater than the overall surplus on the balance of payments, which is projected to decline to $3.9 billion in 2014 and to $3.4 billion in 2015. This overall surplus will support the foreign reserves position of Qatar Central Bank, and so foreign reserves cover
is expected to remain robust, equivalent to about 6.5 months of total imports of goods and services.
Risks
The economic outlook for 2014–2015 is generally favourable, but subject to low-probability, high-impact downside risks.
Qatar is susceptible to spillovers from the world economy through trade and financial channels. Its prosperity depends, self-evidently, on production and exports of gas and oil. Any disruptions to transport of liquefied natural gas (LNG) by regional political tensions could have major repercussions throughout the economy. Qatar’s large fiscal reserves provide some cushion for the economy to withstand such events, but protracted disruption could weaken its established competitive advantage in global gas markets.
Another hydrocarbon-related risk is a sharp decline in oil prices for any length of time. Much of Qatar’s LNG export earnings are indexed to reference oil prices. The damage to fiscal balances caused by much lower oil prices is likely to be amplified by rising spending commitments and declining hydrocarbon production, the confluence of which could quickly narrow fiscal space.
A final risk comes from the scale and complexity of Qatar’s planned infrastructure project portfolio. A hefty increase in spending over a short period could stretch government administrative capacity—generating logistical and other bottlenecks, creating wider congestion in the economy and pushing up project costs. Larger calls for capital spending would then raise the oil price needed to cover the non-hydrocarbon budget deficit (box 1.3).
Consensus forecastsTable 1.2 presents a summary of publicly available economic forecasts for 2014 and 2015. (Box 1.5 towards the end of this part discusses oil and gas consensus forecasts.) A consensus—or representative—view of Qatar’s prospects is obtained as the mean/median of all the projections polled. The table shows the latest forecasts for real and nominal GDP growth and consumer price inflation, which are the indicators most commonly reported for Qatar.
Revisions to the forecasts published in the December 2013 Qatar Economic Outlook Update reflect changes in the economic landscape both domestically and globally, and factor in new information for 2013. Sources that have not revised their forecasts are in red.

7
Part 1 Outlook for 2014 and 2015
Box 1.3 Capital expenditure and the “break-even” oil priceThe break-even oil price is the price for oil that generates oil and gas revenues that match budgeted expenditures, or equivalently, cover the non-oil and gas budget deficit. The box figure shows both the rise expected in the break-even price between 2013 and 2015 underlying the baseline forecasts reported above and the sensitivity of this price to larger than currently foreseen capital expenditure. These calculations of the estimated break-even price assume full indexation of gas to oil prices.
For illustrative purposes, capital spending is set at 25% higher than the baseline. Larger spending raises the break-even price. A rise in the break-even price would render the budget more susceptible to unexpected falls in actual oil prices. For example, a 25% decline in outcome oil prices in 2015 relative to the baseline forecasts would push it below the break-even price, leading to an overall budget deficit.
This calculation makes no allowance for the possibility that other sources of government revenue (such as taxes or dividends from state-owned companies) could be hurt by falling oil prices.
Box figure Break-even and market price of oil under different scenarios ($ per barrel)
42.3
35
45
55
65
75
85
95
105
115
25% decline in baseline oil prices
Baseline oil export price forecast
Baseline CAPEX + 25%
Baseline CAPEX
201520142013
63.4
52.9
79.3
67.7
Source: MDP&S calculations.
Click here for chart data
Table 1.2 Poll of economic forecasts for Qatar, 2014 and 2015, as of 1 June 2014 (%)*
Economic forecaster Real GDP growth Nominal GDP growth Inflation
2014 2015 2014 2015 2014 2015
Bank of America Merrill Lynch (Nov 2013) 4.9 6.5 5.5 … 2.5 …Business Monitor International (Mar 2014) 5.4 5.0 2.1 2.8 … …Citigroup (Mar 2014) 5.9 6.1 6.9 7.1 2.5 4.0Economist Intelligence Unit (Apr 2013) 6.2 6.4 5.6 5.6 3.8 4.2EFG Hermes (Sep 2013) 7.8 … 12.9 … 4.2 …Emirates NBD (Jan 2014) 5.2 6.1 3.7 7.6 4.0 4.5Fitch Ratings (Apr 2014) 5.8 6.9 6.4 5.8 4.2 4.5HSBC (Apr 2014) 6.2 6.0 1.4 7.6 5.6 6.4IHS Global Insight (May 2014) 5.9 6.1 7.5 7.6 3.4 4.0Institute of International Finance (May 2014) 6.3 6.8 4.3 6.2 3.6 3.5IMF (Apr 2014) 5.9 7.1 5.5 5.3 3.5 3.5JP Morgan Securities plc (May 2014) 4.4 4.2 … … 3.8 4.4National Bank of Kuwait (Jan 2014) 5.8 6.6 3.9 6.3 4.0 4.5Oxford Economics (Apr 2014) 6.5 6.5 7.1 6.3 3.5 4.5Qatar National Bank (Apr 2014) 6.8 7.5 5.6 8.2 3.4 3.5Roubini Global Economics (May 2014) 5.4 6.0 … … 3.5 3.2SAMBA (May 2014) 6.7 6.5 6.0 4.0 3.4 4.0Standard & Poor's (Apr 2014) 5.0 5.0 5.9 … 4.0 4.0Standard Chartered (Mar 2014) 5.5 5.8 … … 3.5 4.2
Consensus (mean) 5.9 6.2 5.6 6.2 3.7 4.2Median 5.9 6.3 5.6 6.3 3.6 4.1High 7.8 7.5 12.9 8.2 5.6 6.4Low 4.4 4.2 1.4 2.8 2.5 3.2Standard deviation 0.8 0.8 2.6 1.5 0.7 0.7Coefficient of variation (%) 13.3 13.0 45.7 24.9 18.3 17.3
Memo itemMDP&S forecasts 6.3 7.8 6.8 6.6 3.0 3.4
* To include your institution’s forecasts in future compilations of this table, please contact [email protected].... = not availableNote: The World Bank and other forecasters that quote IMF WEO and other secondary sources have been removed from the table.Source: Consolidated from various reports and news articles.

8
Qatar Economic Outlook 2014–2015
Global economic prospectsThe April 2014 release of the IMF’s WEO highlighted a strengthened economic recovery in advanced economies, led by the US and Europe, along with continued robust growth in emerging markets. Such guarded optimism has grounded solid forecasts for 2014 and 2015. Global growth is expected to rise from 3.0% in 2013 to 3.6% in 2014 and 3.9% in 2015 (figure 1.4).
For 2014, though, this April estimate is a slight downgrade for 2014 from the Fund’s forecasts published in January. Tighter financial conditions in emerging market economies, in response to volatility and concerns about capital outflows following the Federal Reserve’s tapering of its bond-buying program, explain the revision. For 2015, the IMF still sees growth worldwide accelerating through to 2015, as that in advanced economies lifts prospects for emerging economies, pushing their solid expansion higher.
Within the global average, the eurozone is seen as moving from contraction and is now forecast to expand by over 1% in both outlook years. Only one country there—tiny Cyprus—is expected to contract further, against nine in 2013. Despite the positive growth projections, Europe’s low inflation is a risk to its growth (box 1.4).
Higher growth is forecast for the US, which continues to recover as consumer demand solidifies. The Federal Reserve is not seen making any major changes to its policy in the outlook period. Tapering is expected to be completed by end-2014, and the Federal Reserve maintains that it will make no rate hikes for as long as inflation is low and unemployment is above 6.5% (it is unlikely to fall below that rate before late 2015).
The updated consensus (mean) forecast for Qatar’s real GDP growth in 2014 is 0.2 percentage points up on December’s Update, at 5.9%; for 2015, it is 6.2%.
The range of real GDP forecasts for 2014 and 2015 is tighter than those presented in December, with the span between the highest and lowest estimates narrower. This tightening reflects a trend that has been observed in the dispersion of consensus estimates following their first publication in 2011. This convergence may just be random, but it could also reflect the availability of improved economic statistics and information about Qatar’s economy. It is also likely, however, that some of the uncertainty that existed about growth prospects once oil and gas activity flattened has now passed.
Nominal GDP forecasts present a much wider range than real GDP, with a coefficient of variation for 2014 at 45.7%. There seems to be more dissonance about prices than quantities. In Q1 2014, oil prices surprised on the upside. Supply bottlenecks and heightened risk premiums in the midst of the Russia–Ukraine conflict supported higher prices. UK Brent prices hovered around $110 a barrel, while West Texas Intermediate (WTI) remained over $100 a barrel through to April 2014. With the warmer (northern hemisphere) summer months and receding oil demand in emerging markets, prices are expected to ease and remain pretty stable over the medium term. For 2015 the range is narrower, which could be explained by a consensus that oil prices are likely to soften next year.
For 2014, MDP&S expects real GDP growth of 6.3%, 0.4 percentage points above consensus. MDP&S also projects a higher growth rate for nominal GDP than the consensus view. For 2015, MDP&S’s forecasts for both real and nominal GDP are higher than consensus values (see Economic prospects above). The impetus to growth is expected to come from the upward swing in hydrocarbon output and from high levels of activity in the non-oil and gas economy. In the MDP&S’ forecasts, a temporary reversal of the decline in oil and gas output in 2015 adds 1.2 percentage points to aggregate growth. This, with the continued robust growth in the non-oil and gas economy propelled by rising investment spending and population growth, underpins MDP&S’s estimate.
On consumer price inflation, the consensus (mean) forecast for 2014 is 3.7%, 0.2 percentage points lower than foreseen in December. The downward revision follows forecasts that overshot actual inflation outcomes in 2013. For 2015 inflation is seen picking up to 4.2%. MDP&S now expects inflation for 2014 to average 3.0% and for 2015, 3.4%, lower than the consensus figure, based largely on its take on recently stabilising rent inflation as well as moderate global non-energy commodity prices, particularly food.
Figure 1.4 Global real GDP growth projections, IMF (%)
3.73.6 3.6
2.0
2.5
3.0
3.5
4.0
Apr 2014Jan 2014Oct 2013
20152014
3.94.0 3.9
Source: IMF WEO April 2014 database (http://http://www.imf.org/external/pubs/ft/weo/2014/01/weodata/download.aspx), accessed 13 April 2014.
Click here for chart data
9
Part 1 Outlook for 2014 and 2015
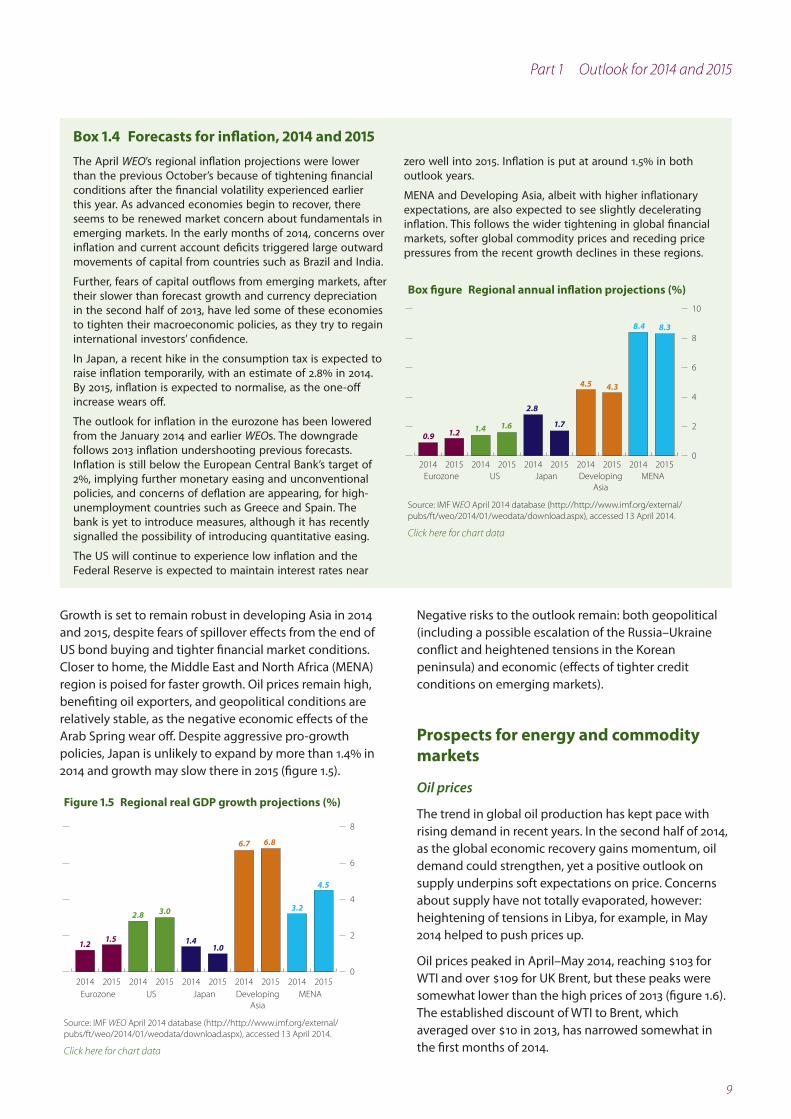
Box 1.4 Forecasts for inflation, 2014 and 2015The April WEO’s regional inflation projections were lower than the previous October’s because of tightening financial conditions after the financial volatility experienced earlier this year. As advanced economies begin to recover, there seems to be renewed market concern about fundamentals in emerging markets. In the early months of 2014, concerns over inflation and current account deficits triggered large outward movements of capital from countries such as Brazil and India.
Further, fears of capital outflows from emerging markets, after their slower than forecast growth and currency depreciation in the second half of 2013, have led some of these economies to tighten their macroeconomic policies, as they try to regain international investors’ confidence.
In Japan, a recent hike in the consumption tax is expected to raise inflation temporarily, with an estimate of 2.8% in 2014. By 2015, inflation is expected to normalise, as the one-off increase wears off.
The outlook for inflation in the eurozone has been lowered from the January 2014 and earlier WEOs. The downgrade follows 2013 inflation undershooting previous forecasts. Inflation is still below the European Central Bank’s target of 2%, implying further monetary easing and unconventional policies, and concerns of deflation are appearing, for high-unemployment countries such as Greece and Spain. The bank is yet to introduce measures, although it has recently signalled the possibility of introducing quantitative easing.
The US will continue to experience low inflation and the Federal Reserve is expected to maintain interest rates near
zero well into 2015. Inflation is put at around 1.5% in both outlook years.
MENA and Developing Asia, albeit with higher inflationary expectations, are also expected to see slightly decelerating inflation. This follows the wider tightening in global financial markets, softer global commodity prices and receding price pressures from the recent growth declines in these regions.
Box figure Regional annual inflation projections (%)
0.91.4
2.8
4.5
8.4
MENA DevelopingAsia
JapanUSEurozone
1.21.6 1.7
4.3
8.3
0
2
4
6
8
10
2015201420152014201520142015201420152014
Source: IMF WEO April 2014 database (http://http://www.imf.org/external/pubs/ft/weo/2014/01/weodata/download.aspx), accessed 13 April 2014.
Click here for chart data
Growth is set to remain robust in developing Asia in 2014 and 2015, despite fears of spillover effects from the end of US bond buying and tighter financial market conditions. Closer to home, the Middle East and North Africa (MENA) region is poised for faster growth. Oil prices remain high, benefiting oil exporters, and geopolitical conditions are relatively stable, as the negative economic effects of the Arab Spring wear off. Despite aggressive pro-growth policies, Japan is unlikely to expand by more than 1.4% in 2014 and growth may slow there in 2015 (figure 1.5).
Negative risks to the outlook remain: both geopolitical (including a possible escalation of the Russia–Ukraine conflict and heightened tensions in the Korean peninsula) and economic (effects of tighter credit conditions on emerging markets).
Prospects for energy and commodity markets
Oil prices
The trend in global oil production has kept pace with rising demand in recent years. In the second half of 2014, as the global economic recovery gains momentum, oil demand could strengthen, yet a positive outlook on supply underpins soft expectations on price. Concerns about supply have not totally evaporated, however: heightening of tensions in Libya, for example, in May 2014 helped to push prices up.
Oil prices peaked in April–May 2014, reaching $103 for WTI and over $109 for UK Brent, but these peaks were somewhat lower than the high prices of 2013 (figure 1.6). The established discount of WTI to Brent, which averaged over $10 in 2013, has narrowed somewhat in the first months of 2014.
Figure 1.5 Regional real GDP growth projections (%)
1.2
2.8
1.4
6.7
3.2
MENA DevelopingAsia
JapanUSEurozone
1.5
3.0
1.0
6.8
4.5
0
2
4
6
8
2015201420152014201520142015201420152014
Source: IMF WEO April 2014 database (http://http://www.imf.org/external/pubs/ft/weo/2014/01/weodata/download.aspx), accessed 13 April 2014.
Click here for chart data

10
Qatar Economic Outlook 2014–2015
totalled 0.98 trillion cubic feet, or 45% less than in April 2013—causing US gas prices to soar to a high of $8.15 per mmbtu (million British thermal units) in February. However, the upward movement of gas prices in the US gas market is seasonal and thus is expected to see some correction which, with stable European and Japanese prices, underlies a more or less flat forecast (figure 1.9).
Natural gas continues to be sold at prices below the energy equivalent parity with oil—in effect, at a discount to oil (figure 1.10). In the first quarter of 2014, the oil–gas price discount began to narrow, and the oil to natural gas price ratio fell to 18.2, its lowest since January 2011. The energy equivalent price ratio is about 6. However, the trend was short-lived and reversed in April, with the discount widening, as UK Brent oil prices bounced on concerns over Libyan supply.
Figure 1.9 Natural gas price index (2005 = 100)
174Forecast
165
110 113
154165171
-36.9
-3.8
-40
0
40
80
120
160
200
GrowthIndex
20152014201320122011201020092008
48.6
3.4
36.2
11.0 0.1-0.7
164
Note: The index includes European, Japanese and US natural gas price indices.Source: IMF WEO April 2014 database (http://http://www.imf.org/external/pubs/ft/weo/2014/01/weodata/download.aspx), accessed 13 April 2014.
Click here for chart data
Figure 1.6 Average weekly crude oil spot price ($ per barrel)
80
85
90
95
100
105
110
115
120US WTIUK Brent
4 May14
4 Mar14
4 Jan14
4 Nov13
4 Sep13
4 Jul13
4 May13
4 Mar13
4 Jan13
109.53
101.92
Source: US Energy Information Administration (EIA) (http://www.eia.gov/dnav/pet/pet_pri_spt_s1_w.htm), accessed 26 May 2014.
Click here for chart data
Figure 1.8 Average crude oil price ($ per barrel)
97.0104.2104.1105.0104.0
79.0
61.8
Forecast
-6.0-0.9
-36.3 -40
-20
0
20
40
60
80
100
120
GrowthAverage crude oil price
20152014201320122011201020092008
36.4
97.9
27.931.6
1.00.1
Note: Average crude oil price is the simple average of three spot prices: Dated Brent, WTI and Dubai Fateh.Source: IMF WEO April 2014 database (http://http://www.imf.org/external/pubs/ft/weo/2014/01/weodata/download.aspx), accessed 13 April 2014.
Click here for chart data
The US Energy Information Administration (EIA) in May predicted that the trend of softer oil prices would continue into 2015, on the view that supply from OPEC and non-OPEC sources would continue to outpace world oil demand growth (figure 1.7). The IMF’s April 2014 WEO expects crude oil to average $104.2 in 2014, declining to $97.9 in 2015 (figure 1.8).
Gas prices
The WEO in April 2014 revised up its forecast for average natural gas prices—a weighted average of Japanese, US and European prices—by 1.6% for 2014 from its October 2013 forecast. Its revision came after the additional demands of an unusually harsh US winter required a heavy drawdown of gas working inventories in Q1 2014—by April, according to the EIA, US natural gas inventories
Figure 1.7 International crude oil and liquid fuels, global demand and supply (million barrels per day)
Forecast
85.5
86.5
87.5
88.5
89.5
90.5
91.5
92.5
93.5
94.5
Consumption Production
Oct15
Jul15
Apr15
Jan15
Oct14
Jul14
Apr14
Jan14
Oct13
Jul13
Apr13
Jan13
Oct12
Jul12
Apr12
Jan12
Source: US EIA (http://www.eia.doe.gov/steo/cf_query/index.cfm), accessed 26 May 2014.
Click here for chart data

11
Part 1 Outlook for 2014 and 2015
Figure 1.10 Spot price ratios: Crude oil to gas
0
10
20
30
40
50
60
Oil-gas price equivalent UK Brent: US Henry Hub
Mar14
Jan14
Nov13
Sep13
Jul13
May13
Mar13
Jan13
Nov12
Sep12
Jul12
May12
Mar12
Jan12
Nov11
Sep11
Jul11
May11
Mar11
Jan11
Oil and gas energy equivalent ratio:approximately 5.8 to 6.9. Ratio above (below) range meansgas is sold at a discounted (premium) price.
Sources: World Bank Commodity Markets database (http://econ.worldbank.org/WBSITE/EXTERNAL/EXTDEC/EXTDECPROSPECTS/0,,contentMDK:21574907~menuPK:7859231~pagePK:64165401~piPK:64165026~theSitePK:476883,00.htmll) and US EIA (http://www.eia.gov/dnav/pet/pet_pri_spt_s1_m.htm), both accessed 26 May 2014.
Click here for chart data
Figure 1.11 Natural gas prices ($/mmbtu)
0
2
4
6
8
10
12
14
16
18
20
LNG–JapanEuropeUS Henry Hub
Apr14
Jan14
Oct13
Jul13
Apr13
Jan13
Oct12
Jul12
Apr12
Jan12
Oct11
Jul11
Apr11
Jan11
Oct10
Jul10
Apr10
Jan10
Oct09
Jul09
Apr09
Jan09
Source: World Bank Commodity Markets database (http://econ.worldbank.org/WBSITE/EXTERNAL/EXTDEC/EXTDECPROSPECTS/0,,contentMDK:21574907~menuPK:7859231~pagePK:64165401~piPK:64165026~theSitePK:476883,00.html) accessed 26 May 2014.
Click here for chart data
Global gas markets are highly segmented regionally, as a globally integrated trading platform for natural gas has yet to be built. The US has lower prices, where most gas is sold spot, and Japan the highest, where gas is sold under long-term contracts linked to oil. Europe’s gas trades under a variety of arrangements, with prices between those of the US and Japan (figure 1.11).
Given rising US prices and flattening Japanese prices, the band between US and Japanese prices has begun to narrow over the past few months, reaching just over $10 in April 2014.
Non-energy commodity markets
Global non-energy commodity prices are forecast to continue their declining post-October 2013 trend. Higher food supply (owing to favourable weather conditions) and increased metal production (after recent higher prices) are foreseen as subduing prices. According to the WEO of April 2014, the non-fuel commodity price index will decline by 3.5% in 2014 relative to 2013. The index is forecast to fall further, by 3.9% in 2015 (figure 1.12).
Food prices are expected to decline by 3.6% in 2014 and 5.2% in 2015, given a favourable global supply outlook for most major crops. Industrial and raw materials are also predicted to fall, by 3.3% in 2014 and 2.6% in 2015. Larger metal supplies are expected to come to market—partly induced by earlier investments when prices were high—at a time when demand growth is softening. A slowdown in real estate investment in China, among other factors, will continue to restrain demand, with metal prices falling further below their 2011 peak.
Figure 1.12 Non-fuel commodity price index (2005 = 100)
Forecast
157
136
100
120
140
160
180
200
Industrial inputsFood and beveragesNon-fuel price index
20152014201320122011201020092008
151
127
161
190171
169163
157
153
182
175 175168
160
146
119
198
167 163158
154
170
Note: Industrial inputs include agricultural raw materials and metal price indices.Source: IMF WEO April 2014 database (http://http://www.imf.org/external/pubs/ft/weo/2014/01/weodata/download.aspx), accessed 13 April 2014.
Click here for chart data

12
Qatar Economic Outlook 2014–2015
Box 1.5 Oil and gas consensus forecastPredicting hydrocarbon prices is complicated. Prices are determined by multiple factors beyond immediate real demand- and supply-side conditions. Unanticipated shocks, asset market influences (real interest rates and speculative demand) and geopolitical risks all interact unpredictably, and are all reflected in global hydrocarbon prices.
A comparison of historical one-month futures oil prices with their realised spot prices demonstrates that predictions have frequently missed the mark. The average absolute error as a percentage of the average price between January 2012 and April 2014 was close to 4.0% (box figure). These errors are lower than those in the past, perhaps because energy markets have enjoyed unusual stability of late, with few “surprises”. However, longer-dated—one- or two-year—forecasts will probably be prone to greater error.
MDP&S bases its forecasts on an average of the hydrocarbon price outlook of the IMF and World Bank. However, a wide range of institutions also publishes views of the future trajectory of oil and gas prices. The box table puts together several that are publicly available for
2014 and 2015. (The forecasts for 2014 not updated since the December Update are in red.) For oil, the forecasts for WTI and Brent crude in 2014 have been revised down from the consensus of December 2013. Following a pattern set in previous years, the most recent IMF and World Bank forecasts are at the upper end of the range of forecasts (for 2014).
Despite the downward revisions, the dispersion in oil price forecasts is significantly higher than in December. Forecast prices for WTI differ by over $23 a barrel between the highest and lowest forecasts in 2014, and $16 in 2015. UK Brent forecasts are somewhat more range
bound: $20 in 2014 and $15 in 2015. World Bank and IMF price forecasts also see falling oil prices in 2015.
For gas prices, the table presents US Henry Hub prices only. The consensus is an average $4.4 per mmbtu in both 2014 and 2015.
The consensus gas price forecasts for 2014 have been revised up reflecting pressures on inventories in the US following the harsh winter in early 2014. However, uncertainty around these predictions has increased: the coefficient of variation is 10%, up from 5% in December 2013.
Box table Poll of oil and gas prices, 2014 and 2015 Economic forecaster Oil ($/bbl) Gas ($/mmbtu)
WTI UK Brent2014 2015 2014 2015 2014 2015
ABN AMRO (May 2014) 95.0 90.0 100.0 95.0 4.5 4.8Bank of America Merrill Lynch (Mar 2014) 94.0 91.0 106.0 103.0 4.4 4.4Barclays (Apr 2014) 104.0 115.0BNP Paribas (Mar 2014) 102.0 107.0 104.0Business Monitor International (Jan 2014) 101.5 101.0 104.8 102.0Citigroup (May 2014) 94.0 89.0 109.0 105.0 3.8Commerzbank (Apr 2014) 112.0 107.2 109.5Credit Suisse (Jan 2014) 91.8 87.5 101.8 97.5 3.9 4.2Deutsche Bank (Apr 2014) 88.8 85.0 100.0Deloitte (Jan 2014) 95.0 95.0 4.1 4.2Economist Intelligence Unit (Apr 2014) 100.8 105.5 107.3GAIN Capital Group (Sep 2013) 98.0 102.0Goldman Sachs (Apr 2014) 103.0 99.0 4.0Institute of International Finance (May 2014) 105.0JP Morgan Chase & Co. (Apr 2014) 104.0 112.0 4.6 4.2Morgan Stanley (Apr 2014) 100.3 100.0 103.0 98.0Noreda (Apr 2014) 107.3 106.3Oxford Economics (May 2014) 96.8 90.4 104.4 103.0 4.8 4.7Samba (Jan 2014) 102.0 95.0Scotiabank (May 2014) 99.0 92.0 108.0 106.0 5.2 4.8Societe Generale (Apr 2014) 96.0 108.0 110.0Standard Chartered (Apr 2014) 108.0 110.0UBS (Jan 2014) 89.0 105.0US EIA (May 2014) 96.6 90.9 106.3 101.9 4.7 4.3
Consensus (mean) 97.8 91.7 105.2 103.1 4.4 4.4Median 96.8 90.7 105.3 103.0 4.5 4.4High 112.0 101.0 115.0 110.0 5.2 4.8Low 88.8 85.0 95.0 95.0 3.8 4.2Standard deviation 5.6 5.1 4.1 4.9 0.5 0.2Coefficient of variation (%) 5.8 5.5 3.9 4.8 10.5 5.6
Crude oila Gas ($/mmbtu)Memo items 2014 2015 2014 2015Consensus average (UK Brent and WTI) 101.5 97.4IMF (Apr 2014) 104.2 97.9 4.6 4.2World Bank (Jan 2014) 103.5 99.8 4.2 4.7OPEC (Apr 2013) 107.5
a Average of WTI, Brent and Dubai Fateh spot prices.Source: Consolidated from various reports and news articles.
Box figure Average monthly crude oil prices: Spot vs futures
Price ($ per barrel) Absolute, % of actual price
Average of forecast error(absolute, as % of actual price): 4.0%
80
90
100
110
120
130
0
4
8
12
16
Forecast error(absolute, % of actual price)WTI crude 1-month futures price
WTI crude spot price (actual)
Mar14
Jan14
Nov13
Sep13
Jul 13
May13
Mar13
Jan13
Nov12
Sep12
Jul12
May12
Mar12
Jan12
Source: Estimates based on data from US EIA (http://www.eia.doe.gov/steo/cf_query/index.cfm), accessed 22 May 2014.
Click here for chart data

13
Part 1 Outlook for 2014 and 2015
Annex—Forecasting economic growth in constant 2004 prices versus 2010 prices
Oil prices have come a long way since 2004. Between then and 2010, they more than doubled in nominal terms. In real (inflation-adjusted) terms, too, oil and gas prices have soared, increasing by about 65%. Consequently, the structure of relative prices in Qatar’s economy has changed greatly over the period. Annex table 1 shows the sector shares of the hydrocarbon (including other mining) and non-hydrocarbon sectors in aggregate output calculated using base-year 2004 and base-year 2010 prices. Applying 2010 price weights raises the measured share of hydrocarbon in the economy by about 8 percentage points—a significant amount.
Thus estimates of overall growth rates are influenced by the choice of the base year for price weights. For a given set of sector output changes, use of 2004 prices (as in the body of the Qatar Economic Outlook) amplifies the impact of non-hydrocarbon output changes on overall real GDP growth, as this entails the application of larger price weights than would occur if 2010 prices are used.
Hence use of 2010 rather than 2004 price weights lowers overall GDP growth estimates (annex table 2): with 2004 price weights, the contribution of the non-hydrocarbon sector is 1.2 percentage points above the estimate generated using 2010 price weights, which lifts measured aggregate growth in 2004 prices. Because nominal GDP is the same regardless of the choice of base year, the flip side of larger real GDP growth when using constant 2004 prices is a lower estimate of the growth in the GDP deflator than what would be implied by use of 2010 price weights.
Annex table 1 Comparison of sector shares (%)
Base year 2004 Base year 2010
2013 2014 2015 2013 2014 2015
Mining and quarrying 40.7 37.4 34.8 48.4 45.0 42.3
Non-mining and quarrying 59.3 62.6 65.2 51.6 55.0 57.7of whichServices 40.4 43.0 44.9 37.7 40.8 43.0Construction 11.9 12.7 13.5 6.8 7.4 7.9Manufacturing 9.1 8.9 8.8 8.9 8.7 8.7
Source: MDP&S calculations.
Annex table 2 Contribution to growth (percentage points)
Base year 2004 Base year 2010
2014 2015 2014 2015
Mining and quarrying -1.0 0.2 -1.2 0.2
Non-mining and quarrying 7.3 7.7 6.1 6.6of whichServices 5.4 5.3 5.1 5.1Construction 1.7 1.9 1.0 1.1Manufacturing 0.4 0.6 0.2 0.6
Overall GDP growth(%) 6.3 7.8 4.9 6.8
Source: MDP&S calculations.

14
Qatar Economic Outlook 2014–2015

15
Part 2—Performance in 2013
Qatar’s economy grew by 6.5% in 2013, driven by expansion in non-hydrocarbons, notably services (led by finance and real estate). Construction output gathered momentum, propelled largely by the state’s large investments in infrastructure and property.
Inflation inched up to 3.1% in 2013 from just under 2% in 2012, mainly reflecting increases in residential rents, utilities and other housing-related services. Foreign inflationary pressures were absent, principally due to moderating global food and commodity prices.
The fiscal, trade and current account balances were sizeable. The fiscal surplus in FY2013/14 was estimated at 12.6% of nominal GDP, up from 11.2% the previous fiscal year, on the back of a steep rise in investment income, while preliminary estimates of actual spending declined. Both the trade and current account surpluses were a shade down on 2012’s outcomes, at 52.1% and 30.9% of nominal GDP, as service imports and remittances picked up and merchandise export growth slowed.
GDP growth
Aggregate analysis
Qatar’s economy crossed a key threshold in 2013 as it passed the $200 billion mark—hitting $202.5 billion (figure 2.1).
Figure 2.1 Nominal GDP ($ billion)
97.8
125.1
169.8
202.5
0
50
100
150
200
250
20132012201120102009
189.9
Source: Estimates from the Ministry of Development Planning and Statistics (MDP&S) based on data at http://www.qsa.gov.qa/eng/index.htm.
Click here for chart data
It grew by 6.5% in real (volume) terms during the year (figure 2.2). This is a rate more closely reflecting wider norms in countries of the Gulf Cooperation Council (GCC) (figure 2.3), now that the expansion phase of upstream production of liquefied natural gas (LNG) has been completed.
In nominal (value) terms the economy grew at almost the same pace, 6.6%, in 2013. The GDP deflator, a measure of the price of all goods and services in the
Figure 2.2 Qatar’s nominal and real GDP growth (%)
6.6 6.5
12.0
-15.2
16.7
27.9
13.0
35.7
6.1
11.9
-20
-10
0
10
20
30
40
Real Nominal
20132012201120102009
Source: MDP&S estimates based on data at http://www.qsa.gov.qa/eng/index.htm.
Click here for chart data
Figure 2.3 GCC real GDP growth, (year-on-year change, %)
-10
-5
0
5
10
15
20
United Arab EmiratesSaudi ArabiaQatarOmanKuwaitBahrain
20132012201120102009
Source: IMF, World Economic Outlook April 2014 database (http://www.imf.org/external/pubs/ft/weo/2014/01/weodata/download.aspx).
Click here for chart data

16
Qatar Economic Outlook 2014–2015
economy, edged up by 0.1% from 2012. At sector level, value-added deflators that rose include household services (6.2%), electricity and water (5.8%) and social services (3.6%). Manufacturing was the only component to decline (by 2.8%). An increase (fall) in a sector’s value-added deflator occurs when the weighted price of its gross output increases (falls) relative to the weighted cost of intermediate goods and services used in production. An explanation of movements at sector level therefore requires a detailed, micro-level analysis of changes in the prices of all inputs—domestic and imported—and of all outputs produced by that sector.
The Ministry of Development Planning and Statistics (MDP&S) released expenditure-side estimates of GDP for the first time in 2013 (figure 2.4), with annual estimates dating back to 2009. (Quarterly estimates will be released at end-June 2014.) According to these estimates, exports, which are dominated by hydrocarbons, are the single largest expenditure component of GDP, accounting for 73.2%. Reflecting the combination of many unskilled migrant workers and the capital intensity of the oil and gas sector, household consumption spending constituted only 13.4% of GDP in 2013, which is an unusually low average propensity to consume for an economy.
Gross domestic investment is the second-largest expenditure component. Investments include upstream oil and gas production facilities, sizeable real estate development and heavy investments in economic and social infrastructure. Investment as a share of GDP stood at 29.2% in 2013, and has averaged 32.8% since 2009. Because measurement errors in expenditure estimates of GDP (equal to the difference between the uncorrected
expenditure-side estimates of GDP and MDP&S’s output-based measures) have been included in the investment figures, they are likely to be subject to error.
Finally, Qatar’s imports are also weighty and in 2013 accounted for 52% of final domestic spending (gross capital formation plus household and government consumption). The high level of import dependency reflects the small and open nature of the economy and its limited domestic economic base.
Because both income- and expenditure-side estimates of GDP are available, it is now possible to calculate Qatar’s aggregate savings rate—the difference between nominal GDP and nominal household and government consumption, measured as a share of nominal GDP. It stood at 73.2% of GDP in 2013. The step-up in 2009–2011 (figure 2.5) reflected the surge in Qatar’s hydrocarbon production and income. Qatar’s saving rate constitutes a substantial proportion of income, but this is not unusual in a small, mineral-rich economy. Indeed, substantial savings in the present are essential if Qatar is to meet the needs of its future generations. The marginal declines observed in 2012 and 2013 reflect rates of increase in private and government consumption slightly greater than the growth of nominal income.
From an expenditure perspective, real growth in 2013 stemmed largely from investment, which contributed over 3.5 percentage points of total growth. In 2010–2012, exports were the main engine of growth, but with hydrocarbon activity having plateaued its scope for export growth has narrowed, for a meagre contribution of 1.4 percentage points in 2013 (figure 2.6).
Economic diversification
In 2013, supply-side GDP expansion was overwhelmingly driven by non-hydrocarbons. The fastest-growing components were government, household and
Figure 2.5 Gross domestic savings rate (% of GDP)
60
62
64
66
68
70
72
74
76
20132012201120102009
Note: Gross domestic savings rate calculation: (Nominal GDP – (Private Consumption + Government Expenditure)) / Nominal GDP. Data for 2012 and 2013 are preliminary estimates.Source: MDP&S.
Click here for chart data
Figure 2.4 Expenditure side GDP, QR billion, current prices
-300
-200
-100
0
100
200
300
400
500
600
Imports (goods and services)
Exports (goods and services)
Gross capital formation
Government final consumption expenditure
Household consumption expenditure
20132012201120102009
Note: Gross capital formation includes statistical discrepancy. Data for 2012 and 2013 are preliminary estimates.Source: MDP&S.
Click here for chart data

17
Part 2 Performance in 2013
social services (18.5%); finance and real estate (14.3%); construction (13.6%); and trade and hospitality (12.8%). Growth in the non-oil and gas economy was much higher than in hydrocarbons, which inched up by just 0.1%.
Given the plateau (or possibly peak in the short run) of hydrocarbon production (see part 1), the share of oil and gas in aggregate output fell in 2013 in both real and nominal terms (figure 2.7). In real terms (in 2004 prices), the share of hydrocarbons in total output is lower than the same share in nominal (current price) terms. (See the Annex in part 1.) Real hydrocarbon prices rose sharply from 2004 (the base year used for Qatar’s national accounts) to 2013, giving oil and gas a far higher weight in the nominal than real calculation using 2004 weights. The calculation in nominal terms provides a better barometer of the changing composition of output in the economy.
Although greater diversification is evident in the structure of output, little evidence yet shows through that the economy is becoming more knowledge based. For example, increased demand for workers is concentrated in lower-skilled occupations (figure 2.8), even if some knowledge segments such as ICT are turning in robust growth. In 2012, the latest year with labour force survey data, un- and semi-skilled workers accounted for more than 70% of employment. The share of highly skilled workers in the population declined between 2008 and 2012. This trend is conditioned by the occupational structure of construction and some service subsectors, which are accounting for a substantial component of growth (discussed in the next section).
Non-hydrocarbon sector breakdown
As in 2012, the major driver of growth in the non-oil and gas economy in 2013 was service activity, which expanded by 14.5%. Alone it contributed 5.0 percentage points of overall growth (figure 2.9). All service subsectors saw solid growth (figure 2.10). Finance
Figure 2.6 Contributions to real GDP growth, expenditure (percentage points)
1.60.83.51.4
-0.8
-20
-10
0
10
20
30
2009 2010 2011 2012 2013
Imports (goods and services)
Exports (goods and services)
Gross capital formation
Government final consumption expenditure
Household consumption expenditure
GDP
Note: Constant prices used to devise shares and component growth rates, contributions to growth using previous year’s share valueSource: MDP&S estimates based on data at http://www.qsa.gov.qa/eng/index.htm.
Click here for chart data
Figure 2.7 Hydrocarbons and non-hydrocarbons, share in real and nominal GDP (%)
43.5
0
20
40
60
80
100
Nominal hydrocarbonsNominal non-hydrocarbons
Real hydrocarbons
Real non-hydrocarbons
20132012201120102009
59.8
40.2 44.8
55.2 55.6
44.4 52.6
47.4 53.5
45.4 58.1
41.9 56.2
43.3 56.8
43.2 59.3
40.7 54.4
45.6
Note: Hydrocarbons include crude oil and gas extraction under mining and quarrying.Source: MDP&S estimates based on data at http://www.qsa.gov.qa/eng/index.htm.
Click here for chart data
Figure 2.8 Non-Qatari workers’ skills composition (%)
0
20
40
60
80
100
Highly skilled Skilled Semi-skilled Unskilled
20122011201020092008
Source: MDP&S, Labour Force Survey 2012.
Click here for chart data
Figure 2.9 Contribution to real GDP growth, supply (percentage points)
1.9
11.6
6.9
0.6 0.0
1.2
1.6
0.9
1.0 0.5
0.8
1.1
1.2
1.1 1.5
8.2
2.8
4.5
3.4 5.0
-5
0
5
10
15
20
2009 2010 2011 2012 2013
Hydrocarbons
ManufacturingElectricity and waterConstruction
ServicesImputed bank services, charges and import duties
Real GDP
12.0
16.7
6.1
13.0
6.5
Note: Hydrocarbons include crude oil and gas extraction under mining and quarrying. Services include transport and communications, trade and hospitality, financial, government, household and social services. Source: MDP&S estimates based on data at http://www.qsa.gov.qa/eng/index.htm.
Click here for chart data

18
Qatar Economic Outlook 2014–2015
and real estate grew by 14.3%, primarily on greater lending to large infrastructure projects. Transport and telecommunications expanded by 9.7%, driven by Qatar Airways’ expansion, additions to LNG transport capacity and robust growth in ICT. In trade and hospitality, the Qatar Tourism Authority reported that average hotel occupancy rates were up from 58% in 2012 Q3 to 64% a year later.
The twin engines of services growth were a rising population—generating demand in the wider economy—and expansion of government, household and social services, in which public administration and defence, education, health and social services all expanded. The larger population may have helped stimulate growth of public services, but it is hard to be certain as government services expanded faster than the population in both 2012 and 2013 (figure 2.11). What is clear, though, is that government activity is still a significant contributor to overall growth.
Construction output gathered momentum in 2013, to reach 13.6% (figure 2.12) and contributing 1.5 percentage points of overall growth. Activity was largely propelled by Qatar’s huge investments in infrastructure and real estate. Large projects include Qatar Rail and “mega” real estate developments for Lusail City and Msheireb (Downtown Doha).
Expansion in the third-largest contributor to GDP growth in 2013—manufacturing—was 5.6% (figure 2.13). Its share in aggregate output was a modest 10.2%, contributing just 0.5 percentage points to aggregate growth, as a sharp decline in expansion of fertiliser output clipped 2.3 percentage points from its growth. (Global fertiliser demand and prices retreated during the year, cutting margins over the opportunity cost of feedstock and discouraging production.) Growth in other manufacturing subsectors slowed to 5.7%, from 12.2% in 2012, as rising output began to bump up against installed capacity limits.
Figure 2.11 Indices for population, utilities and services (2009 = 100)
151.1
139.2
0
20
40
60
80
100
120
140
160
180
Government, household and social services
Finance and real estate
Trade and hospitality
PopulationUtlilities
20132012201120102009
145.3153.6
Source: MDP&S estimates based on data at http://www.qsa.gov.qa/eng/index.htm.
Click here for chart data
Figure 2.13 Manufacturing output
21.7
25.528.1
32.931.2
0
5
10
15
20
25
30
35
QR billion Growth
20132012201120102009
Note: Output is measured in constant prices.Source: MDP&S estimates based on data at http://www.qsa.gov.qa/eng/index.htm.
Click here for chart data
Figure 2.12 Construction output
28.431.0
37.934.3
0
5
10
15
20
25
30
35
40
45
QR billion Growth
20132012201120102009
43.1
6.9 9.5 10.5 10.513.6
Note: Output is measured in constant prices.Source: MDP&S estimates based on data at http://www.qsa.gov.qa/eng/index.htm.
Click here for chart data
Figure 2.10 Services subsector growth (%)
12.8
9.7
0
5
10
15
20
25
30
Government, household and social services
Finance and real estateTransport and telecommunicationsTrade and hospitality
20132012201120102009
18.5
14.3
Note: Output is measured in constant prices. Source: MDP&S estimates based on data at http://www.qsa.gov.qa/eng/index.htm.
Click here for chart data

19
Part 2 Performance in 2013
Prices
Consumer prices
Headline inflation rose to 3.1% in 2013 (figure 2.14), below the 3.6% forecast made in June 2013’s Qatar Economic Outlook but close to the 3.2% forecast of the Update of December 2013. The rate is measured by change in the year-average consumer price index.
The rent, utilities and related housing services component, which has a weight of over 30% in the index, was up by 5.9% in 2013. Only the entertainment, recreation and culture component saw a faster rise, of 7.3% (figure 2.15).
Figure 2.15 Annual inflation (%)
1.2
-15
-10
-5
0
5
10
20132012201120102009
-12.0
-4.3
2.33.74.4
2.0
-12.7
-4.9-3.3
5.9
2.6
6.4
2.3 1.4
Miscellaneous goods and services
Entertainment, recreation and culture
Transport and communications
Medical care and health services
Furniture, textiles and home appliancesRent, utilities and related housing services
Clothing and footwearFood, beverages and tobaccoConsumer price index
7.3
Source: MDP&S estimates based on data at http://www.qsa.gov.qa/eng/index.htm.
Click here for chart data
Core inflation drifted down in 2013 to 2.2%. This narrower measure of price inflation removes the more volatile components of the index (utilities, residential rent and food). Monthly headline inflation peaked in April 2013, registering 3.7% year-on-year growth. By December 2013 inflation had eased to 2.6% year on year (figure 2.16). The moderation in the latter part of the year was broadly based, with average month-on-month rental inflation falling by half (from 0.6% to 0.3%) between April and December.
Producer prices
In 2013, the producer price index rose by only 0.2% (figure 2.17). Energy and utilities was the only subcategory to register a meaningful increase, rising by 7.0% year on year owing to prices rises from Ras Laffan Power Company and Qatar Electricity and Water Company. Hydrocarbon prices obtained by Qatar, which carry the largest weight in the index (76.9%), were virtually flat.
Figure 2.16 Monthly headline inflation (year on year, %)
1.2
2.93.1
2.7
3.7
2.7
3.4
2.72.9
0.0
0.5
1.0
1.5
2.0
2.5
3.0
3.5
4.0
Jan 14Oct 13Jul 13Apr 13Jan 13Oct 12Jul 12Apr 12Jan 12
2.3
2.6
Source: MDP&S estimates based on data at http://www.qsa.gov.qa/eng/index.htm.
Click here for chart data
Figure 2.14 Annual headline and core inflation (%)
-4.9
-2.0-2.4
2.2
4.6
1.9
3.6
1.9
-6
-4
-2
0
2
4
6
CoreHeadline
20132012201120102009
2.23.1
Note: Core inflation is headline inflation less food, rent and utilities.Source: MDP&S estimates based on data at http://www.qsa.gov.qa/eng/index.htm.
Click here for chart data
Figure 2.17 Producer price index growth (%)
-32.9
34.6
6.6
39.1
-1.0
-35.0
3.8
-40
-30
-20
-10
0
10
20
30
40
50
Manufacturing
Energy and utilities
Hydrocarbons
Producer prices
20132012201120102009
0.2
18.8
8.3
0.1
-26.6
22.019.2
21.2
-0.10.20.2 2.1
7.0
Source: MDP&S estimates based on data at http://www.qsa.gov.qa/eng/index.htm.
Click here for chart data

20
Qatar Economic Outlook 2014–2015
Asset markets: Equities and property
Qatar Exchange
Qatar Exchange (QE) is the trading platform for domestic equities (box 2.1). The QE Index, a benchmark index of the top 20 largest and most liquid stocks, gained 24.2% during 2013.
Globally, equity markets rose strongly in 2013 due to returning confidence, easy liquidity conditions and positive signals that the eurozone had averted a deepening crisis. GCC markets outperformed global markets (figure 2.18), buoyed by investor expectations
of solid GCC economic growth, strong government spending across GCC countries and, for the United Arab Emirates, a sharp rise in land prices that form the core assets of many companies listed there.
Within this broader picture, QE was supported by the anticipation of Qatar’s graduation from MSCI “frontier” to “emerging market” status in May 2014, as well as stronger profits: QE-listed firms reported 6.7% growth in net profits in the first nine months of 2013 relative to 1.9% growth in the same period of 2012.
Real estate
According to the QCB real estate price index, transaction prices at end-2013 were 20.7% higher than a year earlier (figure 2.19). While land and building prices continue to appreciate, the average index level for 2013 (180.4) is still 6.1% lower than the index peak of August 2008 (192.2).
Business Monitor International tracks real estate rental prices for Qatar. Reporting on the first nine months of 2013, it suggests that average industrial rents declined by 7.7% (relative to January–June 2012) from QR98 to QR90 per square metre per month. Office rents increased by a mere 0.8% while retail rents remained constant (figure 2.20).
Measured retail rental changes were probably affected by new government regulations introduced in 2013, including a two-year price freeze for existing tenants.
Box 2.1 Selected financial and institutional developments, 2013January. Effective 31 January, a new law made Qatar Central Bank (QCB) the single financial regulator in the state. Under the law, QCB becomes the principal governing authority assuming control, supervisory powers and full regulatory responsibility for all financial service providers in Qatar.
February. QE introduced sponsored access and market making with the strategic intention of enhancing liquidity, through the liquidity provider scheme and by providing more cost-efficient and streamlined access to the market for global investors. Sponsored access gives domestic and international market participants direct access to QE via members, without having to be members themselves. This should encourage more investors to participate.
March. Enterprise Qatar (EQ) launched, with its partners, a programme of free workshop-training sessions for small and medium-sized enterprises (SMEs).
April. Qatar Development Bank and the International Trade Centre hosted a workshop and seminar focusing on export promotion and competitiveness. They highlighted approaches for developing best practices in export marketing, administration, quality and standards, and supply chain management.
June. MSCI reclassified the MSCI Qatar Index to emerging market status, to take effect from May 2014. This recategorisation recognises the progress made by QE on several fronts, including developing and upgrading of delivery versus payment systems.
September. QCB issued Treasury bills for 91 days (QR2 billion), 182 days (QR1 billion) and 273 days (QR1 billion).
October. The Qatar Financial Centre Regulatory Authority (QFCRA) announced new prudential rules for insurance firms operating from the Qatar Financial Centre. This instruction came after comprehensive public consultation and dialogue with firms at the QFCRA. The new rules come into force in January 2015.
November/December. EQ launched Tadqeeq to assist the start-up and SME sectors in Qatar. It offers a 70% subsidised audit and accounting-support facility to participants. After Jadwaand and Oqod, Tadqeeq is EQ’s third initiative in an integrated package of business development and SME support services.
December. The Strategic Plan for Financial Sector Regulation was launched by QCB with the QFCRA and the Qatar Financial Markets Authority, aimed at regulating the financial sector in Qatar and focusing primarily on 2014–2016.
Figure 2.18 GCC stock price indices and S&P Global index (year-on-year change, %)
1.8
15.1
-30
-20
-10
0
10
20
30
40
50
-20
0
20
40
60
80
100
120
140
160
S&P Global 100
Bahrain (BSE Index)
Kuwait (KSE Index)
UAE (Dubai Financial Market) UAE (Abu Dhabi Index)Saudi Arabia (TSA Index)
Oman (MSM 30)
QE Index
Jan 14Oct 13Jul 13Apr 13Jan 13Oct 12Jul 12Apr 12Jan 12
-0.6
Sources: Qatar Exchange (http://www.qe.com.qa/pps/qe/qe%20english%20portal/Pages/Home/) and CEIC database.
Click here for chart data

21
Part 2 Performance in 2013
Figure 2.19 QCB real estate price index
169.4157.2
0
50
100
150
200
250
Feb 14Dec 13Oct 13Aug 13Jun 13Apr 13Feb 13Dec 12
190.4 189.8209.4
Source: QCB (http://www.qcb.gov.qa/English/Publications/Statistics/RealEstate/Pages/RealEstatePriceIndex.aspx.
Click here for chart data
Figure 2.20 Real estate rentals, Doha (QR per square metre per month)
150165 166
228 228
55
98 90
0
50
100
150
200
250
Jan−Sept 2013
Jul−Dec 2012
Jan−Jun 2012
Jul−Dec 2011
Jan−Jun 2011
IndustrialRetailOffice
Note: Rental rates are average of minimum and maximum. The index captures transactions, making no allowance for the quality and location of the underlying real estate assets, nor incorporating the price of the underlying stock. No available data post September 2013. Source: Business Monitor International, Qatar Real Estate Report, various issues.
Click here for chart data
Other measures, including stricter health and safety regulations for industrial warehousing, created a temporary shortfall in space in 2013 that pushed rents up in the first half, before they fell back in the second.
Caution needs to be exercised in interpreting all these price estimates, however, as they make no adjustments for the quality and location of real estate assets, and refer only to new lease contracts.
Money supply and credit
Money supply
Growth of the money supply—based on its broad definition, M2 (see Glossary)—slowed to 19.6% in 2013 from 22.9% the previous year, attenuating the potential impact on inflation (box 2.2). But early in the year money supply growth accelerated, and by April was up 44% on the same period a year earlier. This spurt moderated over
Box 2.2 Overview of recent money growth and consumer price inflation in Qatar
Inflation has two main sources: foreign (i.e. imported) and domestic.
Foreign inflation is caused by price increases of imported goods and services owing to nominal effective exchange rate depreciation and/or to rising costs of goods and services in exporting countries.
Domestic inflation occurs when local demand (particularly for non-tradable goods and services) is greater than the domestic supply (a positive output gap). For given levels of productive capacity, possible contributors to excess demand could be fiscal spending growth, monetary expansion or a fast-rising population. Sometimes negative shocks to supply, say due to natural disasters or geopolitical events, can generate a positive output gap.
In the last decade or so, both foreign and domestic forces have contributed to inflation in Qatar.
2003–2008Inflation climbed steeply to an annual average 15% in 2008 from a sedate 2% in 2003, pushed by foreign and domestic factors.
The country imported inflation as a result of spiralling global commodity prices and a depreciation of the nominal effective exchange rate of the US dollar. Domestically, three main factors amplified price pressures. A ramp-up in fiscal spending, made possible by surging hydrocarbon export revenues, added to real demand. Rapid population growth—between 2003 and 2008 Qatar’s resident population almost doubled—boosted domestic demand, particularly for non-traded goods and services. Finally, excess liquidity, stimulated by fiscal spending, low domestic interest rates and (towards the end of the period) strong capital inflows supported rapid domestic credit growth.
2009–2010The global financial crisis arrested and reversed earlier inflationary pressures. In 2009 Qatar’s consumer prices fell by 5% (a swing of 20 percentage points from 2008) owing to collapsing world commodity prices, a virtual halt to domestic credit growth (2% in 2009 against 49% in 2008), slower growth of fiscal spending, and a sharp break in the rapid population growth of earlier years. Supply bottlenecks that had contributed to rental inflationary pressures in earlier years also eased. Consumer prices continued to fall during 2010 as economic adjustments continued.
2011–2013Prices stopped falling and inflation began to normalise in 2011. Externally, inflation conditions remained benign, but domestic demand gradually recovered and the strong flow of credit, particularly to public enterprises, resumed. In 2012, inflation tracked up to nearly 2% and in 2013 to just over 3%.
2014–2015?For 2014, external sources of inflationary pressures appear muted. Internally, further population growth is likely, as is a pick-up in investment spending, although restraint in the government’s current spending plans is set to check domestic liquidity growth. In 2015, the extremely low interest rates in the US may begin to edge up, feeding through to tighter liquidity conditions in Qatar, which would provide some offset to the inflationary pressures caused by rising domestic demand.

22
Qatar Economic Outlook 2014–2015
the rest of the year to average about 17% year on year (figure 2.21).
The money supply growth in 2013 was driven mainly by a sharp pick-up in time and demand deposits in local currency (figure 2.22). Their strong growth could point to public entities and private businesses gearing up to execute planned investment projects. Higher public sector deposits are also grounded in a sharp slowdown in spending on administrative expenses (see Fiscal accounts). Individuals’ local currency deposits also increased, in line with population growth.
The slower money supply growth in 2013 relative to 2012 stems mainly from a halving of growth of foreign currency deposits (see figure 2.22), which mirrored movements in public sector foreign currency deposits (these deposits account for three quarters of all foreign currency deposits in the banking system). Slower foreign currency deposit growth suggests a possible rebalancing of the public sector asset portfolio, a view consistent
with 2013’s sharply wider deficit on the financial account of the balance of payments and suggesting that a larger proportion of hydrocarbon receipts has been invested abroad. Moreover, QCB increased its foreign assets in 2013, probably indicating that a chunk of foreign currency deposits were replaced by local currency deposits in the commercial banking system.
Credit
The counterpart of the money supply growth in 2013 was an expansion of commercial banks’ assets. Notably, domestic credit grew by 11.8% in the year to December 2013 (in a sharp slowdown from the previous year). Growth came mainly from the private sector, unlike in 2012 when the public sector was the leading contributor (figure 2.23).
Private sector credit saw nearly 14% expansion in 2013. This was driven primarily by credit to service sector businesses and to contractors (figure 2.24), reflecting both their underlying momentum and their sizeable contributions to overall growth (see GDP growth). Credit to real estate, which had grown fast in earlier years
Figure 2.21 Money supply (M2)
381.1
0
50
100
150
200
250
300
350
400
450
500
0
5
10
15
20
25
30
35
40
45
50Growth (year on year, %)QR billion
Jan14
Nov13
Sep13
Jul13
May13
Mar13
Jan13
Nov12
Sep12
Jul12
May12
Mar12
Jan12
22.9
455.7
19.6
17
44.3
Sources: QCB, Monthly Monetary Bulletin and CEIC database http://www.qcb.gov.qa/English/Publications/Statistics/Pages/MonthlyBulletin.aspx.
Click here for chart data
Figure 2.22 Contribution to money supply growth (percentage points)
0
5
10
15
20
25
Currency in circulation Demand deposits
Time deposits Deposits in foreign currency
20132012
Source: QCB, Monthly Monetary Bulletin, http://www.qcb.gov.qa/English/Publications/Statistics/Pages/MonthlyBulletin.aspx.
Click here for chart data
Figure 2.23 Contribution to credit growth (percentage points)
0
5
10
15
20
25
30Consumption Private sector Public sector
20132012
Source: QCB, Monthly Monetary Bulletin, http://www.qcb.gov.qa/English/Publications/Statistics/Pages/MonthlyBulletin.aspx.
Click here for chart data
Figure 2.24 Growth of commercial banks’ private sector credit (year on year, % change)
-20
0
20
40
60
80
100
Others (industry, services, others)General tradeReal estate Contractors
Jan14
Nov13
Sep13
Jul13
May13
Mar13
Jan13
Nov12
Sep12
Jul12
May12
Mar12
Jan12
Credit to the service sectoraccelerated in the first half of 2013.Credit increased 45% over 2013.
Credit to contractorscontinues toaccelerate
Source: MDP&S estimates based on data from QCB’s Monthly Monetary Bulletin, http://www.qcb.gov.qa/English/Publications/Statistics/Pages/MonthlyBulletin.aspx.
Click here for chart data

23
Part 2 Performance in 2013
and is the largest component of private sector credit (figure 2.25), was pretty flat in 2013, most probably reflecting QCB’s end-2012 measures to control banks’ exposure to the property market as it strengthened its risk-based supervisory framework for banks.
Broadly in line with the growth of nominal non-hydrocarbon income and bolstered by marginally lower consumer credit interest rates and strong population growth, consumption credit grew by 12.9% in 2013. Growth of credit to the public sector was 9.7% in 2013. Although the stock of public sector credit increased, credit growth decelerated sharply in 2013 from 2012.
Since the first quarter of 2013 total government deposits (at QCB and commercial banks) have exceeded outstanding credit (figure 2.26), suggesting less reliance by the public sector on financing from the banking system. The higher government deposits can be partly explained by the issuance of T-bills and bonds, and by a large fiscal surplus. (Higher government deposits with QCB reflect the use of T-bills for domestic capital-market development purposes rather than for financing needs.)
Fiscal accounts Qatar maintains an “open book” accounting system, which allows revenue and expenditure to be recorded for some time after the close of the fiscal year and so can change the final or actual account estimates from preliminary estimates (box 2.3). This section discusses government revenue and spending based on preliminary estimates for FY2013/14.
Government revenue
Preliminary estimates of total government revenue show a rise of 4.8% in FY2013/14 from the previous fiscal year’s outcome (figure 2.27).
Investment income surged in FY2013/14, largely owing to a change in accounting practices for the financial surplus of Qatar Petroleum (QP—box 2.4). Hydrocarbon income shrank by 15.9% over the year, per preliminary estimates, but as hydrocarbon prices and export volumes stayed fairly stable this estimate may be revised up. Some of the apparent decline in revenue could be attributed to one-time windfall gains that accrued in 2012, when Qatar redirected liquefied natural gas (LNG) cargoes to Japan, where it received premium prices.
Figure 2.27 Composition of fiscal revenue and total revenue growth
42.8
19.7 19.9
0
50
100
150
200
250
300
350
-20
-10
0
10
20
30
40
50
Growth Other InvestmentOil and gas
FY13/14FY12/13FY11/12FY10/11FY09/10FY08/09
QR billion %
4.8
27.7
-7.8
Note: The fiscal year runs from 1 April to 31 March. Source: MDP&S estimated based on data from MOF.
Click here for chart data
Figure 2.25 Private businesses credit by main sectors
0
40
80
120
160
200
240
ServicesReal estate
ContractorsIndustry
General trade
Dec 13Dec 12Dec 11
Source: QCB, Quarterly Statistical Bulletin, http://www.qcb.gov.qa/English/Publications/Statistics/Pages/Statisticalbulletins.aspx
Click here for chart data
Figure 2.26 Balance of deposits and credits for individuals, government and private sector (QR billion)
-80
-60
-40
-20
0
20
40
60
80
Personal Companies/insitutionsTotal government
Jul 13Jan 13Jul 12Jan 12
Source: QCB, Monthly Monetary Bulletin, http://www.qcb.gov.qa/English/Publications/Statistics/Pages/MonthlyBulletin.aspx.
Click here for chart data
Box 2.3 Open book fiscal accounting
The government’s use of open accounts requires analysts to exercise caution when reviewing fiscal trends. For example, a preliminary estimate of an 8.8% capital expenditure decrease was made for FY2012/13 relative to FY2011/12—but subsequent revisions show a moderate increase of 1.9% for the same period. Almost QR10 billion in capital expenditure was added to the FY2012/13 estimate in FY2013/14.
Likewise with current expenditure, a preliminary estimate for FY2012/13, made in mid-2013, showed a moderate increase of 2.9% over FY2011/12, yet revised estimates show a 20.3% increase—an additional QR36.6 billion over the earlier preliminary estimate.
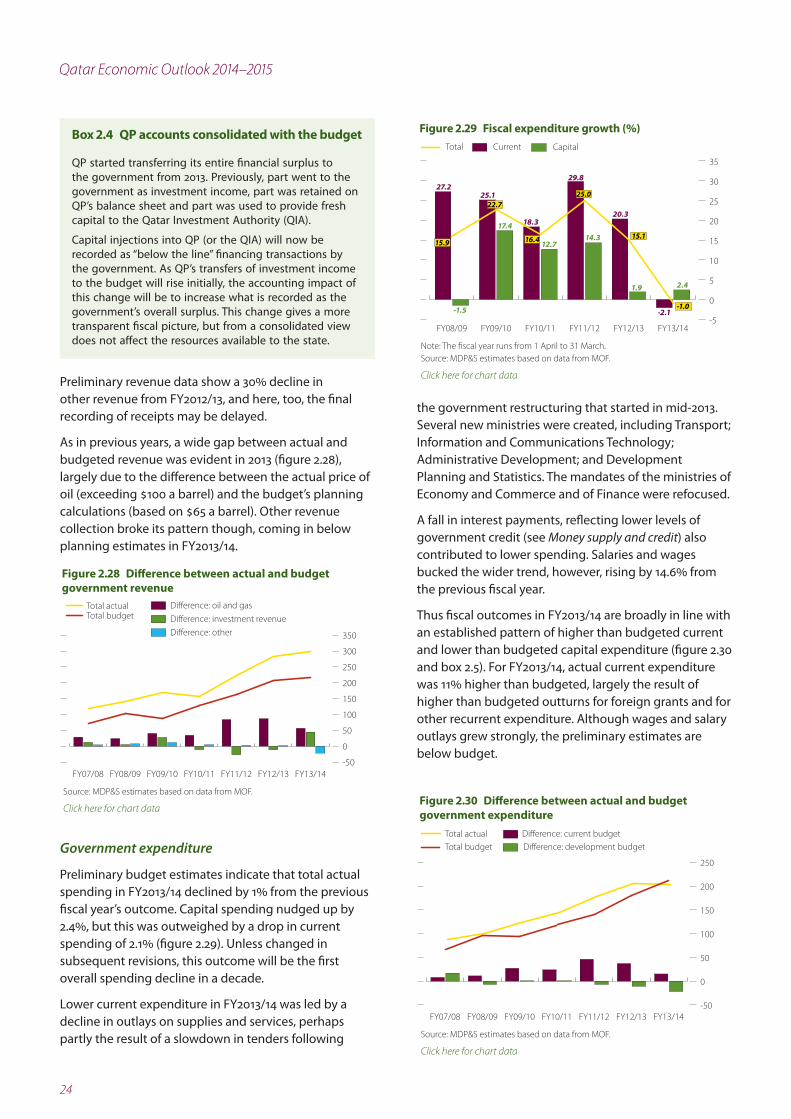
24
Qatar Economic Outlook 2014–2015
Preliminary revenue data show a 30% decline in other revenue from FY2012/13, and here, too, the final recording of receipts may be delayed.
As in previous years, a wide gap between actual and budgeted revenue was evident in 2013 (figure 2.28), largely due to the difference between the actual price of oil (exceeding $100 a barrel) and the budget’s planning calculations (based on $65 a barrel). Other revenue collection broke its pattern though, coming in below planning estimates in FY2013/14.
Government expenditure
Preliminary budget estimates indicate that total actual spending in FY2013/14 declined by 1% from the previous fiscal year’s outcome. Capital spending nudged up by 2.4%, but this was outweighed by a drop in current spending of 2.1% (figure 2.29). Unless changed in subsequent revisions, this outcome will be the first overall spending decline in a decade.
Lower current expenditure in FY2013/14 was led by a decline in outlays on supplies and services, perhaps partly the result of a slowdown in tenders following
the government restructuring that started in mid-2013. Several new ministries were created, including Transport; Information and Communications Technology; Administrative Development; and Development Planning and Statistics. The mandates of the ministries of Economy and Commerce and of Finance were refocused.
A fall in interest payments, reflecting lower levels of government credit (see Money supply and credit) also contributed to lower spending. Salaries and wages bucked the wider trend, however, rising by 14.6% from the previous fiscal year.
Thus fiscal outcomes in FY2013/14 are broadly in line with an established pattern of higher than budgeted current and lower than budgeted capital expenditure (figure 2.30 and box 2.5). For FY2013/14, actual current expenditure was 11% higher than budgeted, largely the result of higher than budgeted outturns for foreign grants and for other recurrent expenditure. Although wages and salary outlays grew strongly, the preliminary estimates are below budget.
Figure 2.28 Difference between actual and budget government revenue
-50
0
50
100
150
200
250
300
350Difference: other
Difference: investment revenue
Difference: oil and gasTotal actualTotal budget
FY13/14FY12/13FY11/12FY10/11FY09/10FY08/09FY07/08
Source: MDP&S estimates based on data from MOF.
Click here for chart data
Box 2.4 QP accounts consolidated with the budget
QP started transferring its entire financial surplus to the government from 2013. Previously, part went to the government as investment income, part was retained on QP’s balance sheet and part was used to provide fresh capital to the Qatar Investment Authority (QIA).
Capital injections into QP (or the QIA) will now be recorded as “below the line” financing transactions by the government. As QP’s transfers of investment income to the budget will rise initially, the accounting impact of this change will be to increase what is recorded as the government’s overall surplus. This change gives a more transparent fiscal picture, but from a consolidated view does not affect the resources available to the state.
Figure 2.29 Fiscal expenditure growth (%)
-2.1
27.2
18.3
25.1
20.3
29.8
-1.0
2.4
-1.5
12.7
1.9
14.3 15.117.4
-5
0
5
10
15
20
25
30
35
Total CapitalCurrent
FY13/14FY12/13FY11/12FY10/11FY09/10FY08/09
15.9 16.4
25.022.7
Note: The fiscal year runs from 1 April to 31 March. Source: MDP&S estimates based on data from MOF.
Click here for chart data
Figure 2.30 Difference between actual and budget government expenditure
-50
0
50
100
150
200
250
Difference: development budgetDifference: current budgetTotal actual
Total budget
FY13/14FY12/13FY11/12FY10/11FY09/10FY08/09FY07/08
Source: MDP&S estimates based on data from MOF.
Click here for chart data

25
Part 2 Performance in 2013
Box 2.5 Allocation of government expenditure Since FY2007/08, GDP has risen almost 2.5 times. In that time the government’s current spending has tripled, but its capital spending has increased by a more modest 1.5 times, raising the share of current spending in total government expenditure from 61% in FY2007/08 to 74% in FY2013/14.
For current spending in riyal terms, general administration (wages and salaries, rent, interest payments, etc.—box figure 1) accounts for most of the increase. The fastest-growing component of spending was grants to governments and institutions (especially to foreign governments) whose share in total current expenditure rose from 3% to 5%. The categories of health; education; and labour, social services, food subsidies and transfers more than tripled their share of total current expenditure.
Box figure 1 Allocation of current expenditure (QR billion)
0
20
40
60
80
100
120
140
160
Other (civil list, subscriptions)Water and electricity GrantsLabour, social services, food subsidies and transfersHealth EducationDefence and securityGeneral administration
FY13/14FY12/13FY11/12FY10/11FY09/10FY08/09FY07/08
Note: The fiscal year runs from 1 April to 31 March.Source: MOF.
Click here for chart data
Capital expenditure has been lumpier (box figure 2). The category land reclamation and other is one of the largest and includes, in addition to land reclamation (40–60%), defence and security, R&D projects, and in some years investment in non-oil industries. The increased spending on this component since FY2010/11 reflects rising spending on defence and security, and investment in R&D projects.
Communications and transport, which includes all non-road transport investments, has increased its share from 14% to 24%. It includes spending on the new international airport and seaport. Spending on roads has risen consistently, taking its share from 8% to 12%. Finally, while investments in education have remained more or less constant in absolute terms, investments in health have risen almost 3.5 times, although the share increased only marginally from 2.6% to 3.6% over the period.
Box figure 2 Allocation of capital expenditure (QR billion)
0
10
20
30
40
50
60
Housing and constructionHealthEducationRoads
UtilitiesCommunications and transport
Land reclamation and other
FY13/14FY12/13FY11/12FY10/11FY09/10FY08/09FY07/08
Note: The fiscal year runs from 1 April to 31 March.Source: MOF.
Click here for chart data
Preliminary estimates suggest that actual capital expenditure was 30% lower than budgeted, possibly reflecting delays in project implementation as well as lags in processing payments (see box 2.3). The gap between budgeted and actual capital spending has been widening in recent years: since FY2010/11 the budget has increased by 72% but actual expenditure by just 19%. However if, as in the past, payment processing catches up in the coming months, the estimate of actual capital spending may be revised upward.
Fiscal balance and debt At the close of FY2013/14, the government’s overall surplus was estimated at QR94.6 billion, equivalent to 12.6% of nominal GDP and up from 11.2% the previous year. Most of the increase came from the transfer of QP’s entire financial surplus to the government (see box 2.4).
The non-hydrocarbon fiscal balance—the total fiscal balance less income received directly from oil and gas—narrowed in FY2013/14 from the previous year (figure 2.31), again largely as a result of the transfer of QP’s financial surplus, which is counted by the Ministry of Finance (MOF) as “investment income”. If investment income were considered indirect oil and gas revenue, the non-hydrocarbon fiscal deficit would have widened in FY2013/14.
Total government debt was trimmed in FY2013/14, declining to QR206.2 billion at about 27.5% of GDP in fiscal-year terms (figure 2.32). That some of the government debt (Sukuk and other bonds) reached their maturity date was the main factor in the absolute decline, outweighing the continued increase in domestic borrowing from T-bill issuance.
But total government debt figures do not tell the whole story about the financial balance. First, government

26
Qatar Economic Outlook 2014–2015
guarantees and borrowing of semi-government institutions are not included in the above figures. Second, government debt statistics do not take into account the assets of QIA. The net financial balance of the government is probably therefore positive, but cannot be quantified.
External sectorAt 52.1% of nominal GDP in 2013, Qatar once again recorded a considerable trade surplus, though slightly down from 2012’s 53.8%. Total exports climbed by 3.7% relative to 2012. Imports of goods and services increased faster, at 7.8%, but from a smaller base (figure 2.33). Service imports were responsible for overall import growth, increasing by 14.9% in 2013 from 2012. In addition, merchandise imports (free on board) grew by only 2.2% in 2013 according to QCB data.
Figure 2.33 Total trade growth
Growth (%)QR billion
215
53956.455.6
0
100
200
300
400
500
600
-40
-30
-20
-10
0
10
20
30
40
50
60
Import growth
Export growth
Imports
Exports
20132012201120102009
-29.3
-12.3
4.7
47.4
3.77.8
24.9
17.4
Note: MDP&S estimates based on QCB Balance of Payments data and include merchandise goods plus services.Source: QCB (http://www.qcb.gov.qa/English/Publications/Statistics/BalanceofPayments/Pages/default.aspx).
Click here for chart data
Figure 2.31 Fiscal balance (% of GDP)
-16.5
-9.6
-24-20-16-12-8-40481216
Other revenueInvestment revenueDevelopment expenditure Current expenditure
Non-hydrocarbon balance
FY13/14FY12/13FY11/12FY10/11FY09/10FY08/09
-21.7-20.2 -19.6
-21.8-20.1
-8.3-10.2 -9.1 -7.8 -7.3
-7.1
8.2
14.1
7.44.0
5.9
13.8
6.98.5
4.76.4
9.26.1
-9.5
-17.1-14.0
-17.1
-7.3
Note: The fiscal year runs from 1 April to 31 March. Source: MDP&S estimates based on data from MOF.
Click here for chart data
Figure 2.32 Total government debt
9.2
0
50
100
150
200
250
0
9
18
27
36
45
Total debt Foreign debt
Domestic debt
FY13/14FY12/13FY11/12FY10/11FY09/10FY08/09
% of GDP QR billion
28.48.8
65.3
60.8
70.3
124.2
87.9
119.3
87.9
142.0
74.3
131.9
31.832.9 32.6
39.8
27.5
Source: MDP&S estimates based on data from MOF.
Click here for chart data
The current account was again in substantial surplus, at 30.9% of nominal GDP (figure 2.34). The large trade surplus (QR383.9 billion) offset deficits on the services (QR59.3 billion), transfers (QR55.5 billion) and income (QR41.2 billion) accounts. Those deficits were primarily due to large remittance outflows and to payments of profits and wages. Total investment income was an estimated QR23.3 billion in 2013, a decrease of QR0.5 billion from the previous year.
QCB’s gross foreign currency reserves stood at QR153.1 billion at end-December 2013, up by QR32.8 billion over 12 months, or 27.2%, reflecting the overall surplus in the balance of payments achieved during 2013.
Figure 2.34 Current account
96.8
23.3
225.8
189.2
0
40
80
120
160
200
240
QR billion % of GDP
201320122011201020092008
23.16.5
86.6
19.030.6 32.7
227.8
30.9
Note: Data for 2011–2013 are based on QCB balance-of-payments (BOP) data; previous data are MDP&S estimates based on QCB BOP data.Source: QCB (http://www.qcb.gov.qa/English/Publications/Statistics/BalanceofPayments/Pages/default.aspx).
Click here for chart data

27
Part 2 Performance in 2013
Terms of trade and the real effective exchange rate
The real effective exchange rate (REER) provides a measure of competitiveness for a country’s output on the global market (see Glossary). It captures movements in the nominal effective exchange rate and adjusts for differential price inflation among countries.
Estimates from MDP&S suggest that Qatar’s REER was unchanged in 2013 (figure 2.35), primarily because the US dollar, to which the riyal is pegged, maintained its value against most currencies of Qatar’s major trading partners, with a slight depreciation against the euro and a modest appreciation against the yen. Additionally, Qatar’s inflation in 2013 was at par with that in its major trading partners.
Figure 2.35 Real effective exchange rate index (2005 = 100)
-0.1
139.5
128.2
-10
-5
0
5
10
15
122124126128130132134136138140142
Growth (%) REER (2005 = 100)
201320122011201020092008
11.5
-8.0
3.6
-2.4
-0.0
128.3
132.8
129.6 129.6
Sources: CEIC database; MDP&S staff estimates.
Click here for chart data

28
Qatar Economic Outlook 2014–2015

29
Glossary—Key economic concepts
Gross domestic productGross domestic product (GDP) is a fundamental macroeconomic aggregate that plays a central role in macroeconomic analysis, although it has limitations (see below).
What is GDP?GDP is widely used as a measure of economic output, as it represents the value of final goods and services produced in a given period of time, usually one year. Another way of looking at it is as the sum of value added across all sectors in the economy over a period.
How is GDP measured?There are three main approaches to measure GDP, which should give the same results.
• Production approach: GDP is equal to the sum of value added across all sectors i.e. the gross output minus the value of intermediate consumption of goods and services summed across all sectors.
• Expenditure approach: GDP is the sum of final consumption of goods and services by the government and private sector; of gross investment (additions to physical stock of capital in the economy, including changes in inventories); and of net exports of goods and non-factor services (exports minus imports).
• Income approach: GDP is the sum of all income generated from the production process. This includes compensation of employees, and the gross operating surplus of enterprises such as profits, rents and interest.
What is the difference between GDP valued at factor cost and at market prices? GDP at factor cost is the sum of all factor-of-production incomes generated from the production process (such as wages, profits, rents and interest), while GDP valued at market prices is GDP at factor cost plus indirect output taxes, less subsidies to businesses, which creates
a wedge between the incomes earned by factors of production and the price paid for output in the market.
What is the difference between nominal and real GDP?Nominal GDP values economic output using current prices, the prices prevailing over the period during which GDP is measured. Accordingly, changes in nominal GDP will reflect changes in prices as well as changes in the volume of output. Real GDP values output at constant prices by using the prices of a selected year called the “base year”. When relative prices change, the choice of the base year can influence measured real GDP growth.
What is the GDP deflator?This is simply the ratio of nominal and real GDP, and hence it can be considered a measure of the aggregate price level of all domestically produced goods and services in the economy.
What is GDP per capita?This is total GDP divided by the resident population of the country. While it is commonly used as a proxy for standard of living, GDP per capita is not a measure of personal income nor necessarily of the representative well-being of the population.
What are the limitations of GDP as a measure for economic output and income?GDP measures do not normally capture the value of goods and services that are not traded in the market, such as volunteer and charitable services and goods and services produced for own use. Similarly, the existence of a large underground economy or black-market activities (which are not that important in Qatar) would result in a GDP measure that underestimates the true size of the economy.

30
Qatar Economic Outlook 2014–2015
Fiscal conceptsWhat is the overall fiscal balance?This is the difference in a given period between total government revenues (including grants) and total government expenditures (current and capital) plus net lending.
What is the primary balance? This is the overall fiscal balance net of all interest payments and receipts by government. The primary balance provides an indicator of the current fiscal support for aggregate demand since interest payments are linked to stocks of liabilities and assets of the previous period.
What is the non-hydrocarbon fiscal balance?This is the overall fiscal balance less oil and gas revenues, which in Qatar is defined in terms of direct revenues (royalties and taxes) received from hydrocarbon production. Investment income from government companies and government-linked companies, which may accrue from hydrocarbons-related activities, is not included in the definition of oil and gas revenues. The non-hydrocarbon fiscal balance provides an indication of the fiscal stimulus to the local economy funded by oil and gas revenues.
What is the fiscal year?The annual budget and accounting period for which revenue and expenditure provisions are made, and for which accounts are presented. The fiscal year for Qatar runs from 1 April to 31 March.
What is cash accounting?Cash accounts record revenue when cash is received and expenses when they are paid in cash, irrespective of when the income fell due or the expenditure commitments were made. Although they are important for understanding what the government contributes to liquidity in the economy and for managing cash, cash accounts may not provide a true picture of the government’s financial position.
What is accrual accounting?Accrual accounts record transactions when the underlying event or commitment occurs, regardless of the timing of the related cash settlement. Revenues are recorded when income is earned, and expenses are recorded when liabilities are incurred or resources consumed. In principle, the difference between cash-based balances and those calculated on an accrual basis should equal “changes in arrears”.
What is “quasi-fiscal” spending?This is expenditure executed by state-owned (financial and non-financial) enterprises. It is in character similar to expenditure normally executed by the government, but is not included in the government budget (or listed under “contingent liabilities” in the budget). Central bank operations that entail implicit subsidies or taxes are also quasi-fiscal in nature.
Monetary conceptsWhat is reserve money or M0?Reserve money is a liability of the central bank. It is the sum of (i) currency issued by and held outside the central bank; (ii) banks’ deposits at the central bank to satisfy reserve requirements and for clearing purposes; and (iii) in the case of Qatar, other reserves including bank deposits at the central bank in excess of requirements. Reserve money can also be expressed in terms of the central bank’s counterpart assets, which fall into two main categories: net foreign assets, which comprise the net official international reserves plus any other net foreign assets that are less liquid and hence are not included in the net official international reserves; and net domestic assets, which include central bank net claims on government (claims minus deposits) and claims on other sectors.
What is narrow money or M1?This is currency in circulation plus demand deposits. Narrow money is considered “liquid”. Narrow money typically pays zero or relatively low rates of interest.
What is “quasi money”?This is the less liquid part of the money supply and includes savings deposits and all deposits denominated in foreign currency.
What is “broad money” or M2?This is the sum of quasi-money and M1.
What are official foreign reserves?These are the central bank’s liquid foreign assets that can be used to secure the country’s external payments at any moment. Reserves include gold, foreign exchange, and the reserve position at the International Monetary Fund. Reserves are usually presented in net terms by excluding from the gross official foreign reserves the central bank’s foreign liabilities.

31
Glossary
What is “credit”? Credit creation involves the provision of resources by the lender (such as banks or any other financial institution) to the borrower. In this way the lender acquires a financial claim and the borrower incurs a liability to repay in the future. Credit to non-financial sectors (such as government, private businesses and households) is mainly used to finance production, consumption and capital formation.
Balance-of-payments conceptsWhat is the trade balance? This is the difference between a nation’s imports and exports of merchandise measured over a specified period (normally a calendar year). The trade balance is part of the wider current account balance.
What is the income and services balance?This is the sum of net income received from non-residents and the balance in services trade measured over a specified period. The income account comprises flows derived from labour (wages paid to non-resident employees) and from net investment income. The services balance consists mainly of payments for travel, transport, communications, construction, housing rentals and financial services.
What is the current account balance?This is the sum of the trade, income and services balances, plus net current transfers, which include cash transfers, gifts in kind and remittances (which are sizeable in Qatar) sent by foreign workers to families back home. It is termed the current account because goods and services are generally consumed in the current period.
What is the capital and financial account balance?This records purchases or sales of financial assets or transactions related to international borrowing and lending. It also includes capital transfers.
What is the international investment position and the capital accountThe international investment position of a country is a financial statement presenting both the composition and value of a country’s external financial assets and liabilities. The difference between these assets and liabilities is its net international investment position.
What is external debt?This is the stock of outstanding contractual liabilities, issued by the public and private sector to non-residents, that have been disbursed.
Exchange rate conceptsWhat is the bilateral exchange rate? This is the price of one currency measured in units of another. The nominal US dollar exchange rate for the Qatari riyal is pegged at QR3.64 = $1.
What is the nominal effective exchange rate (NEER)?Unlike the bilateral exchange rate, the NEER is not a market price but an index number that measures the weighted average of the country’s bilateral exchange rate against a basket of trading partners’ currencies over a given period. The size of the weights normally reflects their relative importance in the country’s international trade or in its overall foreign transactions, including external financial transactions. Movement of the NEER provides an indication of changes in the value of the domestic currency against the currencies in the basket. An appreciation occurs when a domestic currency unit can buy more of the basket of currencies.
What is the real effective exchange rate (REER)?This is the NEER adjusted for differential inflation rates between a home country (Qatar, for example) and its trading partners. An appreciation of the REER can occur either because the NEER is appreciating or because domestic inflation in the home country (Qatar) is higher than that in its trading partners. Changes in the REER provide a measure of the change in the currency’s purchasing power and of the price competitiveness of the country’s tradeable goods and services against trading partners’ goods and services.

32
Qatar Economic Outlook 2014–2015