Embed Size (px)
Citation preview

QAPI – The Ripple
Effect
Fistula First and beyond
Lisa Pantaleone, RN

Objectives
Demystify the QAPI process
Demonstrate the interrelationship of quality indicators from a clinic’s actual experience. (ripple effect)
Identify common barriers in developing a quality program
Identify the key components of a successful quality program

Our story
2 separate units
PSMH Regional Dialysis Centre – 24 station non profit
hospital based unit – 110 hemo 38 home therapies, in patient
acute dialysis. ( over 30 years of service).
74% fistula, 3% cath’s >90days. Dr Breitenfield Silver Awards in 07
and 08.
MDC – 15 station JV freestanding for profit unit – 40 hemo
and 2 pd ( 4 years of service)
72% fistula, 4% cath’s > 90 days. Dr Breitenfield Gold Award in 09.
Separate entities with shared staff, IDT leaders,
nephrologists, surgeon, etc

Lessons Learned
PSMH unit struggles
“loved patients”…..to death??
7-8 years ago struggled with indicators most importantly morbidity and mortality.
Ahead of the curve with vascular access upper 40%’s
“pet project” before Fistula First
Binge and purge quality program but obvious that fistula patients “did better”
Drill down – fistula patients most likely to meet other indicators.
Less than 2 years later meeting or exceeding most indicators

Not reinventing the wheel
MDC opens 2005
Used existing quality models
Staff very familiar with quality
Initial quality data “good” not good enough – spirit
of competition was natural.
Able to focus on the art of drill down.

2008 results – Goal 70% fistula rate
Apparent theme emerged
AS fistula rates rose so did other core indicators
Case of the chicken or the egg??
Is it direct effect with fistula being the driving force?
Is it indirect effect with drill down of outliers identifying common issues effecting multiple indicators?

Fistula First
Both PSMH Dialysis and Manteno Dialysis have
average fistula rates of
70% or more (68-76%)
And permanent cath rate consistently below
5%

MDC Results
2008 fistula rate
64
66
68
70
72
74
76
jan feb mar apr may jun jul aug sep oct nov dec

Bonus!!

Side by side fistula and kt/V
2008 fistula rate
64
66
68
70
72
74
76
jan feb mar apr may jun jul aug sep oct nov dec

Hemoglobin

Hemoglobin and fistula
2008 fistula rate
64
66
68
70
72
74
76
jan feb mar apr may jun jul aug sep oct nov dec

Benchmarking hgb qtr 4 2008
hemoglobin
0
20
40
60
80
expected MDC IL NW 9/10
< 10
10-12 target
>12

Other indicators
The Ripple Effect:
Access complications: Decrease of 50%
Episodes decreased from 1:18pm to 1:36pm
Infection Control:
NINE CONSECUTIVE MONTHS INFECTION FREE!! 0% infection rate for BSI, exit site, or access site infections!!
Decrease in overall phosphorus < 5.5
Increase in Albumin > 4.0
Patient satisfaction increased in areas of education and quality of care.
QAPI – what is it?
Sea of Initials – QA, QI, PI, CQA, CQI, RCA, PDSA
DOQI =KDOQI
FF
PFP
QAPI - Quality Assessment and Process
Improvement

Navigating the sea of Quality
Vascular Access
Adequacy
Anemia
Nutrition
Infection Control
Quality of Life
Mortality/morbidity
And more……..

Approach to QAPI
Stagnation - resistance to change
` settling for good enough
failure to stay current in practice
Binge and purge of data
Denial
Tidal Wave – chaotic reactive approach
flavor of the month
poor navigation
failure to trend and respond – data overload

Ripples
Safe/Steady churning of the water
Uses structure/planned interdisciplinary approach
Shared vision and ownership
Clear Goals
Measures/benchmarks
Tools

OK but what does it MEAN?
Its not about the acronym
Our definition:
Providing the treatment and achieving the outcomes YOU would want for YOUR own family.
“Care for the patient in the chair like the person you love most in the world”
Continuously challenging “good enough”
Has to be measurable and quantifiable.
It IS about……..

the B E S T
BEST practice =BEST
outcomes =
BEST CARE
Be awaretest and tweak
Explore and explainstrategize

B
Be Aware
Needs assessment What do we do well? – strengths, practices and processes that work –
are they exportable?
What can we do better? Evidence based data driven.
Benchmarks – Network reports, Dialysis Facility Compare, FF, USRDS, DOPPS, etc
Research – journals, seminars, conferences, networking
For Us – getting fistula placed, cannulation, assessing, physician support, and staff buy in were strengths.
Incident patients from in and out of the area with no CKD ed, caths in place, infections lead to delays in fistula or access infection were barriers.

E
Explore and explain Look at the data
Walk through the unit with eyes wide open
What are our variances
What are our strengths and our barriers
Develop a realistic agreed upon Goal
For us: assuming out of area pts were biggest problem, drill down of outliers, infection data by type of access, (tunnelled and non tunnelled, cath, fistulae, graft). When were infections and caths occurring, how, why, who. Patterns and trending were key. VAM asset but staff viewed access as her responsibility. DENIAL… So…..
Goals – Improve fistula rate to 70% consistently.

S
Strategize - avoid the paralysis of analysis How to exploit strengths, remove barriers
Use of resources direct effect ( interventions) and indirect
( documentation and data management)
Benchmarks
Ownership and team involvement
Communication of progress
For us: strong quality program, monthly meeting, add review of outliers specifics with MD,EMR with reporting capabilities and charting ease, recomp of staff for cath/access care incorporating hand hygiene, competition, PPE, Use “whats in it for me” with everyone, patient involvement/education. Utilize entire IDT team link to nutrition, QOL, anemia mgmt, pt and MD satisfaction, added to annual evaluations for all staff.

T
Test and tweak Initiate interventions
Accumulate data
Pattern and trend
Drill down
Communicate progress, gather input, monitor variances,
Respond with updated interventions.
For us: outlier trends, monthly quality meetings, unit meetings, email, reading material for potty breaks, - hand gel on machines, skills day, ckd ed follow up, appts, assessments, (anemia, home therapies growth, etc) Foot checks, send out for non dialysis abx., etc which started us back at B

BEST take aways for us
Easy for stagnation to occur in the quality pond – ripples work best A few small pebbles got the water moving without the white water rapids
ride that would have occurred if we threw all our big rocks in at once. (focus and clarity are key)
The water will ripple in all directions if we’re all paddling in the same direction. ( shared vision with clear goals)
Always carry a life preserver even in gently rippling water, storms can still happen. ( be prepared to adapt, change interventions, refocus)
Don’t overlook the other fish/ecosystem in the pond pursuing the elusive Big one. ( analyze all indicators to be sure they’re all responding to the interventions in a positive way. Toxic ripples are NOT the goal.)
Using a structured interdisciplinary approach towards an indicator will improve indicators across the board – the drill down

Results – Chicken or the Egg??
The Ripple Effect:
Access complications: Decrease of 50%
Episodes decreased from 1:18pm to 1:36pm
Infection Control:
NINE CONSECUTIVE MONTHS INFECTION FREE!! 0% infection rate for BSI, exit site, or access site infections!!
Decrease in overall phosphorus < 5.5
Increase in Albumin > 4.0
Patient satisfaction increased in areas of education and quality of care. QOL??

All in the family
Working toward improved fistula rates positively
impacted all our quality goals.
AS fistula rates continued to improve to +70%
so did anemia, adequacy, infection, and
nutritional indicators – K and Phos….QOL??
Using “drill down techniques” identified outliers
with related quality issues or trends allowing for
barrier identification. ……
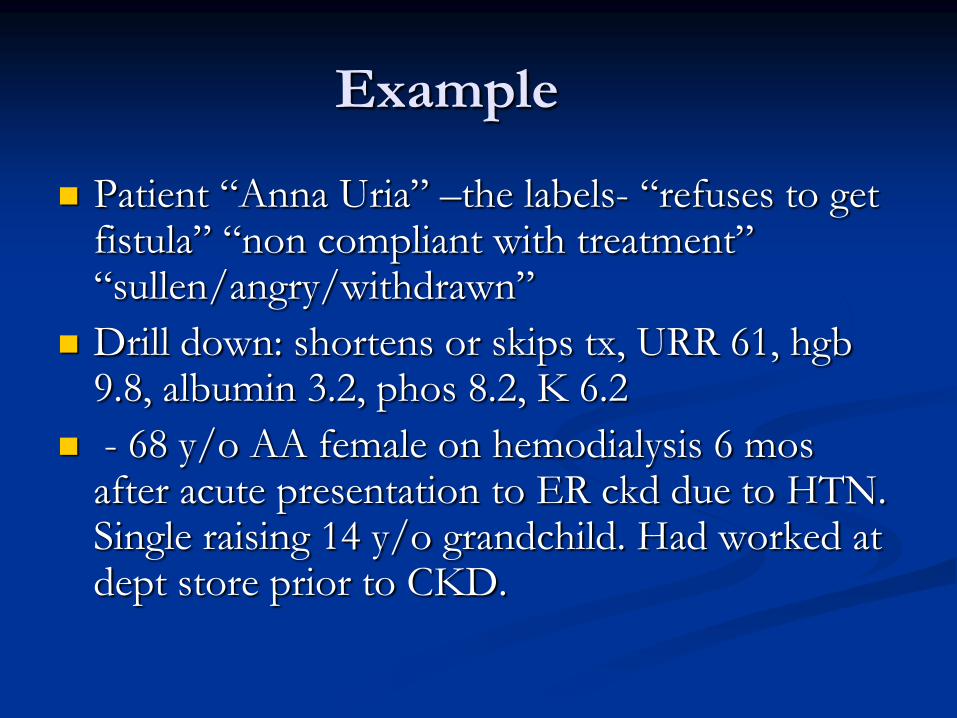
Example
Patient “Anna Uria” –the labels- “refuses to get fistula” “non compliant with treatment” “sullen/angry/withdrawn”
Drill down: shortens or skips tx, URR 61, hgb 9.8, albumin 3.2, phos 8.2, K 6.2
- 68 y/o AA female on hemodialysis 6 mos after acute presentation to ER ckd due to HTN. Single raising 14 y/o grandchild. Had worked at dept store prior to CKD.

Two roads which do you choose?
Tunnel vision binge and purge of data – education focused on fistula – everyone knows its better for you, “if you don’t comply you die”, etc
Interdisciplinary approach – focus on all issues- who is she really? New to dialysis – death sentence, history of poor outcomes
with f/f on dialysis. Unable to work loss of income, loss of housing, transportation issues,
food costs, medication costs.
Physically “sick and tired” – hgb , alb, adequacy.
Concerned about grandchild, home alone, who’s going to take care of him when I die? Who’s going to be around while I have surgery?
Why bother I’m dying……

Patient Centered Goal Setting
Have a fistula? – she could care less!!! Means nothing to her life. Need to speak the patient’s language.
Supporting her and the grandchild is what matters to her Education – dialysis is NOT automatic death sentence, what
can she expect, how can she impact outcomes? Not alone in circumstances – grieving process- coping skills, support group.
Her goals -Return to work – home therapies? Helps her work and spend time with grandchild – flexible. PD/HH
Working thru logistics – housing, meds, transportation, food, paying for surgery, supervision of grandchild.

The walls come tumbling down
Addressed basic survival issues
Fistula placed and used at 2months
URR 73% on 3.5 hours, phos 5.2, K 5.0 Alb 3.8
hgb 11. 5.
Start home therapies and return to work scheduled.
Not possible in tunnel visioned isolated multidisciplinary binge and purge approach to QAPI.

Summary
Successful QAPI is
A continuous cycle – a journey not a destination
a structured approach to achieving best care
Interdisciplinary and all inclusive
Utilizes resources effectively to maximize
interventions and minimize data management
responsive
Evident in the faces of our patients

Successful QAPI is NOT
Paralysis of analysis – data only
All consuming nor occurs in a vacuum
about the “numbers” it IS about Joe, Mary,
Bob, Alice, etc and giving them another
birthday, anniversary, getting to meet that new
grandchild, another family dinner… Quality of
LIFE.

Objectives???
Demystify QAPI
Demonstrate the interrelationship of quality
indicators
Identify common barriers in developing a quality
program
Identify the key components of a successful
quality program

Thank you
For your attention
For your time
For your dedication to your patients!
Wishing you smooth sailing through the ripples!
[email protected] 815-937-8716
![QAPI DNS DSW final [Read-Only] - LeadingAge New York · Background • 2011: CMS QAPI Demonstration Project ... – The main document supporting QAPI in your organization – Tailor](https://img.dokumen.tips/doc/110x75/601f7271487c22573729b7a4/qapi-dns-dsw-final-read-only-leadingage-new-york-background-a-2011-cms-qapi.jpg)