Embed Size (px)
Citation preview

WSJC
VVTSVTBB
WBKK
WABB
ZISA
VYTFVVVV
500
500
500
450
H540
500
500
500
500
450
H540
New Horizons
Q A N TA S A N N U A L R E V I E W 2 0 16
Contents
The Qantas Transformation program has reshaped the Qantas Group, delivered
record results and unlocked shareholder value. From this position of strength, and with our
people more engaged than ever, we’re looking ahead to a new phase of innovation and growth.
With world demand for air travel set to double over the next 20 years, Qantas and Jetstar have the ability to lead the aviation industry at a time
of unprecedented global change.
This Annual Review summarises our key achievements in 2015/16. It also sets out
the global forces that present the greatest opportunities for our business; our strategic
priorities; and the actions we’re taking to build a sustainable future.
Our Performance in 2015/16 03
> Our Transformation Continues 04
> Our Financial Framework 05
Chairman’s Report 06
CEO’s Report 08
Our Approach to Sustainability 10
> How We Create and Protect Value 11
> Global Forces 12
Clear Strategic Priorities 14
> Safety & Security as First Priority 15
> Maximising Our Domestic Position 18
> Resilient & Sustainable Qantas International 19
> Aligning with Asia 20
> Growth & Diversification at Qantas Loyalty 21
> Investing in Customer & Brand 22
> Harnessing Data & Digital 25
> Focus on People, Culture & Leadership 27
> Responsible Action on Energy, Emissions & Supply Chain 30
Accountability 34
Performance & Metrics 35
Key Downloads 39
Q A N T A S A N N U A L R E V I E W 2 0 1 6
02

Our Performance in 2015/161
Qantas Domestic
$578mUnderlying EBIT.
Up 20 per cent
Qantas International
$512mUnderlying EBIT.
Up 92 per cent
Qantas Loyalty
$346m Underlying EBIT.
Up 10 per cent
Jetstar Group
$452mUnderlying EBIT.
Up 97 per cent
Q ANTAS FREIGHT
$64mUnderlying EBIT. Down 44 per cent
Record underlying profit$1.53 billion
(� 57%)
Statutory earnings per share (EPS)
49.4 cents per share (� 24c)
Return on invested capital 23%
Operating cash flow $2.8 billion
Ex-fuel unit cost �3%
Net debt$5.6 billion
(within target $4.8-6b)
Group Performance
This exceptional performance reflects the strength of our Qantas Group strategy, with record results and increased margins for Qantas Domestic, Qantas International, the Jetstar Group and Qantas Loyalty, and Group-wide return on invested capital of 23 per cent.
Total underlying earnings before interest and tax (EBIT) in the domestic market – across both Qantas and Jetstar – rose 30 per cent to $820 million, and total underlying EBIT from the Group’s international operations was $722 million, up 107 per cent.
The result also reflects the continued delivery of the Qantas Transformation program, which has now unlocked
$1.66 billion in cost and revenue benefits since beginning in 2014. The Group’s disciplined fuel hedging – which helped secure a $664 million benefit from lower global fuel prices – was another driver.
The Group’s financial position was strengthened during the year, with $2.8 billion in operating cash flow used for capital expenditure, shareholder distributions and debt repayments, and excess cash used for refinancing aircraft. Qantas’ strong balance sheet and more sustainable outlook was recognised by ratings agencies during the financial year, with an investment grade credit rating restored by Standard & Poor’s and Moody’s Investor services.
Qantas reported an underlying profit before tax of $1.53 billion in 2015/16 – the best result in our 95-year history.
1 Refer to the Review of Operations section in the Qantas Annual Report 2016 for definition and explanation of non-statutory measures. Unless otherwise stated, amounts are reported on an underlying basis.
Q A N T A S A N N U A L R E V I E W 2 0 1 6
03

1 Refer to the Review of Operations section in the Qantas Annual Report 2016 for definition and explanation of non-statutory measures. Unless otherwise stated, amounts are reported on an underlying basis.
TargetProgress
Metric Timeframe
Accelerated Transformation
Benefits
$2.1b gross benefits>10% Group ex-fuel
expenditure reduction FY17 $1.66b benefits realised.
Ex-fuel expenditure reduced by 9%
5,000 FTE reduction FY17 4,605 FTE reduction
Deleverage Balance Sheet
>$1b debt reduction FY15 Delivered on schedule
Debt / EBITDA <3.5x FFO / net debt > 45% FY17 Delivered ahead of schedule
Cash Flow Sustainable positive free cash flow FY15 onwards Delivered on schedule
Fleet Simplification Eleven fleet types to seven FY16 Eight fleet types
Retaining 2 x non-reconfigured B747
Customer and Brand
Customer Advocacy (NPS) OngoingNPS record achieved at Qantas
Domestic, Qantas International and Qantas Loyalty
Maintain premium on-time performance:
Qantas DomesticOngoing Premium on-time performance
maintained with increase to 89.7%
ACH
IEVI
NG
OU
R T
AR
GE
TS
Qantas Transformation Scorecard
The Qantas Transformation program has unlocked total cost and revenue benefits of $1.66 billion since 2013/14 – including $557 million in 2015/16.
A further $450 million in benefits will be realised in 2016/17, to reach the Group’s increased target of $2.1 billion by 30 June 2017.
Our Transformation Continues1
Our Performance in 2015/16Q A N T A S A N N U A L R E V I E W 2 0 1 6
04

Optimal Capital Structure
The Group maintained an optimal capital structure throughout 2015/16, with net debt at year-end of $5.6 billion, within our target range of $4.8 billion to $6 billion. Credit metrics remain significantly better than the investment-grade metrics Qantas targets through the cycle.
In addition to strong short-term liquidity of $3 billion – including cash of $2 billion – the Group’s unencumbered asset base totals over US$3.9 billion.
Improving Return on Invested Capital
The Group’s ROIC of 23 per cent was up from 16 per cent in 2014/15, and well above our threshold of ROIC above 10 per cent through the cycle. All operating segments continue to deliver ROIC above the Group’s cost of capital. Efficient allocation of capital, increased fleet utilisation, and ongoing business transformation contributed to achieving strong returns.
Disciplined Allocation of Capital
The Group used cash in excess of short-term liquidity requirements to refinance 29 maturing aircraft leases, while funds from operations were directed to debt repayments ($1.1 billion), net capital expenditure ($1 billion), and shareholder distributions ($1 billion).
Shareholder Returns
The Group has returned more than $1 billion to shareholders over the past 12 months, through a $505 million capital return (completed in November 2015) and $500 million on-market share buy-back (completed in June 2016). Combined, these two capital management initiatives reduced shares on issue by 12.6 per cent, enhancing shareholder value.
Our strong result in 2015/16 means we can return a further $500 million via a fully-franked ordinary dividend of 7 cents per share – totalling $134 million – and an on-market share buy-back of up to $366 million.
Where there is surplus capital in the future, the Qantas Group will distribute to shareholders via an ordinary dividend as the first tranche of capital management.
OP
TIM
AL
CA
PIT
AL
STR
UC
TUR
ESurplus Capital
No Surplus Capital
Increased distributions, grow invested capital
Debt reduction
focus
4.8 6.0
10% ROIC
RO
IC (%
)
Net Debt ($b)
Qantas’ Financial Framework guides how we create value for our shareholders. Our overarching goal is to achieve maintainable earnings-per-share growth through the cycle, and in turn deliver total shareholder returns in the top quartile of global airlines and the ASX100.
The three core pillars of the framework are consistent:
> Maintaining an optimal capital structure that minimises the Group’s cost of capital;
> Achieving return on invested capital (ROIC) above 10 per cent through the cycle; and
> Growing invested capital with disciplined investment; returning any surplus to shareholders.
Efficient allocation of capital, increased fleet utilisation, and ongoing business transformation all contributed to achieving strong returns
Our Performance in 2015/16Q A N T A S A N N U A L R E V I E W 2 0 1 6
Our Financial Framework1
1 Refer to the Review of Operations section in the Qantas Annual Report 2016 for definition and explanation of non-statutory measures. Unless otherwise stated, amounts are reported on an underlying basis. 05

The business is stronger, more efficient and more customer-focused as a result – and positioned well for the future.
A Strong 2015/16
Once again, the Group’s balanced portfolio of businesses and brands showed its value in a complex market.
The Group’s domestic two-brand strategy has proven resilient throughout Australia’s economic transition, and that continued in 2015/16 with record domestic earnings. In the international market, Qantas and Jetstar have grown to meet rising demand in Asia- Pacific markets, while the Emirates partnership gives the Group wide access to European markets without significant invested capital.
Disciplined investment in product and service continues to secure record levels of satisfaction from customers, and the Qantas Loyalty business is increasingly a source of new ventures and diversified revenue streams.
Productivity and financial discipline underpin everything the Group does. This was recognised by Moody’s Investor Services, as well as Standard and Poor’s, when they restored our investment grade credit rating.
The Group’s portfolio showed its value in a complex market.
Chairman’s Report
Qantas’ profit in 2015/16 was the best in its history. For that, all of the Qantas Group’s employees can take great credit.
I also pay tribute to Alan Joyce and his management team. They have led Qantas through its most significant transformation since it was privatised two decades ago.
Q A N T A S A N N U A L R E V I E W 2 0 1 6
06

Shareholder Value
The Group has increased net free cash flow, grown return on invested capital and further strengthened its balance sheet, remaining in an optimal capital position throughout 2015/16.
I’m especially pleased that we have been able to return more than $1 billion in cash to shareholders over the past 12 months. Over the same period, earnings per share have almost doubled to reach 49 cents.
Shareholder returns will continue in 2016/17 with Qantas’ first ordinary dividend since 2009, and a further on-market share buy-back. Ordinary dividends will be our first choice for future capital management initiatives, in conjunction with other options including buy-backs, special dividends and capital returns, as appropriate.
Economic Conditions
Consumer confidence and travel demand softened in the domestic market through the middle of 2016.
However, Australia’s economic fundamentals are strong and demand in non-mining sectors is solid; the resurgence of inbound tourism with the lower Australian dollar has been particularly welcome.
Internationally, growth in our key Asia-Pacific trading partners is healthy, and Asia will be an engine room of air travel demand and Qantas Group growth for decades to come.
The UK Brexit decision had little direct impact on the Group, but did create short-term volatility in global markets, as other geopolitical events have done over recent years. This underlines the importance of the Group’s focus on cost control and diversifying revenue.
Global Forces
Looking to the long term, it’s clear that global businesses are dealing with accelerating change in technology, geopolitics and demographics.
The Board believes Qantas’ ability to deliver sustainable growth over the long term rests on its ability to understand and navigate these global forces, incorporating them into strategic planning.
At the same time, the Board is focused on measuring progress against non-financial value drivers across environmental, social and governance issues.
The Qantas Annual Review sets out the Group’s approach to sustainability, its view of the global forces most relevant to the business, and its strategic priorities in responding to both the challenges and opportunities they present.
Board Update
I was pleased to welcome Michael L’Estrange AO to the Board as a Non-Executive Director in April this year. Michael was a senior public servant and diplomat with the Australian Government for more than 27 years, as well as holding academic posts and directorships. His experience in global affairs will be invaluable to the Board given the wide range of geopolitical issues influencing the Group.
Looking Forward
The Group’s efforts in 2016/17 will be focused on continuing to advance its strategy and grow shareholder value. In doing so, Qantas will continue to drive trade and tourism, serve communities, support small business and champion Australia on the world stage – as only the national carrier can do.
As it moves towards 100 years of serving Australia, Qantas is in a position of strength. Again, I congratulate employees on a year of achievement and success.
Leigh Clifford AO
Chairman’s Report (continued)
Q A N T A S A N N U A L R E V I E W 2 0 1 6
07

CEO’S Report
Qantas’ record financial performance this past year is the continuation of a remarkable turnaround, built on the safety standards, operational excellence and customer satisfaction delivered by our people. That gives us the strongest possible foundations for the future.
It’s a performance that enabled us to announce a cash Record Result Bonus for non-executive employees, in recognition of their outstanding contribution, as well as rewards for our shareholders and the next phase of investment for our customers.
Group Performance
Every part of the Group contributed to our record result in 2015/16. Qantas Domestic, Qantas International, the Jetstar Group and Qantas Loyalty all reported record underlying EBIT and increased their operating margins.
Two-thirds of our earnings now come from our domestic and loyalty businesses, and one-third from our international operations, underlining the diversification and reduced volatility the portfolio strategy gives us through economic cycles.
The Group continues to meet both the short-term and long-term goals of our Financial Framework, which shapes the way we think about creating value for shareholders.
Every part of the Group contributed to our record result in 2015/16. Qantas Domestic, Qantas International, Jetstar and Qantas Loyalty all reported record underlying EBIT.
Q A N T A S A N N U A L R E V I E W 2 0 1 6
08

CEO’S Report (continued)
Role of Transformation
The biggest single driver of our performance is the $1.66 billion in cost and revenue benefits that we’ve unlocked through the Qantas Transformation program. With the program now entering its final year, we expect that to increase to $2.1 billion by June 2017.
Transformation is making Qantas’ cost base competitive. Just as importantly, it’s changed the way we work. We’re a far more agile company. We’ve accelerated our adoption of new technology, digital platforms and data analytics. And we’ve fostered a culture that encourages diversity, inclusion and innovation.
We’ve accelerated our adoption of new technology, digital platforms and data analytics.Qantas is a very different company from just a few years ago. Together with our well-balanced Group strategy, transformation means we’re resilient enough to perform in all market conditions and outperform many of our peers.
But of course, our environment isn’t going to stop evolving. We need to keep controlling our costs and being open to new ways of doing business.
Long-Term Sustainable Future
The ultimate goal of our transformation is to secure the sustainability of the Group.
We’re well on the way to doing that. But it’s not just about the actions we take in the short-term. We also need to think about the long-term – something that Qantas has done a great deal of over almost a century.
When we scan our environment, we see four global forces that are relevant to the success of the Group today and will have an even bigger impact in years ahead:
> New centres of customer demand and geopolitical influence, especially Asia;
> Rapid digitalisation and the rise of big data;
> Shifting customer and workforce preferences; and
> The implications of resource constraints and climate change.
All these trends come with challenges, but they also bring new opportunities for our business.
Clear Strategic Priorities
Preparing to take advantage of the big, global trends shaping aviation means continuing to deliver against our clear strategic priorities:
> Putting safety and security first at all times;
> Maximising the competitive advantages of the Group by aiming to be the best in every market we serve;
> Continuing to invest for our customers and strengthening our brands, including renewing our fleet, lounges, infrastructure and technology;
> Focusing on our people, culture and leadership, because our skilled, engaged workforce is the key to our success in everything we do; and
> Acting responsibly on energy, emissions and our supply chain, so that we reduce the costs and emissions of the fuel we burn, and play a positive role in the communities that support us.
We’re committed to advancing these priorities in 2016/17.
Role of the National Carrier
The role of the national carrier is core to Qantas’ identity. It’s what sets our brand apart from every other airline serving Australia, and it’s why we continue to invest in promoting Australian tourism, showcasing Australian suppliers and speaking up on issues that go to the heart of the Australian belief in basic fairness.
We’re as passionate as ever about helping unlock Australia’s potential. And we believe the best way we can do that is by building a strong, sustainable future for Qantas as the airline that represents Australia in the world.
Alan Joyce
Q A N T A S A N N U A L R E V I E W 2 0 1 6
09

Our Approach to Sustainability
As a company that’s been around for 95 years, Qantas is used to looking at the big picture. In that time, we’ve seen massive economic and technological advances and responded by transforming and adapting our business, setting milestones for the aviation industry along the way.
So when we think about sustainability today, we define it in simple terms. It’s about taking actions now to ensure we can succeed and grow for the decades ahead: building value for our shareholders; creating great jobs for our people; providing world-class service for our customers; and making a positive impact on the environment and community.
Q A N T A S A N N U A L R E V I E W 2 0 1 6
10

How We Create and Protect ValueThe Qantas Group’s approach to creating and protecting long-term value rests on two strategic pillars: foresight and accountability.
Foresight
Global forces, or mega-trends, are changing the environment we operate in – and the pace and scale of that change is increasing.
In 2015/16, we identified the four global forces that are most relevant to our business and mapped them against the strategic priorities that guide our business in responding to them.
Our Approach to Sustainability
New centres of customer demand and geopolitical
influence
New vs Old Powers
Rapid digitalisation
and the rise of big data
Emerging Possibilities
Shifting customer and
workforce preferences
Tomorrow’s People
Resource constraints and climate
change
Planetary Boundaries
Clear Strategic Priorities
Accountability
We hold ourselves accountable for – and disclose – our performance against our strategic priorities within the following frameworks.
Governance
> Our Group policies, business practices and Board committees
> Our approach to risk management
Integrity
> The Qantas Group beliefs
> Our actions and investments in the community
Transparency
> Disclosure of financial and non-financial metrics and progress against performance, reflecting the Group’s material issues.
> Inclusion within sustainability indices of most value to our stakeholders, like the Carbon Disclosure Project.
Click here for further detail
Q A N T A S A N N U A L R E V I E W 2 0 1 6
11
Global Forces
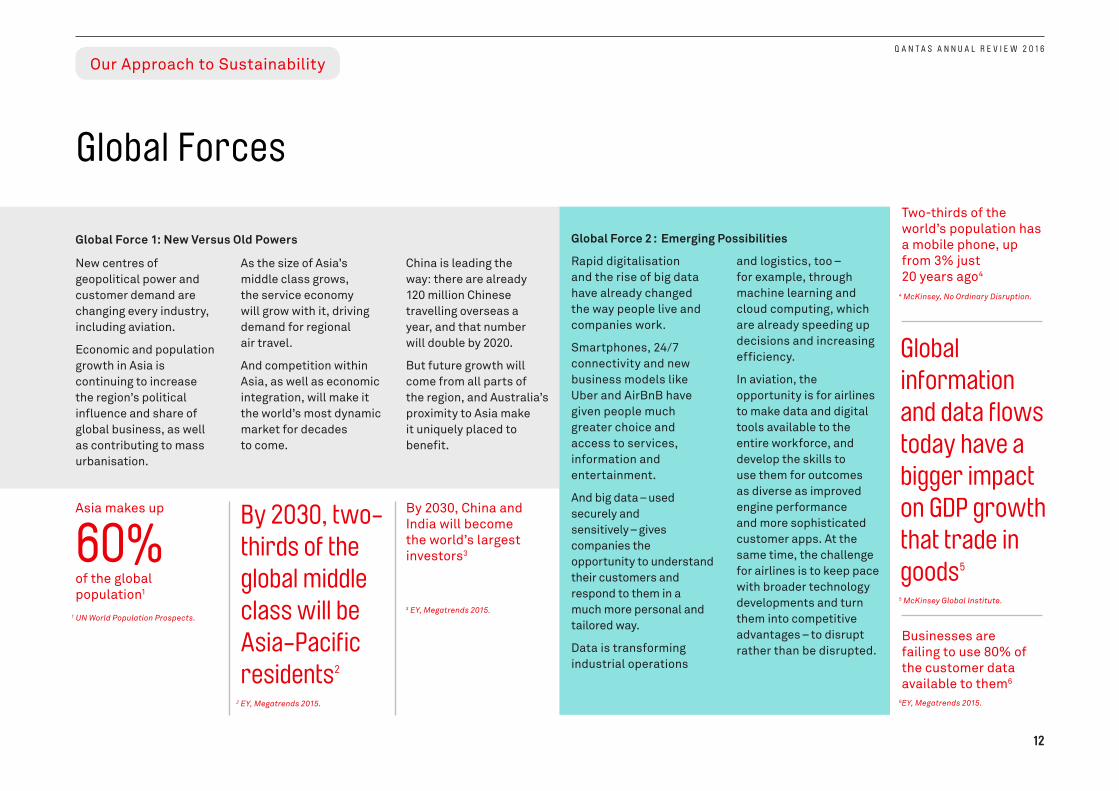
Global Force 1: New Versus Old Powers
New centres of geopolitical power and customer demand are changing every industry, including aviation.
Economic and population growth in Asia is continuing to increase the region’s political influence and share of global business, as well as contributing to mass urbanisation.
As the size of Asia’s middle class grows, the service economy will grow with it, driving demand for regional air travel.
And competition within Asia, as well as economic integration, will make it the world’s most dynamic market for decades to come.
China is leading the way: there are already 120 million Chinese travelling overseas a year, and that number will double by 2020.
But future growth will come from all parts of the region, and Australia’s proximity to Asia make it uniquely placed to benefit.
Global Force 2 : Emerging Possibilities
Rapid digitalisation and the rise of big data have already changed the way people live and companies work.
Smartphones, 24/7 connectivity and new business models like Uber and AirBnB have given people much greater choice and access to services, information and entertainment.
And big data – used securely and sensitively – gives companies the opportunity to understand their customers and respond to them in a much more personal and tailored way.
Data is transforming industrial operations
and logistics, too – for example, through machine learning and cloud computing, which are already speeding up decisions and increasing efficiency.
In aviation, the opportunity is for airlines to make data and digital tools available to the entire workforce, and develop the skills to use them for outcomes as diverse as improved engine performance and more sophisticated customer apps. At the same time, the challenge for airlines is to keep pace with broader technology developments and turn them into competitive advantages – to disrupt rather than be disrupted.
Asia makes up
60% of the global population1
By 2030, two-thirds of the global middle class will be Asia-Pacific residents2
Two-thirds of the world’s population has a mobile phone, up from 3% just 20 years ago4
Global information and data flows today have a bigger impact on GDP growth that trade in goods5
Businesses are failing to use 80% of the customer data available to them6
Our Approach to Sustainability
1 UN World Population Prospects.
2 EY, Megatrends 2015.
3 EY, Megatrends 2015.
6EY, Megatrends 2015.
4 McKinsey, No Ordinary Disruption.
5 McKinsey Global Institute.
By 2030, China and India will become the world’s largest investors3
Q A N T A S A N N U A L R E V I E W 2 0 1 6
12
Global Forces (continued)
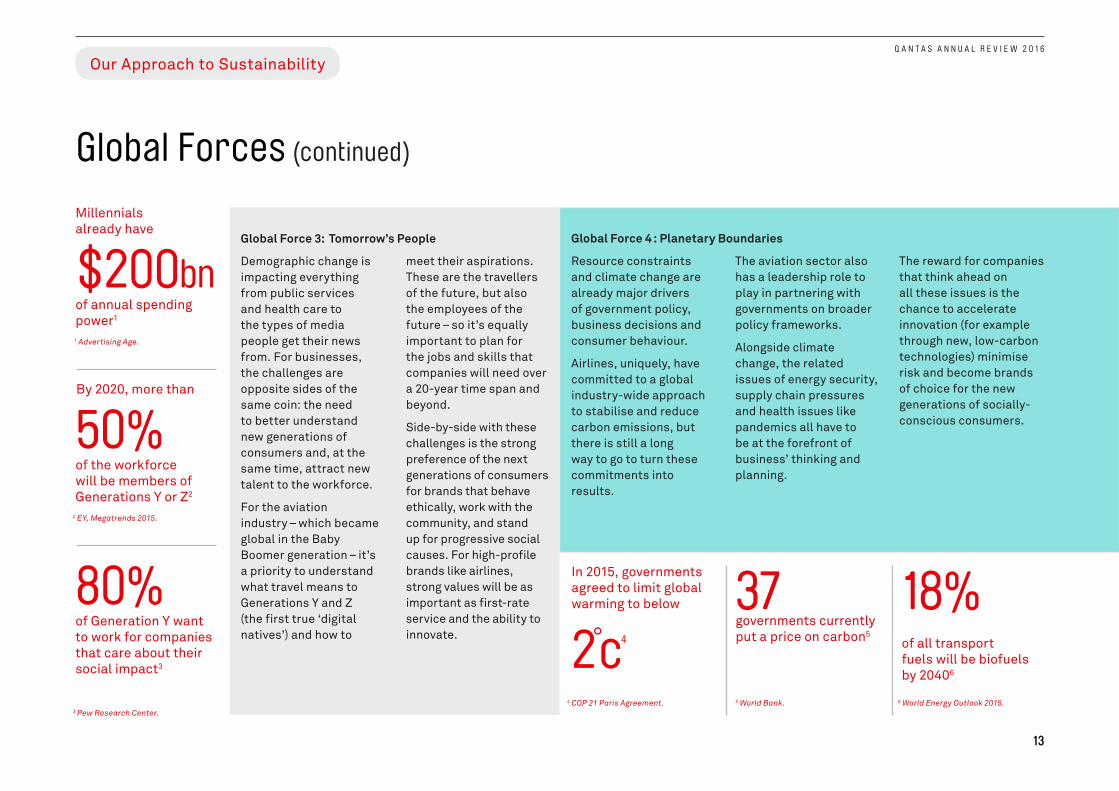
Global Force 3: Tomorrow’s People
Demographic change is impacting everything from public services and health care to the types of media people get their news from. For businesses, the challenges are opposite sides of the same coin: the need to better understand new generations of consumers and, at the same time, attract new talent to the workforce.
For the aviation industry – which became global in the Baby Boomer generation – it’s a priority to understand what travel means to Generations Y and Z (the first true ‘digital natives’) and how to
meet their aspirations. These are the travellers of the future, but also the employees of the future – so it’s equally important to plan for the jobs and skills that companies will need over a 20-year time span and beyond.
Side-by-side with these challenges is the strong preference of the next generations of consumers for brands that behave ethically, work with the community, and stand up for progressive social causes. For high-profile brands like airlines, strong values will be as important as first-rate service and the ability to innovate.
Global Force 4 : Planetary Boundaries
Resource constraints and climate change are already major drivers of government policy, business decisions and consumer behaviour.
Airlines, uniquely, have committed to a global industry-wide approach to stabilise and reduce carbon emissions, but there is still a long way to go to turn these commitments into results.
The aviation sector also has a leadership role to play in partnering with governments on broader policy frameworks.
Alongside climate change, the related issues of energy security, supply chain pressures and health issues like pandemics all have to be at the forefront of business’ thinking and planning.
The reward for companies that think ahead on all these issues is the chance to accelerate innovation (for example through new, low-carbon technologies) minimise risk and become brands of choice for the new generations of socially-conscious consumers.
$200bnof annual spending power1
50%of the workforce will be members of Generations Y or Z2
80%of Generation Y want to work for companies that care about their social impact3
In 2015, governments agreed to limit global warming to below
2°c4
18% of all transport fuels will be biofuels by 20406
Our Approach to Sustainability
Millennials already have
By 2020, more than
1 Advertising Age.
4 COP 21 Paris Agreement. 5 World Bank. 6 World Energy Outlook 2015.
2 EY, Megatrends 2015.
3 Pew Research Center.
37 governments currently put a price on carbon5
Q A N T A S A N N U A L R E V I E W 2 0 1 6
13

Clear Strategic Priorities
The Qantas Group is a portfolio of businesses based in our strong Australian home market, with global reach and deep customer knowledge and relationships.
Across Qantas and Jetstar, we serve every part of the travel market, from price-sensitive to business travellers. We’re growing with boom markets in Asia, and we’re pursuing diversification and growth with our innovative Qantas Loyalty businesses.
By investing in customer service and the Qantas and Jetstar brands, we’re extending our unique competitive advantages in a changing global market. And by harnessing the potential of big data and digital, we’re finding smarter, more efficient ways to work.
Underpinning all this is an unwavering commitment to safety and security, a focus on people, culture and leadership, and responsible action on energy, emissions and the supply chain.
These are the strategic priorities that guide us in shaping a strong, sustainable future for our shareholders, our customers, and our employees. They reflect the Group’s material issues today and position us to respond effectively to the global forces impacting our environment.
Maximising Our Leading
Domestic Position
Resilient & Sustainable
Qantas International
Aligning Qantas &
Jetstar with Asia’s growth
Safety & Security as First Priority
Diversification & Growth at
Qantas Loyalty
Investing in Customer & Brand
Harnessing Data & Digital
Focus on People, Culture & Leadership
Responsible Action on Energy, Emissions & Supply Chain
Q A N T A S A N N U A L R E V I E W 2 0 1 6
14

The safety and security of our customers and our people is our first priority, underpinning the trust of our customers and stakeholders, the health and wellbeing of our workforce, and the way we operate. We take a vigilant, proactive and systematic approach to protect the Qantas Group against a range of risks and strive for continuous improvement in our safety and security practices and performance
Measures of performance: workplace health and safety (WHS) metrics
Governance
Safety and security performance and risks are monitored and reported at all levels of the Qantas Group – from Board-level oversight by the Committee for Health, Environment, Safety and Security (CHESS) through to our business unit safety committees. Our governance structure allows safety and security related information to flow freely throughout the organisation, ensuring that our risks are openly discussed and best practice shared across our businesses.
Systematic Risk Management
Qantas was one of the first airlines to introduce an integrated Safety Management System in the 1990s, and we continue to evolve it. Both the International Civil Aviation Organisation (ICAO) and national safety regulators set out the requirements for airline safety management systems, and the Qantas Group builds on those requirements with our own, stringent internal standards and management system methodology.
Qantas applies this systematic approach to all risk disciplines, not just aviation safety. We integrate aviation safety, WHS, aviation and cyber security, environment and business resilience, learning from collaboration and shared experiences to make the system better and stronger.
Our people play an important part in ensuring our systems continue to identify risksOur people play an important part in ensuring our systems continue to identify risks, and that we are well-resourced to address them. We maintain an ‘informed culture’ of safety and security, where every employee and contractor is aware of risks to the business and their responsibility to manage those risks, and we encourage employees to highlight actual or potential concerns.
Industry Context
Aviation is the safest form of travel, with one major accident for every 3.1 million flights1. However, every safety incident raises lessons and reminds the industry of the importance of collaboration throughout the sector to maintain those high standards.
The Group has strong relationships with global, national, and state-based regulators, as well as industry bodies like the International Air Transport Association (IATA). Qantas is a member of the IATA Safety Group, the oneworld Safety Group and the Flight Safety Foundation. We are also a member of the IATA Security Group and oneworld Security Group.
The Group has played an active role in the ICAO Normal Aircraft Tracking Implementation Initiative. Following recent industry accidents, this initiative is charged with developing guidance material for state regulators which will require airlines to implement aircraft tracking mechanisms, both in normal operations and in distress scenarios.
Safety and Security as First Priority
Clear Strategic Priorities
1 IATA.
Q A N T A S A N N U A L R E V I E W 2 0 1 6
15

Safety and Security as First Priority (continued)
Clear Strategic Priorities
Business Resilience & Integrity
In an environment of evolving security threats, our strategy is based on rigorous, predictive threat and risk analysis, and designed to build a strong and resilient business well-prepared to respond in the event of a crisis. A number of international bodies – including IATA, the Association of Asia Pacific Airlines (AAPA), and ICAO – have recognised Qantas as an industry leader in this area.
From a security perspective, areas of particular focus in 2015/16 included working with governments and the industry on aviation’s response to overflight risks.
Qantas is also involved in regional capacity-building initiatives in collaboration with the Australian Office of Transport Security and industry associations, intended to ensure sustainable and efficient aviation security in the Asia-Pacific region. A partnership model between Asia-Pacific airlines, national regulators and relevant airport authorities shares the responsibilities of heightened security frameworks. The program has seen improved security outcomes in a number of South-East Asian destinations.
At home, Qantas continues to advance the Group’s corruption control framework, including through program of work supported by the Corporate Business Integrity Council. The council , initiated by Qantas, is made up of ethics and compliance practitioners from leading Australian companies across a range of business sectors. It meets three times a year to discuss issues relating to corruption control.
Q A N T A S A N N U A L R E V I E W 2 0 1 6
16

Aviation Safety
The Group is committed to remaining at the forefront of aviation safety management. We continue to invest in our people, through training and development, and our assets to ensure that operations remain safe.
In 2015/16, this included:
> Ongoing internal evaluation of our systems and processes, including assessment against industry standards such as the IATA Operational Safety Audit standards, and investment in our industry-leading Line Operations Safety Audit program across flight, cabin and ground operations;
> Continued investment in the ongoing training of our pilots to ensure they are proficient in policy and procedures, and can effectively manage threats and errors in our operating environment;
> Improved use of flight data analysis for the routine monitoring of flight safety and the early identification of risks and issues;
> Investment in personal electronic devices for pilots, ramp staff, cabin crew and engineers to ensure that operating procedures and information is current and readily available, and to improve the reliability of operational processes such as aircraft loading; and
> Continued review and assessment of aircraft systems and technology to ensure that, where appropriate, our fleet is equipped with the latest safety technology.
Workplace Health & Safety
Safety in the workplace was a key area of focus for the Group in 2015/16, after a disappointing performance in 2014/15. There was a significant improvement during the year, reflecting a renewed focus on injury prevention and injury management. We are implementing initiatives across the Group to ensure that this year’s positive performance continues to improve.
These include:
> Establishing effective processes to manage injuries expeditiously, ensuring our people get the most appropriate treatment and allowing for effective, timely recovery;
> Evaluating and redesigning equipment to prevent workplace injuries and engaging physiotherapists and other experts to help identify critical risk areas and solutions;
> Engaging our people in solution design to ensure that our injury prevention strategies are relevant, practical and effective;
> Providing our frontline leaders with the right knowledge and resources to shape a strong safety culture; and
> Targeted initiatives to ensure our people remain safe when carrying out tasks with inherent risks.
Safety and Security as First Priority (continued)
Clear Strategic Priorities
5
10
15
20
25
30
35
40
FY2016FY2015FY2014FY2013FY2012FY2011
People Safety Performance Trend – 5 year
1 TRIFR: Lost time injuries per million hours worked. 2 LWCFR: Total number of injuries or illnesses during work hours (1 July to 30 June) with an accepted workers’ compensation claim for Australian-based personnel, or
equivalent in other jurisdictions, which resulted in total incapacity, per million hours worked.
Total Recordable Injury Frequency Rate1 (TRIFR)
Lost Work Case Frequency Rate2 (LWCFR)
Q A N T A S A N N U A L R E V I E W 2 0 1 6
17

Maximising Our Domestic Position
Clear Strategic Priorities
Premium business and leisure travel segment 11.4 million frequent flyers Price sensitive segment
Q A N T A S A N N U A L R E V I E W 2 0 1 6
18
The Group’s domestic business is the bedrock of our strategy. Qantas serves the full-service, business and premium leisure travel market, while Jetstar serves price-sensitive customers.
Our strategic focus in 2015/16 was navigating the ongoing economic transition in Australia, with regular joint reviews of market conditions feeding into decisions on routes and capacity, and growing the Group’s margin advantage over our main competitors.
Since the mining investment boom peaked in 2011, travel demand has been tapering in mining-intensive markets – like Western Australia and parts of
Queensland – but stronger in other markets, including east coast business and tourism routes. The 2016 federal election coincided with a softening in demand across the domestic market, and the Group responded by reducing capacity.
However, the fundamentals of the domestic market remain strong, tourism is growing, and the Group’s advantages in terms of brand strength, network scale and customer service mean we are well-placed to maximise returns in all market conditions.
Our strong domestic business is the main source of the Group’s earnings and frequent flyer base. The Qantas and Jetstar dual brand strategy and leading market position enables us to hold an earnings share above our capacity share, providing greater resilience in the Group’s earnings profile.
Measures of performance: underlying EBIT in excess of capacity share, domestic brand
preference, on-time performance

Resilient & Sustainable Qantas International
Growing trans-Pacific market with world’s largest
airline; new Qantas San Francisco service, AA to Sydney and Auckland for
enhanced network.
Unrivalled network offering to Europe, Middle East, North Africa. De-risked
Qantas’ exposure to Europe.
Long-term growth prospects into China benefitting from influx of inbound Chinese
tourists to Australia.
Clear Strategic PrioritiesQ A N T A S A N N U A L R E V I E W 2 0 1 6
19
We have increased Qantas International’s aircraft utilisation by 20 per cent since 2011/12. As a result, Qantas International has been able to grow efficiently, without significant new capital investment, and with a clear focus on meeting growing demand for business and premium leisure travel in our Asia-Pacific markets, while maintaining a presence in other global regions.
Our growing global network is extended by strategic alliances.
In 2015/16 we received regulatory approval for a deeper partnership with China Eastern, as a foundation for long-term growth into China, and significantly expanded our joint network with American Airlines1.
These partnerships give us the opportunity to lead the way in meeting outbound and inbound demand in the world’s biggest aviation markets, working jointly with each partner on commercial planning, sales and service.
Looking to 2017, Qantas International is preparing for a new era with the arrival of the Boeing 787-9 Dreamliner, which will replace older Boeing 747s, open up new route possibilities, and significantly improve the fuel-efficiency of our international operations.
Qantas International gives our customers a global network, linked to our domestic and regional networks, and serves Australia’s most important business travel markets. With a restructured cost base, network and customer offering, and cornerstone alliance partners, Qantas International is now a fit and competitive business that can generate sustainable returns.
Measures of performance: underlying EBIT,
operational Net Promoter Score (NPS)
1 American Airlines partnership subject to regulatory approval.
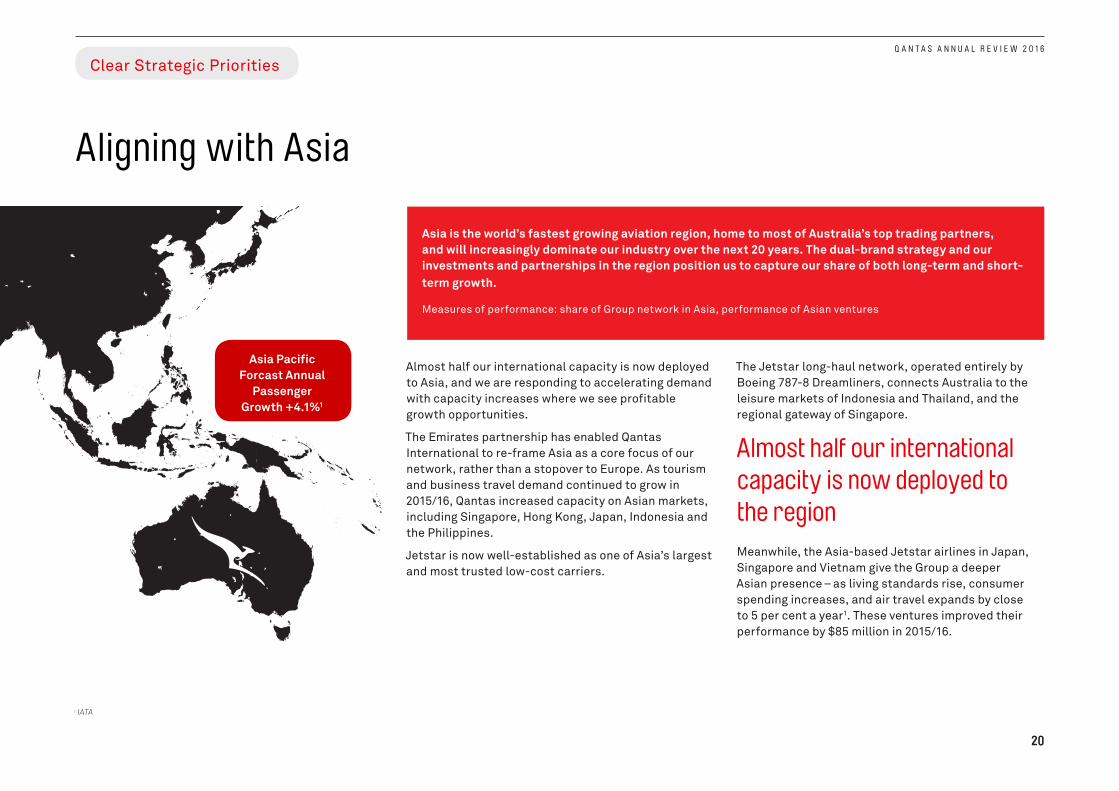
Asia is the world’s fastest growing aviation region, home to most of Australia’s top trading partners, and will increasingly dominate our industry over the next 20 years. The dual-brand strategy and our investments and partnerships in the region position us to capture our share of both long-term and short-term growth.
Measures of performance: share of Group network in Asia, performance of Asian ventures
Aligning with Asia
Clear Strategic Priorities
1 IATA
Q A N T A S A N N U A L R E V I E W 2 0 1 6
20
Almost half our international capacity is now deployed to Asia, and we are responding to accelerating demand with capacity increases where we see profitable growth opportunities.
The Emirates partnership has enabled Qantas International to re-frame Asia as a core focus of our network, rather than a stopover to Europe. As tourism and business travel demand continued to grow in 2015/16, Qantas increased capacity on Asian markets, including Singapore, Hong Kong, Japan, Indonesia and the Philippines.
Jetstar is now well-established as one of Asia’s largest and most trusted low-cost carriers.
The Jetstar long-haul network, operated entirely by Boeing 787-8 Dreamliners, connects Australia to the leisure markets of Indonesia and Thailand, and the regional gateway of Singapore.
Almost half our international capacity is now deployed to the regionMeanwhile, the Asia-based Jetstar airlines in Japan, Singapore and Vietnam give the Group a deeper Asian presence – as living standards rise, consumer spending increases, and air travel expands by close to 5 per cent a year1. These ventures improved their performance by $85 million in 2015/16.
Asia Pacific Forcast Annual
Passenger Growth +4.1%1

Diversification & Growth at Qantas Loyalty
Clear Strategic PrioritiesQ A N T A S A N N U A L R E V I E W 2 0 1 6
21
Loyalty’s evolution since the Global Financial Crisis has come in three stages:
1. Strengthening the core consumer Frequent Flyer program with new partners and more ways to reward Qantas customers;
2. Expanding with adjacent ventures that complement the Frequent Flyer program and respond to customers’ needs, including Qantas Cash (a travel money card), Qantas Aquire (an SME loyalty program) and interest-based clubs like Qantas EpiQure (food and wine) and Qantas Golf; and
3. Launching data-led new brands into sectors where Qantas can disrupt and grow.
This third phase began with Red Planet, a media analytics and research services agency that helps its clients target digital advertising. It continued in 2015/16 with Qantas Assure, a partnership with nib, offering health insurance services and allowing members to be rewarded with Qantas points for being active.
The Loyalty business is developing a pipeline of future growth plays to build on these ventures, and its sophisticated data analysis and strategic capabilities will be vital to the Group.
Qantas Loyalty sits at the heart of the Group’s long-term competitive advantage, reinforcing customer loyalty at the same time as providing earnings diversification. Its growing, non-cyclical earnings provide a buffer against more cyclical segments in the Group portfolio, while customer insights and data are informing new ventures that now account for 44 per cent of its earnings growth.
Measures of performance: underlying EBIT, new ventures’ share of earnings growth

Head of Customer Product Service and Development, Phil Capps
Investing in Customer & Brand
Clear Strategic Priorities
The fundamentals of great customer service are well-trained, committed people; a young, reliable and comfortable fleet; world-class domestic and international lounges across multiple tiers; and intelligent terminal designs that allow customers to check in, drop offer their bags and proceed to their flight in one seamless process.
We invest in these fundamentals – and service training for 24,000 frontline employees – because we know they’re the keys to our reputation as a premium brand.
The upgrade of Qantas’ A330 and domestic Boeing 737-800 interiors – over 100 aircraft in total – will be complete by the end of 2016. By early 2017 we’ll also have completed the upgrade of our trans-Tasman B737-800 fleet, giving us the best-in-class product in medium-haul and short-haul markets.
During 2015/16, we announced an investment in a new international lounge at London Heathrow, adding
to the new locations we’ve opened in Darwin, Perth, Singapore, Hong Kong and Los Angeles over recent years. We also initiated builds on three new lounges in Brisbane: an international lounge, domestic business lounge and Qantas Club.
We’re stepping up investment in new technology to give our people better tools and our customers more control of their journey, from SMS check-in to mobile apps, meal pre-selection and free newspaper and magazine downloads – with inflight wi-fi as the next stage of the journey.
In late 2016, we’ll commence a wi-fi technology trial with US company ViaSat, followed by a full roll-out to our domestic fleet during 2017. Our intention is to extend the service to our regional and international fleets. Our domestic wi-fi service will be up 10 times faster than the industry standard, allowing live streaming of sports and entertainment on board.
Qantas Group Brand Health, 2015/16
> Qantas Domestic holds a 32 point lead in brand preference compared with its competitor, and a 17 point lead in operational NPS.
> Jetstar Domestic holds an 8 point lead in brand preference compared with its major competitor.
> Qantas International is the preferred choice for 34% of international travellers, 16 points ahead of the second-choice airline, and its operational NPS is at record levels.
Q A N T A S A N N U A L R E V I E W 2 0 1 6
22
The Qantas Group’s goal is to remain first choice for customers in every market we serve. World-class service, product and technology underpin Qantas’ brand and revenue premium, earn and strengthen the loyalty of our customers, and give our people the tools they need to perform at their best. The strength of the Qantas brand as national carrier and our broader role in the Australian community is what sets us apart from any other airline serving Australia.
Measures of performance: operational Net Promoter Score (NPS), brand health metrics, community investment
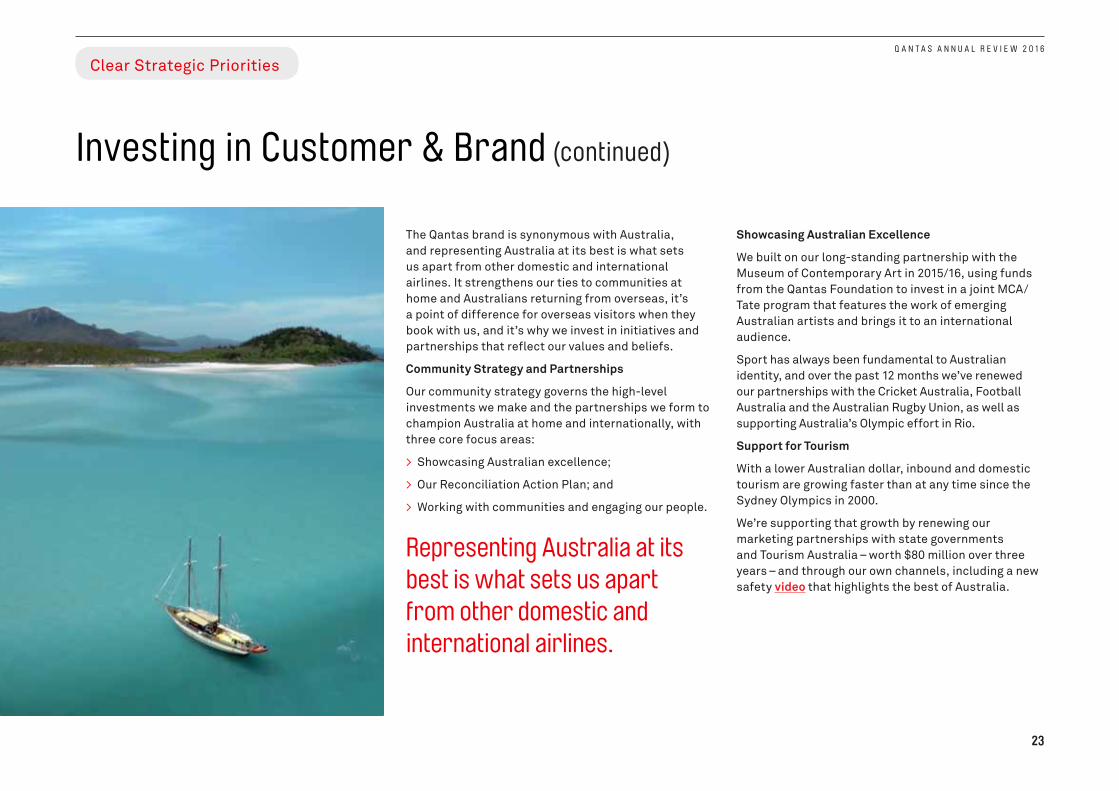
The Qantas brand is synonymous with Australia, and representing Australia at its best is what sets us apart from other domestic and international airlines. It strengthens our ties to communities at home and Australians returning from overseas, it’s a point of difference for overseas visitors when they book with us, and it’s why we invest in initiatives and partnerships that reflect our values and beliefs.
Community Strategy and Partnerships
Our community strategy governs the high-level investments we make and the partnerships we form to champion Australia at home and internationally, with three core focus areas:
> Showcasing Australian excellence;
> Our Reconciliation Action Plan; and
> Working with communities and engaging our people.
Showcasing Australian Excellence
We built on our long-standing partnership with the Museum of Contemporary Art in 2015/16, using funds from the Qantas Foundation to invest in a joint MCA/Tate program that features the work of emerging Australian artists and brings it to an international audience.
Sport has always been fundamental to Australian identity, and over the past 12 months we’ve renewed our partnerships with the Cricket Australia, Football Australia and the Australian Rugby Union, as well as supporting Australia’s Olympic effort in Rio.
Support for Tourism
With a lower Australian dollar, inbound and domestic tourism are growing faster than at any time since the Sydney Olympics in 2000.
We’re supporting that growth by renewing our marketing partnerships with state governments and Tourism Australia – worth $80 million over three years – and through our own channels, including a new safety video that highlights the best of Australia.
Investing in Customer & Brand (continued)
Clear Strategic Priorities
Representing Australia at its best is what sets us apart from other domestic and international airlines.
Q A N T A S A N N U A L R E V I E W 2 0 1 6
23

Investing in Customer & Brand (continued)
Reconciliation Action Plan
Since 2007, our Reconciliation Action Plan (RAP) has shaped our commitment to extend economic opportunity for Aboriginal & Torres Strait Islander people, build Indigenous supply chains and tell the stories of the First Australians.
Our 2015 RAP was accredited to Elevate level, meaning we are a leader in corporate Australia, and holds us to firm targets:
> To lift our proportion of Indigenous employees from 1.2 per cent to 1.8 per cent by 2018;
> To grow our spend with Indigenous suppliers to $1.75 million over the same period; and
> To create more than 200 internships for young Aboriginal & Torres Strait Islander people over the next 10 years, through partnership with Career Trackers.
In 2015/16 we made a new investment in the Indigenous Marathon Project’s ‘Frontrunners’ project, which aims to develop future Indigenous community leaders.
Working with Communities and Engaging Our People
Qantas and Jetstar work with partners to make a positive impact on the community and extend opportunity. For Qantas, these partners include Make-a-Wish-Australia, the National Australia Day Council, Sydney Gay & Lesbian Mardi Gras and Unicef Australia. Qantas passengers have raised over $30 million for Unicef through the Change for Good Initiative.
Jetstar’s community initiatives include Star Kids, which has raised more than $7 million for World Vision, and Flying Start, which offers grants of up to $30,000 to charitable initiatives.
Many of our employees also donate their time and skills to good causes. We’re in the process of finalising plans for a new program that will see Qantas support and engage employees in contributing to charitable causes that reflect our community strategy.
Our 2015 RAP was accredited to Elevate level, meaning we are a leader in corporate Australia
Q A N T A S A N N U A L R E V I E W 2 0 1 6
24

Harnessing Data & Digital
Clear Strategic Priorities
The ability to analyse and harness big data at a strategic, tactical and operational level is essential for any business yet still a relatively untapped resource in aviation. Digital tools help translate data into personalised service for our customers and smarter ways of working behind the scenes. Increasingly, data and digital are providing new opportunities to diversify earnings.
Strategic Network Decisions
Determining where Qantas and Jetstar fly is fundamental to our dual-brand strategy, and requires sophisticated analysis of market demand and capacity, competitive positioning, and broader implications for our network and financial performance.
Through data-led customer segmentation, we can gain a clear picture of what routes are best-suited to Qantas, which are best served by Jetstar, and which can support both airlines. And our data analytics ability means we can constantly review a wide range of data to make capacity adjustments swiftly as required. This capability has been vital in navigating the Group through the economic transition in Australia, which has seen demand decline in resources-reliant markets and grow in other markets.
Our customer insights are a key competitive advantage
Flying behaviour of our customers
Frequent Flyer profiles and behaviour
Customer Net Promoter Score and feedback
50m+ passengers annually across Group
Customer segmentation
11.4m members
Web, mobile and social media interactions
Panel of ~25k Frequent Flyers can record NPS each time they fly
Rich history of data
Market-wide segmentation insights
2.5m+ visits to qantas.com/week
3.7m+ visits to Jetstar website/week
29 years of historical data
Q A N T A S A N N U A L R E V I E W 2 0 1 6
25

Harnessing Data & Digital (continued)
Clear Strategic Priorities
Operational Innovation
Big data is also helping Qantas manage operational disruptions.
Our new schedule recovery system, Compass, automates the analysis of operational and passenger information to determine priority take-offs and landings, consolidate flights, allocate aircraft and, most importantly, communicate with customers.
Digital Service
The combination of customer knowledge and digital tools means we can provide a much more personalised and responsive service and innovation for our customers. This ranges from web-chat on Qantas.com to SMS automatic check-in and our mobile travel companion app, giving customers real-time information on their flight, to the customised app our frontline people use to access passenger information and fix problems.
In 2015/16, we re-platformed and enhanced Qantas and Jetstar’s websites and mobile apps, resulting in more personalised shopping options and information, and our social media customer service channels now operate 24/7.
Capability & Security
Following our sucessful acquisition of the actuarial business Taylor Fry in 2014/15, we took a strategic stake in data-exchange platform Data Republic, as well as continuing to invest in analytics skills and capabilities across our workforce.
We recognise that we have a responsibility to ensure that all the data we use is managed securely and sensitively, and we are part of private sector efforts to ensure that robust, shared data governance standards are in place in Australia – in addition to our internal cyber-security systems.
Case studyDuring severe storms in Sydney in June 2016, data-led schedule recovery meant Qantas had to cancel just 3.4 per cent of flights across the weekend.
“It put us in the best position to manage the disruption to our operations over the weekend and meant our customer contact team could notify a large number of our customers before they were even on their way to the airport,” said Paul Fraser, Head of Qantas’ Integrated Operations Centre.
Q A N T A S A N N U A L R E V I E W 2 0 1 6
26

Our people strategy has been consistent since 2009, focusing on:
> Engagement and culture;
> Managing change; and
> Leadership capability and talent development.
Focus on People, Culture & Leadership
Clear Strategic Priorities
Engagement and Culture
The Qantas culture is framed by our five Group beliefs:
> Everyone has the right to return home safely;
> Customers determine our success;
> Being a fit, agile and diverse organisation drives innovation and simplicity;
> Working together in an inclusive manner always delivers the best Group outcome; and
> Each employee deserves respect, trust and good leadership.
These beliefs anchor our priorities and initiatives, including investment in training, effective communication, rewards and recognition, and a commitment to diversity and inclusion.
We were proud to see record engagement scores in our 2016 employee survey – and, more importantly, we are using the insights from the survey to find areas where we can improve our business and culture.
Engagement Survey – Qantas Group Enagagement Score History1
Eng
agem
ent
Sco
re
2012 2013 2015 2016
80%
78%
76%
74%
72%
70%
58%
56%
54%
68%
75% 75%79%
1 Engagement survey completed by Willis Towers Watson. Survey not carried out in 2014.
Q A N T A S A N N U A L R E V I E W 2 0 1 6
27
A highly skilled, engaged workforce is our greatest asset as we deliver our strategy, foster innovation, and navigate through change. Our people strategy aims to build a diverse, inclusive and resilient culture to maximise engagement and performance, and remain an employer of choice in Australia. Strong employee relations are the foundation for constructive industrial relations, minimising risk to operational stability, brand reputation and future earnings.
Measures of performance: WHS measures, employee engagement, retention and turnover

Focus on People, Culture & Leadership (continued)
Clear Strategic Priorities
Diversity and Inclusion
We value diversity of thought and experience and we believe that an inclusive and collaborative culture contributes to our success. Our diversity strategy is focused on mitigating unconscious bias, improving access to flexibility, recruitment and talent programs and dedicated leadership development.
The Board set a target that 35 per cent of senior management positions be held by women by 30 June 2018; at 30 June 2016 women held 34 per cent of these roles.
Thirty per cent of our Directors are women, and the overall percentage of women employees across the Group is 41.7 per cent.
Percentage of women on Qantas Board:
30%Percentage of women in
senior management roles:
34%
Recruitment
The Group’s turnaround, Dreamliner acquisition and pursuit of targeted growth have created the platform to recruit and refresh our talent pool. In 2015/16, we announced a major pilot recruitment drive with 170 roles available to new candidates and promotion opportunities for existing pilots.
We also continued to invest in the next generation of aviation employees through our corporate graduate and engineering apprenticeship program, and maintain a strong, attractive brand in the market for general recruitment.
We were proud to be named one of Australia’s most sought-after employers by LinkedIn.
Leadership Capability and Talent Development
Growing the future senior leaders of the company is a Group priority. Leadership, talent and succession planning is driven by our executive-led Talent and Leadership Advisory Group. A dedicated AOC Talent Advisory Group identifies future operational leaders for our critical regulatory positions.
Leadership frameworks focus on depth as well as breadth of talent. The Group’s leadership development programs extends beyond the most senior executive levels to include 400 senior leaders, 1,000 people leaders and 3000-4000 front-line leaders, with training and programs and tools in place for each cohort.
Gender balance in graduate program:
61:39Female Male
Q A N T A S A N N U A L R E V I E W 2 0 1 6
28

In recognition of their outstanding performance, we have paid a special cash bonus to non-management employees for two consecutive years. In total, we have set aside more than $160 million for employees whose EBA includes (or will include) the 18-month pay freeze that formed part of our transformation program.
Managing Change
The Qantas Transformation program has involved extensive restructuring of the Group’s network, fleet of aircraft, airport and engineering infrastructure, approach to customer service, and corporate offices. These changes have strengthened our business and created new opportunities for our people, but they have also required hard decisions on jobs, with 5,000 redundancies in total.
We prioritised transparent communication and leadership by line managers in working through these changes, with the majority of redundancies completed within the first 18 months of the program and career transition centres helping employees find their next job.
Since February 2014 Qantas and its employees have agreed 30 enterprise agreements that include the 18-month wage freeze, including 12 in 2015/16. Five agreements will open for negotiation in 2016/17.
Focus on People, Culture & Leadership (continued)
Clear Strategic Priorities
Investment in Training
Engaging our people behind shared goals is crucial to the success of our transformation, and our training programs have increasingly focused on development and cultural change in addition to our robust safety, regulatory and policy training frameworks.
Both Qantas and Jetstar have introduced new engagement and culture-focused training programs – by the end of financial year 2017, more than 21,000 employees will have completed this training.
Both airlines also have extensive service training programs focusing on the principles of mindset and language to underpin empathetic service. Qantas’ program has trained 7,000 of a total 8,600 frontline employees, while Jetstar’s program has trained 1,000 employees to date, with a further 2,500 to follow in 2016/17.
Rewarding Employees
Reward and recognition at Qantas is underpinned by an easy-to-use system powered by Accumulate – a Qantas Loyalty-owned system that allows employees to nominate each other and earn points, which they can redeem through an online store.
Jetstar’s recognition and reward program, ‘Bravo’, is designed to give people the opportunity to recognise and celebrate colleagues who live and promote the Jetstar values. Like Qantas, the Jetstar program encourages immediate, everyday feedback and feeds into monthly, quarterly and annual awards.
Q A N T A S A N N U A L R E V I E W 2 0 1 6
29

Responsible Action on Energy, Emissions & Supply Chain
Aircraft and Fuel Efficiency
Through a centralised fuel optimisation team we’re working on 120 projects to hit our target of a 1.5 per cent average annual improvement in fuel-efficiency between now and 2020, from aircraft weight reduction to precise navigation technology.
While our absolute emissions and fuel consumption have increased, our fuel and emissions intensity has decreased – and we expect this trend to continue with further fleet renewal through to 2020.
In 2015/16, we realised $51 million in fuel efficiency benefits1, contributing to a 6.2 per cent improvement since 2009.
Energy Efficiency
As well minimising our emissions in the air, we’re taking big steps to reduce our electricity use, water consumption, and waste-to-landfill. These initiatives include the accelerated roll out of LED lights across our operations, improving behaviour to reduce energy and water use, and expanding our fleet of electric ground service equipment. All freight ground service equipment are now electric, and we aim to increase our passenger terminal fleet throughout Australia over the next year, delivering a significant reduction in diesel usage, particulate matter and carbon emissions.
Chief Technical Pilot, Alex Passerini
Clear Strategic Priorities
As a major consumer of fossil fuels, we recognise our responsibility to reduce our emissions, work with partners, governments and industry, and contribute to the global response to climate change and resource constraints. Our comprehensive environment strategy ensures that we play a positive role in the community while reducing cost and risk.
Measures of performance: fuel and energy use, carbon emissions and waste to landfill
Fleet age8.6 years (Qantas Group) 9.6 years (Qantas) 6.5 years (Jetstar)
Fuel efficiency
6.2% improvement on 2009 baseline
Total emissions
12,218,478 tonnes CO2e
Total fuel consumption
4,805,045,000 L
Electricity
10% reduction in 2015/16 19% reduction achieved against 2009 baseline compared with 2020 target of 35%
Water
10% increase in 2015/16 4% reduction achieved against 2009 baseline compared with 2020 target of 20%
Waste to landfill
9% increase in 2015/16 19% reduction achieved against 2009 baseline compared with 2020 target of 30%
Environmental Performance
1 Includes reduction in consumption from fuel efficiency and reduction in into-plane costs following transformation initiatives.
In 2015/16, we combined the Group’s core environment initiatives into a single flagship program – Qantas Future Planet.
Q A N T A S A N N U A L R E V I E W 2 0 1 6
30

Carbon Offseting
Since 2009, Qantas and Jetstar customers have voluntarily helped us offset almost 2.5 million tonnes of carbon emissions, with every contribution going to accredited projects in Australia and developing countries. It’s the largest program of its kind in the world: one of our passengers offsets a flight every 56 seconds, and we passed on over $1.3 million in passenger contributions during 2015/16.
In 2015/16, we took the knowledge and relationships we’ve gained through the consumer program and introduced an innovative carbon offset partnership program under the Qantas Future Planet brand.
We’re working with some of our biggest corporate customers and business partners to tailor their offsetting activities to their strategic priorities and develop new sustainable products and services, making sure they’re getting maximum value from their sustainability commitments, and that the benefits flow through to the projects themselves. Launch customers include Allens, EY and GE.
GE Fuel Analytics Partnership
Together with GE, we’re taking the big data we generate from our aircraft, analysing it using industry leading software technology, and getting a clear
picture of how aircraft across our fleet are performing second-by-second. This data enables us to further refine flight paths, take-offs and landings to make sure that our flights are as efficient as possible – a level of insight we didn’t have before.
Tesla Collaboration
Few companies are as synonymous with innovation as Tesla. In 2015/16, we became Tesla’s airline of choice in Australia and committed to delivering new benefits to our customers and collaborating to share knowledge on engineering and design – celebrating with a ‘race’ between a Tesla Model S and a Qantas B737-800.
Responsible Action on Energy, Emissions & Supply Chain (continued)
Clear Strategic Priorities
Qantas’ carbon offset program supports rainforest communities in Papua New Guinea. Qantas and Tesla are sharing knowledge on sustainability and design.
Q A N T A S A N N U A L R E V I E W 2 0 1 6
31

Responsible Action on Energy, Emissions & Supply Chain (continued)
Clear Strategic Priorities
Global Industry Leadership
In 2015/16, the International Civil Aviation Organisation (ICAO) agreed strict CO2 standards for future aircraft types, while governments are expected to formalise the MBM at an ICAO meeting in September – building on the agreement reached by industry under Qantas’ chairmanship of IATA in 2013. Qantas has been a key contributor to the technical design of the global framework and is working closely with the Australian government to inform the position it takes to global ICAO and UNFCCC forums.
Australian Policy Development
With over two thirds of our emissions derived from our international operations, we continue to support a global approach as the most appropriate way to manage airline emissions. However. we are committed to working with national and state governments on environment policy. That includes detailed consultation on the Australian Government’s Emissions Reduction Fund and Safeguard Mechanism.
A particular focus is on making the case for biofuels investment and incentives. Australia has great long-term potential in waste and biomass feedstocks, and we are sharing our insights with governments who see this as a potential growth industry of the future. In 2015/16, we advised Queensland Government on its ‘bio-futures’ strategy to accelerate the commercialisation of biofuels.
The Three Global Short, Medium and Long-term Goals
GOAL 1Pre-2020 ambition
1.5% average annual fuel efficiency improvement from 2009 to 2020
How is Qantas achieving this?
Fuel optimisation through new technology including fleet renewal, operational and infrastructure improvements.
Progress
Achieved 6.2% on 2009 baseline. Although currently behind linear projection of target at a Group level, we expect accelerated improvement prior to 2020 with the continued delivery of new aircraft.
GOAL 2In line with the next UNFCCC Commitment Period
Stabilise net aviation CO2 emissions levels through carbon neutral growth
How is Qantas achieving this?
In addition to our fuel efficiency initiatives we are working through ICAO and IATA on a global market-based measure (MBM) to regulate airline emissions from 2020 and help bridge the gap to carbon-neutral growth.
Progress
Decision on MBM expected at the ICAO Assembly in September 2016
GOAL 3On the 2°c pathway
Reduce aviation’s net CO2 emissions to 50% of 2005 levels by 2050
How is Qantas achieving this?
In addition to continuous fuel efficiency improvements, we will continue to invest in new aircraft technology and explore alternative fuels.1
Progress
Significant research efforts underway into biofuel opportunities as well as informing government policies.
1 Sustainable aviation fuel could reduce aviation emissions by 63%, but it relies on government incentives to get the supply chain up to commercial scale.
Q A N T A S A N N U A L R E V I E W 2 0 1 6
32

Responsible Action on Energy, Emissions & Supply Chain (continued)
Clear Strategic Priorities
Strategic Procurement
In 2015/16 we refined our procurement strategy to focus on creating value for the Group through:
> Insightful category management and agile sourcing;
> Tailored approaches to supplier management;
> Efficient and effective supplier transactions; and
> Suppliers as an extension of Qantas’ brand and reputation.
The Qantas Transformation program has increased the importance not just of cost-efficient procurement, but of a partnership approach with suppliers to make sure they understand and support our strategic objectives. During the year, Qantas implemented an integrated procure to pay process for indirect spend (Spend Aware). As well as providing better control over spend, Spend Aware will ensure more efficient transactions with suppliers and improved supplier management.
Case studiesWe’re finding new ways of creating sustainable products, directing funds from our carbon offset program to support the sustainable harvesting of Brazil nuts by Peruvian farmers. The initiative helps protect the Amazon rainforest, provide employment, and create a great snack that we serve on our flights. Closer to home, we’re making honey for our premium lounges from 10 beehives we’ve installed at our Sydney headquarters, raising awareness of sustainable local supply chains.
Our efficient, diverse and sustainable supply chain of 11,000 large and small companies is essential to every part of our business. We enforce stringent ethical standards through our procurement policies to minimise reputational risk. We also combine the Qantas Group’s large economic contribution in Australia with our brand values to make a positive social impact.
Measures of performance: Number of supplier audits, spend with Indigenous suppliers
Ethical Supply Chain
Our code of conduct requires that all suppliers are fully aware of their responsibilities to comply with Qantas’ non-negotiable business principles.
Qantas takes a proactive approach to identifying and addressing social risks in our supply chain and we commission third-party audits of suppliers where necessary. If we identify a material risk, we stop transacting with the supplier and closely monitor the mitigations they put in place.
We audit to recognised standards (such as SA8000) that align with the ILO Declaration on Fundamental Principles and Rights at Work and the UN Guiding Principles on Business and Human Rights, and we’re focused on supporting suppliers to remediate issues before they enter our supply chain. In 2015/16, we carried out 16 audits of new and existing suppliers.
Supplier Diversity
As with our own workforce, we recognise that a diverse supplier base is a business strength. We also recognise our ability to build scale and create jobs for our suppliers – especially small-to-medium enterprises.
Many suppliers rely on Qantas’ business to operate at scale, and we’re proud of the part we play in showcasing their products across our domestic and international networks. We spent $5.9 billion with Australia-based suppliers in 2015/16, making up 60 per cent of total procurement expenditure.
We have a particular focus on lifting our spend with Indigenous suppliers, as a founding member of Supply Nation. Our spend with Supply Nation suppliers in 2015/16 was $508,000, and we expect that figure to rise in 2016/17 as we work towards our target of $1.75 million by 2018.
Q A N T A S A N N U A L R E V I E W 2 0 1 6
33

Governance
We hold ourselves accountable for our performance and actions through strong governance frameworks overseen by the Qantas Board and the Group Management Committee. These include the Qantas Constitution, Board Committees, the Qantas Group Business Practices document, and a range of other policies.
> Qantas Group Corporate Governance Statement
> Qantas Group Business Practices Document
> Qantas Group Code of Conduct and Ethics
> Qantas Supplier Code of Conduct
Transparency
We’re committed to transparent disclosure of financial and non-financial metrics that are material to the Group, and our performance against targets, through ASX disclosures and our participation in sustainability indices.
> Qantas Investor Site
> Carbon Disclosure Project
Accountability
Qantas Group Beliefs
Every Qantas Group employee is guided by our Group beliefs – five principles that define what is important in every part of our business:
> Everyone has the right to return home safely;
> Customers determine our success;
> Being a fit, agile and diverse organisation drives innovation and simplicity;
> Working together in an inclusive manner always delivers the best Group outcome; and
> Each employee deserves respect, trust and good leadership.
Sustainability & Resilience Committee
The Sustainability and Resilience Committee (SRC) is made up of executive representatives from across the Group and is the main advisory body to the Group Management Committee on sustainability strategy and reporting.
The SRC carries our regular structured assessments to determine the Group’s material issues, and is also guided by ongoing consultation with stakeholders from across our value chain, including: advisers and investors; airline and industry peak bodies; aircraft and engine manufacturers; government agencies; non-government organisations; and employee and customer representatives.
The Group has worked with EY on sustainability strategy, Sustainalytics, Makinson Cowell and proxy advisers on sustainability benchmarking, and Harvard University on sustainability research.
Q A N T A S A N N U A L R E V I E W 2 0 1 6
34

Performance & Metrics
Unit 2015/16 2014/15 2013/14 Notes
Economic Integrity
Underlying PBT $M 1,532 975 -646 1
ROIC % 22.7 16.2 -1.5 2
Net Free Cash Flow $M 1,674 1,104 – 3
Optimal Capital Structure – FFO/Net Debt % 52 45 17 4
Optimal Capital Structure – Debt/Adjusted EBITDA x 2.5 3.0 5.1 5
Safety and Security
Total Recordable Injury Frequency Rate TRIFR 25 30.3 27.2 6
Lost Work Case Frequency Rate LWCFR 8.6 10 8.9 7
Duration Rate DR 56.9 60.3 49.2 8
Fatalities # 0 0 0
Scope includes Qantas Airways Limited and controlled entities, including Qantas International, Qantas Domestic, Qantas Link, Network Aviation, Jetstar International, Jetstar Domestic and Jetstar Asia unless stated otherwise.1 Underlying Profit Before Tax (PBT) is a non-statutory measure, and is the
primary reporting measure used by the Qantas Groups chief operating decision-making bodies, being the Chief Executive Officer (CEO), the Group Management Committee and the Board of Directors. for the purpose of assessing the performance of the Group. Underlying PBT is derived by adjusting Statutory PBT for the impacts of ineffectivenss and non-designated derivatives relating to other reporting periods and certain other items which are not included in Underlying PBT.
2 Return on Invested Capital (ROIC %) is a non-statutory measure and is the financial return measure of the Group. ROIC is calculated as Return on Invested Capital EBIT (ROIC EBIT) divided by Average Invested Capital. ROIC EBIT is derived by adjusting Underlying EBIT to exclude non-cancellable operating lease rentals and include notional depreciation for these aircraft to account for them as if they were owned aircraft. Invested Capital includes the net assets of the business other than cash, debt, other financial assets and liabilities, tax balances and includes the capitalised value of operating leased aircraft assets. Average Invested Capital is equal to the 12 month average of the monthly Invested Capital.
3 Net Free Cash Flow is a measure of financial performance calculated as operating cash flows net of investing cash flows.
4 Funds From Operations/net debt. Calculated using Standard & Poor’s (S&P) methodology.
5 Debt/Adjusted Earnings Before Interest, Tax, Depreciation and Amortisation. Calculated using Moody’s methodology.
6 Total Recordable Injury Frequency Rate (TRIFR): Lost time injuries per million hours worked. The total number of injuries or illnesses during work hours (1 July to 30 June) with an accepted workers’ compensation claim for Australian-based personnel, or equivalent in other jurisdictions, per million hours worked. Journey and slip port injuries are excluded from this calculation. This metric includes embedded contractors that work exclusively for the Qantas Group and perform work that is considered core business. When considering lost time, Qantas Group injury metrics are calculated using medically certified calendar days, including partial days, for which the injured worker is unable to fulfil the duties for which they are employed regardless of roster (partial days are counted as one full day). TRIFR has been restated for 2014/15 to reflect an improvement in methodology following anomalies identified in 2014/15 reporting, resulting in an overstatement of TRIFR and LWCFR by approximately one million hours worked (two percent of the total hours worked reported for 2014/15 across the Group). By correcting the hours worked, 2014/15 Qantas Group performance for TRIFR and LWCFR has slightly degraded from the metrics reported in August 2015.
7 Lost Work Case Frequency Rate (LWCFR) Described as the total number of injuries or illnesses during work hours (1 July to 30 June) with an accepted workers’ compensation claim for Australian-based personnel, or equivalent in other jurisdictions, which resulted in total incapacity, per million hours worked. Total incapacity is defined as any injury or illness that results in an injured
worker being unfit for work. Journey and slip port injuries are excluded from this calculation. This metric includes embedded contractors (as described above) and employees of wholly owned entities of the Qantas Group. When considering lost time, Qantas Group injury metrics are calculated using medically certified calendar days, including partial days, for which the injured worker is unable to fulfil the duties for which they are employed regardless of roster (partial days are counted as one full day). LWCFR has been restated for 2014/15 to reflect an improvement in methodology following anomalies identified in 2014/15 reporting, resulting in an overstatement of TRIFR and LWCFR by approximately one million hours worked (two percent of the total hours worked reported for 2014/15 across the Group). By correcting the hours worked, 2014/15 Qantas Group performance for TRIFR and LWCFR has slightly degraded from what was reported in August 2015.
8 Duration rate indicates the average number of lost days per injury/illness with an accepted workers’ compensation claim for Australian-based personnel, or equivalent in other jurisdictions, resulting in partial incapacity or total incapacity. Partial incapacity means any injury/illness that resulted in an injured/ill worker being fit for work but at a reduced capacity. When considering lost time, Qantas Group injury metrics are calculated using medically certified calendar days, including partial days, for which the injured worker is unable to fulfil the duties for which they are employed (partial days are counted as one full day). Journey and slip port injuries are excluded from this calculation. This metric includes embedded contractors and employees of wholly owned entities of the Qantas Group.
Q A N T A S A N N U A L R E V I E W 2 0 1 6
35

Performance & Metrics (continued)
Unit 2015/16 2014/15 2013/14 Notes
Customer and Brand
On-time Performance % 83.0 83.4 81.6 9
Brand Preference – Best Products and Services % 72 65 64 10
Domestic Operational NPS – Gap to Competitor Score 16.5 20.2 22.0 11
Total Number of Suppliers # 10,714 11,908 13,227
Total Supplier Spend $M 9,887 10,365 10,777 12
Australian Supplier Spend $M 5,949 6,281 6,624 13
Total Community Investment $M 6.8 3.3 4.6 14
Proportion of Aboriginal and Torres Strait Islander Investment % 33.6 22.5 15.0 15
Total UNICEF Donations Facilitated Through Change for Good Program $M 1.5 1.4 1.4 16
Total World Vision Donations Facilitated Through StarKids Program $M 2.6 1.6 1.2 17
Q A N T A S A N N U A L R E V I E W 2 0 1 6
36
9 On-time Performance as measured by the percentage of flights departing within 15 minutes of scheduled departure for Total Group operations including Qantas International, Qantas Domestic, Qantas Link, Jetstar International and Jetstar Domestic, including Jetstar Domestic New Zealand.
10 Brand Preference – Best Products and Services indicates percentage of customers who agree with the statement ‘Qantas is focused on providing the best products and services to its customers.’ Source: Brand Tracking Research (House of Brand Group).
11 Domestic Operational NPS – Average Qantas Domestic Gap to Competitor, based on internal Qantas reporting.
12 Total supplier spend excluding payments processed through IATA clearing account and direct bank deposits for the purposes of aircraft lease payments.
13 Australian Supplier Spend where supplier headquarters are located in Australia.
14 Total Qantas Community Partnerships investment excluding donations facilitated through other areas of the business and voluntary logistical support provided to the Australian Government in times of crisis.
15 Proportion of total community investment donated to benefit Aboriginal and Torres Strait Islander communities.
16 Total UNICEF donations facilitated through Qantas’ Change for Good program.
17 Total World Vision donations facilitated through Jetstar’s StarKids program.

Performance & Metrics (continued)
Unit 2015/16 2014/15 2013/14 Notes
People and Culture
Number of full-time equivalent employees # 29,204 28,622 30,860 18
Percentage of part-time employees % 17.0 16.8 16.9 19
Percentage of employees under a collective bargaining agreement % 80 – – 19
Percentage of women % 41.7 40.6 40.9 19
Percentage of women in senior positions % 34.0 31.6 32 19
Percentage of women Directors on the Qantas Board % 30.0 33.3 33.3 19
Number of women Directors on the Qantas Board # 3 3 3 19
Percentage of women recruited into the graduate program % 61.0 – 52.3 19
Percentage of temporary or casual employees % 9.9 7.5 7.3 19
Number of Indigenous Australian employees # 369 329 330
Q A N T A S A N N U A L R E V I E W 2 0 1 6
37
Employees by age group (permanent employees)
16-24 Years % 4.8 4.9 5.5 19
25-34 Years % 20.0 20.6 20.5 19
35-44 Years % 26.2 27.5 28.2 19
45-54 Years % 31.5 31.4 30.7 19
55-64 Years % 16.3 14.5 13.9 19
65 Years + % 1.2 1.1 1.2 19
Voluntary employee turnover % 4.4 4.7 4.6
Total employee turnover % 7.8 11.6 12.7
18 Total number of Full-Time-Equivalent employees of Qantas Group companies. Total number of Full-Time-Equivalent employees has been restated for 2013/14.
19 Composition of governance bodies and breakdown of employees per employee category according to gender, age group, minority group membership and other indicators of diversity is limited to total workforce of Qantas Group companies
broken down by gender, age group and indigenous employees as well as women in the following positions: Non-Executive Directors and Senior Management Positions. Gender diversity indicators are consistent with diversity policy and targets, measured as at 30 June 2016. Indigenous employees refer to team members who have identified as Aboriginal or Torres Strait Islander.
Due to the challenging operating environment and accelerated Qantas Transformation program no graduates were recruited during the 2014/15 reporting period. The Qantas Group commenced measurement of temporary or casual employees in the reporting year.

Performance & Metrics (continued)
Energy and Emissions
Average Aircraft Age – Scheduled Passenger Fleet Years 8.6 7.7 7.7 20
Aviation fuel consumption ‘000 Litres 4,805,045 4,635,760 4,738,057 21
Electricity (Australia) MWh 172,092 191,459 213,406 22
Natural Gas (Australia) GJ 229,630 316,198 246,166 22
Diesel (Australia) Litres 6.370,835 7,199,289 7,680,579 22
Fuel per 100 RTKs (Group efficiency) Litres 37.7 37.9 38.8 23
Water (Australia) ‘000 Litres 973,611 874,929 892,470 24
CO2e emissions – Scope 1 Tonnes 12,070,474 11,707,259 11,938,500 25
CO2e emissions – Scope 2 Tonnes 142,227 155,826 183,826 26
CO2e emissions – Total Tonnes 12,212,701 11,863,085 12,122,326 27
CO2e emissions – Domestic Tonnes 4,569,452 4,613,753 4,793,504 28
CO2e emissions – International Tonnes 7,643,249 7,249,332 7,328,822 29
CO2e per 100 RTKs (Group efficiency) Kilograms 96 97 101 30
Change in emissions (year on year) % 3.0 -2.1 -4.0 31
Direct waste to landfill (Australia) Tonnes 21,972 20,115 22,328 32
Unit 2015/16 2014/15 2013/14 Notes
20 Average Fleet Age – Scheduled Passenger Fleet is calculated by determining the average age of the Group’s scheduled passenger fleet based on manufacturing dates. Scope: The scheduled passenger fleet of the Qantas Group, including both owned and leased aircraft. The Qantas Group’s scheduled passenger fleet does not include dedicated freighters and Network Aviation fleet.
21 The total volume of aviation kerosene consumed by the Qantas Group’s flying businesses from 1 July to 30 June. Scope: Aviation fuel consumption includes Qantas, Jetstar, QantasLink, Network Aviation, Jetconnect and Qantas Freight, for both domestic and international operations. Aviation fuel consumption does not include consumption by Jetstar Asia or codeshare partners.
22 The total amount of electricity consumed as measured in megawatt hours (MWh), Natural Gas measured in gigajoules (GJ) and Diesel measured in litres (L) where separately billed to Qantas wholly owned entities within Australia for the period 1 July to 30 June.
23 Fuel per 100 Revenue Tonne Kilometres (RTK). RTK quantifies Group fuel efficiency, described as the amount of revenue generating payload carried, for the distance flown. Total number of tonnes of paying passenger, freight and mail carried, multiplied by the number of kilometres flown.
Scope: Fuel per 100 Revenue Tonne Kilometres (RTK) includes Qantas, Jetstar, QantasLink, Jetconnect, Network Aviation and Qantas Freight for both domestic and international operations.
24 Total municipal water supplies withdrawn at metred Australian locations, measured in kilolitres (‘000 L) where water is separately billed to Qantas wholly owned entities for the period 1 July to 30 June.
25 Direct greenhouse gas emissions (Scope 1) measured in tonnes. Scope 1 emissions include aviation fuel and aircraft engine oil from international and domestic operations as well as ground fuel (unleaded petrol and diesel) from airport operations in Australia. The Qantas Group applies the National Greenhouse Accounts (NGA) emissions factors and methodology for the calculation of CO2-e. Scope: All activities under the control of the Qantas Group.
26 Total indirect greenhouse gas emissions measured in tonnes. Scope 2 emissions include electricity use from Australian facilities. The Qantas Group applies the NGA emissions factors and methodology for the calculation of CO2-e. Scope: All activities under the control of the Qantas Group.
27 Total direct and indirect greenhouse gas emissions measured in tonnes. The Qantas Group applies the NGA emissions factors and methodology for the calculation of CO2-e. Scope: All activities under the control of the Qantas Group.
28 CO2-e emissions – Domestic: Total direct and indirect greenhouse gas emissions measured in tonnes. The Qantas Group applies the NGA emissions factors and metholody for the calculation of CO2-e with the exception of aviation fuel. Scope: Australian operations.
29 CO2-e emissions – International: Total direct and indirect greenhouse gas emissions measured in tonnes. The Qantas Group applies the NGA emissions factors and methodology for the calculation of CO2-e. Scope: International operations.
30 Greenhouse gas emissions intensity measured in kilograms of CO2-e per 100 revenue tonne kilometres (RTK) converted to CO2-e tonnes by the NGA emissions factors. Scope: All activities under the control of the Qantas Group.
31 Percentage change in total greenhouse gas emissions (CO2-e) compared with the previous financial year. Scope: All activities under the control of the Qantas Group.
32 Total waste generated measured in tonnes, where this waste is delivered from Qantas premises directly to a landfill site and where the Qantas Group is responsible for the waste removal and is separately billed to Qantas wholly owned entities by a waste service provider.
Q A N T A S A N N U A L R E V I E W 2 0 1 6
38

Key Downloads
Qantas Investor Page
Qantas Community Page
Qantas Environment Page
Qantas Newsroom
Links to other resources
© Qantas Airways Limited ABN 16 009 661 901
WSJC
VVTSVTBB
WBKK
WABB
ZISA
VYTFVVVV
500
500
500
450
H540
500
500
500
500
450
H540
New Horizons
Q A N TA S A N N U A L R E P O R T 2 0 16
Qantas Annual Reports
Q A N T A S A N N U A L R E V I E W 2 0 1 6
39