Embed Size (px)
Citation preview

QUARTERLY MOBILE INDEXQ4
2 0 1 8 & F U L L Y E A R L O O K B A C K

PubMatic’s Quarterly Mobile Index (QMI) report was created to provide both publishers and advertisers with key insights into the mobile advertising industry.
By analyzing over 12 trillion advertiser bids flowing each month through PubMatic’s platform, we can observe real-time developments in the mobile space that may allude to broader digital industry trends. We can then compare this information to other published data to further understand changes in the mobile landscape. We are committed to providing best-in-class mobile tools and services, and we believe that information sharing is crucial in aligning the digital industry towards best practices and, ultimately, growth in mobile advertising.
Note that directional data might not be comparable with prior reports.
ABOUT PUBMATIC’S QUARTERLY MOBILE INDEX

THROUGHOUT 2018, THE FOLLOWING FIVE KEY TRENDS EMERGED
In-app opportunities propel mobile into leadership position in digital video01
KEY TREND
In-app header biddingbeginning to take hold02
KEY TREND
Advertisers increasingly leveraged private marketplaces to improve in-app quality03
KEY TREND
In-app monetization thrived, while mobile web experienced greatest growth04
KEY TREND
Holiday shopping provided a huge boost to mobile ad spend globally05
KEY TREND
© 2 0 1 9 P U B M AT I C , I N C . A L L R I G H T S R E S E R V E D Q 4 2 0 1 8 Q U A R T E R LY M O B I L E I N D E X A N D A F U L L Y E A R L O O K B A C K / 1

WHAT DOES THIS MEAN FOR PUBLISHERS AND ADVERTISERS?
1 “‘We’ve reached critical mass’: Advertisers see more options to buy ads only from publishers that have adopted ads.txt,” Tim Peterson, Digiday, July 20182 “Day One: Chrome Switches On Its Ad Blocker,” Allison Schiff, AdExchanger, February 20183 “Mobile ad fraud continues to surge as scammers get smarter — with in-app fraud increasing by as much as 800% this year,” Tanya Dua, Business Insider, December 2018
The demand for quality has cleaned up the web, but in-app remains the next frontier.
Following strong mandates from brand advertisers to clean up the programmatic ecosystem, 2018 marked a year of tremendous strides. From the swift adoption of ads.txt to eradicate domain spoofing1 to web browsers blocking poor ad experiences,2 the changes for web inventory quality have been drastic, attracting more ad spend to the open exchange. However, Double Verify estimates that in-app ad fraud grew by as much as 800% YOY in 2018,3 and the issue was highlighted by high-profile schemes that were uncovered in Q4. This has driven many buyers towards private marketplaces (PMPs) as a safe channel for purchasing in-app traffic. It is imperative that the entire industry work together to address the quality concerns in-app in 2019.
1
© 2 0 1 9 P U B M AT I C , I N C . A L L R I G H T S R E S E R V E D Q 4 2 0 1 8 Q U A R T E R LY M O B I L E I N D E X A N D A F U L L Y E A R L O O K B A C K / 2

© 2 0 1 8 P U B M AT I C , I N C . A L L R I G H T S R E S E R V E D Q 3 2 0 1 8 Q U A R T E R LY M O B I L E I N D E X / 3© 2 0 1 8 P U B M AT I C , I N C . A L L R I G H T S R E S E R V E D Q 3 2 0 1 8 Q U A R T E R LY M O B I L E I N D E X / 3
4 “Global Ad Spending: The eMarketer Forecast for 2018,” Corey McNair, eMarketer, May 20185 “Increased Spending in Original Digital Video Programming and Mobile Video,” IAB, April 2018
It’s time for app developers to embrace the promise of programmatic.
Mobile was forecasted to account for two-thirds of worldwide digital ad spend in 2018.4 As brands shift budgets to apps, the format represents the majority of mobile spend on the PubMatic platform. Despite the growing programmatic opportunity, many app developers continue to employ inefficient monetization strategies, like the waterfall, that are deemed archaic for the web. Others are beginning to reap the benefits of innovative technologies like server-side (S2S) header bidding; in-app header bidding saw a more than 300X increase in impression volume YOY in 2018. By leveraging header bidding solutions from omni-channel SSPs, app developers can also gain access to the burgeoning in-app PMP market. Those that take advantage of these innovations will be well-positioned to attract programmatic brand spend.
2Mobile video opportunities rise as advertisers seek to engage captive audiences.
Marketers’ budgets are following consumer behavior, which is becoming increasingly mobile-first. Mobile video is experiencing massive growth as advertisers shift TV budgets to fund their digital video efforts,5 and made up nearly half of global digital video ad spend on the PubMatic platform in 2018. Buyers are increasingly attracted to in-stream video experiences, which are prevalent in in-app environments, and has propelled in-app video to account for over two-thirds of mobile video ad spend last year. Publishers and app developers looking to capitalize on this growing opportunity should focus on developing the unique content and quality controls that will attract these brand advertisers and explore emerging technologies like video header bidding as a way to maximize monetization.
3
© 2 0 1 9 P U B M AT I C , I N C . A L L R I G H T S R E S E R V E D Q 4 2 0 1 8 Q U A R T E R LY M O B I L E I N D E X A N D A F U L L Y E A R L O O K B A C K / 3

KEY TREND
01KEY TREND
IN-APP OPPORTUNITIES PROPEL MOBILE INTO LEADERSHIP POSITION IN DIGITAL VIDEONearly half of all video impressions were served on a mobile device in 2018 as advertisers and publishers alike sought to capitalize on the growing global mobile video viewership. Engaged in-app audiences resulted in the platform being a key driver of mobile video growth.
Q 4 2 0 1 8 Q U A R T E R LY M O B I L E I N D E X A N D A F U L L Y E A R L O O K B A C K / 4© 2 0 1 9 P U B M AT I C , I N C . A L L R I G H T S R E S E R V E D

MOBILE APPROACHES PARITY WITH DESKTOP FOR SHARE OF GLOBAL VIDEO AD SPENDMobile share of global video ad spend reached 47% in 2018, up from 17% in 2017. In Q4 2018, the biggest spend quarter of the year, mobile devices accounted for more than half of all video ad spend, with a share of 56%, up from 19% year prior.
D E S K T O P 201853%
M O B I L E 201847%
D E S K T O P 201783%
M O B I L E 201717%
© 2 0 1 9 P U B M AT I C , I N C . A L L R I G H T S R E S E R V E D Q 4 2 0 1 8 Q U A R T E R LY M O B I L E I N D E X A N D A F U L L Y E A R L O O K B A C K / 5

MOBILE VIDEO SERVED AS A GROWTH DRIVER ACROSS ALL REGIONS GLOBALLYAll markets globally experienced growth in mobile video ad spend in Q4 2018. APAC grew the most, with a near 10X growth rate. The Americas almost doubled mobile video ad spend. And EMEA grew 37%, marking a bounce back from the GDPR concerns that impacted ad spend in the region earlier in 2018.
AM
ERIC
AS
MOBILE VIDEO AD SPEND, YOY CHANGE, BY REGION
Q42017
Q42018
+96%Y O Y C H A N G E
EMEA
Q42017
Q42018
+37%Y O Y C H A N G E
APA
C
Q42017
Q42018
+996%Y O Y C H A N G E
© 2 0 1 9 P U B M AT I C , I N C . A L L R I G H T S R E S E R V E D Q 4 2 0 1 8 Q U A R T E R LY M O B I L E I N D E X A N D A F U L L Y E A R L O O K B A C K / 6

IN-APP VIDEO EMERGES AS THE DRIVER OF MOBILE VIDEO GROWTH GLOBALLY In-app environments experienced the largest growth in ad spend, up over 200% year-over-year in 2018 to encompass nearly two-thirds of all mobile video ad spend worldwide. According to research from Forrester Consulting, more than half of media buyers said that in-app video offers better audience targeting (56%) and more effective customer engagement (54%).6
6 “The Move Towards In-App Advertising,” Forrester Consulting study commissioned by PubMatic, January 2019
A P PW W W[ [M O B I L E W E B 201836%
I N -A P P201864%
M O B I L E W E B 201760%
I N -A P P 201740%
© 2 0 1 9 P U B M AT I C , I N C . A L L R I G H T S R E S E R V E D Q 4 2 0 1 8 Q U A R T E R LY M O B I L E I N D E X A N D A F U L L Y E A R L O O K B A C K / 7
7 “Advertisers Spent $5.25 Billion on the Midterm Election, 17% More Than in 2016,” Jason Lynch, Adweek, November 2018
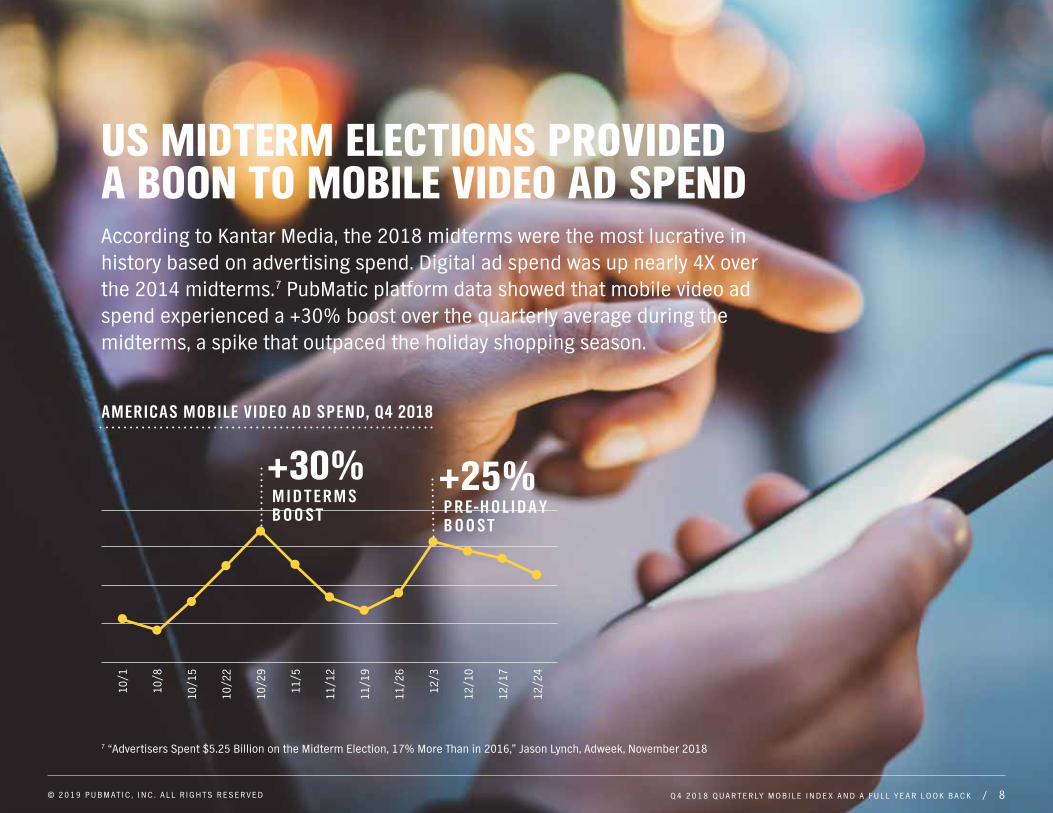
US MIDTERM ELECTIONS PROVIDED A BOON TO MOBILE VIDEO AD SPENDAccording to Kantar Media, the 2018 midterms were the most lucrative in history based on advertising spend. Digital ad spend was up nearly 4X over the 2014 midterms.7 PubMatic platform data showed that mobile video ad spend experienced a +30% boost over the quarterly average during the midterms, a spike that outpaced the holiday shopping season.
AMERICAS MOBILE VIDEO AD SPEND, Q4 2018
10/1
10/8
10/1
5
10/2
2
10/2
9
11/5
11/1
2
11/1
9
+30%M I D T E R M SB O O S T
11/2
6
12/3
12/1
0
12/2
4
+25%P R E-H O L I D A YB O O S T
12/1
7
© 2 0 1 9 P U B M AT I C , I N C . A L L R I G H T S R E S E R V E D Q 4 2 0 1 8 Q U A R T E R LY M O B I L E I N D E X A N D A F U L L Y E A R L O O K B A C K / 8

02KEY TREND
IN-APP HEADER BIDDING BEGINNING TO TAKE HOLDPublishers across devices are embracing the efficiency that header bidding provides, with the technology achieving 76% adoption by December 2018 among the top 1,000 US sites that do programmatic advertising.8 While desktop and mobile web publishers are reaching maturity with the technology, 2018 was the year that header bidding for in-app took off.
8 “Ad Tech Insights – January Report,” Adzerk, January 2019
© 2 0 1 9 P U B M AT I C , I N C . A L L R I G H T S R E S E R V E D Q 4 2 0 1 8 Q U A R T E R LY M O B I L E I N D E X A N D A F U L L Y E A R L O O K B A C K / 9

HEADER BIDDING CONTINUED TO EXPERIENCE GROWTH ACROSS DEVICES Publishers are embracing the efficiency and performance of header bidding technology across channels and formats. Mobile growth rates exceeded desktop by more than 2-to-1 in 2018, with annual growth rates of 124% for mobile and 47% for desktop.
Q32018
3%DESKTOP MOBILE
95%
Q42018
81%
167%
Q12018
60%
110%
Q22018
47%
109%
MONE T IZED HEADER BIDDING IMPRESSION VOLUME YOY CHANGE, BY DE VICE
Q 4 2 0 1 8 Q U A R T E R LY M O B I L E I N D E X A N D A F U L L Y E A R L O O K B A C K / 1 0© 2 0 1 9 P U B M AT I C , I N C . A L L R I G H T S R E S E R V E D

MOBILE EXCEEDS ONE QUARTER OF HEADER BIDDING IMPRESSION VOLUME Mobile header bidding experienced significant growth across all regions in 2018. APAC experienced the steepest growth curve, increasing 276% YOY, followed EMEA at 191% and the Americas at 68%. Globally, mobile devices now represent 26% of all impressions monetized via header bidding technology.
26%DESKTOP MOBILE
74%2018 2018
81%2017
19%2017
SHARE OF GLOBAL MONE T IZED HEADER BIDDING IMPRESSIONS, BY DE VICE
+276%
+191%Y O Y C H A N G E
EMEA
APAC
Y O Y C H A N G E
MOBILE HEADER BIDDING IMPRESSIONS, 2017-2018
+68%Y O Y C H A N G E
AMERICAS
© 2 0 1 9 P U B M AT I C , I N C . A L L R I G H T S R E S E R V E D Q 4 2 0 1 8 Q U A R T E R LY M O B I L E I N D E X A N D A F U L L Y E A R L O O K B A C K / 1 1

IN-APP HEADER BIDDING FINALLY ACHIEVED VIABILITY IN 2018The inefficiencies of the waterfall and current ad network mediation drove many app developers to embrace header bidding. According to PubMatic data, in-app header bidding impression volumes grew more than 300X year-over-year in 2018, and the technology experienced swift adoption in all regions globally over the course of the year.
MONE T IZED IN-APP HEADER BIDDING IMPRESSION VOLUME AND QOQ CHANGE, BY REGION
AM
ERIC
AS
Q12018
EMEA
APA
C
Q32018
Q42018
Q22018
+324%
+101%
+69%+781%
Q32018
Q12018
Q32018
Q42018
Q22018
Q12018
Q42018
Q22018
+1,458%
+52%
+28%
© 2 0 1 9 P U B M AT I C , I N C . A L L R I G H T S R E S E R V E D Q 4 2 0 1 8 Q U A R T E R LY M O B I L E I N D E X A N D A F U L L Y E A R L O O K B A C K / 1 2

03KEY TREND
ADVERTISERS INCREASINGLY LEVERAGED PMPS TO IMPROVE IN-APP QUALITYWhile web-based publishers are seeing growth in the open exchange, buyers are increasing interest in private marketplaces (PMPs) as a means of accessing safe, premium content and engaged audiences in-app. Quality concerns (including fear of fraud, viewability, and brand safety concerns) remain the #1 challenge for brands and agencies when it comes to buying in-app.9 As a result, in-app PMP impression volume grew more than 75% YOY in 2018.
9 “The Move Towards In-App Advertising,” Forrester Consulting study commissioned by PubMatic, January 2019
© 2 0 1 9 P U B M AT I C , I N C . A L L R I G H T S R E S E R V E D Q 4 2 0 1 8 Q U A R T E R LY M O B I L E I N D E X A N D A F U L L Y E A R L O O K B A C K / 1 3

OPENRTB GROWS AS THE WEB BECOMES SAFER, WHILE PMPS THRIVE IN-APPOver the course of 2018, the programmatic market made significant advancements towards quality. One of the biggest examples is the swift adoption of ads.txt, which now has 77% adoption among the top 5,000 programmatic domains.10 As a result, buyers and publishers are re-embracing the efficiency of the open market for desktop and mobile web. However, quality concerns in-app have led to a rise in PMP usage within the environment.
10 “Q3 2018 Ads.txt Trends Report,” Pixalate, December 2018
OpenRTB
PMP
I M P R E S S I O N V O L U M E C H A N G E , B Y P L A T F O R M, 2017 V S . 2018
+64% -1%+5%
IN-APP
A P P
MOBILE WEBDESKTOP
+5% +78%-4%
W W W[ [
Q 4 2 0 1 8 Q U A R T E R LY M O B I L E I N D E X A N D A F U L L Y E A R L O O K B A C K / 1 4© 2 0 1 9 P U B M AT I C , I N C . A L L R I G H T S R E S E R V E D

IN-APP PMPS GREW THE MOST IN APAC, WHILE EMEA REMAINS THE LARGEST GLOBAL MARKETSixty-eight percent of global media buyers surveyed by Forrester Consulting said they always include programmatic direct in-app advertising in their digital media plans.11 PubMatic data showed similar findings, with all global regions experiencing growth in mobile in-app PMP utilization in 2018. EMEA is leading the market globally in in-app PMP usage, particularly as GDPR concerns have driven ad budgets towards PMPs.12 However, APAC has experienced the greatest year-over-year growth as in-app advertising continues to take hold in the region.
11 “The Move Towards In-App Advertising,” Forrester Consulting study commissioned by PubMatic, January 201912 “How GDPR Is Moving Ad Budgets Toward Private Marketplaces,” Ross Benes, eMarketer, August 2018
MOBILE IN-APP PMP IMPRESSION VOLUME AND YOY CHANGE, BY REGION
AM
ERIC
AS
2017 2018
+57%Y O Y C H A N G E
EMEA
2017 2018
+45%Y O Y C H A N G E
APA
C
2017 2018
+201%Y O Y C H A N G E
© 2 0 1 9 P U B M AT I C , I N C . A L L R I G H T S R E S E R V E D Q 4 2 0 1 8 Q U A R T E R LY M O B I L E I N D E X A N D A F U L L Y E A R L O O K B A C K / 1 5

THE TOP FOUR VERTICALS FOR IN-APP PMPSThe Entertainment and Leisure vertical experienced the greatest year-over-year growthto become the largest vertical for mobile in-app PMP impression volume in 2018. News, Technology, and Business and Finance trailed close behind.
2017
2018
Entertainment & Leisure
Technology
+108%
+71%
+28%
+278%
News
Business & Finance
MONE T IZED IN-APP PMP IMPRESSION VOLUME AND YOY CHANGE, BY VERT ICAL
Q 4 2 0 1 8 Q U A R T E R LY M O B I L E I N D E X A N D A F U L L Y E A R L O O K B A C K / 1 6© 2 0 1 9 P U B M AT I C , I N C . A L L R I G H T S R E S E R V E D

04KEY TREND
IN-APP MONETIZATION THRIVED, WHILE MOBILE WEB EXPERIENCED GREATEST GROWTHThe overall mobile programmatic opportunity has steadily increased as brand advertisers continue to target the engaged mobile audiences via automated channels. Apps remained the driver of mobile ad spend in 2018, though quality concerns about the channel resulted in mobile web outpacing apps in terms of annual growth.
© 2 0 1 9 P U B M AT I C , I N C . A L L R I G H T S R E S E R V E D Q 4 2 0 1 8 Q U A R T E R LY M O B I L E I N D E X A N D A F U L L Y E A R L O O K B A C K / 1 7

GLOBAL AD SPEND CONTINUES ITS SHIFT TOWARDS MOBILEAs US adults spent over 25% more time on their phones than on their computers in 2018,13 advertisers are increasingly seeking this engaged, on-the-go audience. PubMatic found that worldwide mobile ad spend grew 32% YOY in Q4 2018, in line with market forecasts.
Source: eMarketer, September 2018
2019 2020 2021 2022
22.9%20.3%
14.0% 11.4%
$232.34
$279.47$318.53
$354.79
% YOY Change$ billions
13 “Average Time Spent per Day by US Adult Users of Each Major Medium, 2016-2020,” eMarketer, October 2018
2018
$189.02
32.1%
© 2 0 1 9 P U B M AT I C , I N C . A L L R I G H T S R E S E R V E D Q 4 2 0 1 8 Q U A R T E R LY M O B I L E I N D E X A N D A F U L L Y E A R L O O K B A C K / 1 8

APPS CONTINUE TO TAKE THE LION’S SHARE OF MOBILE AD IMPRESSIONS GLOBALLY While consumers spend the majority of their time on their smartphones on apps rather than the web, the majority of that time is spent within walled gardens like Facebook. For independent publishers, though apps remain the larger opportunity in terms of volume (with a 54% share of mobile impression volume in 2018), mobile web environments experienced the greatest growth, rising 47% year-over-year.
A P PW W W[ [M O B I L E W E B 201846%
I N -A P P201854%
M O B I L E W E B 201737%
I N -A P P 201763%
© 2 0 1 9 P U B M AT I C , I N C . A L L R I G H T S R E S E R V E D Q 4 2 0 1 8 Q U A R T E R LY M O B I L E I N D E X A N D A F U L L Y E A R L O O K B A C K / 1 9

AMIDST QUALITY CONCERNS ON ANDROID APPS, iOS STEALS SHARE Quality issues plagued the Android app market in Q4 2018, highlighted by a massive, multi-million dollar ad fraud scheme uncovered in October.14 As advertisers flocked towards the safety of iOS, Apple grew to represent nearly one-third of global in-app ad spend, up from 20% a year prior.
iO S201831%
A N D R O I D201869%
iO S201720%
A N D R O I D 201780%
14 “Apps Installed On Millions Of Android Phones Tracked User Behavior To Execute A Multimillion-Dollar Ad Fraud Scheme,” Craig Silverman, BuzzFeed News, October 2018
© 2 0 1 9 P U B M AT I C , I N C . A L L R I G H T S R E S E R V E D Q 4 2 0 1 8 Q U A R T E R LY M O B I L E I N D E X A N D A F U L L Y E A R L O O K B A C K / 2 0

05KEY TREND
HOLIDAY SHOPPING PROVIDED A HUGE BOOST TO MOBILE AD SPEND GLOBALLYConsumers are spending more time interacting and transacting on the go. As a result, mobile advertising experienced significant growth during the busy holiday shopping season in 2018. The largest increase occurred within mobile web environments, where ad buyers sought to reach a consumer base that was shopping right up until the Christmas holiday.
© 2 0 1 9 P U B M AT I C , I N C . A L L R I G H T S R E S E R V E D Q 4 2 0 1 8 Q U A R T E R LY M O B I L E I N D E X A N D A F U L L Y E A R L O O K B A C K / 2 1

MOBILE WEB AD SPEND ROSE AS HOLIDAY SHOPPERS FLOCKED TO MOBILE DEVICESShoppers leveraged mobile devices at record rates during the 2018 holiday shopping season. Nearly half of consumers surveyed planned to use smartphones as a shopping device, with 67% of those planning to use their phone to make a purchase (up 57% from 2017).15 PubMatic data shows that mobile web environments experienced the largest boost in ad spend year-over-year of all platforms in Q4 2018.
IN-APP
+12%Y O Y C H A N G E
A P P
MOBILE WEB
+68%W W W [
Y O Y C H A N G E
+27%Y O Y C H A N G E
DESKTOP
[
15 “2018 Deliotte Holiday Retail Survey,” Deliotte Insights, October 2018
Q 4 2 0 1 8 Q U A R T E R LY M O B I L E I N D E X A N D A F U L L Y E A R L O O K B A C K / 2 2© 2 0 1 9 P U B M AT I C , I N C . A L L R I G H T S R E S E R V E D

16 “Here’s Everything You Need to Know About 2018 Holiday Shopping So Far,” Lisa Lacy, Adweek, November 201817 “How to Win the Last-Minute Holiday Rush,” RetailMeNot, December 2018
MOBILE AD SPEND ROSE STEADILY OVER Q4, PEAKING RIGHT BEFORE THE HOLIDAYSWorldwide, mobile ad spend rose 8% over the quarterly average around Black Friday, as consumers placed more Black Friday orders on their phones than desktops for the first time in 2018.16 However, the biggest spike occurred right before the Christmas holiday. Advertisers and publishers alike capitalized on the fact that not all holiday shoppers plan ahead; Dec. 22 was projected to be the busiest shopping day of the season on mobile.17 On desktop, the biggest spike occurred during Cyber Monday.
WORLDWIDE MOBILE AD SPEND, Q4 201810
/1
10/8
10/1
5
10/2
2
10/2
9
11/5
11/1
2
11/1
9
+8%B L A C K F R I D A Y/
C Y B E R M O N D A YB O O S T
11/2
6
12/3
12/1
0
12/2
4
+25%P R E-H O L I D A YB O O S T
12/1
7© 2 0 1 9 P U B M AT I C , I N C . A L L R I G H T S R E S E R V E D Q 4 2 0 1 8 Q U A R T E R LY M O B I L E I N D E X A N D A F U L L Y E A R L O O K B A C K / 2 3

QMI Methodology PubMatic’s yield and data analytics team analyzes over 12 trillion advertiser bids on a monthly basis, utilizing the company’s best-in-class analytics capabilities. The Q4 2018 QMI incorporates impressions, revenue and eCPM data from these reports to provide a high-level analysis of key trends within the mobile advertising industry. Data is from the fourth quarter of 2018 (i.e., October 1, 2018 to December 31, 2018) and calendar year 2018, as well as the corresponding prior year periods. Analysis is based on PubMatic-sourced data except as noted. Percentages in some figures may not sum to 100% due to rounding. “Monetized impressions” or “paid impressions” are defined as impressions that were sold through the PubMatic platform, and “eCPM” is defined as the cost per one thousand impressions.
Disclaimer: This QMI may include inaccuracies or typographical errors, andis based on operational data that has not been audited or reviewed by a third party. It may contain forward-looking statements about future results and other events that have not yet occurred. Actual results may differ materially from PubMatic’s expressed expectations due to future risks and uncertainties, and past performance or trends are no guarantee of future results. PubMatic does not intend to update the information contained in this QMI if any information or statement contained herein later turns out to be inaccurate.

© 2 0 1 8 P U B M AT I C , I N C . A L L R I G H T S R E S E R V E D
PUBMATIC CONTACT
Research Contact:
JOHANNA BAUMANVP, Marketing Communications
About PubMaticPubMatic is a publisher-focused sell-side platform for an open digital media future. Featuring leading omni-channel revenue automation technology for publishers and enterprise-grade programmatic tools for media buyers, PubMatic’s publisher-first approach enables advertisers to access premium inventory at scale. Processing over 12 trillion advertiser bids per month, PubMatic has created a global infrastructure to drive publisher monetization and control over their ad inventory. Since 2006,
PubMatic’s focus on data and technology innovation has fueled the rise of the programmatic industry as a whole. Headquartered in Redwood City, California, PubMatic operates 13 offices and six data centers worldwide.
PubMatic is a registered trademark of PubMatic, Inc. Other trademarks are the property of their respective owners.
Sales Contacts:
JEFFREY HIRSCHChief Marketing Officer and
Head of US Publisher Development
JAAN JANESVP, Customer Success, US
KYLE DOZEMANVP, Advertiser Solutions, US
BILL SWANSONChief Revenue Officer, EMEA
JASON BARNESChief Revenue Officer, APAC