Embed Size (px)
Citation preview

Q4 2020
Letter to Shareholders

Pinterest PredictsPinterest Predicts isn’t your typical trend report. It’s a not-yet-trending report. It’s not about any one individual, but emphasizes the preferences and stylistic tastes of the Pinterest community.
We called it
More than 450 million people use Pinterest to find tomorrow’s ideas. It’s a place to look forward. That means we know what’s going to be big in the future, even when it may seem small in the present. In fact, 8 out of 10 of Pinterest’s predictions for 2020 came true—despite it being the least predictable year in history.1
Business highlight
1 Pinterest Internal Search Data, Global, analysis period Aug 2019 to July 2020.2 Pinterest Internal Search Data, Global, analysis period Oct 2018 to Sep 2020.
SkinimalismThe new glow up
It’s the end of the caked-on makeup look. Pinners will embrace slow beauty and let their natural skin texture shine through.
Increase in searches YoY Increase in searches YoY
AthflowThe new athleisure
When athleisure meets elegance—that’s athflow. Flowy pants, casual jumpsuits and oversized outfits will replace athletic clothes as the new go-to loungewear.
4xFace yoga exercises
Trending inBrazil France Italy
2xHome dress women
Trending inUS Indonesia UK
115%Aloe vera face mask
Trending inFrance UK Indonesia
160%Cotton jumpsuits for women
Trending inCanada US UK
2021 Predictions2
The 150+ trends featured in the report show how people are taking back control, taking back agency and taking action—for themselves, for their families, for their communities and for the world. Here are two sample trends or explore the full report.
In the graphic above, you can see the moment that Pinterest predicted the trend back in 2019—look for the dots— and the trends coming true—the peaks in 2020!
Jan ’20 Jan ’20Jan ’18 Jan ’18
Outdoor kitchen bars Solar light crafts
3
Inspired on Pinterest
Some of Dennis’ Story Pins
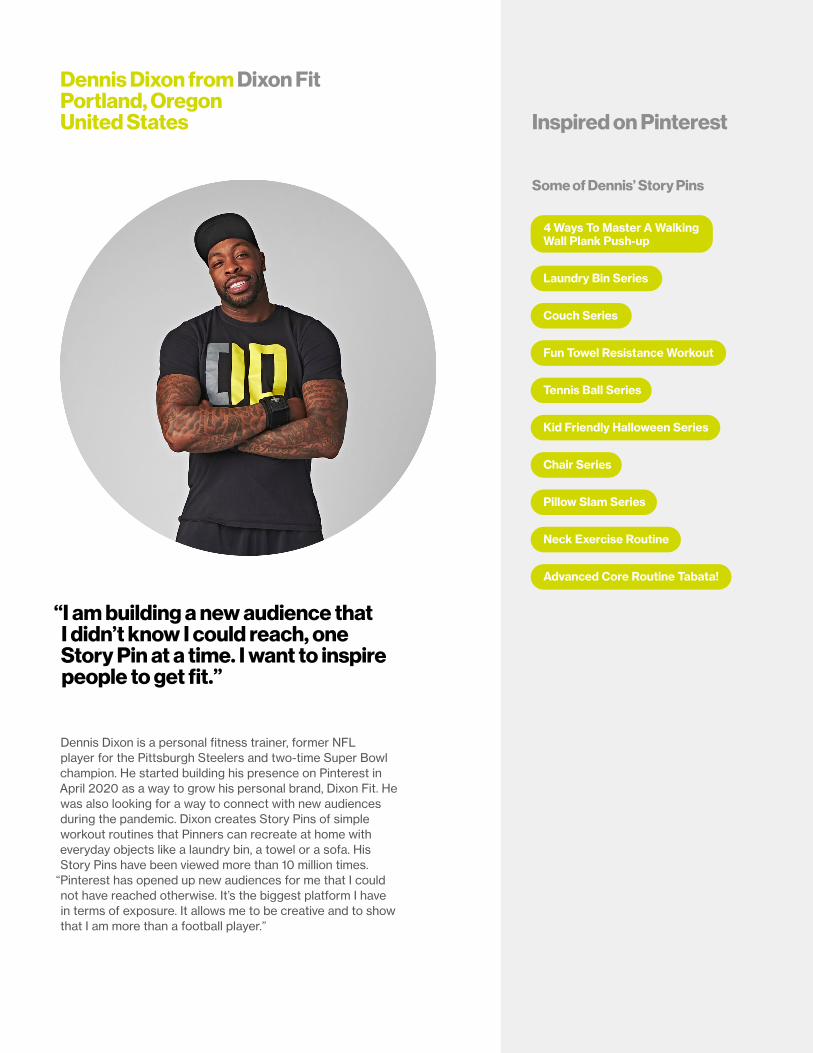
Dennis Dixon from Dixon FitPortland, OregonUnited States
“I am building a new audience that I didn’t know I could reach, one Story Pin at a time. I want to inspire people to get fit.”
Dennis Dixon is a personal fitness trainer, former NFL player for the Pittsburgh Steelers and two-time Super Bowl champion. He started building his presence on Pinterest in April 2020 as a way to grow his personal brand, Dixon Fit. He was also looking for a way to connect with new audiences during the pandemic. Dixon creates Story Pins of simple workout routines that Pinners can recreate at home with everyday objects like a laundry bin, a towel or a sofa. His Story Pins have been viewed more than 10 million times.
“Pinterest has opened up new audiences for me that I could not have reached otherwise. It’s the biggest platform I have in terms of exposure. It allows me to be creative and to show that I am more than a football player.”
4 Ways To Master A Walking Wall Plank Push-up
Laundry Bin Series
Couch Series
Fun Towel Resistance Workout
Tennis Ball Series
Kid Friendly Halloween Series
Chair Series
Pillow Slam Series
Neck Exercise Routine
Advanced Core Routine Tabata!

4
Q420 & FY20 Highlights• Q4 revenue grew 76% year over year to $706 million, driven by strong holiday
advertiser demand and positive returns from our investments in ad products and international expansion. Full year 2020 revenue grew 48% year over year to $1.69 billion.
• Our Monthly Active Users (MAUs) grew 37% year over year to 459 million in Q4, maintaining strong year over year growth in both U.S. and international geographies.
• Our Q4 GAAP net income was $208 million and our full year 2020 GAAP net loss was $128 million. We were profitable on a non-GAAP basis in both Q4 and 2020. Our Q4 Adjusted EBITDA1 was $299 million and for 2020 it was $305 million.
Q420 Business Highlights History will remember 2020 as a year unlike any other. COVID-19 forced
people all over the world to adjust their lives in many unpredictable ways.
We were inspired by the resilience we saw from so many families and
businesses. We are also humbled and proud that Pinterest played a part in
hundreds of millions of these stories.
Our mission is to bring everyone the inspiration to create a life they love.
To us, this work has never been more meaningful. When families needed help
adjusting to living and working in a global pandemic, Pinterest helped them
create home offices and teach their kids. When businesses suddenly faced
uncertain futures, Pinterest helped connect them to customers who most
needed their products and services.
That commitment was reflected in our business results. We had a strong
finish to the year. We welcomed over 100 million additional MAUs in 2020,
as more people than ever before came to Pinterest looking for inspiration.
There was healthy holiday demand from advertisers looking to reach Pinners
planning their futures and, as a result, our revenue grew 76% year over year
to $706 million in Q4.
In 2021, our focus will be on the following core priorities:
• Delivering more inspiring content: Our top priority is to make Pinterest
home to more inspiring content and, increasingly, more inspiring creators.
1 This non-GAAP financial measure excludes share-based compensation (SBC), depreciation and amortization expense, interest income, interest expense and other income (expense), net, provision for income taxes and, for the third quarter of 2020, a one-time payment for the termination of a future lease contract. For more information on this, please see “About non-GAAP financial measures.”
Revenue$706 million76% Y/Y
MAUs459 million37% Y/Y
ARPU$1.5729% Y/Y
Net Income $208 million29% of revenue
Adj. EBITDA1$299 million42% of revenue
5
This means continuing to invest in video to provide our users with more
dynamic experiences—like “how-to” tutorials and engaging storytelling from
brands. We are also taking important first steps to build a creator ecosystem
around Story Pins where a new generation of creators can create great
content to enrich the lives of Pinners.
• Deepening the Pinner experience: We plan to continue to invest in building
great tools to help Pinners get inspired, plan their futures, and turn their
ideas into a reality. When people find ideas that inspire them, we want them
to easily act on them without having to leave Pinterest.
• Helping advertisers succeed: Unlike other platforms where ads distract
users from reading the news or connecting with friends, commercial
content can enhance the Pinner experience. People come to Pinterest
looking for products and services to plan their futures and build their lives.
Helping advertisers reach new customers is essential to our mission. So
we plan to make a number of investments to support advertisers, including
improving automation so it’s easy to do business on Pinterest, improving our
measurement capabilities and growing our sales coverage for all types
of advertisers.
• Making Pinterest more shoppable: We want to make it easier for Pinners to
buy the things they see and love. This means helping more businesses get
their products on Pinterest, and helping Pinners discover, evaluate and buy
products that inspire them. We’re also planning to expand these features
more globally so that no matter where you live, you can shop on Pinterest.
If we want to be successful in achieving all of these priorities, we must strive to
have a great company culture that attracts and retains talent from all over the
world. We believe growing our diverse team is the best way to drive innovation
in our product, on behalf of the Pinners and advertisers we serve. That’s why
investing in our culture is, and will continue to be, essential to everything we do.
Pinner ExperienceBuilding the future of inspiring content
Our top priority is making Pinterest home to the most inspiring and actionable
content. In Q3 we announced a new suite of creator tools, including the multi-
page format Story Pins. Story Pins on Pinterest focus on sharing ideas, teaching
people how to do something and inspiration, rather than self promotion or
pure entertainment.
We are at the very beginning of this journey towards more immersive and
inspiring content. Throughout Q4 and continuing into 2021, Pinners are
increasingly able to discover Story Pins throughout the Pinterest experience.
In addition to trending Story Pins featured in the Today Tab, we’re introducing
a new spot at the top of the home feed where Pinners can find the latest
Story Pins from creators they follow.

6
Planning on Pinterest
While life in quarantine has been unexpected, it hasn’t stopped people from
planning and looking ahead to the future. In fact, in Q4 there was a 50% year
over year increase in the number of boards created globally. Additionally, we’ve
seen growth in boards created in core Pinterest categories, including a 49%
increase in beauty, a 103% increase in women’s fashion and a 37% increase
in home decor.
In Q4 we introduced new features for boards that make it easier to plan and
convert the inspiration on Pinterest into real life action. Pinners can now add
private notes directly on Pins, like “try this for brunch this Sunday” or “this will
go well with our living room rug”. A new board toolbar makes it easier to sort
Pins, find shoppable items inspired by your board, or access notes.
Shopping on Pinterest
Pinners start planning early, and during the 2020 holiday season they shopped
earlier and for longer too. With Pinners turning towards Pinterest for more and
more of their shopping needs, we’ve made it easier for them to find what they’re
looking for: from the moment of inspiration all the way to taking action on a
purchase. So we developed another new way for Pinners to virtually try-on new
products with the development of eye-shadow try on. In Q4, this also meant
further expanding our inventory of reliable product Pins as well as refining the
discoverability of those Pins. To that end, Pinners can now pivot into shop mode
across all product categories, leading to a feed of shoppable product Pins. All
of these efforts have resulted in strong growth in product-only searches, which
have grown by 20x since the beginning of 2020. And for our merchants and
advertisers, we’re testing product tagging capabilities. This complements our
computer vision-based product recommendations as our research shows that
Pinners are 70% more likely to engage with products tagged in scene images
than on standalone product Pins.
Pinner well-being
Our ability to deliver inspiration and a more positive experience for Pinners
requires a dedication to content safety. Throughout the recent election cycle,
we invested in making Pinterest a place for lifestyle inspiration, not a place
to debate politics or read the news. Pinners naturally come to Pinterest for
inspiration on topics such as how to remodel your kitchen, how to dress your
dog, or chocolate chip cookie recipes. But we’ve also taken a more proactive
role in creating the Pinner experience, like our policy to not recommend political
content to users and reduce misinformation. Beyond political discourse, we
were also able to reduce intrusive spam content throughout the year. As always,
content safety is an evolving topic and there’s more room for improvement. We’ll
continue to strive to enhance the safety and positivity of the Pinner experience.

7
* Automatic bidding delivered a 4x increase in clicks for exactly the same daily budget. Automatic bids helped to drive an 80% decrease in their CPCs across three major markets: the UK, France, and Germany. Source: Pinterest Ads Manager Data, Jan-May 2020.
4x more clicks* 80% decrease
in CPC*
Discover more Living Room MADE.COM
MADE.COMMADE.COM is making designs on the high-end furniture market, minus the high-end price tags, of course. From cushy chaise lounges to statement chandeliers, it’s becoming the place to go for epic, eye-catching pieces. Aiming to drive cost-effective traffic to their website, MADE.COM decided to run a full-funnel search-only campaign on Pinterest. They used automatic bidding as a supplement to their search strategy, which helped to drive more traffic at a lower cost across three major markets: the UK, France and Germany.
MADE.COM’s strong partnership with Pinterest combined with our test and learn mindset on the platform has enabled us to find continued success with new features like automatic bidding, allowing us to drive high-quality and efficient website traffic.”Liberty Marchant, Senior Paid Social Manager, MADE.COM
Advertising on PinterestBroad based strength in Q4
Our investments in ad tools and sales coverage continued to pay off,
especially during a strong holiday season. Advertising demand was healthy
across different advertiser sizes and verticals, with retail demand further
building off the recovery in Q3. We saw Pinners planning, discovering and
shopping online earlier for the holidays this year. So we used these insights
on aggregate behaviors and taste-based preferences to help businesses
navigate a dynamic holiday advertising market. Shopping ad revenue once
again grew faster than our overall business and we saw a 6x increase in the
number of businesses that used the shopping ads format in Q4.
We saw strong advertising momentum globally with continued momentum in
our international markets, especially in Western Europe. International revenue

8
more than doubled in Q4 from the prior year, speaking to how important
Pinterest has become to advertisers reaching a global audience of Pinners.
And we’re just getting started here: in 2021, we plan to expand our presence
in existing international markets and are excited to enter new geographies in
Latin America in the first half of the year. Finally, positivity and brand safety
continue to resonate with advertisers, and this remained a tailwind for our
business in Q4. We joined the Global Alliance for Responsible Media as a
commitment to further improving digital safety.
Helping advertisers succeed on Pinterest
Advertisers want the confidence to know they can spend their budgets and do
it efficiently, especially in times of uncertainty. Over the past several quarters,
we’ve launched automatic bidding for all of our performance-based objectives,
including traffic and conversion optimization as well as our shopping format.
Not only does automatic bidding reduce the amount of effort required to
manage Pinterest campaigns, it also helps advertisers achieve their desired
results and scale. And while early, we’ve been encouraged to see a majority
of automatic bid advertisers increase budget allocations on Pinterest. In Q4,
this momentum continued, with roughly half of our total advertising spend
employing automatic bidding.
Proving performance and delivering measurement to businesses
Businesses come to Pinterest to build awareness for their brand, generate
demand and drive conversions. In order to help advertisers understand their
impact and performance on Pinterest, we expanded our suite of measurement
tools. In Q4, we began giving all advertisers the ability to see promoted and
organic metrics in a single report. This level of detail complements our efforts
to help advertisers understand attribution windows and the general consumer
path to purchase. We also provided a new tool for advertisers to conduct first-
party brand lift studies, making it easier for advertisers of all sizes to measure
the impact of awareness campaigns.
As part of our ongoing efforts to provide advertisers with more precise
and actionable reporting, we are continuously making improvements to
our conversion attribution measurement capabilities, such as through tag
adoptions. We rolled out a series of features, building on progress from
throughout the year, to help identify even more conversions.

9
Q420 Financial HighlightsQ4 revenue grew 76% year over year to $706 million driven by a strong holiday season and positive returns from our investments in ad products and international expansion. We experienced broad based strength during the quarter across objectives as well as advertiser verticals, sizes and geographies. Our Monthly Active Users (MAUs) grew to 459 million, maintaining strong year-over-year growth in both U.S. and international geographies. Our GAAP net income was $208 million or 29% of revenue. Our Adjusted EBITDA2 was $299 million or 42% of revenue.
UsersMAUs at year-end were 459 million, representing growth of 37% year
over year. We continued to see users engaging and finding inspiration on
Pinterest as the world continued to grapple with COVID-19. Prior trends
around higher growth in international users and higher growth from users
under 25 years old continued in the quarter.
By region:
• U.S. MAUs were 98 million, an increase of 11% year over year compared
to 88 million in the same period of the previous year.
• International MAUs were 361 million, an increase of 46% year over year
in comparison to the 247 million in the same period of the previous year.
Revenue Total revenue was $706 million, an increase of 76% year over year
compared to Q419. Revenue growth was driven primarily by an earlier and
sustained holiday season and product improvements that helped advertisers
scale budgets and achieve more conversions. Advertiser demand was broad
based as businesses have increasingly adapted to the COVID environment.
Building off of the positive trends in Q3, we saw strength in Q4 from small
and medium sized advertisers, international advertisers, CPG advertisers
and retail advertisers. Demand was also strong across awareness and
performance objectives, and shopping ads once again grew faster than
our overall revenue. Automatic bidding supported higher budget utilization,
better performance, and overall budget expansions, particularly for small
and medium businesses. We continued to grow our active advertisers to
new levels and further diversified our revenue across advertisers.
2 This non-GAAP financial measure excludes share-based compensation (SBC), depreciation and amortization expense, interest income, interest expense and other income (expense), net and provision for income taxes. For more information on this, please see “About non-GAAP financial measures.”
98
335
Q419
459
Q420
Monthly Active Users (in millions)
International
U.S.
88
247
361
Q419 Q420
Revenue (in millions)
International
U.S.
$400
$706
$350
$50
$123
$582

10
By region3:
• Total U.S. revenue was $582 million, an increase of 67% year over year.
U.S. revenue increases were driven by ARPU expansion.
• Total international revenue was $123 million or 17% of revenue, an
increase of 145% year over year and compared to 13% of revenue in
Q419. International revenue growth was driven by growth in ARPU and
supported by an increase in MAUs.
ARPUGlobal ARPU was $1.57, compared to $1.22 in Q419. The expansion in
global ARPU was driven by an increase in advertising demand on our
platform partially offset by an increase in MAUs. Geographic mix was a
headwind to global ARPU growth, as the number of international users
grew faster than the number of U.S. users.
By region:
• U.S. ARPU was $5.94, an increase of 49% year over year.
• International ARPU was $0.35, an increase of 67% year over year.
International ARPU remains in the early stages, as we have only begun
to execute on our strategy to provide ads that are useful and inspiring
to our users in regions outside of the U.S.
Expenses Total costs and expenses were $500 million, including $86 million of
share-based compensation (SBC) and amortization of acquired intangible
assets. Our total costs and expenses increased 13% year over year. Total
non-GAAP costs and expenses4 were $414 million, representing 59% of
revenue compared to 83% of revenue in the year-ago quarter. Our non-
GAAP costs and expenses grew 25% year over year. The growth reflects
higher hosting costs due to user growth and an increase in headcount. Our
income from operations totaled $205 million, or 29% of revenue, compared
to a loss of $43 million and (11)% for the same period in 2019. Non-GAAP
income from operations4 was $292 million, or 41% of revenue, compared to
income of $69 million, or 17% for the same period in 2019.
3 Revenue is geographically apportioned based on our estimate of the geographic location of our users when they perform a revenue-generating activity. US and international may not sum to Global due to rounding. This allocation differs from our disclosure of revenue disaggregated by geography in the notes to our condensed consolidated financial statements where revenue is geographically apportioned based on our customers’ billing addresses.
4 This non-GAAP financial measure excludes share-based compensation (SBC) and amortiza-tion of acquired intangible assets. For more information on this, please see “About non-GAAP financial measures.”
Q419 Q419Q419Q420 Q420Q420
$0.21
$4.00
$1.22
$0.35
$5.94
$1.57
Average revenue per user
International
Global
U.S.
41%
32%
17%
12%
24% 18%
23%
111%
Q419
71%
Q420
GAAP cost and expenses (% of revenue)
S&M Cost of Revenue
G&A R&D
14%

11
$77
$299
42%
19%
Q419 Q420
Adjusted EBITDA2 (in millions)
Adj. EBITDA
Adj. EBITDA margin %
$(36)
$208
29%
(9)%
Q419 Q420
Net income (loss) (in millions)
Net income (loss)
Net margin %
23%
28%
15%
11%
24% 18%
14%
83%
Q419
59%
Q420
8%
Non-GAAP cost and expenses4 (% of revenue)
S&M Cost of Revenue
G&A R&D
Costs and expenses
Cost of revenue was $129 million or 18% of revenue, compared to 24% in
the year-ago quarter. Non-GAAP cost of revenue4 was $127 million or 18%
of revenue, down from 24% of revenue in the year-ago quarter. The decline
as a percent of revenue was primarily driven by higher overall revenue,
partially offset by an increase in infrastructure expense due to user growth.
Research and development expenses were $164 million, down 1% year
over year, driven by a decline in SBC. On a non-GAAP basis, expenses
increased 10% year over year to $102 million. The increase was due to
higher headcount.
Sales and marketing expenses were $121 million, down 5% year over year.
On a non-GAAP basis, expenses decreased 2% year over year to $109
million. The decrease was due to lower marketing expense, partially offset
by headcount growth.
General and administrative expenses were $87 million, up 60% year over
year. On a non-GAAP basis, expenses grew 133% year over year to $76
million. The increase was primarily due to a one-time $22.5 million charge
and an increase in outside advisor and legal-related expenses.
Net income (loss) and Adjusted EBITDANet income was $208 million or 29% of revenue, compared to a loss of
$36 million, or (9)% for the same period in 2019. Non-GAAP net income4
was $294 million, or 42% of revenue, compared to $77 million, or 19% for
the same period in 2019.
Adjusted EBITDA2 was $299 million, or 42% of revenue, compared to the
year-ago quarter Adjusted EBITDA of $77 million, or 19% of revenue. Our
Adjusted EBITDA margin2 increased year over year due to an acceleration
in revenue growth and to a lesser extent COVID-related cost savings.
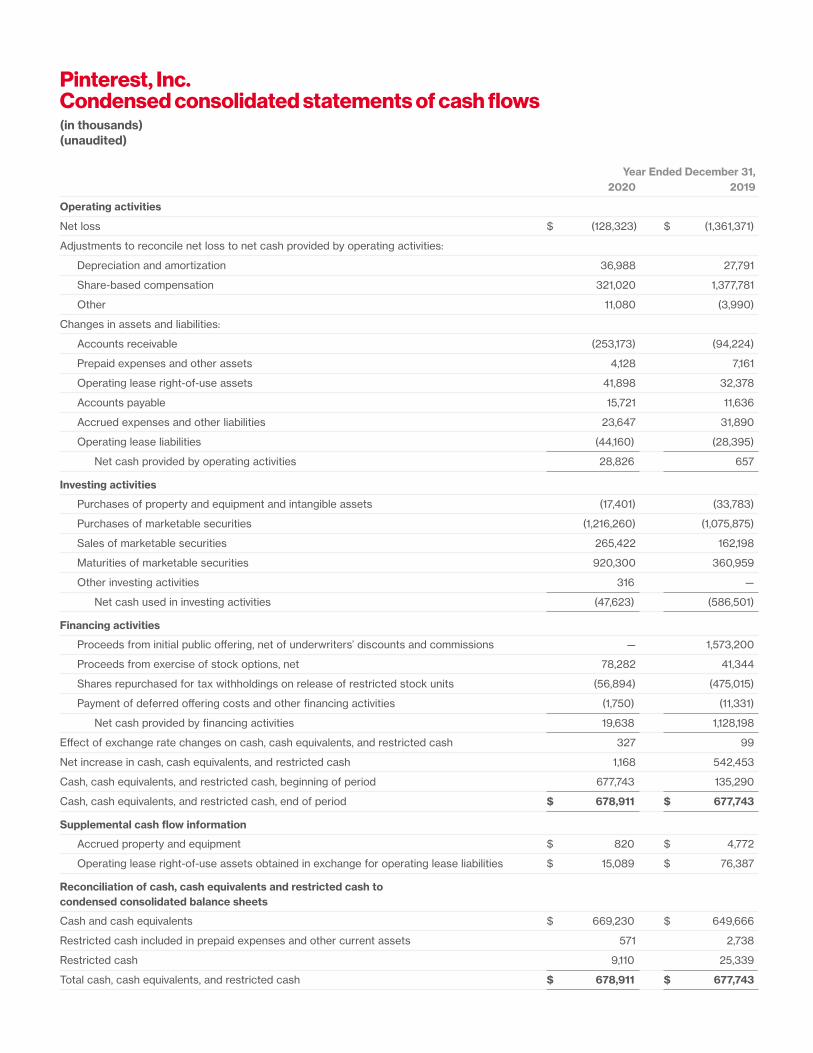
Balance sheet and cash flows
We ended the quarter with approximately $1.76 billion in cash, cash
equivalents, and marketable securities.
Net cash provided by operating activities for the twelve months
ended December 31, 2020 was $29 million, an improvement from
$1 million in 2019.

12
FY20 Financial HighlightsTotal revenue for 2020 was $1.69 billion, an increase of 48% year-over-year compared to
2019. Revenue growth was driven by ad product improvements and continued expansion
in international markets. We welcomed over 100 million additional MAUs in 2020.
Net loss for 2020 was $128 million or (8)% of revenue, compared to a loss of $1.36 billion,
or (119)% for 2019. The decline in net loss was driven by a decline in SBC following our
April 2019 IPO. Non-GAAP net income5 was $283 million, or 17% of revenue, compared
to income of $18 million, or 2% for 2019. The improvement in non-GAAP net income was
driven by higher revenue as well as COVID-related cost savings.
Adjusted EBITDA1 for 2020 was $305 million, or 18% of revenue, compared to 2019
Adjusted EBITDA of $17 million, or 1% of revenue.
5 This non-GAAP financial measure excludes share-based compensation (SBC), amortization of acquired intangible assets and, for the third quarter of 2020, a one-time payment for the termination of a future lease contract. For more information on this, please see “About non-GAAP financial measures.”
216
265
335
459
2017 2018 2019 2020
Monthly Active Users (in millions)
International
U.S.
139184
247
361
76 82 88 98
Adjusted EBITDA1 (in millions)
Adj. EBITDA
Adj. EBITDA margin %
$(39)
$305
$17
18%
1%(5)%
Revenue (in millions)
International
U.S.
$1,693
$1,143
$756
$473
2017 2018 2019 2020
$268
$1,425
$1,026
$449$715
$117
$41
$24
(8)%
(119)%
(8)%
$(63)
$(1,361)
2018 20182019 20192020 2020
Net income (loss) (in millions)
Net income (loss)
Net margin %
$(128)

13
Guidance We continue to navigate uncertainty given the ongoing COVID-19 pandemic and
other factors. Our current expectation is that Q1 revenue will grow in the low-70%
range year over year.
We intend to provide further detail on our outlook during the conference call.
Our strategic priorities for 2021 include content, the Pinner experience, advertiser
success and shopping. We plan to invest in these in the coming year. We expect
R&D efforts to continue to focus on Pinner product, ad product and measurement
investments. We intend to grow our headcount further, in particular to support our
international expansion efforts. We also intend to scale our comprehension and
brand marketing efforts in 2021. We think these investments will support long-term
growth and continue to build the foundations for a scaled business over time.
Closing We will host a Q&A webcast at 1:30pm Pacific time/4:30pm Eastern time today
to discuss these results and our outlook. A live webcast will be available on
Pinterest’s Investor Relations website at investor.pinterestinc.com. Thank you for
taking the time to read our letter, and we look forward to your questions on our
call this afternoon.
Sincerely,Ben Silbermann Todd Morgenfeld
Co-Founder, President and CEO CFO and Head of Business Operations

14
Forward-looking statementsThis letter to shareholders may contain forward-looking statements within the meaning of Section
27A of the Securities Act of 1933, as amended, and Section 21E of the Exchange Act of 1934, as
amended, about us and our industry that involve substantial risks and uncertainties, including, among
other things, statements about our future operational and financial performance and the number
of shares eligible for sale following expiration of the lock-up. Words such as “believe,” “project,”
“may,” “will,” “estimate,” “continue,” “anticipate,” “intend,” “expect,” “plan” and similar expressions
are intended to identify forward-looking statements. These forward-looking statements are only
predictions and may differ materially from actual results due to a variety of factors including:
uncertainty regarding the duration, scope and impact of the coronavirus referred to as COVID-19
pandemic; actions governments and businesses take in response to the pandemic, including actions
that could affect levels of advertising activity; the impact of the pandemic and actions taken in
response to the pandemic on global and regional economies and economic activity; the pace of
recovery when the COVID-19 pandemic subsides; general economic uncertainty in key global markets
and a worsening of global economic conditions or low levels of economic growth; the impact of the
COVID-19 pandemic on our planned investments, operations, expenses, revenue, cash flow, liquidity
and users; our ability to attract and retain users and engagement levels; our ability to provide useful
and relevant content; risks associated with new products and changes to existing products as well
as other new business initiatives; our ability to maintain and enhance our brand and reputation;
compromises in security; our financial performance and fluctuations in operating results; our
dependency on online application stores’ and internet search engines’ methodologies and policies;
discontinuation, disruptions or outages in authentication by third-party login providers; changes by
third-party login providers that restrict our access or ability to identify users; competition; our ability
to scale our business and revenue model; our reliance on advertising revenue and our ability to
attract and retain advertisers and effectively measure advertising campaigns; our ability to effectively
manage growth and expand and monetize our platform internationally; our lack of operating history
and ability to attain and sustain profitability; decisions that reduce short-term revenue or profitability
or do not produce expected long-term benefits; risks associated with government actions, laws
and regulations that could restrict access to our products or impair our business; litigation and
government inquiries; privacy, data and other regulatory concerns; real or perceived inaccuracies in
metrics related to our business; disruption, degradation or interference with our hosting services and
infrastructure; our ability to attract and retain personnel; and the dual class structure of our common
stock and its effect of concentrating voting control with stockholders who held our capital stock
prior to the completion of our initial public offering. These and other potential risks and uncertainties
that could cause actual results to differ from the results predicted are more fully detailed in our
Annual Report on Form 10-K for the fiscal year ended December 31, 2020, which is available on our
investor relations website at investor.pinterestinc.com and on the SEC website at www.sec.gov. All
information provided in this letter to shareholders and in the earnings materials is as of February
4, 2020. Undue reliance should not be placed on the forward-looking statements in this letter to
shareholders, which are based on information available to us on the date hereof. We undertake no
duty to update this information unless required by law.
15
About non-GAAP financial measuresTo supplement our condensed consolidated financial statements, which are prepared and presented
in accordance with generally accepted accounting principles in the United States (“GAAP”), we use
the following non-GAAP financial measures: Adjusted EBITDA, Adjusted EBITDA margin, non-GAAP
costs and expenses (including non-GAAP cost of revenue, research and development, sales and
marketing, and general and administrative), non-GAAP income (loss) from operations, non-GAAP
net income and non-GAAP net income per share. The presentation of these financial measures is
not intended to be considered in isolation, as a substitute for or superior to the financial information
prepared and presented in accordance with GAAP. Investors are cautioned that there are material
limitations associated with the use of non-GAAP financial measures as an analytical tool. In addition,
these measures may be different from non-GAAP financial measures used by other companies,
limiting their usefulness for comparative purposes. We compensate for these limitations by providing
specific information regarding GAAP amounts excluded from these non-GAAP financial measures.
We define Adjusted EBITDA as net income (loss) adjusted to exclude depreciation and amortization
expense, share-based compensation expense, interest income, interest expense and other income
(expense), net, provision for income taxes and, for the third quarter of 2020, a one-time payment for
the termination of a future lease contract. Adjusted EBITDA margin is calculated by dividing Adjusted
EBITDA by revenue. Non-GAAP costs and expenses (including non-GAAP cost of revenue, research
and development, sales and marketing, and general and administrative) and non-GAAP net income
exclude amortization of acquired intangible assets, share-based compensation expense and, for
the third quarter of 2020, a one-time payment for the termination of a future lease contract. Non-
GAAP income (loss) from operations is calculated by subtracting non-GAAP costs and expenses
from revenue. Non-GAAP net income per share is calculated by dividing non-GAAP net income by
diluted weighted-average shares outstanding. We use Adjusted EBITDA, Adjusted EBITDA margin,
non-GAAP costs and expenses, non-GAAP income (loss) from operations, non-GAAP net income and
non-GAAP net income per share to evaluate our operating results and for financial and operational
decision-making purposes. We believe Adjusted EBITDA, Adjusted EBITDA margin, non-GAAP
costs and expenses, non-GAAP income (loss) from operations, non-GAAP net income and non-
GAAP net income per share help identify underlying trends in our business that could otherwise be
masked by the effect of the income and expenses they exclude. We also believe Adjusted EBITDA,
Adjusted EBITDA margin, non-GAAP costs and expenses, non-GAAP income (loss) from operations,
non-GAAP net income and non-GAAP net income per share provide useful information about our
operating results, enhance the overall understanding of our past performance and future prospects
and allow for greater transparency with respect to key metrics we use for financial and operational
decision-making. We present Adjusted EBITDA, Adjusted EBITDA margin, non-GAAP costs and
expenses, non-GAAP income (loss) from operations, non-GAAP net income and non-GAAP net
income per share to assist potential investors in seeing our operating results through the eyes of
management and because we believe these measures provide an additional tool for investors to use
in comparing our operating results over multiple periods with other companies in our industry. There
are a number of limitations related to the use of Adjusted EBITDA, Adjusted EBITDA margin, non-
GAAP costs and expenses, non-GAAP income (loss) from operations, non-GAAP net income and
non-GAAP net income per share rather than net loss, net margin, total costs and expenses, income

(loss) from operations, net income (loss) and net income (loss) per share, respectively, the nearest
GAAP equivalents. For example, Adjusted EBITDA excludes certain recurring, non-cash charges
such as depreciation of fixed assets and amortization of acquired intangible assets, although these
assets may have to be replaced in the future, and share-based compensation expense, which has
been, and will continue to be for the foreseeable future, a significant recurring expense and an
important part of our compensation strategy.
For a reconciliation of these non-GAAP financial measures to the most directly comparable GAAP
financial measures, please see the tables under “Reconciliation of GAAP to non-GAAP financial
results” included at the end of this letter.
Limitation of key metrics and other dataThe numbers for our key metrics, which include our MAUs and ARPU, are calculated using internal
company data based on the activity of user accounts. We define a monthly active user as a logged-
in Pinterest user who visits our website or opens our mobile application at least once during the 30-
day period ending on the date of measurement. We present MAUs based on the number of MAUs
measured on the last day of the current period. We measure monetization of our platform through
our average revenue per user metric. We define ARPU as our total revenue in a given geography
during a period divided by the average of the number of MAUs in that geography during the period.
We calculate average MAUs based on the average between the number of MAUs measured on
the last day of the current period and the last day prior to the beginning of the current period. We
calculate ARPU by geography based on our estimate of the geography in which revenue-generating
activities occur. We use these metrics to assess the growth and health of the overall business
and believe that MAUs and ARPU best reflect our ability to attract, retain, engage and monetize
our users, and thereby drive revenue. While these numbers are based on what we believe to be
reasonable estimates of our user base for the applicable period of measurement, there are inherent
challenges in measuring usage of our products across large online and mobile populations around
the world. In addition, we are continually seeking to improve our estimates of our user base, and
such estimates may change due to improvements or changes in our methodology.
16

December 31, December 31, 2020 2019
Assets
Current assets:
Cash and cash equivalents $ 669,230 $ 649,666
Marketable securities 1,091,076 1,063,679
Accounts receivable, net of allowances of $8,811 and $2,851 as of December 31, 2020 and 2019, respectively 563,733 316,367
Prepaid expenses and other current assets 33,502 37,522
Total current assets 2,357,541 2,067,234
Property and equipment, net 69,375 91,992
Operating lease right-of-use assets 155,916 188,251
Goodwill and intangible assets, net 13,562 14,576
Restricted cash 9,110 25,339
Other assets 3,955 5,925
Total assets $ 2,609,459 $ 2,393,317
Liabilities and stockholders’ equity
Current liabilities:
Accounts payable $ 49,491 $ 34,334
Accrued expenses and other current liabilities 155,340 141,823
Total current liabilities 204,831 176,157
Operating lease liabilities 139,321 173,392
Other liabilities 22,936 20,063
Total liabilities 367,088 369,612
Commitments and contingencies
Stockholders’ equity:
Class A common stock, $0.00001 par value, 6,666,667 shares authorized, 530,140 and 360,850 shares issued and outstanding as of December 31, 2020 and 2019, respectively; Class B common stock, $0.00001 par value, 1,333,333 shares authorized, 96,232 and 209,054 shares issued and outstanding as of December 31, 2020 and 2019, respectively 6 6
Additional paid-in capital 4,574,934 4,229,778
Accumulated other comprehensive income 2,480 647
Accumulated deficit (2,335,049) (2,206,726)
Total stockholders’ equity 2,242,371 2,023,705
Total liabilities and stockholders’ equity $ 2,609,459 $ 2,393,317
Pinterest, Inc. Condensed consolidated balance sheets(in thousands, except par value) (unaudited)
17

Pinterest, Inc. Condensed consolidated statements of operations(in thousands, except per share amounts) (unaudited)
2020 2019 2020 2019
Revenue $ 705,617 $ 399,898 $ 1,692,658 $ 1,142,761
Costs and expenses:
Cost of revenue 129,023 96,274 449,358 358,903
Research and development 163,710 165,033 606,194 1,207,059
Sales and marketing 120,766 127,537 442,807 611,590
General and administrative 86,969 54,241 336,803 354,075
Total costs and expenses 500,468 443,085 1,835,162 2,531,627
Income (loss) from operations 205,149 (43,187) (142,504) (1,388,866)
Interest income 1,854 8,141 16,119 30,164
Interest expense and other income (expense), net 1,509 (133) (635) (2,137)
Income (loss) before provision for income taxes 208,512 (35,179) (127,020) (1,360,839)
Provision for income taxes 671 539 1,303 532
Net income (loss) $ 207,841 $ (35,718) $ (128,323) $ (1,361,371)
Net income (loss) per share attributable to common stockholders:
Basic $ 0.34 $ (0.06) $ (0.22) $ (3.24)
Diluted $ 0.30 $ (0.06) $ (0.22) $ (3.24)
Weighted-average shares used in computing net income (loss) per share attributable to common stockholders:
Basic 618,214 562,396 596,264 420,473
Diluted 689,194 562,396 596,264 420,473
Three months ended Year ended December 31, December 31,
18
Year Ended December 31, 2020 2019
Operating activities
Net loss $ (128,323) $ (1,361,371)
Adjustments to reconcile net loss to net cash provided by operating activities:
Depreciation and amortization 36,988 27,791
Share-based compensation 321,020 1,377,781
Other 11,080 (3,990)
Changes in assets and liabilities:
Accounts receivable (253,173) (94,224)
Prepaid expenses and other assets 4,128 7,161
Operating lease right-of-use assets 41,898 32,378
Accounts payable 15,721 11,636
Accrued expenses and other liabilities 23,647 31,890
Operating lease liabilities (44,160) (28,395)
Net cash provided by operating activities 28,826 657
Investing activities
Purchases of property and equipment and intangible assets (17,401) (33,783)
Purchases of marketable securities (1,216,260) (1,075,875)
Sales of marketable securities 265,422 162,198
Maturities of marketable securities 920,300 360,959
Other investing activities 316 —
Net cash used in investing activities (47,623) (586,501)
Financing activities
Proceeds from initial public offering, net of underwriters’ discounts and commissions — 1,573,200
Proceeds from exercise of stock options, net 78,282 41,344
Shares repurchased for tax withholdings on release of restricted stock units (56,894) (475,015)
Payment of deferred offering costs and other financing activities (1,750) (11,331)
Net cash provided by financing activities 19,638 1,128,198
Effect of exchange rate changes on cash, cash equivalents, and restricted cash 327 99
Net increase in cash, cash equivalents, and restricted cash 1,168 542,453
Cash, cash equivalents, and restricted cash, beginning of period 677,743 135,290
Cash, cash equivalents, and restricted cash, end of period $ 678,911 $ 677,743
Supplemental cash flow information
Accrued property and equipment $ 820 $ 4,772
Operating lease right-of-use assets obtained in exchange for operating lease liabilities $ 15,089 $ 76,387
Reconciliation of cash, cash equivalents and restricted cash to condensed consolidated balance sheets
Cash and cash equivalents $ 669,230 $ 649,666
Restricted cash included in prepaid expenses and other current assets 571 2,738
Restricted cash 9,110 25,339
Total cash, cash equivalents, and restricted cash $ 678,911 $ 677,743
Pinterest, Inc. Condensed consolidated statements of cash flows(in thousands) (unaudited)

20
Share-based compensation by function
Cost of revenue $ 1,816 $ 2,018 $ 7,865 $ 31,758
Research and development 62,097 73,030 218,718 867,191
Sales and marketing 11,842 15,915 35,645 239,315
General and administrative 10,464 21,237 58,792 239,517
Total share-based compensation $ 86,219 $ 112,200 $ 321,020 $ 1,377,781
Amortization of acquired intangible assets by function
Cost of revenue $ 94 $ 94 $ 377 $ 329
General and administrative 158 290 636 1,166
Total amortization of acquired intangible assets $ 252 $ 384 $ 1,013 $ 1,495
Reconciliation of total costs and expenses to non-GAAP costs and expenses
Total costs and expenses $ 500,468 $ 443,085 $ 1,835,162 $ 2,531,627
Share-based compensation (86,219) (112,200) (321,020) (1,377,781)
Amortization of acquired intangible assets (252) (384) (1,013) (1,495)
Termination of future lease contract — — (89,500) —
Total non-GAAP costs and expenses $ 413,997 $ 330,501 $ 1,423,629 $ 1,152,351
Reconciliation of net income (loss) to Adjusted EBITDA
Net income (loss) $ 207,841 $ (35,718) $ (128,323) $ (1,361,371)
Depreciation and amortization 7,814 8,295 36,988 27,791
Share-based compensation 86,219 112,200 321,020 1,377,781
Interest income (1,854) (8,141) (16,119) (30,164)
Interest expense and other (income) expense, net (1,509) 133 635 2,137
Provision for income taxes 671 539 1,303 532
Termination of future lease contract — — 89,500 —
Adjusted EBITDA $ 299,182 $ 77,308 $ 305,004 $ 16,706
Three months ended Year ended December 31, December 31, 2020 2019 2020 2019
Pinterest, Inc. Reconciliation of GAAP to non-GAAP financial results(in thousands) (unaudited)

21
1 Represents assumed noncumulative dividends on undistributed earnings that, if declared, would have been distributed to holders of our redeemable convertible preferred stock.
2 Gives effect to potential common stock instruments such as stock options, unvested restricted stock units and unvested restricted stock awards.
Three months ended Year ended December 31, December 31, 2020 2019 2020 2019
Reconciliation of net income (loss) to non-GAAP net income
Net income (loss) $ 207,841 $ (35,718) $ (128,323) $ (1,361,371)
Share-based compensation 86,219 112,200 321,020 1,377,781
Amortization of acquired intangible assets 252 384 1,013 1,495
Termination of future lease contract — — 89,500 —
Non-GAAP net income $ 294,312 $ 76,866 $ 283,210 $ 17,905
Non-GAAP net income $ 294,312 $ 76,866 $ 283,210 $ 17,905
Less: non-GAAP net income allocated to participating securities1 — — — (17,905)
Non-GAAP net income attributable to common stockholders $ 294,312 $ 76,866 $ 283,210 $ —
Weighted-average shares used in computing net income (loss) per share attributable to common stockholders:
Basic 618,214 562,396 596,264 420,473
Diluted 689,194 562,396 596,264 420,473
Net income (loss) per share attributable to common stockholders:
Basic $ 0.34 $ (0.06) $ (0.22) $ (3.24)
Diluted $ 0.30 $ (0.06) $ (0.22) $ (3.24)
Basic weighted-average shares used in computing net income (loss) per share attributable to common stockholders 618,214 562,396 596,264 420,473
Weighted-average dilutive securities2 70,980 77,165 72,701 —
Diluted weighted-average shares used in computing non-GAAP net income per share 689,194 639,561 668,965 420,473
Non-GAAP net income per share $ 0.43 $ 0.12 $ 0.42 $ —
Pinterest, Inc. Reconciliation of GAAP to non-GAAP financial results(in thousands, except per share amounts) (unaudited)