Embed Size (px)
Citation preview

Q4 2020 ResultsFebruary 2021

Safe Harbour
This presentation contains forward-looking statements that are based on our management’s current estimates, beliefs and assumptions, which are based on management’s perception of historic trends, current conditions and expected future developments, as well as other factors management believes are appropriate in the circumstances. Although we believe that the plans, intentions, expectations, assumptions and strategies reflected in these forward-looking statements are reasonable, these statements relate to future events or our future financial performance, and involve known and unknown risks, uncertainties and other factors that may cause our actual results to be materially different from any future results expressed or implied by these forward-looking statements. Although the forward-looking statements contained in this presentation are based upon what we believe are reasonable assumptions, investors are cautioned against placing undue reliance on these statements since actual results may vary from the forward-looking statements. Forward-looking statements involve known and unknown risks, uncertainties and other factors, which are, in some cases, beyond our control and which could materially affect our results. These risks are described in further detail our Management's Discussion and Analysis for the year ended December 31, 2020 and in the section entitled “Risk Factors” in our Annual Information Form for the year ended December 31, 2020 and elsewhere in our filings with regulatory agencies. If one or more of these risks or uncertainties occur, or if our underlying assumptions prove to be incorrect, actual results may vary significantly from those implied or projected by the forward-looking statements. References to long-term trends in our model are forward-looking and made as of the current date. Nothing in this presentation should be regarded as a representation by any person that these long-term trends will be achieved and we undertake no duty to update these long-term trends or any other forward-looking statements contained in this presentation, except as required by law.
We believe that the case studies presented in this presentation provide a representative sample of how our merchants have been able to use various features of our platform to grow their respective businesses. References in this presentation to increased visits, growth and sales following implementation of our platform do not necessarily mean that our platform was the only factor contributing to such increases.
To supplement the financial measures prepared in accordance with generally accepted accounting principles (GAAP), we use non-GAAP financial measures that exclude certain items. Non-GAAP financial measures are not prepared in accordance with GAAP; therefore, the information is not necessarily comparable to other companies and should be considered as a supplement to, not a substitute for, or superior to, the corresponding measures calculated in accordance with GAAP. Please refer to the slides titled “Non-GAAP Financial Measures” and “Reconciliation to GAAP Figures” for further information.
February 2021
2

Retail is changing.

4
One Platform, Every Channel, Any Device.

5
Inventory & Fulfillment ShippingOrder Management
AnalyticsMarketingPayments AppsCapital
Single IntegratedBack Office.

Our Market
6
Basic
Shopify
Advanced
Shopify Plus
Entrepreneurs
SMBs
Larger Brands
$29 per month
$79 per month
$299 per month
$2,000+ per month
Shopify is the entrepreneurship company for merchants of all sizes

TotalAddressableMarket
7
(1) Merchants defined as retailers with less than 500 employees. Includes commercially located businesses, sole proprietorships and home-based businesses. Does not include early-stage entrepreneurs or enterprises.
(2) Average revenue per merchant of approximately $2,258 based on ARPU for 2020 and 68 million retail businesses globally (Source: AMI Partners, 2020)
Anyone who wants to make more money from their site than they pay for it
Entrepreneur TAM
Larger BrandsTAM
$153BSMB TAM (1) (2)

Entrepreneurs
SMB’S
Larger Brands
Merchant Acquisition
8
Casting a very wide net
Shopify Plus Sales
Partners and Affiliates
Global Events
Content Marketing
Shopify Blog
Digital Advertising
Search Engine Marketing
Word of Mouth
Shopify POS Sales
Shopify Studios
Shopify Support

9
Entrepreneur
Merchant Profile
Jovana Mullins founded social impact fashion brand, Alivia, with the goal to give a voice to those with developmental disabilities by sharing their artwork and stories on every piece of clothing they sell.
Since joining the platform in early 2020, Alivia has used Shopify Payments, Shop Pay and Shopify Shipping to run their online store. The company has also sold its products through social media using Shopify’s multi-channel capabilities.

10
SMB
Merchant Profile
Pizza Pilgrims is a UK-based restaurant chain owned by brothers, Thom and James Elliot. When COVID-19 lockdowns closed their restaurants, they quickly pivoted to selling mailable pizza kits online.
During its time on the platform, Pizza Pilgrims has leveraged Shopify’s multi-channel capabilities to sell its products through social media. Pizza Pilgrims also uses Shopify Payments to process sales on its online store, offering Shop Pay, our accelerated checkout, as an option.

11
Larger Brands
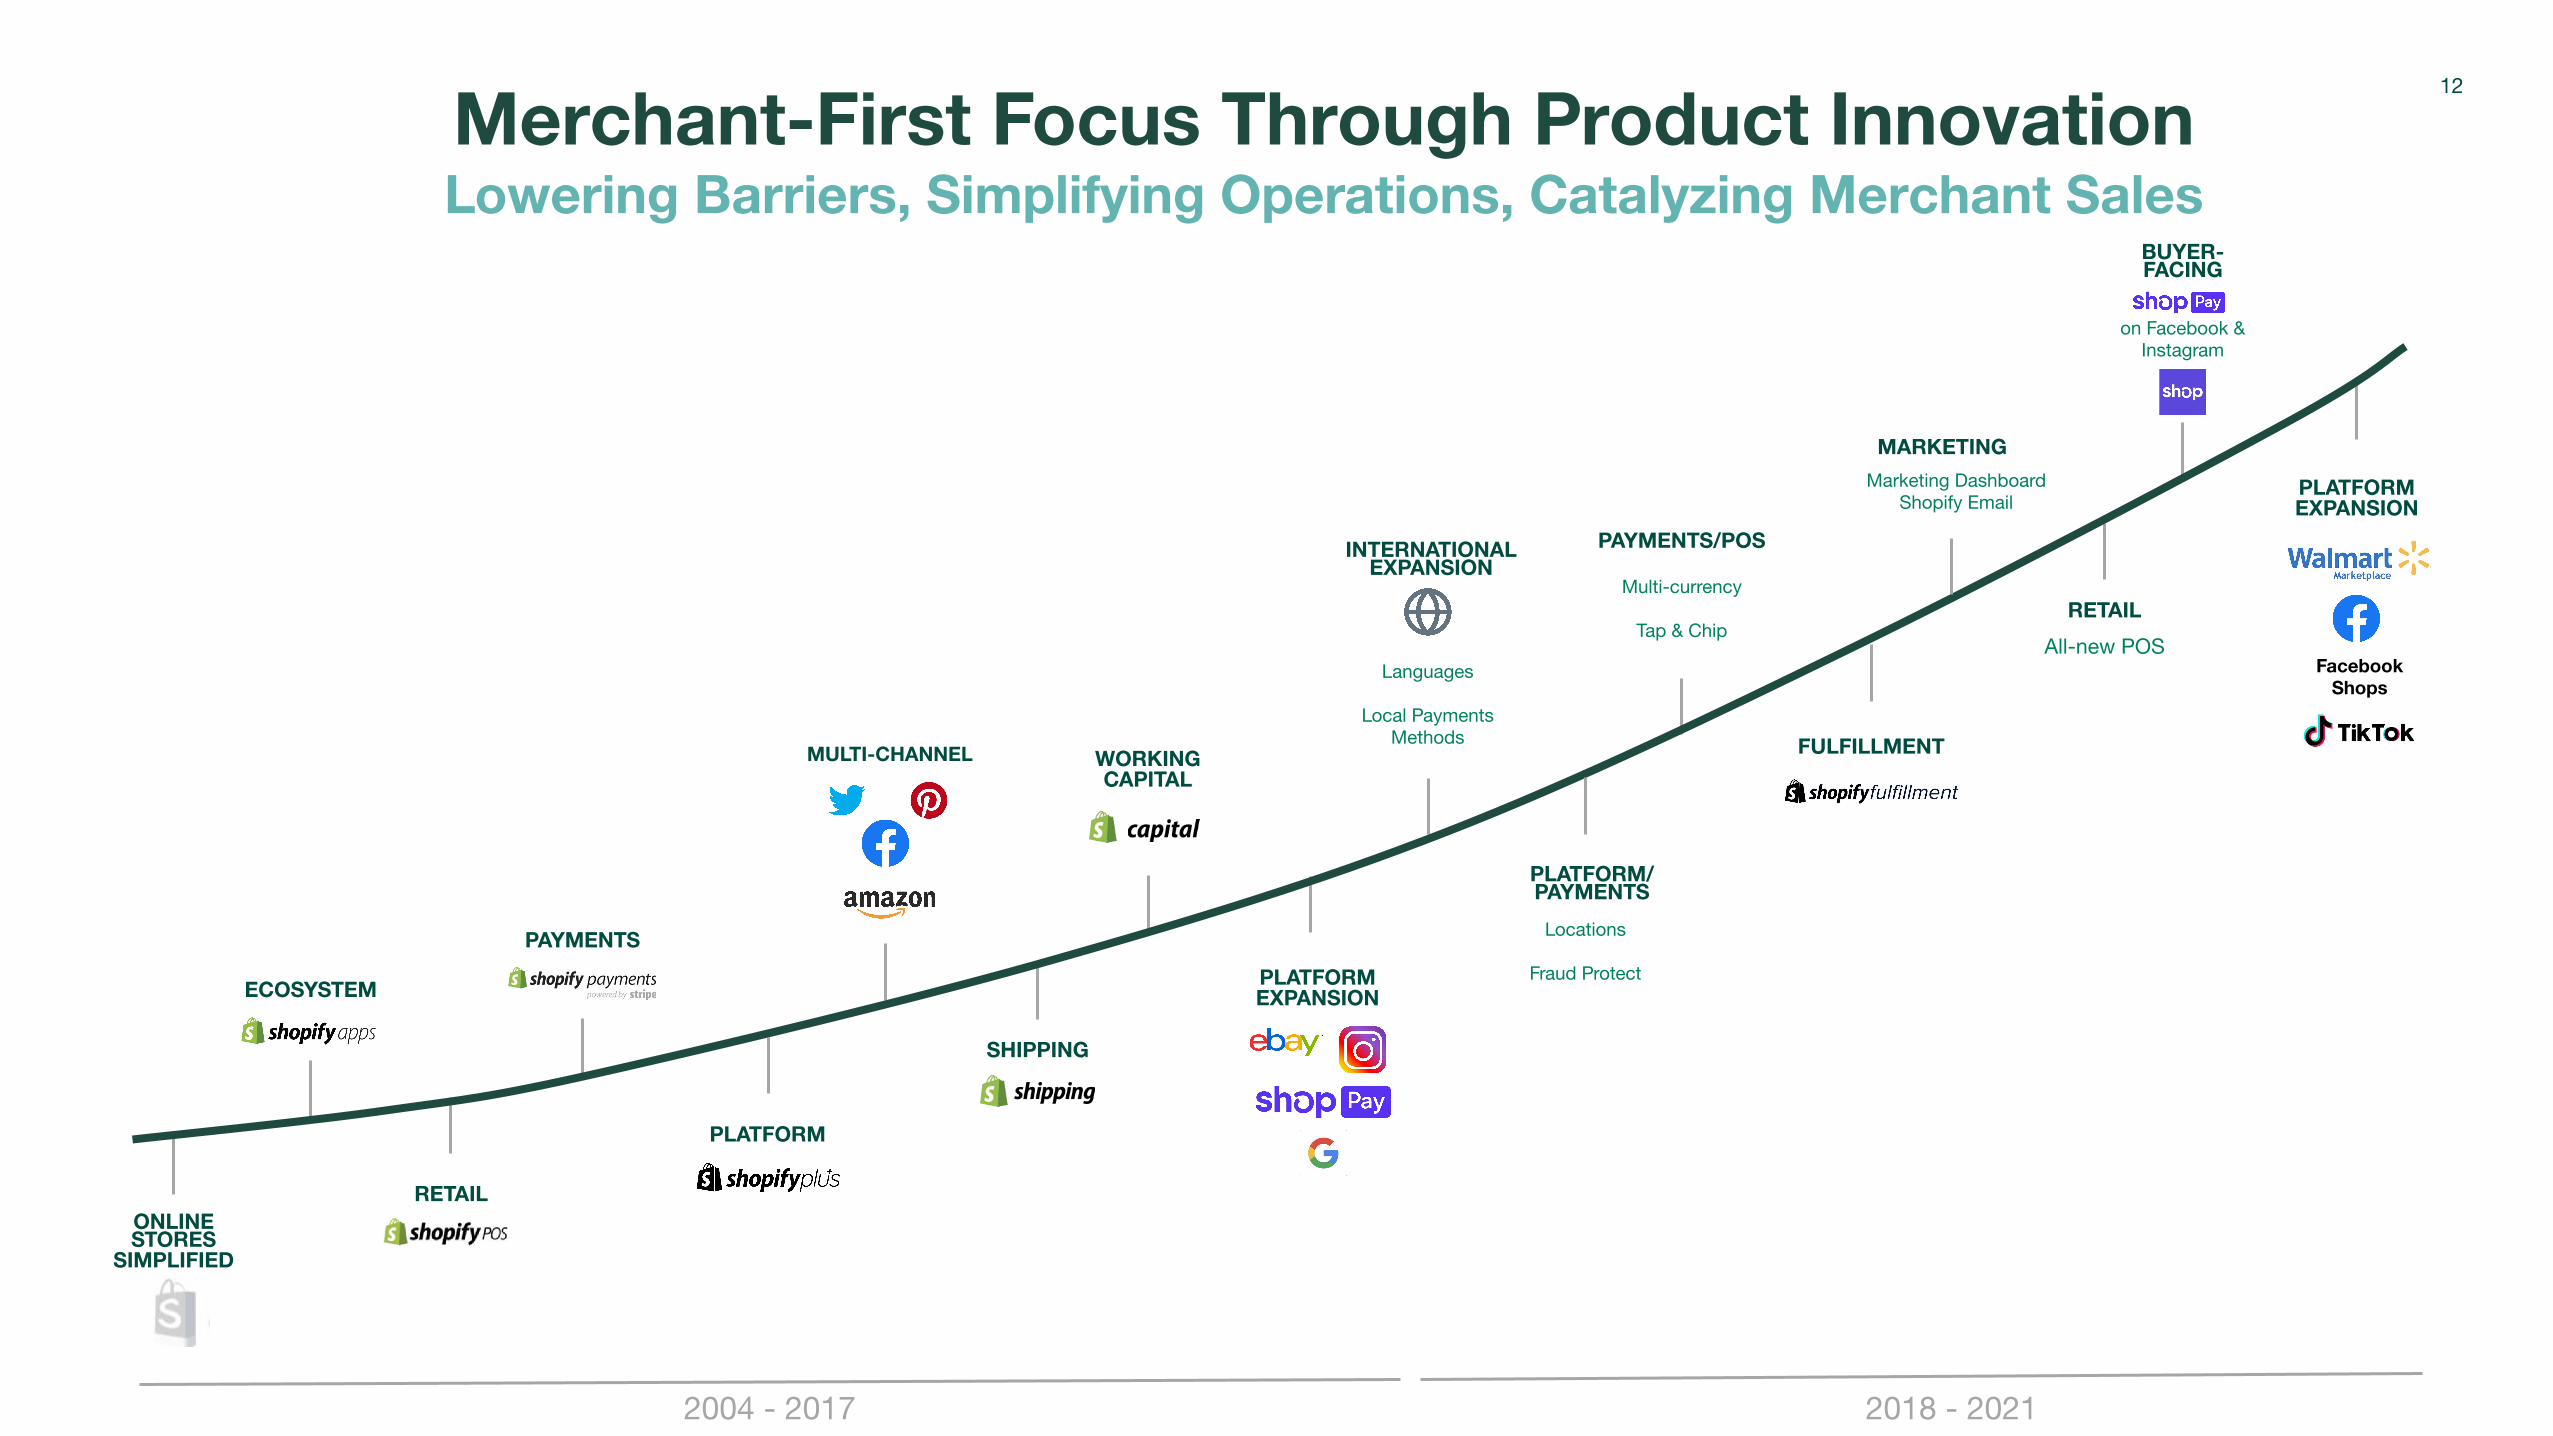
Merchant-First Focus Through Product InnovationLowering Barriers, Simplifying Operations, Catalyzing Merchant Sales
ONLINE STORES
SIMPLIFIED
ECOSYSTEM
RETAIL
PAYMENTS
PLATFORM
MULTI-CHANNEL
SHIPPING
WORKINGCAPITAL
PLATFORMEXPANSION
Languages
Local Payments Methods
INTERNATIONAL EXPANSION
PLATFORM/ PAYMENTS
Locations
Fraud Protect
Multi-currency
Tap & Chip
PAYMENTS/POS
FULFILLMENT
Marketing DashboardShopify Email
MARKETING
BUYER-FACING
All-new POS
RETAIL
2004 - 2017 2018 - 2021
PLATFORMEXPANSION
Facebook Shops
12
on Facebook & Instagram

Rich and Extensive Partner EcosystemExtending the Value of the Platform Beyond our Merchants
6,000
Apps extending product capabilities Referred at least one merchant to Shopify in the last 12 months
42,200Apps Ecosystem Partners
13

14
Growth-Minded Culture
Recruit talented, deeply caring individuals
Digital by Default allows employees to easily work offsite
Invest heavily in personal growth and development
Global reach

15
The Numbers

Strong & Competitive Market PositionShare of U.S. Retail eCommerce Sales 2020
Source: eMarketer, October 2020, Shopify* Market share based on Shopify’s 2020 US GMV (excluding merchant sales made through POS)

Strong Consistent Revenue GrowthWhen Our Merchants Succeed, Shopify Benefits
17
Subscription Solutions
Merchant Solutions
$505.2M
$977.7M+94%
$389.3M
$673.3M+73%
$1,073.2M+59%
$1,578.2M+47%
$2,929.5M+86%

MRR Growth Accelerated YoY in Q4 2020... Continued high number of new merchants joining the platform
in Q4 following record merchant additions in Q3
*Monthly Recurring Revenue, or MRR, is calculated at the end of each period by multiplying the number of merchants who have subscription plans with us at the period end date by the average monthly subscription plan fee in effect on the last day of that period, assuming they maintain their subscription plans the following month.
Q42015
$11.3M
Q42016
Q42017
49% CAGR
Q42018
Q42019
$82.6M
Q42020
18

66% 68% 66% 65% 63% 63% 62%
22%23%
23%23%
23% 24% 24%
14%13%
14%
11%
10%9%
12%
$133.6M
$183.2M
59%
22%
20%
$279.4M+53%
16%
21%
63%
…Contributing to a YoY Acceleration in Q4 Subscription Solutions Revenue Growth
*Approximate Apps, Themes, Domains, Shopify Plus Platform Fee Revenue is calculated by averaging current and previous quarter MRR, multiplying by 3 and subtracting total from Subscription Solutions revenue
Monthly Recurring Revenue - Core
Apps, Themes, Domains, Shopify Plus Platform Fee Revenue*
Monthly Recurring Revenue - Shopify Plus
19

Strong Consistent GMV Growth Merchants Are Joining, Scaling and Succeeding on Shopify
$26.3B+71%
$15.4B
$41.1B+56%
$61.1B+49%
*Gross Merchandise Volume, or GMV, represents the total dollar value of orders facilitated on the Shopify platform including certain apps and channels for which a revenue-sharing arrangement is in place in the period, net of refunds, and inclusive of shipping and handling, duty and value-added taxes.
$20.6B
$41.1B+99%
20
$119.6B+96%

*Excludes the effect of stock-based compensation (SBC) expenses and related payroll taxes, and amortization of acquired intangibles. Adjusted Gross Profit is a non-GAAP measure, see Appendix for reconciliation.
$263.9M
$510.6M+89%
$384.6M+83%
$210.5M
$603.6M+57%
$879.4M+46%
21
Strong Adjusted Gross Profit* Growth Powerful Business Model that Focuses on Gross Profit Dollar Growth
$1,568.5M+78%

Improving Operating Leverage*Strong Revenue Growth Backed By Disciplined Financial Management
*Operating leverage measured using Adjusted Operating Expenses as a percentage of revenue. Excludes the effect of stock-based compensation expenses and related payroll taxes, amortization of acquired intangibles, and impairment of right-of-use assets and leasehold improvements. Adjusted Operating Expenses is a non-GAAP measure, see Appendix for reconciliation. Numbers may not foot due to rounding.
32%
16%
8%
30%
16%
8%
32%
15%
7%
28%
16%
8%
19%
12%
6%
2% 2% 1% 2%
2%
53%39%
55%56%57%
48%
32%2%
5%
11%
24%15%
1%
8%
14%
22
Adjusted sales & marketing
Adjusted general & administrative
Adjusted research & development
Transaction & loan losses

Building For the Long TermAdding Energy to the Flywheel Through a Portfolio of Growth Investments
CoreExpansion
Ambition
PlatformShopify PaymentsShopify ShippingShopify CapitalShopify Plus
International ExpansionRetail POS
Shopify Fulfillment Network6 River SystemsShopify BalanceShop AppWholesale/B2B
Near-term initiatives
Medium-term initiatives
Long-term initiatives
23

Annual Cohorts Provide Strong Foundation for GrowthRevenue by Cohort
*Annual revenue from merchant cohorts that joined the Shopify platform in the period shown. **Note: the first year a merchant joins the platform may not be 12 full months and therefore is not fully comparable to the subsequent 12 month periods.
• Revenue growth within an annual cohort, driven by GMV growth and expanded wallet share, has offset revenue loss from merchants leaving the platform
• Total combined revenue of all previous cohorts has also grown consistently
Pre-2018
2018
2019
2020
24

Growth Investments Aimed at Energizing the Shopify Flywheel Well into the Future
Secular Tailwinds• E-commerce growth• Consumerization of
the enterprise• Rise of entrepreneurship
Opportunities• International• Share of Wallet• Machine Learning
More Merchants
MoreChannels, Partners &
Capabilities
More GMV
25

Investment Highlights
Large and GrowingOpportunity
Massive market with accelerated ecommerce penetration
World-classProduct
Multichannel commerce platform that enables merchants of all sizes to sell to anyone, anywhere
Powerful Business Model
Success-based business model that puts merchants first
Economies of Scale Innovation and Efficiencies
>1.7M merchants on the platform generating data that is leveraged to enhance and create new products and improve efficiencies for Shopify, our merchants and their buyers
VastEcosystem
Engaged and expanding partner ecosystem that is difficult to replicate
Mission DrivenProduct-driven team focused on making commerce better for everyone
Healthy Balance Sheet
Low-debt balance sheet with a proven, disciplined capital allocation approach
Significant Opportunity Ahead
Focus on investing in long-term growth while maintaining operational discipline and merchant-first orientation
26

Make commerce better for everyone.
27

28
Appendix

Non-GAAP Financial Measures
To supplement our consolidated financial statements, which are prepared and presented in accordance with U.S. generally accepted accounting principles ("GAAP"), Shopify
uses certain non-GAAP financial measures to provide additional information in order to assist investors in understanding our financial and operating performance.
Adjusted gross profit and non-GAAP operating expenses are non-GAAP financial measures that exclude the effect of stock-based compensation expenses and related payroll
taxes and amortization of acquired intangibles. Non-GAAP operating expenses also excludes an impairment of right-of-use assets and leasehold improvements.
Management uses non-GAAP financial measures internally for financial and operational decision-making and as a means to evaluate period-to-period comparisons. Shopify
believes that these non-GAAP measures provide useful information about operating results, enhance the overall understanding of past financial performance and future
prospects, and allow for greater transparency with respect to key metrics used by management in its financial and operational decision making. Non-GAAP financial
measures are not recognized measures for financial statement presentation under U.S. GAAP and do not have standardized meanings, and may not be comparable to similar
measures presented by other public companies. Such non-GAAP financial measures should be considered as a supplement to, and not as a substitute for, or superior to, the
corresponding measures calculated in accordance with GAAP. See the financial tables below for a reconciliation of the non-GAAP measures.
February 2021
29

Reconciliation of GAAP to Non-GAAP Figures
Expressed in US$000s
2018 2019 2020 Q4’19 Q4’20
GAAP Gross Profit 596,267 865,643 1,541,520 263,891 504,388
add: SBC and SBC-related payroll taxes 2,441 4,090 7,472 1,209 1,705
add: Amortization of Acquired Intangibles 4,914 9,624 19,488 4,820 4,532
Non-GAAP Gross Profit 603,622 879,357 1,568,480 269,920 510,625
% of Revenue 56% 56% 54% 53% 52%
GAAP Sales and marketing 350,069 472,841 602,048 132,063 154,728
less: Sales and marketing SBC and SBC-related payroll taxes 24,056 38,167 46,390 11,319 10,044
less: Amortization of Acquired Intangibles - 283 1,548 283 384
Non-GAAP Sales and Marketing 326,013 434,391 554,110 120,461 144,300
% of Revenue 30% 28% 19% 24% 15%
30

Expressed in US$000s2018 2019 2020 Q4’19 Q4’20
GAAP Research and development 230,674 355,015 552,127 102,753 159,077
less: Research and development SBC and SBC-related payroll taxes 59,575 104,645 188,249 32,361 54,262
less: Amortization of Acquired Intangibles - 232 233 58 59
Non-GAAP Research and development 171,099 250,138 363,645 70,334 104,756
% of Revenue 16% 16% 12% 14% 11%
GAAP General and administrative 99,196 153,765 245,343 50,518 65,395
less: General and administrative SBC and SBC-related payroll taxes 17,690 29,861 52,195 8,533 16,480
less: Impairment of right-of-use assets and leasehold improvements - - 31,623 - -
Non-GAAP General and administrative 81,506 123,904 161,525 41,985 48,915
% of Revenue 8% 8% 6% 8% 5%
GAAP Transaction and loan losses 8,248 25,169 51,849 8,636 12,647
% of Revenue 1% 2% 2% 2% 1%
GAAP Operating Expenses 688,187 1,006,790 1,451,367 293,970 391,847
less: Operating SBC and SBC-related payroll taxes 101,321 172,673 286,834 52,213 80,786
less: Amortization of Acquired Intangibles - 515 1,781 341 443
less: Impairment of right-of-use assets and leasehold improvements - - 31,623 - -
Non-GAAP Operating Expenses 586,866 833,602 1,131,129 241,416 310,618
% of Revenue 55% 53% 39% 48% 32%
31