Embed Size (px)
Citation preview

Q4/ 2015 Interim report January – December 2015
ContentsHighlights /01/
Interim report /02/Telenor’s operations /02/Group overview /08/Outlook for 2016 /10/
Interim condensed financial information /11/Notes to the interim consolidated financial statements /16/
Definitions /22/
TELENOR FOUTRH QUARTER 2015
/PAGE 1/
Highlights for Q4 2015
Telenor reported fourth-quarter revenues of NOK 33.5 billion and organic revenue growth of 2%. EBITDA before other items grew 10% organically to NOK 10.9 billion. The EBITDA margin was 32%. Telenor added 6.6 million mobile subscribers during the fourth quarter, taking the total number of customers to 203 million.
In Norway and Sweden, there are solid trends in the mobile consumer segment from increasing data usage and relevant offers. On the fixed side, both operations continued to grow their high-speed internet subscriber base, adding 107,000 connections during the year.
In Thailand, dtac added 400,000 customers during the quarter, with growth both in prepaid and contract segments. While competition remains intense, dtac continued its 3G and 4G network roll-out and has made significant quality and coverage improvements during 2015. Performance in Malaysia was hampered by intense competition on data and international calls, as well as a weakening currency.
Telenor’s operations in Bangladesh and Pakistan show strong performance, both in terms of subscriber growth and profitability.
Telenor Myanmar has made impressive progress in its first year of operation, and ended the year with 14 million subscribers.
Dividend proposal of NOK 7.50 per shareBased on the financial results for 2015, the Board of Directors will propose a dividend of 7.50 per share for 2015, to be paid out in two tranches. The proposal is in line with Telenor’s ambition to deliver a year over year growth in dividends.
Outlook for 2016Telenor expects continued healthy organic revenue growth for the Group in 2016, but fierce competition and headwinds in key markets like Thailand and Malaysia put pressure on EBITDA margin expectations. Investments will continue to be centred on the roll-out of high-speed mobile and fixed networks.
Based on this, the financial guidance for 2016 is organic revenue growth in the range of 2% to 4% and an EBITDA margin of 33% to 34%. The capex to sales ratio is expected to be 17% to 19%.
Key figures Telenor Group
Fourth quarter Year
(NOK in millions) 20152014
Re-presented 20152014
Re-presented
Revenues 33 487 30 440 128 175 111 443
Organic revenue growth (%) 2.3 4.7
EBITDA before other income and other expenses 10 860 9 318 44 197 38 496
EBITDA before other income and other expenses/Revenues (%) 32.4 30.6 34.5 34.5
Profit after taxes and non-controlling interests (2 125) 496 3 414 9 077
Capex excl. licences and spectrum/Revenues (%) 19.5 19.0 18.4 15.6
Mobile subscriptions - Change in quarter/Total (mill.) 6.6 6.9 203 186
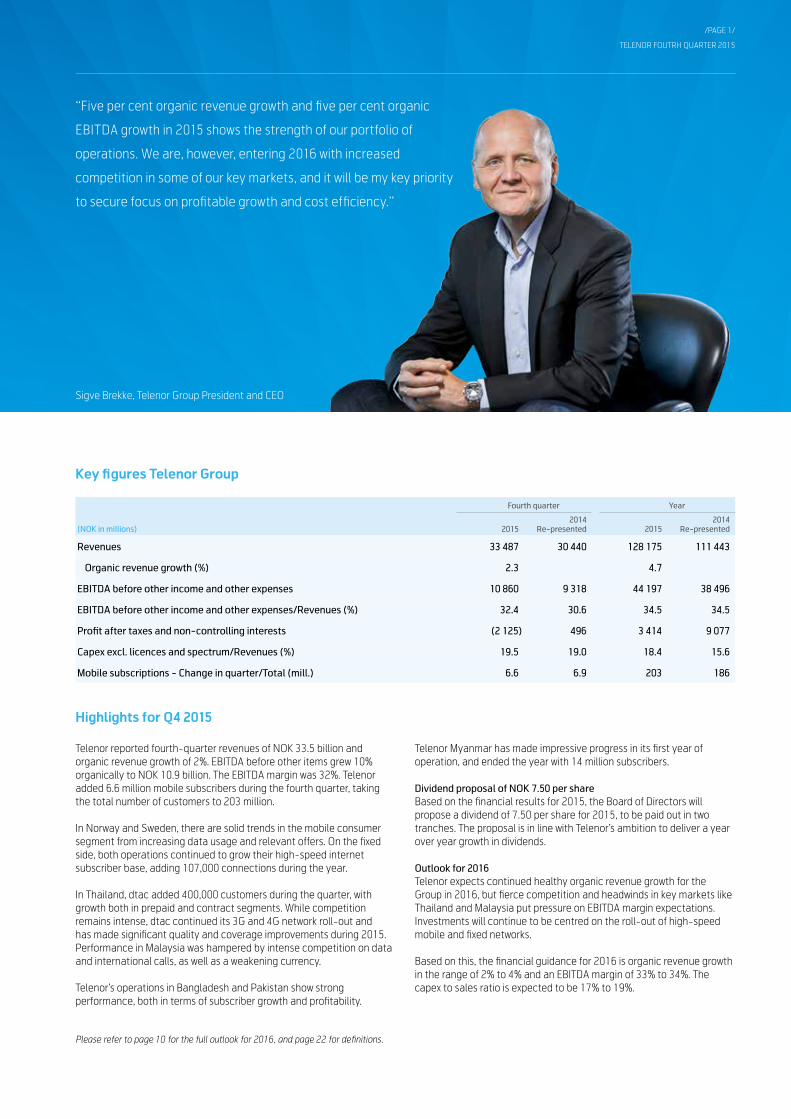
“Five per cent organic revenue growth and five per cent organic
EBITDA growth in 2015 shows the strength of our portfolio of
operations. We are, however, entering 2016 with increased
competition in some of our key markets, and it will be my key priority
to secure focus on profitable growth and cost efficiency.”
Please refer to page 10 for the full outlook for 2016, and page 22 for definitions.
Sigve Brekke, Telenor Group President and CEO
TELENOR FOURTH QUARTER 2015
/PAGE 2/
Norway
Fourth quarter Year
(NOK in millions) 2015 2014 2015 2014
Revenues mobile operation
Subscription and traffic 2 833 2 779 11 544 10 947
Interconnect revenues 161 206 745 809
Other mobile revenues 255 361 998 1 387
Non-mobile revenues 595 386 1 795 1 282
Total revenues mobile operation 3 844 3 731 15 082 14 426
Revenues fixed operation
Telephony 509 590 2 139 2 445
Internet and TV 1 350 1 359 5 414 5 357
Data services 128 118 506 464
Other fixed revenues 461 460 1 698 1 653
Total retail revenues 2 448 2 527 9 758 9 920
Wholesale revenues 427 472 1 703 1 840
Total revenues fixed operation 2 875 2 999 11 460 11 759
Total revenues 6 719 6 730 26 542 26 186
EBITDA before other items 2 617 2 747 11 088 11 255
Operating profit 1 673 1 807 7 218 7 430
EBITDA before other items/ Total revenues (%) 39.0 40.8 41.8 43.0
Capex 1 948 1 182 4 844 4 210
Investments in businesses - (2) - 9
Mobile ARPU - monthly (NOK) 314 309 320 305
Fixed Telephony ARPU 269 276 270 272
Fixed Internet ARPU 341 347 345 342
TV ARPU 295 287 291 280
No. of subscriptions - Change in quarter/Total (in thousands):
Mobile (28) 3 3 163 3 218
Fixed telephony (18) (25) 620 701
Fixed Internet 1 (4) 854 855
TV 1 1 527 531
• The number of mobile subscriptions decreased by 28,000 during the quarter, from a reduction in the number of data cards and prepaid subscriptions. At the end of the quarter, the subscription base was 2% lower than last year.
• The median data usage increased by 58% from fourth quarter last year, and is now 503 MB. The increase in data consumption continues to be driven by expansion of the 4G network and increasing 4G handset penetration.
• Mobile ARPU increased by 2% or NOK 5 from increased demand for bundled subscriptions with larger data volumes and increased share of contract subscriptions, more than offsetting the negative effects of reduced interconnect rates from 1 July and lower roaming prices.
• Mobile subscription and traffic revenues increased by 2%. Total mobile revenues increased by 3% as growth in service and handset revenues offset lower wholesale revenues.
• Total fixed revenues decreased by 4% primarily due to reduced revenues from fixed telephony and wholesale products. During the quarter, Telenor added 12,000 high-speed internet subscriptions, taking the total number of high-speed connections to 544,000.
• Total reported revenues were stable compared to last year.• EBITDA decreased by 5% and the EBITDA margin declined by 2
percentage points to 39%. Adjusted for one-time effects, EBITDA decreased by 2%, primarily explained by declining contribution from high-margin mobile wholesale and fixed telephony revenues.
• Capital expenditure was driven by continued 4G network expansion and fixed high-speed broadband roll-out, together with transforma-tion initiatives within the fixed business.
• In the fourth quarter, Telenor Norway acquired a spectrum licence for 2x20 MHz in the 1800 MHz frequency band for NOK 585 million. The licence is technology neutral and valid for 18 years.
• From 1 January 2016, the mobile interconnection rate was reduced from NOK 0.083 to NOK 0.075.
Interim report Telenor’s operations The comments below are related to Telenor’s development in the fourth quarter of 2015 compared to the fourth quarter of 2014, unless otherwise stated. All comments on EBITDA are made on development in EBITDA before other income and other expenses. Please refer to page 8 for ‘Specification of other income and other expenses’. Additional information is available at: www.telenor.com/ir
TELENOR FOURTH QUARTER 2015
/PAGE 3/
Sweden
Fourth quarter Year
(NOK in millions) 2015 2014 2015 2014
Revenues mobile operation
Subscription and traffic 1 575 1 424 5 944 5 636
Interconnect revenues 144 133 552 515
Other mobile revenues 94 95 367 332
Non-mobile revenues 758 672 2 553 2 112
Total revenues mobile operation 2 571 2 325 9 416 8 596
Revenues fixed operation 838 788 3 160 3 132
Total revenues 3 409 3 114 12 576 11 728
EBITDA before other items 954 785 3 667 3 489
Operating profit 546 341 2 094 1 900
EBITDA before other items/ Total revenues (%) 28.0 25.2 29.2 29.7
Capex 392 516 1 302 1 507
Investments in businesses - 4 3 754
Mobile ARPU - monthly (NOK) 227 208 213 205
No. of subscriptions - Change in quarter/Total (in thousands):
Mobile 44 19 2 548 2 509
Fixed telephony (11) (11) 244 311
Fixed Internet 3 (12) 639 642
TV 3 3 487 520
Exchange rate (SEK) 0.9572 0.9184
• The number of mobile subscriptions increased by 44,000 during the quarter, driven by continued growth in the business and contract consumer segments. The subscription base was 2% higher than at the end of fourth quarter last year.
• Mobile ARPU in local currency was stable as the solid trend in the contract consumer segment was offset by price pressure and discounts in the business segment.
• Total mobile revenues in local currency increased by 2%, primarily explained by higher handset sales and increased subscription and traffic revenues. Mobile subscription and traffic revenues increased by 2%.
• The number of fixed internet subscriptions increased by 3,000 in the quarter. A positive development in high-speed fibre was offset by continued negative development for ADSL. The number of TV subscribers increased by 3,000.
• Fixed revenues in local currency decreased by 2%, due to declining fixed telephony and DSL revenues.
• The EBITDA margin improved by 3 percentage points, primarily due to higher gross profit from the mobile business and lower operating costs following the completed integration of the acquired fixed business from Tele2. Adjusted for some one-time items, the EBITDA margin increased by 1 percentage point.
• Capital expenditure in the quarter was mainly related to network modernisation and 4G coverage through the joint operation Net4Mobility.
Denmark
Fourth quarter Year
(NOK in millions) 2015 2014 2015 2014
Revenues mobile operation
Subscription and traffic 773 734 3 001 2 907
Interconnect revenues 46 66 176 248
Other mobile revenues 42 17 83 68
Non-mobile revenues 411 382 1 300 1 111
Total revenues mobile operation 1 273 1 199 4 561 4 334
Revenues fixed operation 159 162 640 642
Total revenues 1 431 1 360 5 201 4 976
EBITDA before other items 137 176 591 726
Operating profit (loss) (2 212) (111) (2 516) (197)
EBITDA before other items/ Total revenues (%) 9.6 13.0 11.4 14.6
Capex 164 156 497 514
Investments in businesses - (1) - (14)
Mobile ARPU - monthly (NOK) 136 137 133 139
No. of subscriptions - Change in quarter/Total (in thousands):
Mobile (7) 24 1 997 1 953
Fixed telephony (5) 1 76 97
Fixed Internet (5) - 159 161
Exchange rate (DKK) 1.2004 1.1206
• The number of mobile subscriptions decreased by 7,000 during the quarter. Growth in the business segment was more than offset by a fall in the prepaid segment. The subscription base increased by 2% compared to fourth quarter last year.
• ARPU in local currency declined by 8% as a consequence of lower interconnect rates and conversion to lower priced tariffs following general lower market prices. Excluding the interconnect reduction, ARPU fell by 6%.
• Total revenues in local currency were reduced by 3% mainly as a result of lower mobile ARPU in addition to a 10% decline in fixed revenues. Mobile subscription and traffic revenues in local currency decreased by 3%.
• The EBITDA margin decreased by 3 percentage points, mainly explained by reduced mobile ARPU and increased operating expenditure related to ongoing projects.
• A turnaround process is being initiated following the withdrawal from the joint venture talks. However, the outlook for the Danish telecom market remains challenging, and in the fourth quarter of 2015, tangible and intangible assets in the amount of NOK 2.1 billion were impaired. See note 4 for details.
• The capital expenditure was mainly related to the ongoing network roll-out.
• See Other units for additional information on investments in common business support systems.
• Effective from 1 January 2016, the mobile termination rate was reduced from DKK 0.0602 to DKK 0.0541 per voice minute.
TELENOR FOURTH QUARTER 2015
/PAGE 4/
Hungary
Fourth quarter Year
(NOK in millions) 2015 2014 2015 2014
Revenues
Subscription and traffic 912 849 3 526 3 221
Interconnect revenues 75 151 349 562
Other mobile revenues 15 18 81 81
Non-mobile revenues 174 131 535 375
Total revenues 1 175 1 150 4 490 4 239
EBITDA before other items 280 279 1 382 1 375
Operating profit 105 129 760 851
EBITDA before other items/ Total revenues (%) 23.9 24.2 30.8 32.4
Capex 90 1 022 314 1 227
No. of subscriptions - Change in quarter/Total (in thousands): (37) 22 3 164 3 255
ARPU - monthly (NOK) 102 102 100 97
Exchange rate (HUF) 0.0289 0.0271
• The number of subscriptions decreased by 37,000 in the quarter mainly due to loss of prepaid customers. The subscription base was 3% lower than at the end of fourth quarter last year.
• ARPU in local currency decreased by 7% as a consequence of significant interconnect rate decrease from 1 April 2015. ARPU excluding interconnect increased by 2%.
• Total revenues in local currency decreased by 5%. The negative impact from lower interconnect revenues was partly offset by increased handset sales. Subscription and traffic revenues in local currency remained stable.
• The EBITDA margin decreased slightly due to increased business support system costs and higher frequency fees, partly offset by reduced handset subsidies. EBITDA in local currency decreased by 7%.
• Operating profit in local currency decreased by 27% following the EBITDA reduction together with higher depreciation and amortisation.
• Capital expenditure in local currency was 49% lower than fourth quarter last year mainly due to the higher 4G roll-out activity last year.
• See Other units for additional information on investments in common business support systems.
Bulgaria
Fourth quarter Year
(NOK in millions) 2015 2014 2015 2014
Revenues
Subscription and traffic 570 562 2 180 2 142
Interconnect revenues 55 38 195 142
Other mobile revenues 6 6 34 30
Non-mobile revenues 177 128 531 410
Total revenues 809 734 2 940 2 723
EBITDA before other items 295 253 1 134 1 041
Operating profit (loss) 184 38 615 (406)
EBITDA before other items/ Total revenues (%) 36.5 34.4 38.6 38.2
Capex 236 373 525 681
No. of subscriptions - Change in quarter/Total (in thousands): (179) (146) 3 583 3 901
ARPU - monthly (NOK) 57 50 52 48
Exchange rate (BGN) 4.5777 4.2711
• The number of subscriptions decreased by 179,000 in the quarter mainly due to a combination of seasonality, SIM consolidation and competitive pressure. The subscription base decreased by 8% compared to end of fourth quarter last year.
• Reported ARPU in local currency increased by 4%, mainly due to increased share of contract subscriptions and increased demand for high-end bundles in the contract consumer segment.
• Total reported revenues in local currency increased by 1%. Adjusted for one-time items related to recognition of prepaid vouchers in both quarters, subscription and traffic revenues in local currency decreased by 6% due to lower customer base.
• The EBITDA margin increased by 2 percentage points mainly due to operational efficiency efforts.
• Capital expenditure was mainly related to network roll-out, 4G launch and shops rebranding.
Montenegro & Serbia
Fourth quarter Year
(NOK in millions) 2015 2014 2015 2014
Revenues
Subscription and traffic 611 593 2 467 2 389
Interconnect revenues 215 194 790 699
Other mobile revenues 20 18 100 114
Non-mobile revenues 136 78 458 248
Total revenues 982 883 3 815 3 450
EBITDA before other items 314 287 1 329 1 293
Operating profit 197 187 902 913
EBITDA before other items/ Total revenues (%) 32.0 32.5 34.8 37.5
Capex 459 120 776 322
No. of subscriptions - Change in quarter/Total (in thousands): (150) (70) 3 443 3 585
ARPU - monthly (NOK) 79 72 77 73
Exchange rate (RSD) 0.0742 0.0712
Exchange rate (EUR) 8.9530 8.3534
TELENOR FOURTH QUARTER 2015
/PAGE 5/
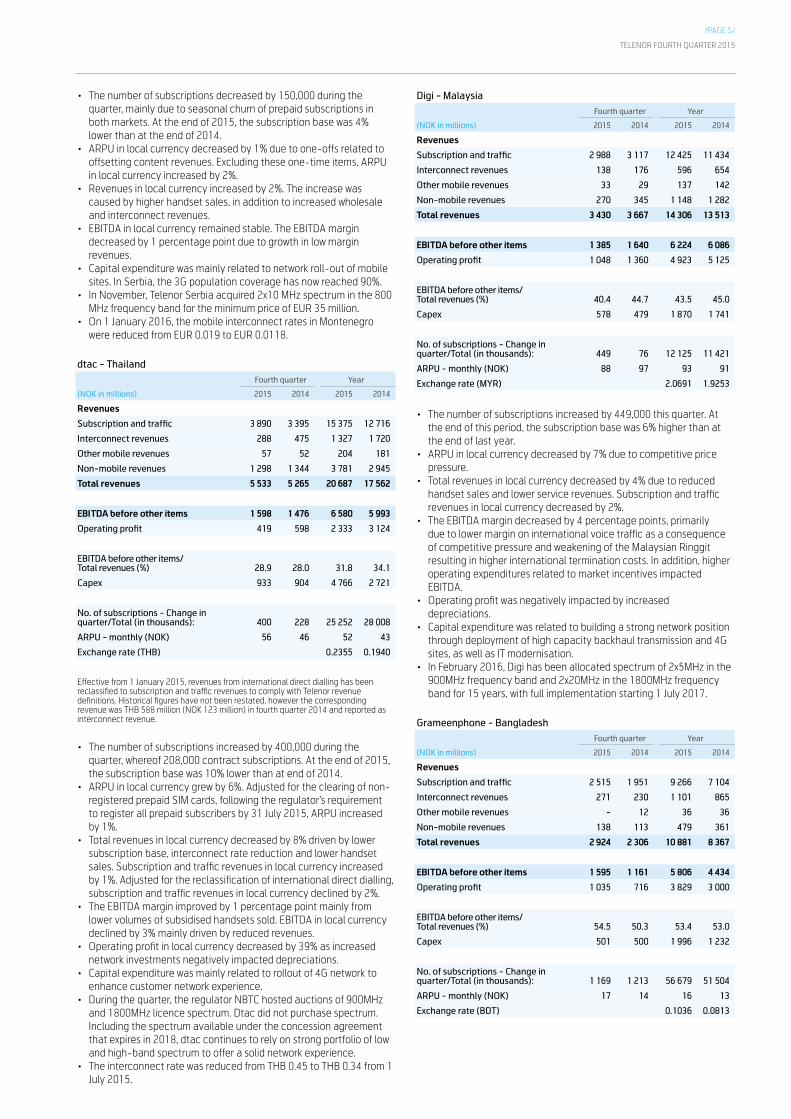
• The number of subscriptions decreased by 150,000 during the quarter, mainly due to seasonal churn of prepaid subscriptions in both markets. At the end of 2015, the subscription base was 4% lower than at the end of 2014.
• ARPU in local currency decreased by 1% due to one-offs related to offsetting content revenues. Excluding these one-time items, ARPU in local currency increased by 2%.
• Revenues in local currency increased by 2%. The increase was caused by higher handset sales, in addition to increased wholesale and interconnect revenues.
• EBITDA in local currency remained stable. The EBITDA margin decreased by 1 percentage point due to growth in low margin revenues.
• Capital expenditure was mainly related to network roll-out of mobile sites. In Serbia, the 3G population coverage has now reached 90%.
• In November, Telenor Serbia acquired 2x10 MHz spectrum in the 800 MHz frequency band for the minimum price of EUR 35 million.
• On 1 January 2016, the mobile interconnect rates in Montenegro were reduced from EUR 0.019 to EUR 0.0118.
dtac - Thailand
Fourth quarter Year
(NOK in millions) 2015 2014 2015 2014
Revenues
Subscription and traffic 3 890 3 395 15 375 12 716
Interconnect revenues 288 475 1 327 1 720
Other mobile revenues 57 52 204 181
Non-mobile revenues 1 298 1 344 3 781 2 945
Total revenues 5 533 5 265 20 687 17 562
EBITDA before other items 1 598 1 476 6 580 5 993
Operating profit 419 598 2 333 3 124
EBITDA before other items/Total revenues (%) 28.9 28.0 31.8 34.1
Capex 933 904 4 766 2 721
No. of subscriptions - Change in quarter/Total (in thousands): 400 228 25 252 28 008
ARPU - monthly (NOK) 56 46 52 43
Exchange rate (THB) 0.2355 0.1940
Effective from 1 January 2015, revenues from international direct dialling has been reclassified to subscription and traffic revenues to comply with Telenor revenue definitions. Historical figures have not been restated, however the corresponding revenue was THB 588 million (NOK 123 million) in fourth quarter 2014 and reported as interconnect revenue.
• The number of subscriptions increased by 400,000 during the quarter, whereof 208,000 contract subscriptions. At the end of 2015, the subscription base was 10% lower than at end of 2014.
• ARPU in local currency grew by 6%. Adjusted for the clearing of non-registered prepaid SIM cards, following the regulator’s requirement to register all prepaid subscribers by 31 July 2015, ARPU increased by 1%.
• Total revenues in local currency decreased by 8% driven by lower subscription base, interconnect rate reduction and lower handset sales. Subscription and traffic revenues in local currency increased by 1%. Adjusted for the reclassification of international direct dialling, subscription and traffic revenues in local currency declined by 2%.
• The EBITDA margin improved by 1 percentage point mainly from lower volumes of subsidised handsets sold. EBITDA in local currency declined by 3% mainly driven by reduced revenues.
• Operating profit in local currency decreased by 39% as increased network investments negatively impacted depreciations.
• Capital expenditure was mainly related to rollout of 4G network to enhance customer network experience.
• During the quarter, the regulator NBTC hosted auctions of 900MHz and 1800MHz licence spectrum. Dtac did not purchase spectrum. Including the spectrum available under the concession agreement that expires in 2018, dtac continues to rely on strong portfolio of low and high-band spectrum to offer a solid network experience.
• The interconnect rate was reduced from THB 0.45 to THB 0.34 from 1 July 2015.
Digi - Malaysia
Fourth quarter Year
(NOK in millions) 2015 2014 2015 2014
Revenues
Subscription and traffic 2 988 3 117 12 425 11 434
Interconnect revenues 138 176 596 654
Other mobile revenues 33 29 137 142
Non-mobile revenues 270 345 1 148 1 282
Total revenues 3 430 3 667 14 306 13 513
EBITDA before other items 1 385 1 640 6 224 6 086
Operating profit 1 048 1 360 4 923 5 125
EBITDA before other items/Total revenues (%) 40.4 44.7 43.5 45.0
Capex 578 479 1 870 1 741
No. of subscriptions - Change in quarter/Total (in thousands): 449 76 12 125 11 421
ARPU - monthly (NOK) 88 97 93 91
Exchange rate (MYR) 2.0691 1.9253
• The number of subscriptions increased by 449,000 this quarter. At the end of this period, the subscription base was 6% higher than at the end of last year.
• ARPU in local currency decreased by 7% due to competitive price pressure.
• Total revenues in local currency decreased by 4% due to reduced handset sales and lower service revenues. Subscription and traffic revenues in local currency decreased by 2%.
• The EBITDA margin decreased by 4 percentage points, primarily due to lower margin on international voice traffic as a consequence of competitive pressure and weakening of the Malaysian Ringgit resulting in higher international termination costs. In addition, higher operating expenditures related to market incentives impacted EBITDA.
• Operating profit was negatively impacted by increased depreciations.
• Capital expenditure was related to building a strong network position through deployment of high capacity backhaul transmission and 4G sites, as well as IT modernisation.
• In February 2016, Digi has been allocated spectrum of 2x5MHz in the 900MHz frequency band and 2x20MHz in the 1800MHz frequency band for 15 years, with full implementation starting 1 July 2017.
Grameenphone - Bangladesh
Fourth quarter Year
(NOK in millions) 2015 2014 2015 2014
Revenues
Subscription and traffic 2 515 1 951 9 266 7 104
Interconnect revenues 271 230 1 101 865
Other mobile revenues - 12 36 36
Non-mobile revenues 138 113 479 361
Total revenues 2 924 2 306 10 881 8 367
EBITDA before other items 1 595 1 161 5 806 4 434
Operating profit 1 035 716 3 829 3 000
EBITDA before other items/Total revenues (%) 54.5 50.3 53.4 53.0
Capex 501 500 1 996 1 232
No. of subscriptions - Change in quarter/Total (in thousands): 1 169 1 213 56 679 51 504
ARPU - monthly (NOK) 17 14 16 13
Exchange rate (BDT) 0.1036 0.0813

TELENOR FOURTH QUARTER 2015
/PAGE 6/
• The number of subscriptions increased by 1.2 million during the quarter. At the end of the quarter, the subscription base was 10% higher than the same quarter last year.
• ARPU in local currency decreased by 6% due to price pressure on voice products and subscription acquisition from lower revenue generating segments, partly compensated by increasing data usage. Subscription and traffic revenues in local currency increased by 5%.
• Total revenues in local currency increased by 3% mainly driven by strong subscription growth, data and value added services, partly offset by reduced ARPU.
• The EBITDA margin increased by 4 percentage points mainly due to improved efficiency in both market spending and operation and maintenance.
• Capital expenditure was prioritised towards expanding 3G network coverage and capacity. At the end of the quarter, 3G population coverage was 71%.
Pakistan
Fourth quarter Year
(NOK in millions) 2015 2014 2015 2014
Revenues
Subscription and traffic 1 488 1 225 5 699 4 535
Interconnect revenues 264 134 874 495
Other mobile revenues 15 8 48 29
Non-mobile revenues 283 214 1 146 740
Total revenues 2 049 1 581 7 766 5 798
EBITDA before other items 878 493 3 152 2 112
Operating profit 584 260 2 069 1 297
EBITDA before other items/Total revenues (%) 42.9 31.2 40.6 36.4
Capex 558 641 1 442 2 301
No. of subscriptions - Change in quarter/Total (in thousands): 1 319 126 34 563 36 503
ARPU - monthly (NOK) 17 12 16 12
Exchange rate (PKR) 0.0785 0.0624
• The number of subscriptions increased by 1.3 million during the quarter. The subscription base was 5% lower than the same quarter last year, still impacted by the disconnection of unverified SIM cards in the second quarter of 2015.
• ARPU in local currency increased by 15%, primarily due to the disconnection of unverified SIM cards in the second quarter and increased incoming international traffic.
• Total revenues in local currency increased by 8%, supported by continued growth in financial services and higher ARPU. Subscription and traffic revenues in local currency increased by 1%.
• The EBITDA margin increased by 12 percentage points including the positive effects of the abolishment of the SIM Activation tax with effect from 1 July 2015, in addition to improved revenue growth, lower energy costs from efficiency initiatives and one time effects.
• Capital expenditure was prioritised towards expanding 3G network coverage and capacity. At the end of the quarter, the 3G population coverage was 46%.
India
Fourth quarter Year
(NOK in millions) 2015 2014 2015 2014
Revenues
Subscription and traffic 1 234 993 4 795 3 513
Interconnect revenues 191 183 750 649
Other mobile revenues 8 8 33 29
Non-mobile revenues 3 2 14 9
Total revenues 1 436 1 187 5 592 4 200
EBITDA before other items 41 (97) (47) (422)
Operating profit (loss) (368) (285) (990) 882
Capex 489 130 1 046 1 374
No. of subscriptions - Change in quarter/Total (in thousands)*): 1 764 2 303 42 619 36 665
ARPU - monthly (NOK) 11 11 12 11
Exchange rate (INR) 0.1258 0.1032
*) Please note that the definition for active subscriptions in the Indian operation is more conservative than the Group definition on page 22, due to high churn in the Indian market. Subscriptions are counted as active if there has been activity during the last 30 days.
• The subscription base increased by 1.8 million during the quarter. At the end 2015, the subscription base was 16% higher than at the end of 2014.
• ARPU in local currency fell by 13% to INR 88 primarily driven by lower voice consumption and the impact from reduced mobile termination rate, partly compensated by increased data usage.
• Total revenues in local currency increased by 3%. Subscription and traffic revenues in local currency increased by 5%.
• EBITDA was impacted by positive one off items in the quarter, offset by continued activities to promote the new brand following the rebranding from Uninor to Telenor in September. Adjusted for these effects, the underlying EBITDA was slightly positive.
• The network modernisation initiated in the third quarter continued in the fourth quarter and impacted the capex for the quarter, as well as accelerated depreciations of current network assets amounting to NOK 181 million. This is expected to continue over the next 12-15 months.
Myanmar
Fourth quarter Year
(NOK in millions) 2015 2014 2015 2014
Revenues
Subscription and traffic 1 220 222 3 973 225
Interconnect revenues 262 41 781 41
Other mobile revenues 7 2 19 2
Non-mobile revenues 4 21 63 22
Total revenues 1 493 287 4 835 290
EBITDA before other items 610 (248) 1 921 (508)
Operating profit (loss) 393 (336) 1 342 (605)
EBITDA before other items/ Total revenues (%) 40.8 nm 39.7 nm
Capex 743 598 3 382 4 281
No. of subscriptions - Change in quarter/Total (in thousands): 1 891 3 125 13 683 3 406
ARPU - monthly (NOK) 40 42 44 40
Exchange rate (MMK) 0.0068 0.0064

TELENOR FOURTH QUARTER 2015
/PAGE 7/
• Telenor Myanmar added 1.9 million new subscriptions during the fourth quarter. By the end of the fourth quarter a total of 13.7 million subscriptions were recorded.
• ARPU was MMK 5,995, which is 4% lower than the normalised ARPU for the third quarter. The decline in ARPU was triggered by tougher competition, coupled by network expansion into low ARPU rural areas.
• Revenues in local currency increased by 14% compared to normalised revenues for the third quarter this year, driven by strong subscription growth.
• The EBITDA for the fourth quarter was driven by the continued growth in subscription and usage. The EBITDA margin for the quarter increased by 3 percentage points compared to the normalised margin for the third quarter.
• Capital expenditure remained high in the quarter, with the continued ambition to expand network coverage across the country, coupled by enhanced capacity to cater for the strong demand for voice and data. At the end of the fourth quarter a total of 4,173 sites were put on air, adding a total of 1,048 sites during the quarter.
Broadcast
Fourth quarter Year
(NOK in millions) 2015 2014 2015 2014
Revenues
Canal Digital DTH 1 172 1 135 4 572 4 494
Satellite Broadcasting 256 244 1 012 959
Norkring 286 287 1 120 1 156
Conax - - - 166
Other/Eliminations (117) (115) (468) (467)
Total revenues 1 597 1 550 6 236 6 309
EBITDA before other items
Canal Digital DTH 196 181 781 728
Satellite Broadcasting 170 165 670 650
Norkring 147 122 607 559
Conax - - - 49
Other/Eliminations (6) (9) (26) (36)
Total EBITDA before other items 507 458 2 032 1 951
Operating profit
Canal Digital DTH 182 151 735 611
Satellite Broadcasting 86 107 388 421
Norkring 74 63 325 309
Conax - - - 41
Other/Eliminations (6) (10) (26) 1 174
Total operating profit 336 310 1 422 2 556
EBITDA before other items/ Total revenues (%) 31.7 29.5 32.6 30.9
Capex 90 79 1 785 407
No. of subscriptions - Change in quarter/Total (in thousands):
DTH TV (3) (1) 897 912
• Total revenues increased by 3 % from the fourth quarter last year, while EBITDA increased by 11% and the EBITDA margin improved 2 percentage points.
• Revenues in Canal Digital DTH increased by 3% due to currency effects. The effects of a lower DTH subscriber base and lower hardware sales were mainly compensated by price increases. The EBITDA margin was 17% and 1 percentage point higher than the same quarter last year, mainly driven by positive currency effects on revenues.
• Revenues in Satellite increased by 5% mainly due to currency effects on revenues, while the EBITDA margin was 1 percentage point below last year due to higher operating cost.
• Revenues in Norkring were on level with the fourth quarter last year as revenue growth from radio and TV transmission was offset by an accounting adjustment related to installation revenues. EBITDA increased by 20 % as revenue reduction was compensated by lower cost.
• Capital expenditure increased due to higher network investments in Norkring.
Other units
Fourth quarter Year
(NOK in millions) 2015 2014 2015 2014
Revenues
Global Wholesale 610 643 2 676 2 204
Corporate functions 772 647 2 741 2 508
Other / eliminations 330 337 1 249 1 141
Total revenues 1 713 1 627 6 666 5 854
EBITDA before other items
Global Wholesale 23 157 243 347
Corporate functions (460) (317) (1 251) (985)
Other / eliminations 86 84 347 341
Total EBITDA before other items (351) (76) (661) (297)
Operating profit (loss)
Global Wholesale 19 149 211 314
Corporate functions (605) (441) (1 728) (1 545)
Other / eliminations 61 88 273 284
Total operating profit (loss) (525) (204) (1 244) (948)
Capex 243 58 647 523
Investments in businesses 65 280 500 732
• In Global Wholesale, revenues and EBITDA decreased mainly due to price reductions for traffic into Pakistan.
• Revenues in Corporate functions increased due to higher internal trade related to services and systems. EBITDA decreased due to increased corporate activities, also including strategy and transformation processes.
• Operating profit decreased mainly due to gain realised from sale of a business unit in 2014.
• NOK 141 million were invested in the development of new business support systems for Denmark and Hungary in the fourth quarter. This investment accumulates to NOK 576 million.
• Investments in businesses in 2015 and 2014 were mainly related to the financing of joint ventures in online classifieds (SnT Classifieds and Search units) in cooperation with Schibsted Classifieds Media, Singapore Press Holdings and Naspers Limited.
TELENOR FOURTH QUARTER 2015
/PAGE 8/
Group overview
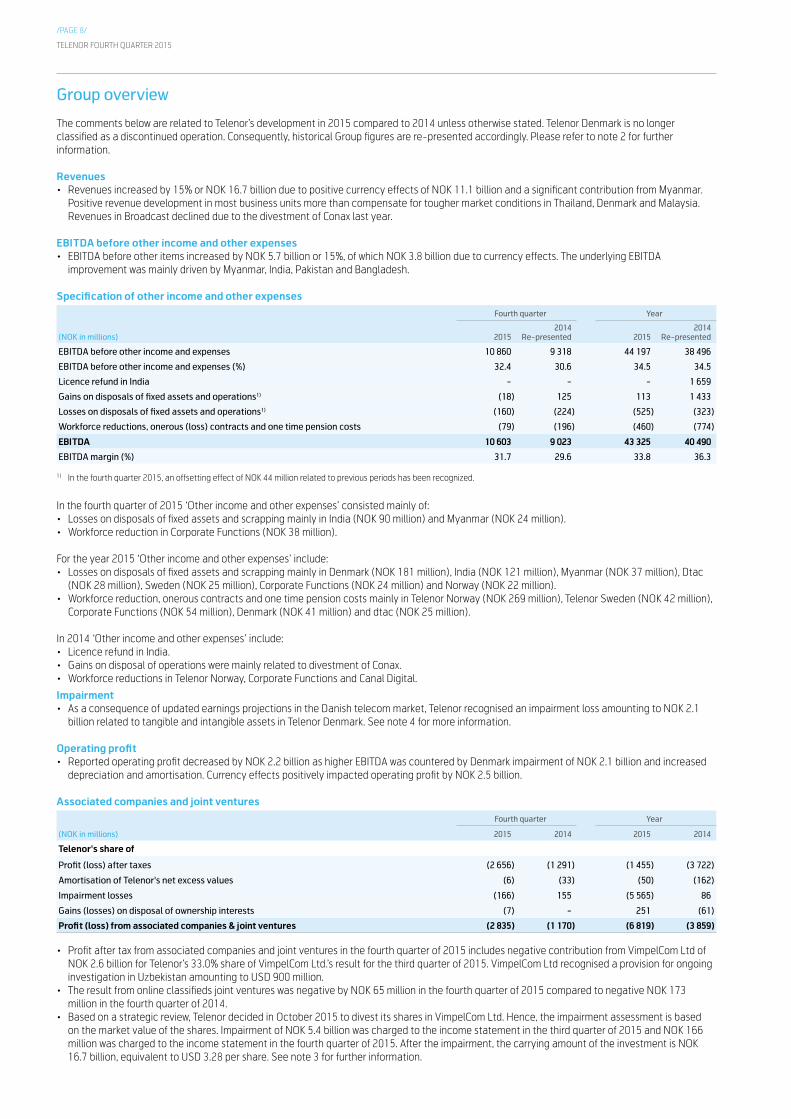
The comments below are related to Telenor’s development in 2015 compared to 2014 unless otherwise stated. Telenor Denmark is no longer classified as a discontinued operation. Consequently, historical Group figures are re-presented accordingly. Please refer to note 2 for further information.
Revenues• Revenues increased by 15% or NOK 16.7 billion due to positive currency effects of NOK 11.1 billion and a significant contribution from Myanmar.
Positive revenue development in most business units more than compensate for tougher market conditions in Thailand, Denmark and Malaysia. Revenues in Broadcast declined due to the divestment of Conax last year.
EBITDA before other income and other expenses• EBITDA before other items increased by NOK 5.7 billion or 15%, of which NOK 3.8 billion due to currency effects. The underlying EBITDA
improvement was mainly driven by Myanmar, India, Pakistan and Bangladesh.
Specification of other income and other expenses
Fourth quarter Year
(NOK in millions) 20152014
Re-presented 20152014
Re-presented
EBITDA before other income and expenses 10 860 9 318 44 197 38 496
EBITDA before other income and expenses (%) 32.4 30.6 34.5 34.5
Licence refund in India - - - 1 659
Gains on disposals of fixed assets and operations1) (18) 125 113 1 433
Losses on disposals of fixed assets and operations1) (160) (224) (525) (323)
Workforce reductions, onerous (loss) contracts and one time pension costs (79) (196) (460) (774)
EBITDA 10 603 9 023 43 325 40 490
EBITDA margin (%) 31.7 29.6 33.8 36.3
1) In the fourth quarter 2015, an offsetting effect of NOK 44 million related to previous periods has been recognized.
In the fourth quarter of 2015 ‘Other income and other expenses’ consisted mainly of:• Losses on disposals of fixed assets and scrapping mainly in India (NOK 90 million) and Myanmar (NOK 24 million).• Workforce reduction in Corporate Functions (NOK 38 million).
For the year 2015 ‘Other income and other expenses’ include:• Losses on disposals of fixed assets and scrapping mainly in Denmark (NOK 181 million), India (NOK 121 million), Myanmar (NOK 37 million), Dtac
(NOK 28 million), Sweden (NOK 25 million), Corporate Functions (NOK 24 million) and Norway (NOK 22 million).• Workforce reduction, onerous contracts and one time pension costs mainly in Telenor Norway (NOK 269 million), Telenor Sweden (NOK 42 million),
Corporate Functions (NOK 54 million), Denmark (NOK 41 million) and dtac (NOK 25 million). In 2014 ‘Other income and other expenses’ include:• Licence refund in India. • Gains on disposal of operations were mainly related to divestment of Conax.• Workforce reductions in Telenor Norway, Corporate Functions and Canal Digital.
Impairment• As a consequence of updated earnings projections in the Danish telecom market, Telenor recognised an impairment loss amounting to NOK 2.1
billion related to tangible and intangible assets in Telenor Denmark. See note 4 for more information.
Operating profit• Reported operating profit decreased by NOK 2.2 billion as higher EBITDA was countered by Denmark impairment of NOK 2.1 billion and increased
depreciation and amortisation. Currency effects positively impacted operating profit by NOK 2.5 billion.
Associated companies and joint ventures
Fourth quarter Year
(NOK in millions) 2015 2014 2015 2014
Telenor's share of
Profit (loss) after taxes (2 656) (1 291) (1 455) (3 722)
Amortisation of Telenor's net excess values (6) (33) (50) (162)
Impairment losses (166) 155 (5 565) 86
Gains (losses) on disposal of ownership interests (7) - 251 (61)
Profit (loss) from associated companies & joint ventures (2 835) (1 170) (6 819) (3 859)
• Profit after tax from associated companies and joint ventures in the fourth quarter of 2015 includes negative contribution from VimpelCom Ltd of NOK 2.6 billion for Telenor’s 33.0% share of VimpelCom Ltd.’s result for the third quarter of 2015. VimpelCom Ltd recognised a provision for ongoing investigation in Uzbekistan amounting to USD 900 million.
• The result from online classifieds joint ventures was negative by NOK 65 million in the fourth quarter of 2015 compared to negative NOK 173 million in the fourth quarter of 2014.
• Based on a strategic review, Telenor decided in October 2015 to divest its shares in VimpelCom Ltd. Hence, the impairment assessment is based on the market value of the shares. Impairment of NOK 5.4 billion was charged to the income statement in the third quarter of 2015 and NOK 166 million was charged to the income statement in the fourth quarter of 2015. After the impairment, the carrying amount of the investment is NOK 16.7 billion, equivalent to USD 3.28 per share. See note 3 for further information.
TELENOR FOURTH QUARTER 2015
/PAGE 9/
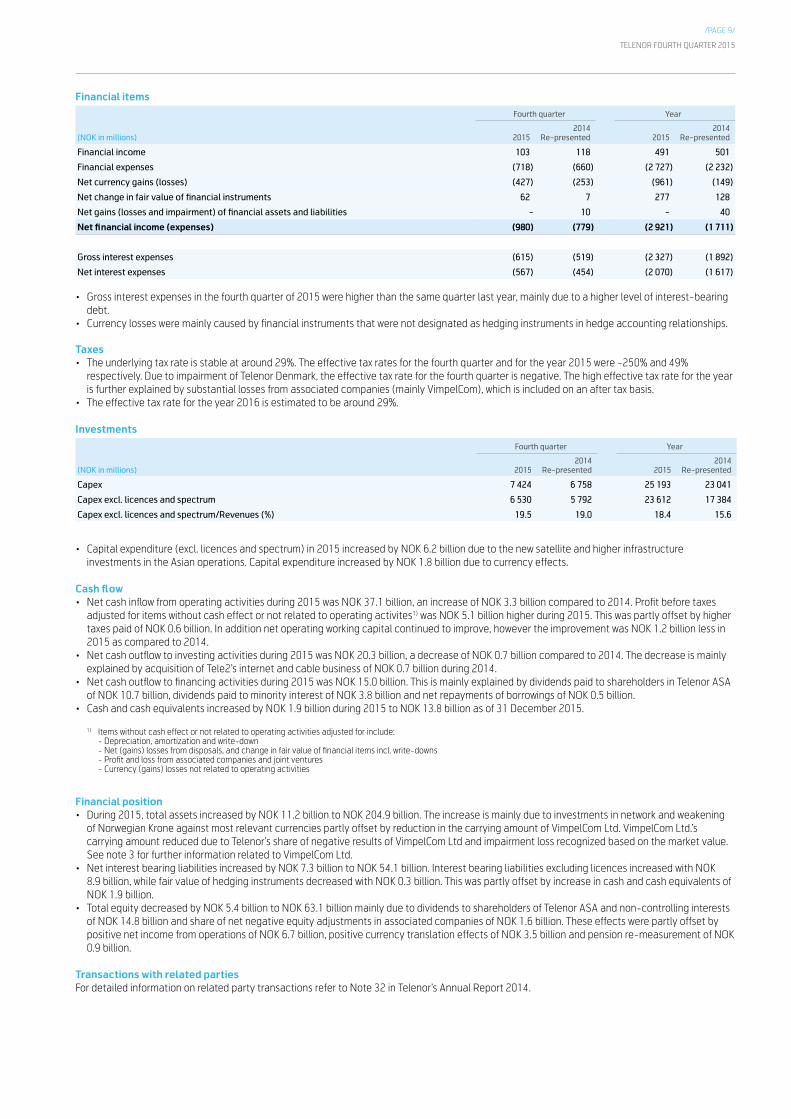
Financial items
Fourth quarter Year
(NOK in millions) 20152014
Re-presented 20152014
Re-presented
Financial income 103 118 491 501
Financial expenses (718) (660) (2 727) (2 232)
Net currency gains (losses) (427) (253) (961) (149)
Net change in fair value of financial instruments 62 7 277 128
Net gains (losses and impairment) of financial assets and liabilities - 10 - 40
Net financial income (expenses) (980) (779) (2 921) (1 711)
Gross interest expenses (615) (519) (2 327) (1 892)
Net interest expenses (567) (454) (2 070) (1 617)
• Gross interest expenses in the fourth quarter of 2015 were higher than the same quarter last year, mainly due to a higher level of interest-bearing debt.
• Currency losses were mainly caused by financial instruments that were not designated as hedging instruments in hedge accounting relationships.
Taxes• The underlying tax rate is stable at around 29%. The effective tax rates for the fourth quarter and for the year 2015 were -250% and 49%
respectively. Due to impairment of Telenor Denmark, the effective tax rate for the fourth quarter is negative. The high effective tax rate for the year is further explained by substantial losses from associated companies (mainly VimpelCom), which is included on an after tax basis.
• The effective tax rate for the year 2016 is estimated to be around 29%.
Investments
Fourth quarter Year
(NOK in millions) 20152014
Re-presented 20152014
Re-presented
Capex 7 424 6 758 25 193 23 041
Capex excl. licences and spectrum 6 530 5 792 23 612 17 384
Capex excl. licences and spectrum/Revenues (%) 19.5 19.0 18.4 15.6
• Capital expenditure (excl. licences and spectrum) in 2015 increased by NOK 6.2 billion due to the new satellite and higher infrastructure investments in the Asian operations. Capital expenditure increased by NOK 1.8 billion due to currency effects.
Cash flow• Net cash inflow from operating activities during 2015 was NOK 37.1 billion, an increase of NOK 3.3 billion compared to 2014. Profit before taxes
adjusted for items without cash effect or not related to operating activites1) was NOK 5.1 billion higher during 2015. This was partly offset by higher taxes paid of NOK 0.6 billion. In addition net operating working capital continued to improve, however the improvement was NOK 1.2 billion less in 2015 as compared to 2014.
• Net cash outflow to investing activities during 2015 was NOK 20.3 billion, a decrease of NOK 0.7 billion compared to 2014. The decrease is mainly explained by acquisition of Tele2’s internet and cable business of NOK 0.7 billion during 2014.
• Net cash outflow to financing activities during 2015 was NOK 15.0 billion. This is mainly explained by dividends paid to shareholders in Telenor ASA of NOK 10.7 billion, dividends paid to minority interest of NOK 3.8 billion and net repayments of borrowings of NOK 0.5 billion.
• Cash and cash equivalents increased by NOK 1.9 billion during 2015 to NOK 13.8 billion as of 31 December 2015.
1) Items without cash effect or not related to operating activities adjusted for include: - Depreciation, amortization and write-down - Net (gains) losses from disposals, and change in fair value of financial items incl. write-downs - Profit and loss from associated companies and joint ventures - Currency (gains) losses not related to operating activities
Financial position• During 2015, total assets increased by NOK 11.2 billion to NOK 204.9 billion. The increase is mainly due to investments in network and weakening
of Norwegian Krone against most relevant currencies partly offset by reduction in the carrying amount of VimpelCom Ltd. VimpelCom Ltd.’s carrying amount reduced due to Telenor’s share of negative results of VimpelCom Ltd and impairment loss recognized based on the market value. See note 3 for further information related to VimpelCom Ltd.
• Net interest bearing liabilities increased by NOK 7.3 billion to NOK 54.1 billion. Interest bearing liabilities excluding licences increased with NOK 8.9 billion, while fair value of hedging instruments decreased with NOK 0.3 billion. This was partly offset by increase in cash and cash equivalents of NOK 1.9 billion.
• Total equity decreased by NOK 5.4 billion to NOK 63.1 billion mainly due to dividends to shareholders of Telenor ASA and non-controlling interests of NOK 14.8 billion and share of net negative equity adjustments in associated companies of NOK 1.6 billion. These effects were partly offset by positive net income from operations of NOK 6.7 billion, positive currency translation effects of NOK 3.5 billion and pension re-measurement of NOK 0.9 billion.
Transactions with related partiesFor detailed information on related party transactions refer to Note 32 in Telenor’s Annual Report 2014.
TELENOR FOURTH QUARTER 2015
/PAGE 10/
Dividends for 2015
The Telenor Board of Directors will propose a dividend of NOK 4.00 per share (NOK 6.0 billion) to be resolved by the general meeting in May 2016, and paid out in May 2016. In addition, the Board will ask the general meeting for an authority to resolve further dividends, pursuant to which the Board plans to resolve a dividend of NOK 3.50 per share (NOK 5.3 billion) to be paid in November 2016. In total this will bring the ordinary dividend for the fiscal year 2015 to NOK 7.50 per share (NOK 11.3 billion).
Outlook for 2016
Based on the current Group structure, Telenor expects:• Organic revenue growth in the range of 2%-4%.• EBITDA margin before other income and other expenses in the range of 33%-34%. • Capital expenditure as a proportion of revenues, excluding licences and spectrum, in the range of 17%-19%.
Risk and uncertaintiesThe existing risks and uncertainties described below are expected to remain for the next three months.
A growing share of Telenor’s revenues and profits is derived from operations outside Norway. Currency fluctuations may influence the reported figures in Norwegian Kroner to an increasing extent. Political risk, including regulatory conditions, may also influence the results.
For additional explanations regarding risks and uncertainties, please refer to the Report of the Board of Directors for 2014, section Risk Factors and Risk Management, and Telenor’s Annual Report 2014 Note 28 Managing Capital and Financial Risk Management and Note 33 Legal Disputes and Contingencies. Readers are also referred to the disclaimer at the end of this section.
New developments of risks and uncertainties since the publication of Telenor’s Annual Report for 2014 are:
Legal disputesSee note 7 for details.
Financial aspectsIn relation to the licence issuance in Myanmar, a performance bond of USD 180 million has been issued to Myanmar authorities as a guarantee towards coverage and quality of service commitments during the next four years of the licence.
Canal Digital and US based Discovery are currently in a dispute with regards to TV channels in Norway, Sweden and Denmark which has led to a temporary removal of certain TV programmes.
DisclaimerThis report contains statements regarding the future in connection with Telenor’s growth initiatives, profit figures, outlook, strategies and objectives. In particular, the section ‘Outlook for 2016’ contains forward-looking statements regarding the Group’s expectations. All statements regarding the future are subject to inherent risks and uncertainties, and many factors can lead to actual profits and developments deviating substantially from what has been expressed or implied in such statements.
Fornebu, 9 February 2016The Board of Directors of Telenor ASA
TELENOR FOURTH QUARTER 2015
/PAGE 11/
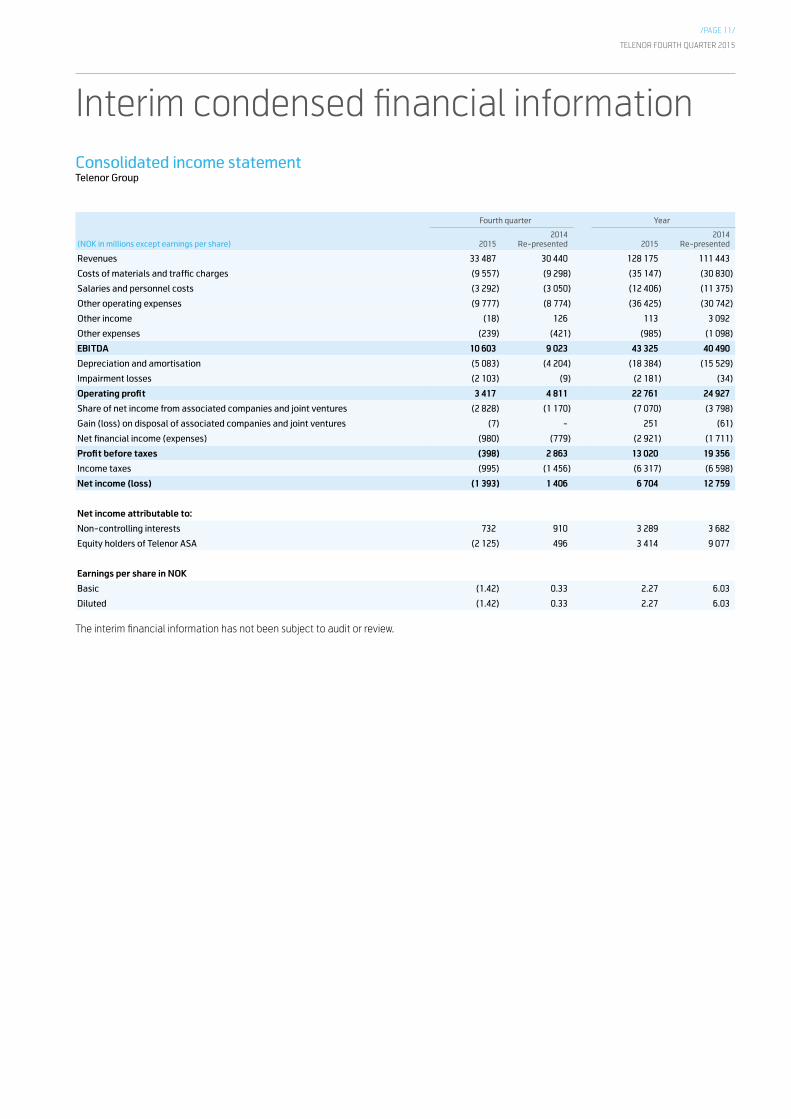
Consolidated income statementTelenor Group
Fourth quarter Year
(NOK in millions except earnings per share) 20152014
Re-presented 20152014
Re-presented
Revenues 33 487 30 440 128 175 111 443
Costs of materials and traffic charges (9 557) (9 298) (35 147) (30 830)
Salaries and personnel costs (3 292) (3 050) (12 406) (11 375)
Other operating expenses (9 777) (8 774) (36 425) (30 742)
Other income (18) 126 113 3 092
Other expenses (239) (421) (985) (1 098)
EBITDA 10 603 9 023 43 325 40 490
Depreciation and amortisation (5 083) (4 204) (18 384) (15 529)
Impairment losses (2 103) (9) (2 181) (34)
Operating profit 3 417 4 811 22 761 24 927
Share of net income from associated companies and joint ventures (2 828) (1 170) (7 070) (3 798)
Gain (loss) on disposal of associated companies and joint ventures (7) - 251 (61)
Net financial income (expenses) (980) (779) (2 921) (1 711)
Profit before taxes (398) 2 863 13 020 19 356
Income taxes (995) (1 456) (6 317) (6 598)
Net income (loss) (1 393) 1 406 6 704 12 759
Net income attributable to:
Non-controlling interests 732 910 3 289 3 682
Equity holders of Telenor ASA (2 125) 496 3 414 9 077
Earnings per share in NOK
Basic (1.42) 0.33 2.27 6.03
Diluted (1.42) 0.33 2.27 6.03
The interim financial information has not been subject to audit or review.
Interim condensed financial information
TELENOR FOURTH QUARTER 2015
/PAGE 12/
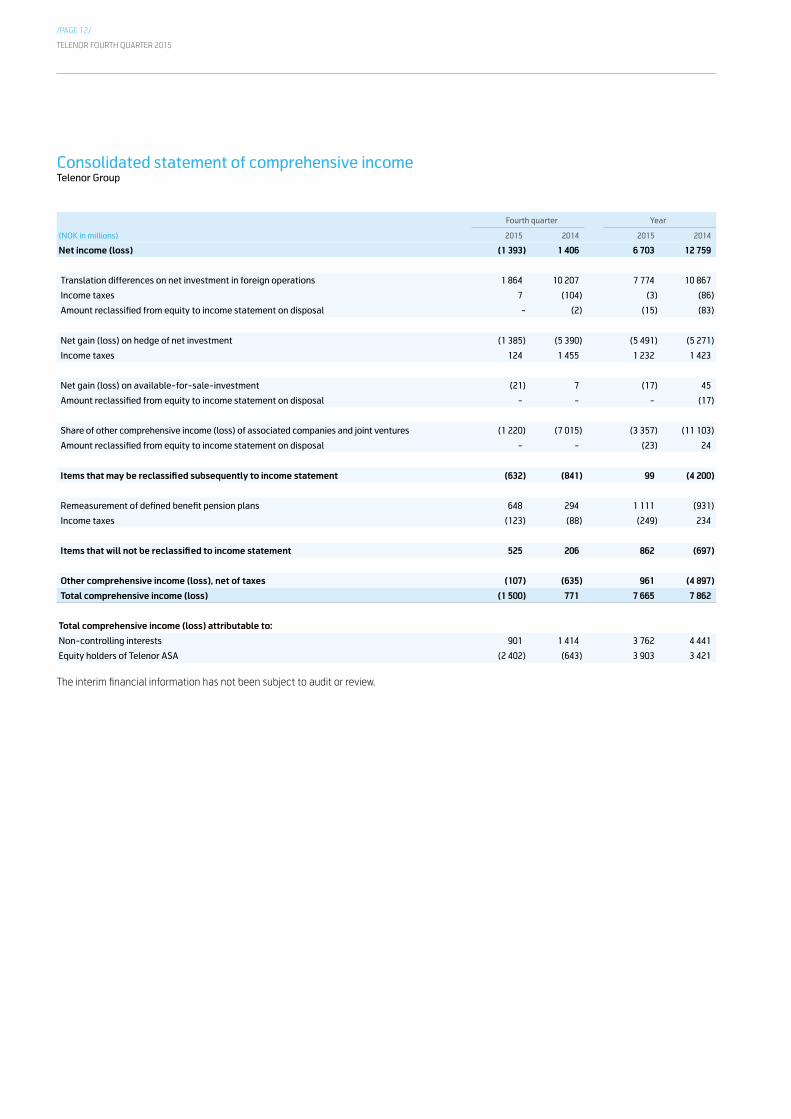
Consolidated statement of comprehensive income Telenor Group
Fourth quarter Year
(NOK in millions) 2015 2014 2015 2014
Net income (loss) (1 393) 1 406 6 703 12 759
Translation differences on net investment in foreign operations 1 864 10 207 7 774 10 867
Income taxes 7 (104) (3) (86)
Amount reclassified from equity to income statement on disposal - (2) (15) (83)
Net gain (loss) on hedge of net investment (1 385) (5 390) (5 491) (5 271)
Income taxes 124 1 455 1 232 1 423
Net gain (loss) on available-for-sale-investment (21) 7 (17) 45
Amount reclassified from equity to income statement on disposal - - - (17)
Share of other comprehensive income (loss) of associated companies and joint ventures (1 220) (7 015) (3 357) (11 103)
Amount reclassified from equity to income statement on disposal - - (23) 24
Items that may be reclassified subsequently to income statement (632) (841) 99 (4 200)
Remeasurement of defined benefit pension plans 648 294 1 111 (931)
Income taxes (123) (88) (249) 234
Items that will not be reclassified to income statement 525 206 862 (697)
Other comprehensive income (loss), net of taxes (107) (635) 961 (4 897)
Total comprehensive income (loss) (1 500) 771 7 665 7 862
Total comprehensive income (loss) attributable to:
Non-controlling interests 901 1 414 3 762 4 441
Equity holders of Telenor ASA (2 402) (643) 3 903 3 421
The interim financial information has not been subject to audit or review.
TELENOR FOURTH QUARTER 2015
/PAGE 13/
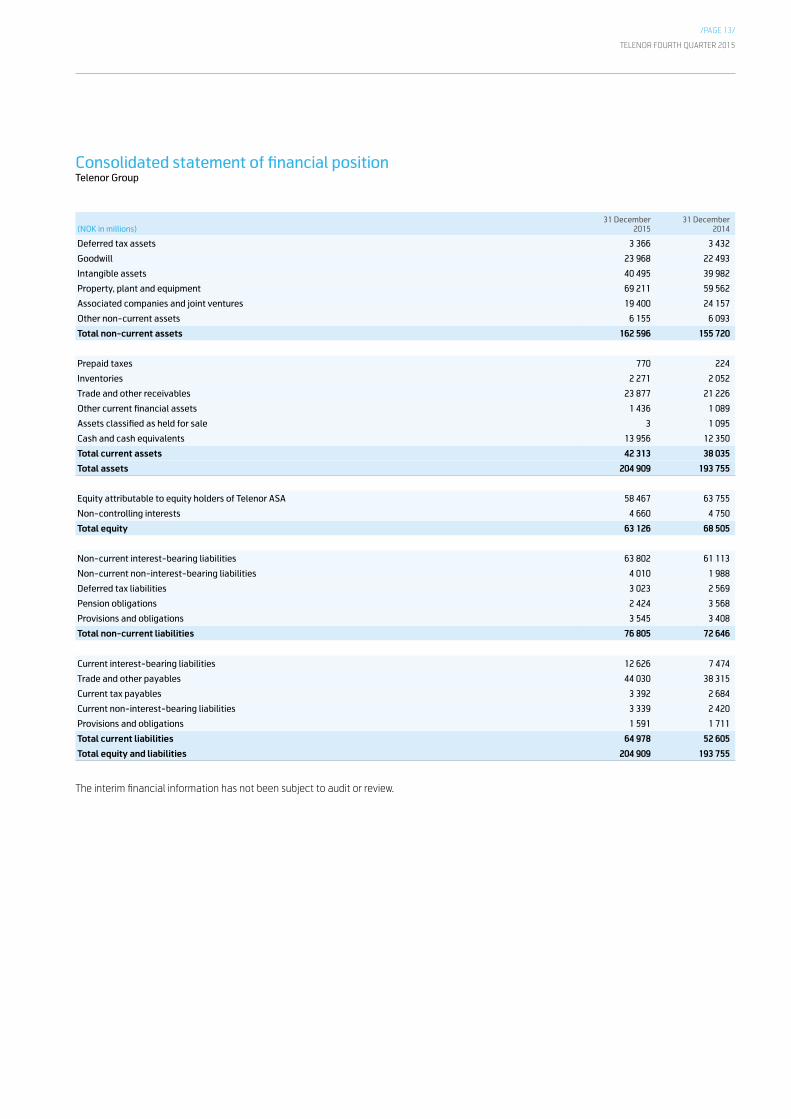
Consolidated statement of financial position Telenor Group
(NOK in millions)31 December
201531 December
2014
Deferred tax assets 3 366 3 432
Goodwill 23 968 22 493
Intangible assets 40 495 39 982
Property, plant and equipment 69 211 59 562
Associated companies and joint ventures 19 400 24 157
Other non-current assets 6 155 6 093
Total non-current assets 162 596 155 720
Prepaid taxes 770 224
Inventories 2 271 2 052
Trade and other receivables 23 877 21 226
Other current financial assets 1 436 1 089
Assets classified as held for sale 3 1 095
Cash and cash equivalents 13 956 12 350
Total current assets 42 313 38 035
Total assets 204 909 193 755
Equity attributable to equity holders of Telenor ASA 58 467 63 755
Non-controlling interests 4 660 4 750
Total equity 63 126 68 505
Non-current interest-bearing liabilities 63 802 61 113
Non-current non-interest-bearing liabilities 4 010 1 988
Deferred tax liabilities 3 023 2 569
Pension obligations 2 424 3 568
Provisions and obligations 3 545 3 408
Total non-current liabilities 76 805 72 646
Current interest-bearing liabilities 12 626 7 474
Trade and other payables 44 030 38 315
Current tax payables 3 392 2 684
Current non-interest-bearing liabilities 3 339 2 420
Provisions and obligations 1 591 1 711
Total current liabilities 64 978 52 605
Total equity and liabilities 204 909 193 755
The interim financial information has not been subject to audit or review.
TELENOR FOURTH QUARTER 2015
/PAGE 14/
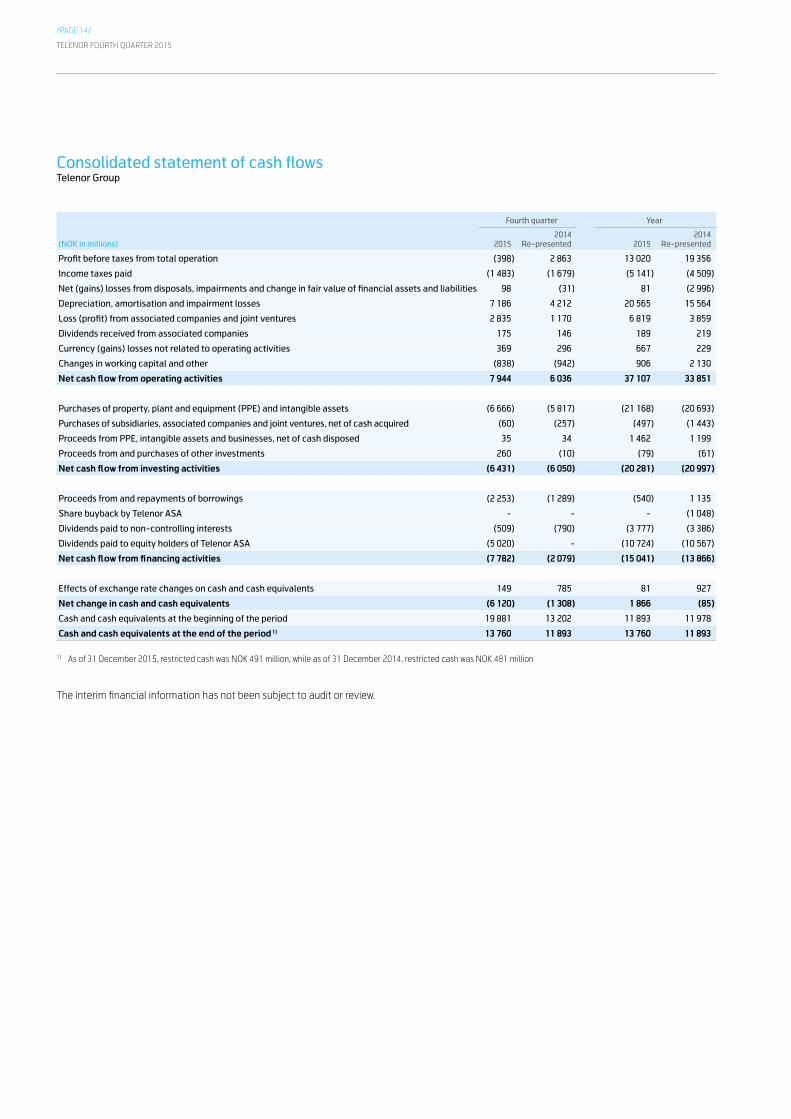
Consolidated statement of cash flows Telenor Group
Fourth quarter Year
(NOK in millions) 20152014
Re-presented 20152014
Re-presented
Profit before taxes from total operation (398) 2 863 13 020 19 356
Income taxes paid (1 483) (1 679) (5 141) (4 509)
Net (gains) losses from disposals, impairments and change in fair value of financial assets and liabilities 98 (31) 81 (2 996)
Depreciation, amortisation and impairment losses 7 186 4 212 20 565 15 564
Loss (profit) from associated companies and joint ventures 2 835 1 170 6 819 3 859
Dividends received from associated companies 175 146 189 219
Currency (gains) losses not related to operating activities 369 296 667 229
Changes in working capital and other (838) (942) 906 2 130
Net cash flow from operating activities 7 944 6 036 37 107 33 851
Purchases of property, plant and equipment (PPE) and intangible assets (6 666) (5 817) (21 168) (20 693)
Purchases of subsidiaries, associated companies and joint ventures, net of cash acquired (60) (257) (497) (1 443)
Proceeds from PPE, intangible assets and businesses, net of cash disposed 35 34 1 462 1 199
Proceeds from and purchases of other investments 260 (10) (79) (61)
Net cash flow from investing activities (6 431) (6 050) (20 281) (20 997)
Proceeds from and repayments of borrowings (2 253) (1 289) (540) 1 135
Share buyback by Telenor ASA - - - (1 048)
Dividends paid to non-controlling interests (509) (790) (3 777) (3 386)
Dividends paid to equity holders of Telenor ASA (5 020) - (10 724) (10 567)
Net cash flow from financing activities (7 782) (2 079) (15 041) (13 866)
Effects of exchange rate changes on cash and cash equivalents 149 785 81 927
Net change in cash and cash equivalents (6 120) (1 308) 1 866 (85)
Cash and cash equivalents at the beginning of the period 19 881 13 202 11 893 11 978
Cash and cash equivalents at the end of the period 1) 13 760 11 893 13 760 11 893
1) As of 31 December 2015, restricted cash was NOK 491 million, while as of 31 December 2014, restricted cash was NOK 481 million
The interim financial information has not been subject to audit or review.
TELENOR FOURTH QUARTER 2015
/PAGE 15/
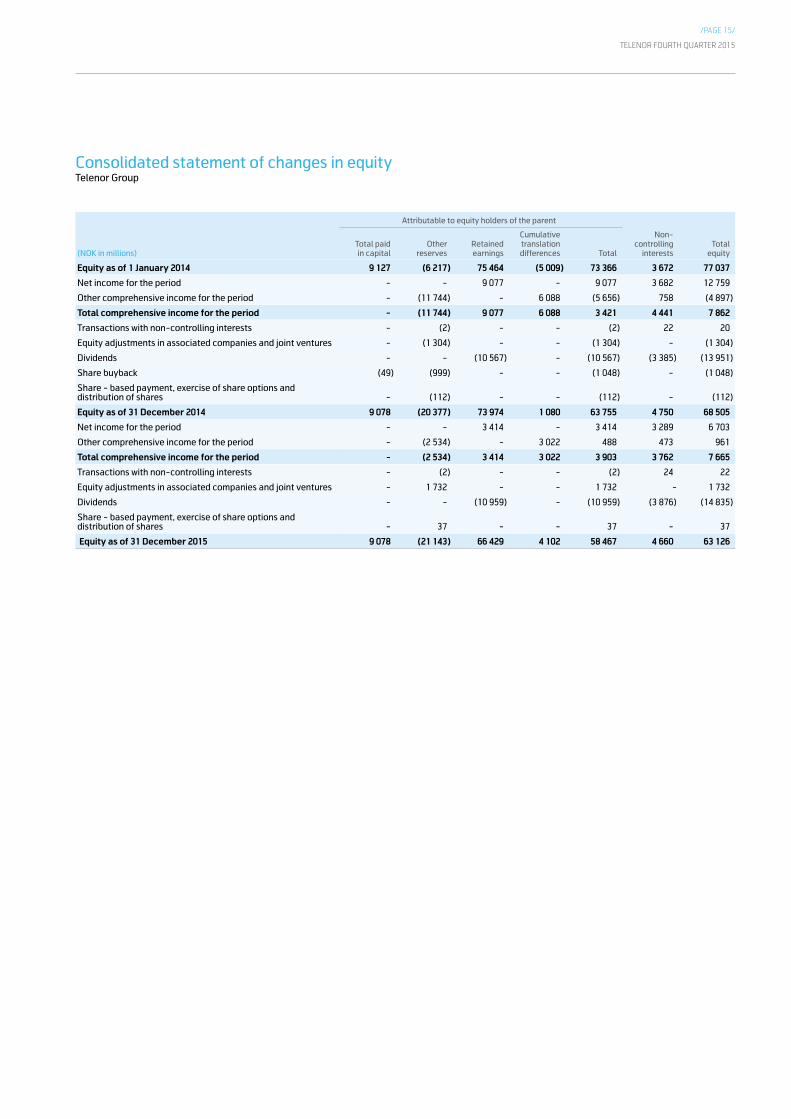
Consolidated statement of changes in equity Telenor Group
Attributable to equity holders of the parent
(NOK in millions) Total paid
in capital Other
reserves Retained earnings
Cumulative translation differences Total
Non-controlling
interests Total
equity
Equity as of 1 January 2014 9 127 (6 217) 75 464 (5 009) 73 366 3 672 77 037
Net income for the period - - 9 077 - 9 077 3 682 12 759
Other comprehensive income for the period - (11 744) - 6 088 (5 656) 758 (4 897)
Total comprehensive income for the period - (11 744) 9 077 6 088 3 421 4 441 7 862
Transactions with non-controlling interests - (2) - - (2) 22 20
Equity adjustments in associated companies and joint ventures - (1 304) - - (1 304) - (1 304)
Dividends - - (10 567) - (10 567) (3 385) (13 951)
Share buyback (49) (999) - - (1 048) - (1 048)
Share - based payment, exercise of share options and distribution of shares - (112) - - (112) - (112)
Equity as of 31 December 2014 9 078 (20 377) 73 974 1 080 63 755 4 750 68 505
Net income for the period - - 3 414 - 3 414 3 289 6 703
Other comprehensive income for the period - (2 534) - 3 022 488 473 961
Total comprehensive income for the period - (2 534) 3 414 3 022 3 903 3 762 7 665
Transactions with non-controlling interests - (2) - - (2) 24 22
Equity adjustments in associated companies and joint ventures - 1 732 - - 1 732 - 1 732
Dividends - - (10 959) - (10 959) (3 876) (14 835)
Share - based payment, exercise of share options and distribution of shares - 37 - - 37 - 37
Equity as of 31 December 2015 9 078 (21 143) 66 429 4 102 58 467 4 660 63 126
TELENOR FOURTH QUARTER 2015
/PAGE 16//PAGE 16/
Note 1 – General accounting principlesTelenor (the Group) consists of Telenor ASA (the Company) and its subsidiaries. Telenor ASA is a limited liability company, incorporated in Norway. The condensed consolidated interim financial statements consist of the Group and the Group’s interests in associated companies and joint arrangements. As a result of rounding differences, numbers or percentages may not add up to the total.
These interim condensed consolidated financial statements for the year ending 31 December 2015, have been prepared in accordance with IAS 34 Interim Financial Reporting. The interim condensed consolidated financial statements do not include all the information and disclosures required in the annual financial statements and should be read in conjunction with the Group’s Annual Report 2014. The accounting policies adopted in the preparation of the interim consolidated financial statements are consistent with those followed in the preparation of the Group’s Annual Financial Statements for the year ended 31 December 2014.
For information about the standards and interpretations effective from 1 January 2015, please refer to Note 1 in the Group’s Annual Report 2014. The standards and interpretations effective from 1 January 2015 do not have a significant impact on the Group’s consolidated interim financial statements.
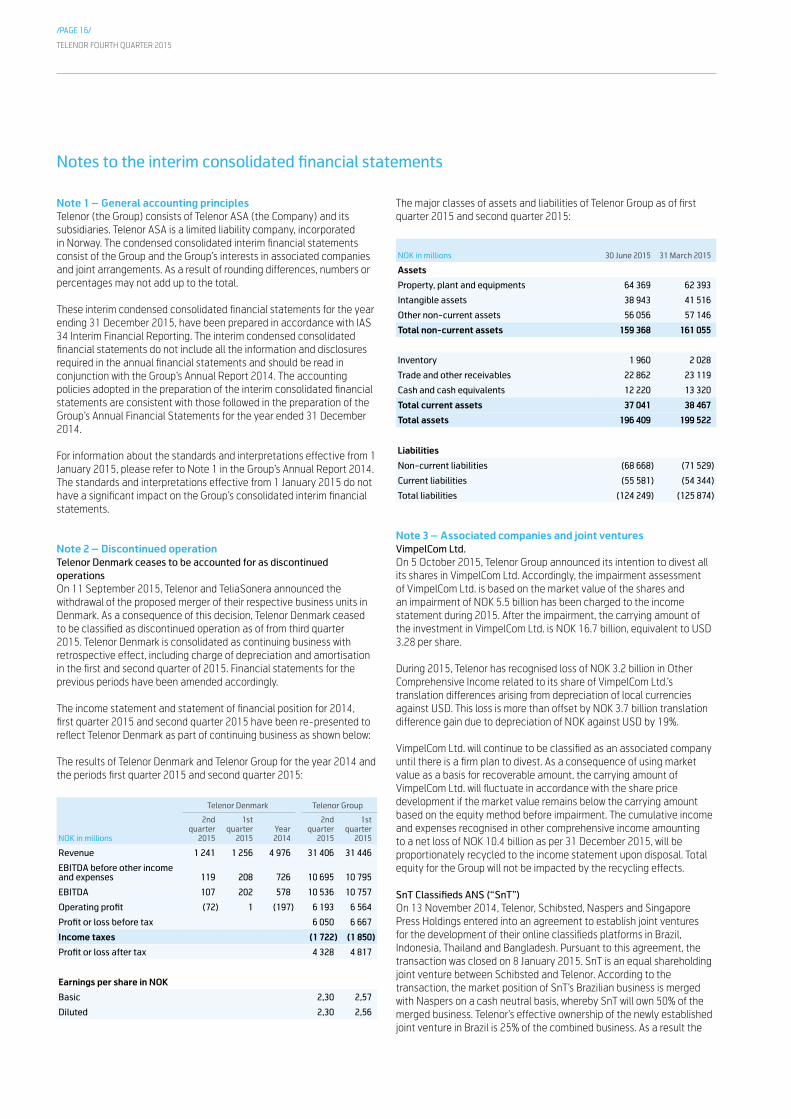
Note 2 – Discontinued operationTelenor Denmark ceases to be accounted for as discontinued operationsOn 11 September 2015, Telenor and TeliaSonera announced the withdrawal of the proposed merger of their respective business units in Denmark. As a consequence of this decision, Telenor Denmark ceased to be classified as discontinued operation as of from third quarter 2015. Telenor Denmark is consolidated as continuing business with retrospective effect, including charge of depreciation and amortisation in the first and second quarter of 2015. Financial statements for the previous periods have been amended accordingly.
The income statement and statement of financial position for 2014, first quarter 2015 and second quarter 2015 have been re-presented to reflect Telenor Denmark as part of continuing business as shown below:
The results of Telenor Denmark and Telenor Group for the year 2014 and the periods first quarter 2015 and second quarter 2015:
Telenor Denmark Telenor Group
NOK in millions
2nd quarter
2015
1st quarter
2015Year 2014
2nd quarter
2015
1st quarter
2015
Revenue 1 241 1 256 4 976 31 406 31 446
EBITDA before other income and expenses 119 208 726 10 695 10 795
EBITDA 107 202 578 10 536 10 757
Operating profit (72) 1 (197) 6 193 6 564
Profit or loss before tax 6 050 6 667
Income taxes (1 722) (1 850)
Profit or loss after tax 4 328 4 817
Earnings per share in NOK
Basic 2,30 2,57
Diluted 2,30 2,56
The major classes of assets and liabilities of Telenor Group as of first quarter 2015 and second quarter 2015:
NOK in millions 30 June 2015 31 March 2015
Assets
Property, plant and equipments 64 369 62 393
Intangible assets 38 943 41 516
Other non-current assets 56 056 57 146
Total non-current assets 159 368 161 055
Inventory 1 960 2 028
Trade and other receivables 22 862 23 119
Cash and cash equivalents 12 220 13 320
Total current assets 37 041 38 467
Total assets 196 409 199 522
Liabilities
Non-current liabilities (68 668) (71 529)
Current liabilities (55 581) (54 344)
Total liabilities (124 249) (125 874)
Note 3 – Associated companies and joint venturesVimpelCom Ltd.On 5 October 2015, Telenor Group announced its intention to divest all its shares in VimpelCom Ltd. Accordingly, the impairment assessment of VimpelCom Ltd. is based on the market value of the shares and an impairment of NOK 5.5 billion has been charged to the income statement during 2015. After the impairment, the carrying amount of the investment in VimpelCom Ltd. is NOK 16.7 billion, equivalent to USD 3.28 per share.
During 2015, Telenor has recognised loss of NOK 3.2 billion in Other Comprehensive Income related to its share of VimpelCom Ltd.’s translation differences arising from depreciation of local currencies against USD. This loss is more than offset by NOK 3.7 billion translation difference gain due to depreciation of NOK against USD by 19%.
VimpelCom Ltd. will continue to be classified as an associated company until there is a firm plan to divest. As a consequence of using market value as a basis for recoverable amount, the carrying amount of VimpelCom Ltd. will fluctuate in accordance with the share price development if the market value remains below the carrying amount based on the equity method before impairment. The cumulative income and expenses recognised in other comprehensive income amounting to a net loss of NOK 10.4 billion as per 31 December 2015, will be proportionately recycled to the income statement upon disposal. Total equity for the Group will not be impacted by the recycling effects. SnT Classifieds ANS (“SnT”)On 13 November 2014, Telenor, Schibsted, Naspers and Singapore Press Holdings entered into an agreement to establish joint ventures for the development of their online classifieds platforms in Brazil, Indonesia, Thailand and Bangladesh. Pursuant to this agreement, the transaction was closed on 8 January 2015. SnT is an equal shareholding joint venture between Schibsted and Telenor. According to the transaction, the market position of SnT’s Brazilian business is merged with Naspers on a cash neutral basis, whereby SnT will own 50% of the merged business. Telenor’s effective ownership of the newly established joint venture in Brazil is 25% of the combined business. As a result the
Notes to the interim consolidated financial statements
TELENOR FOURTH QUARTER 2015
/PAGE 17/
carrying amount was disposed of for a fair value consideration of 25% ownership in the merged business and gain of NOK 322 million was recognised during the first half of 2015 as part of share of net income from associated companies and joint ventures. Fair value of the 25% ownership in the merged business is estimated based on management’s forecasted cash flows discounted with an appropriate discount rate. The accounting effect of transaction pertaining to Indonesia, Thailand and Bangladesh was limited.
Evry ASAPursuant to the pre acceptance of offer from Lyngen Bidco AS, on 16 March 2015 Telenor sold its 30.24% ownership for a consideration of NOK 1.3 billion received in cash. The carrying amount of Evry ASA was NOK 1.1 billion classified as Asset Held for Sale as of 31 December 2014. The Group recognised gain on disposal of NOK 0.2 billion in the income statement during the first quarter of 2015.
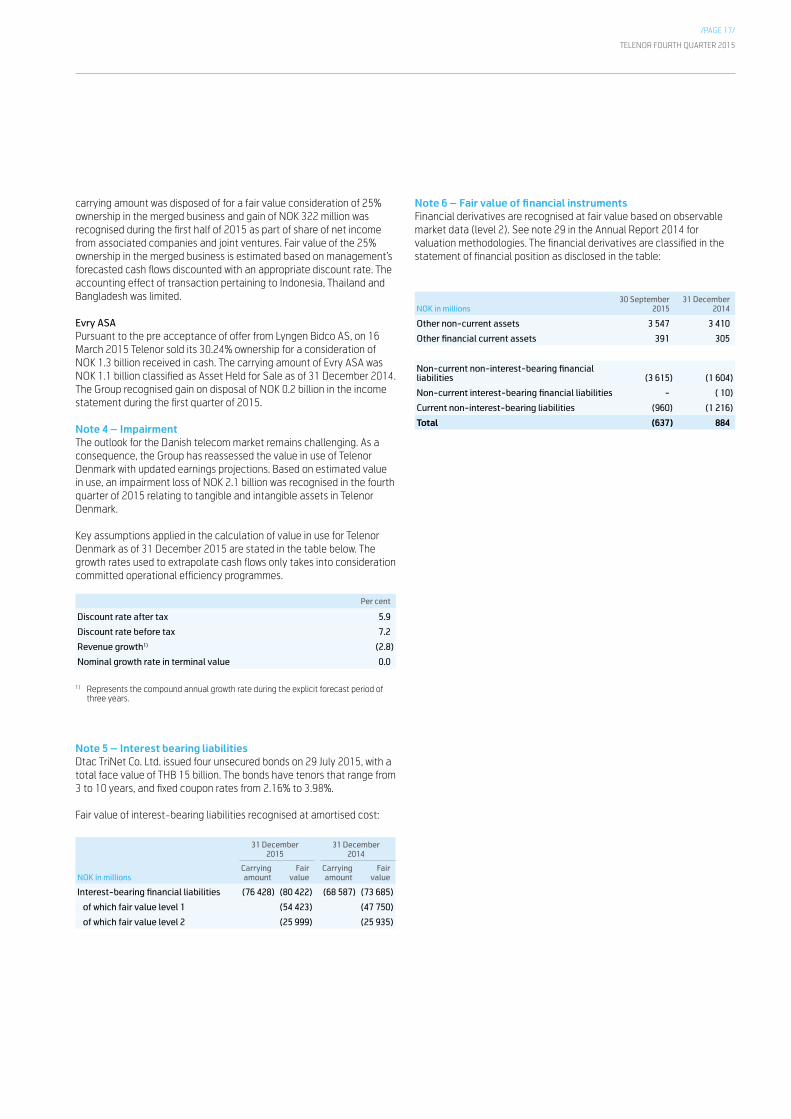
Note 4 – ImpairmentThe outlook for the Danish telecom market remains challenging. As a consequence, the Group has reassessed the value in use of Telenor Denmark with updated earnings projections. Based on estimated value in use, an impairment loss of NOK 2.1 billion was recognised in the fourth quarter of 2015 relating to tangible and intangible assets in Telenor Denmark.
Key assumptions applied in the calculation of value in use for Telenor Denmark as of 31 December 2015 are stated in the table below. The growth rates used to extrapolate cash flows only takes into consideration committed operational efficiency programmes.
Per cent
Discount rate after tax 5.9
Discount rate before tax 7.2
Revenue growth1) (2.8)
Nominal growth rate in terminal value 0.0
1) Represents the compound annual growth rate during the explicit forecast period of three years.
Note 5 – Interest bearing liabilitiesDtac TriNet Co. Ltd. issued four unsecured bonds on 29 July 2015, with a total face value of THB 15 billion. The bonds have tenors that range from 3 to 10 years, and fixed coupon rates from 2.16% to 3.98%.
Fair value of interest-bearing liabilities recognised at amortised cost:
31 December 2015
31 December 2014
NOK in millionsCarrying amount
Fair value
Carrying amount
Fair value
Interest-bearing financial liabilities (76 428) (80 422) (68 587) (73 685)
of which fair value level 1 (54 423) (47 750)
of which fair value level 2 (25 999) (25 935)
Note 6 – Fair value of financial instrumentsFinancial derivatives are recognised at fair value based on observable market data (level 2). See note 29 in the Annual Report 2014 for valuation methodologies. The financial derivatives are classified in the statement of financial position as disclosed in the table:
NOK in millions30 September
201531 December
2014
Other non-current assets 3 547 3 410
Other financial current assets 391 305
Non-current non-interest-bearing financial liabilities (3 615) (1 604)
Non-current interest-bearing financial liabilities - ( 10)
Current non-interest-bearing liabilities (960) (1 216)
Total (637) 884
TELENOR FOURTH QUARTER 2015
/PAGE 18/
Note 7 – Legal disputesThe issues described below are updates compared to information included in the Annual Report 2014 note 33 and have to be read in conjunction with this. For legal disputes, in which the Group assesses it to be probable (more likely than not) that an economic outflow will be required to settle the obligation provisions are made based on management’s best estimate.
dtac Disputes between dtac and CATCAT Telecom Public Company Limited (CAT) and dtac have a number of disputes and disagreements over understanding and scope of the concession agreements. This also includes how the new 3G regime is to be understood in relation to the concession agreements. CAT has threatened to terminate the concession agreements, due to alleged breaches by dtac of these agreements and continues to present claims of compensation against dtac. CAT served dtac notices to claim compensation from dtac due to porting of its subscribers to its subsidiary dtac TriNet during September 2013 – December 2014 in the amount of NOK 2.5 billion. On 9 June 2015, dtac was informed that CAT increased its claim related to the porting of subscribers for the period January 2015 – May 2015 by NOK 1.5 billion, so that the total claim amounts to approximately NOK 4 billion.
CAT filed injunction petitions with the Central Administrative Court against dtac, dtac TriNet and NBTC, aiming at restricting dtac TriNet from using dtac’s network. The court has rejected injunction petition against dtac Trinet. On 20 May 2015, the Court granted the injunctive relief order as requested by CAT. On 18 June 2015, dtac filed an appeal with the Supreme Administrative Court. On 21 August 2015, the Company and the CAT submitted the petition to the Court to revoke the injunctive order, and on 27 November 2015, the Supreme Administrative Court revoked the injunction.
In addition, CAT filed a new statement of claim to the Arbitration Institute requesting for additional revenue sharing for the 19th concession year (16 September 2009 – 15 September 2010) on 8 May 2015 in the amount of NOK 1.9 billion (including VAT plus penalty interest at the rate of 15% p.a.).
CAT filed a new statement of claim to the Arbitration Institute requesting for additional revenue sharing for the 20th concession year (16 September 2010 – 15 September 2011) on 9 April 2015 in the amount of NOK 1.7 billion (including VAT plus penalty interest at the rate of 15% p.a.).
CAT sent a letter to dtac requesting for additional revenue sharing for the 22nd concession year (16 September 2012 to 15 September 2013) on 7 May 2015 in the amount of NOK 1 billion.
On 11 January 2008, CAT submitted a claim to the Arbitration Institute requesting dtac to make concession revenue sharing payments for the 12th – 16th concession years (16 September 2002 to 15 September 2006) amounting to NOK 5.7 billion including penalties. The basis for the claim is the fact that revenue share paid by dtac to CAT was made after deduction of excise tax. dtac’s opinion is that it was entitled to do so by virtue of the resolutions made by the Thai Council of Ministers in February 2003 and a letter issued by CAT allowing such deduction. On 28 May 2012, the Arbitral Tribunal rendered an award in favour of dtac and dismissed CAT’s claim for Excise tax on Revenue Sharing Payment.
However, on 31 August 2012, CAT filed a lawsuit with the Central Administrative Court in order to revoke the arbitration award. Presently,
this case is under the court’s consideration. On 29 January 2016, dtac was notified by the Central Administrative Court that the court had decided the case in dtac’s favour. CAT may still appeal the case to the Supreme Administrative Court within 30 days.
GrameenphoneSIM tax on replacement SIM CardsLarge Taxpayer Unit (LTU)-VAT by a letter dated 16 May 2012 claimed SIM tax of NOK 1.8 billion, including interests of NOK 0.6 billion for all replacement SIMs issued during the period from July 2007 to December 2011 alleging that Grameenphone evaded SIM tax by selling new connections in the name of replacement SIMs. Grameenphone challenged the demand by a writ petition and the High Court initially passed a stay order on the operation of the demand. On 18 May 2015, Commissioner LTU-VAT issued an order purporting to dispose of the show cause notice and finalize the demand for principal amount of NOK 1.1 billion as SIM tax. The revised demand includes substantially all replacements done by Grameenphone in the period between July 2007 and December 2011. The claim issued on 18 May 2015 by LTU-VAT does not include interest charges.
On 10 August 2015, Grameenphone filed an appeal to the VAT Appellate Tribunal against the demand order. Even though the management of Grameenphone believes that the claim against Grameenphone is not likely to be legally enforceable, 10% of the disputed amount had to be deposited at the time of appeal as part of the appeal procedure prescribed by law. Since the claim is not likely to be legally enforceable, any payment related to this claim is likely to be recoverable after the courts have ultimately concluded upon the case.
NorwayThe EFTA Surveillance Authority (ESA) and the Norwegian Competition Authority initiated on 4 December 2012 an investigation against Telenor Norge AS regarding possible abuse of dominant market position and/or possible anti-competitive practices in the Norwegian mobile market. Both investigations are still ongoing. A Statement of objections (SO) was issued by EFTA Surveillance Authority (ESA) on 1 February 2016. The SO is a formal step in ESA’s competition law investigations in which ESA informs Telenor Norge AS about its preliminary concerns in writing. According to ESA’s preliminary view in the SO, Telenor Norge AS has infringed the prohibition against abuse of a dominant position related to two different types of market conduct; 1) margin-squeeze on MBB standalone to consumers in Norway and 2) lock-in clauses in conjunction with early termination fees on individual subscriptions in the business segment in Norway.
Telenor Norge AS will provide its comments and oppose ESA’s arguments by setting out all facts known which are relevant to Telenor Norge AS’ defence against the objections raised by ESA. Telenor Norge AS must provide its legal and factual arguments by 11 April 2016. Telenor Norge AS may request an oral hearing. If ESA later on issues a final decision which concludes that Telenor Norge AS has breached the competition rules, this decision will most likely contain a fine. ESA’s decision may be appealed to the EFTA Court by Telenor Norge AS.
TELENOR FOURTH QUARTER 2015
/PAGE 19/
Note 8 – events after the reporting periodAcquisition of Tapad IncOn 29 January 2016 Telenor entered into an agreement to acquire approximately 95% of Tapad Inc, a leading marketing technology firm. The purchase price is USD 360 million, on a debt and cash-free 100% basis. The consideration will be settled in cash. The closing of the transaction is subject to regulatory approvals. Closing is expected in first quarter 2016.
The acquisition enables Telenor to take a position within the rapidly growing market for advertising technology, and secures important competence within digital marketing and analytics. The company delivers unified cross-device marketing technology solutions that give publishers, marketers and technology providers a holistic view of consumers across devices and screens, including smartphones, tablets, home computers and smart TVs. The founder and CEO Are Traasdahl, and his co-founder Dag Liodden have together retained a non-controlling stake of 5% in Tapad.
DtacOn 3 February 2016, the Board of Directors of Total Access Communication Public Company Limited (dtac) declared interim dividend for 2015 of THB 0.52 per share which corresponds to approximately NOK 0.3 billion total dividend and approximately NOK 0.2 billion for Telenor ownership share.
DigiOn 5 February 2016, the Board of Directors of Digi declared the fourth interim dividend for 2015 of MYR 0.049 per share which corresponds to approximately NOK 0.8 billion total dividend and approximately NOK 0.4 billion for Telenor ownership share.
GrameenphoneOn 7 February 2016, the Board of Directors of Grameenphone Ltd. proposed final dividend for 2015 of BDT 6.0 per share which corresponds to approximately NOK 0.9 billion total dividend and approximately NOK 0.5 billion for Telenor ownership share.
TELENOR FOURTH QUARTER 2015
/PAGE 20/
The operationsFourth quarter
Total revenues of which internal EBITDA before other income and other expenses*) EBITDA Operating profit (loss)
(NOK in millions) 2015 2014 Growth 2015 2014 2015 Margin 2014 Margin 2015 Margin 2014 Margin 2015 Margin 2014 Margin
Norway 6 719 6 730 (0.2%) 81 88 2 617 39.0% 2 747 40.8% 2 576 38.3% 2 700 40.1% 1 673 24.9% 1 807 26.8%
Sweden 3 409 3 114 9.5% 9 27 954 28.0% 785 25.2% 963 28.3% 723 23.2% 546 16.0% 341 10.9%
Denmark 1 431 1 360 5.2% 23 21 137 9.6% 176 13.0% 111 7.7% 89 6.6% (2 212) nm (111) nm
Hungary 1 175 1 150 2.2% 12 17 280 23.9% 279 24.2% 271 23.1% 260 22.6% 105 9.0% 129 11.2%
Bulgaria 809 734 10.1% 5 3 295 36.5% 253 34.4% 299 36.9% 253 34.4% 184 22.7% 38 5.2%
Montenegro & Serbia 982 883 11.2% 33 29 314 32.0% 287 32.5% 316 32.1% 285 32.2% 197 20.1% 187 21.1%
dtac - Thailand 5 533 5 265 5.1% 37 17 1 598 28.9% 1 476 28.0% 1 582 28.6% 1 489 28.3% 419 7.6% 598 11.4%
Digi - Malaysia 3 430 3 667 (6.5%) 1 1 1 385 40.4% 1 640 44.7% 1 385 40.4% 1 643 44.8% 1 048 30.6% 1 360 37.1%
Grameenphone - Bangladesh 2 924 2 306 26.8% - - 1 595 54.5% 1 161 50.3% 1 587 54.3% 1 155 50.1% 1 035 35.4% 716 31.0%
Pakistan 2 049 1 581 29.6% 20 26 878 42.9% 493 31.2% 874 42.6% 492 31.1% 584 28.5% 260 16.5%
India 1 436 1 187 20.9% 1 1 41 2.9% (97) nm (75) nm (197) nm (368) nm (285) nm
Myanmar 1 493 287 nm 55 5 610 40.8% (248) nm 585 39.2% (248) nm 393 26.4% (336) nm
Broadcast 1 597 1 550 3.0% 44 40 507 31.7% 458 29.5% 501 31.4% 446 28.8% 336 21.0% 310 20.0%
Other units 1 713 1 627 5.3% 893 727 (351) nm (76) nm (372) nm (65) nm (525) nm (204) nm
Eliminations (1 212) (1 002) - (1 212) (1 002) - - (14) - - - - - 1 - 1 -
Group 33 487 30 440 10.0% - - 10 860 32.4% 9 318 30.6% 10 603 31.7% 9 023 29.6% 3 417 10.2% 4 811 15.8%
Full year
Total revenues of which internal EBITDA before other income and other expenses*) EBITDA Operating profit (loss)
(NOK in millions) 2015 2014 Growth 2015 2014 2015 Margin 2014 Margin 2015 Margin 2014 Margin 2015 Margin 2014 Margin
Norway 26 542 26 186 1.4% 302 340 11 088 41.8% 11 255 43.0% 10 796 40.7% 10 862 41.5% 7 218 27.2% 7 430 28.4%
Sweden 12 576 11 728 7.2% 64 106 3 667 29.2% 3 489 29.7% 3 617 28.8% 3 434 29.3% 2 094 16.7% 1 900 16.2%
Denmark 5 201 4 976 4.5% 75 73 591 11.4% 726 14.6% 370 7.1% 578 11.6% (2 516) nm (197) nm
Hungary 4 490 4 239 5.9% 35 36 1 382 30.8% 1 375 32.4% 1 356 30.2% 1 327 31.3% 760 16.9% 851 20.1%
Bulgaria 2 940 2 723 8.0% 14 7 1 134 38.6% 1 041 38.2% 1 133 38.5% 1 039 38.1% 615 20.9% (406) nm
Montenegro & Serbia 3 815 3 450 10.6% 148 119 1 329 34.8% 1 293 37.5% 1 332 34.9% 1 288 37.3% 902 23.6% 913 26.5%
dtac - Thailand 20 687 17 562 17.8% 108 41 6 580 31.8% 5 993 34.1% 6 526 31.5% 6 021 34.3% 2 333 11.3% 3 124 17.8%
Digi - Malaysia 14 306 13 513 5.9% 4 4 6 224 43.5% 6 086 45.0% 6 225 43.5% 6 099 45.1% 4 923 34.4% 5 125 37.9%
Grameenphone - Bangladesh 10 881 8 367 30.1% 1 2 5 806 53.4% 4 434 53.0% 5 799 53.3% 4 435 53.0% 3 829 35.2% 3 000 35.9%
Pakistan 7 766 5 798 33.9% 113 81 3 152 40.6% 2 112 36.4% 3 154 40.6% 2 098 36.2% 2 069 26.6% 1 297 22.4%
India 5 592 4 200 33.1% 3 3 (47) nm (422) nm (181) nm 1 161 27.6% (990) nm 882 21.0%
Myanmar 4 835 290 nm 146 5 1 921 39.7% (508) nm 1 884 39.0% (508) nm 1 342 27.8% (605) nm
Broadcast 6 236 6 309 (1.2%) 160 154 2 032 32.6% 1 951 30.9% 2 018 32.4% 3 095 49.1% 1 422 22.8% 2 556 40.5%
Other units 6 666 5 854 13.9% 3 186 2 779 (661) nm (297) nm (703) nm (437) nm (1 244) nm (948) nm
Eliminations (4 359) (3 750) - (4 359) (3 750) - - (31) - - - (1) - 5 - 4 -
Group 128 175 111 443 15.0% - - 44 197 34.5% 38 496 34.5% 43 325 33.8% 40 490 36.3% 22 761 17.8% 24 927 22.4%
*) The segment profit is EBITDA before other income and other expenses.
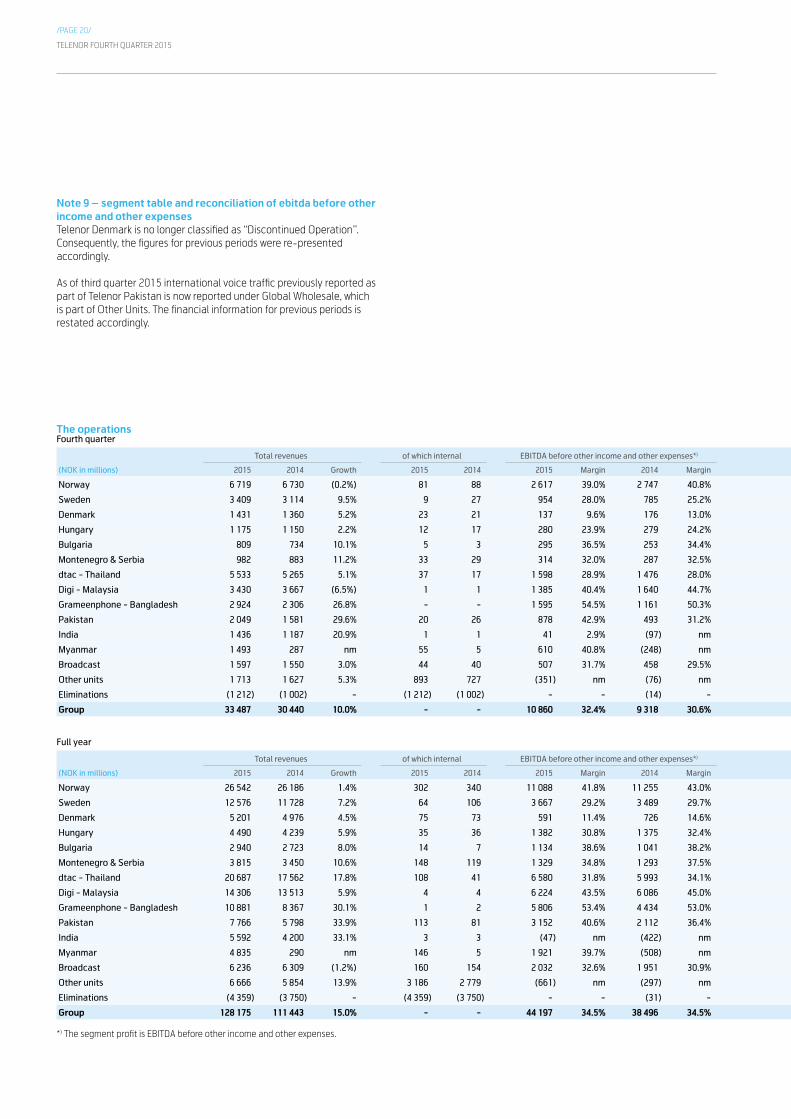
Note 9 – segment table and reconciliation of ebitda before other income and other expensesTelenor Denmark is no longer classified as “Discontinued Operation”. Consequently, the figures for previous periods were re-presented accordingly.
As of third quarter 2015 international voice traffic previously reported as part of Telenor Pakistan is now reported under Global Wholesale, which is part of Other Units. The financial information for previous periods is restated accordingly.
TELENOR FOURTH QUARTER 2015
/PAGE 21/
The operationsFourth quarter
Total revenues of which internal EBITDA before other income and other expenses*) EBITDA Operating profit (loss)
(NOK in millions) 2015 2014 Growth 2015 2014 2015 Margin 2014 Margin 2015 Margin 2014 Margin 2015 Margin 2014 Margin
Norway 6 719 6 730 (0.2%) 81 88 2 617 39.0% 2 747 40.8% 2 576 38.3% 2 700 40.1% 1 673 24.9% 1 807 26.8%
Sweden 3 409 3 114 9.5% 9 27 954 28.0% 785 25.2% 963 28.3% 723 23.2% 546 16.0% 341 10.9%
Denmark 1 431 1 360 5.2% 23 21 137 9.6% 176 13.0% 111 7.7% 89 6.6% (2 212) nm (111) nm
Hungary 1 175 1 150 2.2% 12 17 280 23.9% 279 24.2% 271 23.1% 260 22.6% 105 9.0% 129 11.2%
Bulgaria 809 734 10.1% 5 3 295 36.5% 253 34.4% 299 36.9% 253 34.4% 184 22.7% 38 5.2%
Montenegro & Serbia 982 883 11.2% 33 29 314 32.0% 287 32.5% 316 32.1% 285 32.2% 197 20.1% 187 21.1%
dtac - Thailand 5 533 5 265 5.1% 37 17 1 598 28.9% 1 476 28.0% 1 582 28.6% 1 489 28.3% 419 7.6% 598 11.4%
Digi - Malaysia 3 430 3 667 (6.5%) 1 1 1 385 40.4% 1 640 44.7% 1 385 40.4% 1 643 44.8% 1 048 30.6% 1 360 37.1%
Grameenphone - Bangladesh 2 924 2 306 26.8% - - 1 595 54.5% 1 161 50.3% 1 587 54.3% 1 155 50.1% 1 035 35.4% 716 31.0%
Pakistan 2 049 1 581 29.6% 20 26 878 42.9% 493 31.2% 874 42.6% 492 31.1% 584 28.5% 260 16.5%
India 1 436 1 187 20.9% 1 1 41 2.9% (97) nm (75) nm (197) nm (368) nm (285) nm
Myanmar 1 493 287 nm 55 5 610 40.8% (248) nm 585 39.2% (248) nm 393 26.4% (336) nm
Broadcast 1 597 1 550 3.0% 44 40 507 31.7% 458 29.5% 501 31.4% 446 28.8% 336 21.0% 310 20.0%
Other units 1 713 1 627 5.3% 893 727 (351) nm (76) nm (372) nm (65) nm (525) nm (204) nm
Eliminations (1 212) (1 002) - (1 212) (1 002) - - (14) - - - - - 1 - 1 -
Group 33 487 30 440 10.0% - - 10 860 32.4% 9 318 30.6% 10 603 31.7% 9 023 29.6% 3 417 10.2% 4 811 15.8%
Full year
Total revenues of which internal EBITDA before other income and other expenses*) EBITDA Operating profit (loss)
(NOK in millions) 2015 2014 Growth 2015 2014 2015 Margin 2014 Margin 2015 Margin 2014 Margin 2015 Margin 2014 Margin
Norway 26 542 26 186 1.4% 302 340 11 088 41.8% 11 255 43.0% 10 796 40.7% 10 862 41.5% 7 218 27.2% 7 430 28.4%
Sweden 12 576 11 728 7.2% 64 106 3 667 29.2% 3 489 29.7% 3 617 28.8% 3 434 29.3% 2 094 16.7% 1 900 16.2%
Denmark 5 201 4 976 4.5% 75 73 591 11.4% 726 14.6% 370 7.1% 578 11.6% (2 516) nm (197) nm
Hungary 4 490 4 239 5.9% 35 36 1 382 30.8% 1 375 32.4% 1 356 30.2% 1 327 31.3% 760 16.9% 851 20.1%
Bulgaria 2 940 2 723 8.0% 14 7 1 134 38.6% 1 041 38.2% 1 133 38.5% 1 039 38.1% 615 20.9% (406) nm
Montenegro & Serbia 3 815 3 450 10.6% 148 119 1 329 34.8% 1 293 37.5% 1 332 34.9% 1 288 37.3% 902 23.6% 913 26.5%
dtac - Thailand 20 687 17 562 17.8% 108 41 6 580 31.8% 5 993 34.1% 6 526 31.5% 6 021 34.3% 2 333 11.3% 3 124 17.8%
Digi - Malaysia 14 306 13 513 5.9% 4 4 6 224 43.5% 6 086 45.0% 6 225 43.5% 6 099 45.1% 4 923 34.4% 5 125 37.9%
Grameenphone - Bangladesh 10 881 8 367 30.1% 1 2 5 806 53.4% 4 434 53.0% 5 799 53.3% 4 435 53.0% 3 829 35.2% 3 000 35.9%
Pakistan 7 766 5 798 33.9% 113 81 3 152 40.6% 2 112 36.4% 3 154 40.6% 2 098 36.2% 2 069 26.6% 1 297 22.4%
India 5 592 4 200 33.1% 3 3 (47) nm (422) nm (181) nm 1 161 27.6% (990) nm 882 21.0%
Myanmar 4 835 290 nm 146 5 1 921 39.7% (508) nm 1 884 39.0% (508) nm 1 342 27.8% (605) nm
Broadcast 6 236 6 309 (1.2%) 160 154 2 032 32.6% 1 951 30.9% 2 018 32.4% 3 095 49.1% 1 422 22.8% 2 556 40.5%
Other units 6 666 5 854 13.9% 3 186 2 779 (661) nm (297) nm (703) nm (437) nm (1 244) nm (948) nm
Eliminations (4 359) (3 750) - (4 359) (3 750) - - (31) - - - (1) - 5 - 4 -
Group 128 175 111 443 15.0% - - 44 197 34.5% 38 496 34.5% 43 325 33.8% 40 490 36.3% 22 761 17.8% 24 927 22.4%
*) The segment profit is EBITDA before other income and other expenses.
Reconciliation
Fourth quarter Year
(NOK in millions) 20152014
Re-presented 20152014
Re-presented
Net income (1 393) 1 406 6 704 12 759
Income taxes (995) (1 456) (6 317) (6 598)
Profit before taxes (398) 2 863 13 020 19 356
Net financial income (expenses) (980) (779) (2 921) (1 711)
Profit (loss) from associated companies and joint ventures (2 835) (1 170) (6 819) (3 859)
Depreciation and amortisation (5 083) (4 204) (18 384) (15 529)
Impairment losses (2 103) (9) (2 181) (34)
EBITDA 10 603 9 023 43 325 40 490
Other income (18) 125 113 3 092
Other expenses (239) (420) (985) (1 097)
EBITDA before other income and other expenses 10 860 9 318 44 197 38 496
TELENOR FOURTH QUARTER 2015
/PAGE 22/
Definitions• Organic revenue is defined as revenue adjusted for the effects of
acquisition and disposal of operations and currency effects.• Capital expenditure (capex) is investments in tangible and intangible
assets.• Operating cash flow is defined as EBITDA before other income and
expenses less capex, excluding licences and spectrum.• Investments in businesses comprise acquisitions of shares and
participations, including acquisitions of subsidiaries and businesses not organised as separate companies.
Mobile operations
RevenuesSubscription and trafficConsist of subscription and connection fees, revenues from voice (outgoing traffic) and non-voice traffic, outbound roaming and other mobile service revenues. Subscription and traffic includes only revenues from the company’s own subscriptions.
InterconnectConsist of revenues from incoming traffic related to the company’s own subscriptions. Revenues from incoming traffic related to service provider or MVNO subscriptions are not included.
Other mobileConsist of inbound roaming, national roaming, telemetric and revenues related to service providers and MVNOs (Mobile Virtual Network Operators). Telemetric is defined as machine-to-machine SIM cards (M2M), for example vending machines and meter readings.
Non-mobileConsist of revenues from customer equipment and businesses that are not directly related to mobile operations.
Mobile revenues from company’s own subscriptionsConsist of ‘Subscription and traffic’ and ‘Interconnect’ and do not include revenues from inbound roaming, national roaming, service providers, MVNOs, sale of customer equipment and incoming traffic related to service provider subscriptions.
Key FiguresSubscriptionsContract subscriptions are counted until the subscription is terminated or until there has been no revenues or outgoing/incoming traffic during the last three months. Prepaid subscriptions are counted as active if there has been outgoing or incoming traffic or if the SIM card has been reloaded during the last three months. Service provider and MVNO subscriptions are not included. Data only SIM cards are included, but SIM cards used for telemetric applications and twin/multi SIM cards are excluded. Total subscriptions are voice SIM cards plus data only SIM cards used for mobile broadband.
Active mobile internet usersActive mobile internet users are subscriptions with at least 150 KB of data during the last three months.
Average traffic minutes per subscription per month (AMPU)Traffic minutes per subscription per month are calculated based on total outgoing and incoming rated minutes from the company’s own subscriptions less data only subscriptions. This includes zero rated minutes and outgoing minutes from own subscriptions while roaming. Outgoing and incoming minutes related to inbound roaming, national roaming, service providers and MVNOs are not included.
Average revenue per subscription per month (ARPU)ARPU is calculated based on mobile revenues from the company’s own subscriptions, divided by the average number of subscriptions for the relevant period.
Fixed operations
RevenuesTelephonyConsist of subscription and connection fees, traffic (fixed to fixed, fixed to mobile, to other countries, value added services, other traffic) for PSTN/ISDN and Voice over Internet Protocol (VoIP).
Internet and TVConsist of subscription and connection fees for xDSL and fibre, subscription fees and traffic charges for Dial Up Internet in addition to revenues from TV services. High speed connections include fibre, cable and VDSL.
Data servicesConsist of Nordic Connect/IP-VPN, Global communication and security.
OtherConsist of leased lines, managed services and other retail products.
WholesaleConsist of sale to service providers of telephony (PSTN/ISDN), Bitstream, LLUB, national and international interconnect, transit traffic, leased lines and other wholesale products.
Key FiguresSubscriptionsTelephony consist of PSTN, ISDN and VoIP subscriptions. Internet consists of broadband access over xDSL, fibre and cable TV. TV consists of TV services over fibre and cable. Subscriptions are counted until the subscription is terminated.
Average revenue per subscription per month (ARPU)ARPU is calculated based on revenues from the company’s own subscriptions, divided by the average number of subscriptions for the relevant period. Internet ARPU is calculated based on Internet revenues as defined above except TV service revenues. TV ARPU is calculated based on revenues from TV services.
Broadcast
RevenuesCanal Digital DTHConsist of revenues from Nordic DTH subscribers, households in SMATV networks and DTT subscribers in Finland.
SatelliteConsist of revenues from satellite services from the satellite position 1-degree west.
NorkringConsist of revenues from terrestrial radio and TV transmission in Norway and Belgium.
ConaxConsist of revenues from sale of encryption and conditional access services for TV distribution. Conax was divested in March 2014.
OtherConsist of revenues from Telenor Media Invest.

TELENOR FOURTH QUARTER 2015
/PAGE 23/
Notes

TELENOR FOURTH QUARTER 2015
/PAGE 24/
Notes

TELENOR FOURTH QUARTER 2015
/PAGE 25/
Notes

Fourth quarter 2015Published by Telenor ASAN-1331 Fornebu, NorwayPhone: +47 67 89 00 00
Investor Relations:Phone: +47 67 89 24 70e-mail: [email protected]
www.telenor.com
2161
024
• B
olt C
omm
unic
atio
n A
S •
bol
tcom
mun
icat
ion.
no