Embed Size (px)
Citation preview

R 255
G 192
B 0
R 158
G 199
B 85
R 97
G 140
B 193
R 127
G 127
B 127
R 255
G 157
B 3
R 168
G 199
B 234
Q4 2015 and FY 2015 Investor Presentation

2
Legal Disclaimer
This presentation contains "forward-looking statements" within the meaning of the Private Securities Litigation Reform Act of 1995.
All statements contained in this presentation that do not relate to matters of historical facts should be considered forward-looking
statements, including statements regarding our expectations regarding growth of our end-markets; projected U.S. construction
growth rate and spending and projected U.S. rental industry revenue growth rate; estimated exposure to oil and gas; our business
strategy, including our plan to identify new customers, equipment demand opportunities, greenfield opportunities, and investment and
divestiture opportunities; our 2016 outlook, including without limitation, statements regarding our forecasted revenue, Adjusted
EBITDA, our expected rental rates, time utilization and net capital expenditures; and guidance regarding our 2016 target leverage
ratio. We use words such as "will," "expect," "believe," "continue," "estimate," "intend," "target" and other similar expressions to
identify some but not all forward-looking statements. Forward-looking statements involve estimates and uncertainties that could
cause actual results to differ materially from those expressed in the forward-looking statements.
The forward-looking statements contained in this presentation are based on assumptions that we have made in light of our industry
experience and our perceptions of historical trends, current conditions, current plans, expected future developments and other
important factors we believe are appropriate under the circumstances. As you read and consider this presentation, you should
understand that these statements are not guarantees of performance or results. They involve risks, uncertainties (many of which are
beyond our control) and assumptions. Although we believe that these forward-looking statements are based on reasonable
assumptions, you should be aware that many important factors could affect our actual operating and financial performance and
cause our performance to differ materially from the performance anticipated in the forward-looking statements. We believe these
important factors include, but are not limited to, the important factors described under the captions "Risk Factors" and
"Management's Discussion and Analysis of Financial Condition and Results of Operations" in the Company's annual report on Form
10-K for the fiscal year ended December 31, 2015 filed with the Securities and Exchange Commission ("SEC") on March 8, 2016 and
similar disclosures in subsequent reports filed with the SEC, which could cause actual results to differ materially from those indicated
by the forward-looking statements made in this presentation. Should one or more of these risks or uncertainties materialize, or
should any of these assumptions prove incorrect, our actual operating and financial performance may vary in material respects from
the performance projected in these forward-looking statements.
Further, any forward-looking statement speaks only as of the date on which it is made, and except as required by law, we undertake
no obligation to update any forward-looking statement contained in this presentation to reflect events or circumstances after the date
on which it is made or to reflect the occurrence of anticipated or unanticipated events or circumstances. New important factors that
could cause our business not to develop as we expect emerge from time to time, and it is not possible for us to predict all of them.
In addition to the financial measures prepared in accordance with U.S. generally accepted accounting principles (“US GAAP”), this
presentation contains the non-US GAAP financial measures EBITDA and Adjusted EBITDA. The reasons for the use of these
measures, a reconciliation of these measures to the most directly comparable US GAAP measures and other information relating to
these measures are included in the appendix to this presentation.

Graham Hood
Chief Executive Officer

Company At a Glance
4
Leading Regional Rental
Equipment Provider
Sunbelt Region
Focus area
+14,700 (1)
Customers served
Differentiated Emphasis on
Earthmoving Equipment
~$766 million (2)
Original Equipment Cost (“OEC”)
~53% (2)
Of OEC focused on earthmoving category
Well Positioned in
Key End-Markets
Key End-Markets
Infrastructure, Non-Residential Construction, Oil & Gas, Municipal, and
Residential Construction
~6% (3)
Expected weighted average CAGR of key end-markets through 2019
Compelling
Financial Performance
~23% (4)
Adjusted EBITDA CAGR from 2011
to December 31, 2015
~49% (4)
Adjusted EBITDA margin
Proven Management Team with
Deep Roots in Rental
1,100 full-time employees (2)
Located in 66 branches and the Company headquarters
~18 years
Average tenure Regional VP’s have with Neff Rental
Notes: (1) Company data for the last twelve months ended December 31, 2015 (2) As of December 31, 2015 (3) Includes infrastructure, non-residential construction, oil and gas, municipal and residential construction end-markets (4) For a reconciliation of net income to Adjusted EBITDA, see page 17

Business Strategy
5
Focus on Premium Customer Service
Continue to deliver best-in-class service and support to our long-standing customer base
Remain focused on our technical edge with respect to earthmoving equipment
Rigorous use of CRM and national account program to further penetrate our current customer base and identify new customer opportunities
Emphasis on Active Asset Management
Focus on
Growing Markets
Capitalize on
Operating Leverage
Ability to Generate
Free Cash Flow
Remain committed to our focused position in the Sunbelt region of the United States
Continue to exploit and develop opportunities in the infrastructure, non-residential construction, residential construction, and oil and gas end markets
Utilize real time data to improve rental rates and identify equipment demand opportunities
Maintain rigorous repair and maintenance program to increase time utilization and equipment longevity
Disciplined fleet investment and divestiture strategy driven by ROIC benchmarks and real time market dynamics
Remain committed to our focused position in the Sunbelt region of the United States
Continue to exploit and develop opportunities in the infrastructure, non-residential construction, oil and gas, municipal and residential construction end-markets
Take advantage of our current branch network and clustering strategy to add incremental fleet to our current footprint
Identify and evaluate one to three greenfield opportunities that meet our stringent return criteria and fit well within our current branch network.
Acquisition of Lewis Rents, single branch in San Francisco, CA area and opening of three new branch locations; Lake Charles, LA, Chattanooga, TN, and Naples, FL
Maintain operational flexibility to generate significant cash flow through various business cycles
Rely on our disciplined growth strategy and fleet investment criteria to make capital investment decisions
Divest fleet when deemed appropriate and when secondary equipment market demand is robust
Utilize real time data to improve rental rates and identify equipment demand opportunities
Maintain rigorous repair and maintenance program to increase time utilization and equipment longevity
Disciplined fleet investment and divestiture strategy driven by ROI benchmarks and real time market demand dynamics

6
632 689
745 803
840 848 891 991
1,104 1,167 1,152
1,068
903
806 788 861 911
964 1,026
1,093 1,152
1,224 1,308
17 18 22 24 25 25 26 28 31 35 37 36
28 27 29 31 33 36 38 41 43 46 49
$10
$30
$50
$70
$90
$500
$750
$1,000
$1,250
$1,500
1997A 1999A 2001A 2003A 2005A 2007A 2009A 2011A 2013A 2015E 2017E 2019E
Total U.S. Construction Spending U.S. Rental Industry Revenues
U.S. Construction Spending vs. U.S. Rental Industry Revenues
Total U.S. Construction Spending $Bn
U.S. Rental Industry Revenues
$Bn
Notes: (1) Architectural Billings Index (“ABI”) data as of December 2015 (2) 1997–2019 FMI Construction Outlook as of Q4 2015 (3) 1997–2019 Total U.S. Rental Market Revenue data from IHS Global Insights report as of October 2015
U.S. Equipment Rental Market Overview
ABI in Perspective (1)
30
40
50
60
70
Dec-97 Dec-00 Dec-03 Dec-06 Dec-09 Dec-12 Dec-15
Control expenses and conserve capital
Access to the right equipment for the job
24/7 Customer care
Eliminate the need for long-term maintenance
Minimize need for storage and transportation
Technical expertise and advice is available
Why Our Customers Choose to Rent vs. Own
Exp
an
sio
n C
on
tractio
n
Expansion Expansion
Pent-up Demand
(2) (3)

7
Diversified Footprint and End-Markets
Sunbelt Region Overview
Key attributes of the Sunbelt region include:
Favorable climate conditions limit seasonality and facilitate year-round construction activity
Historically, higher than average equipment rental revenue growth rates when compared to other states outside of the Sunbelt
region (3)
Forecasted U.S total construction growth rate for 2016 is 6.7%. Growth in construction for states with Neff branch locations is
estimated at 7.5% in 2016, which exceeds the 5.8% estimated growth in construction in states where Neff does not operate(4)
Branch proximity within the region allows Neff to deploy equipment seamlessly across different areas to drive rate and ROI
Notes: (1) Forecasted 2016 Total U.S. Rental Industry Revenue growth rate data from IHS Global Insights report as of October 2015 (2) Company data for year ended December 31, 2015 (3) 1997–2014 Total U.S. Rental Industry Revenue data from IHS Global Insights report as of October 2015 (4) Forecasted 2016 Total Construction Industry growth rate data from IHS Global Insights data report as of October 2015
Neff Regions and Forecast Rental Industry Growth Rates (1) Rental Revenues by End-Market (2)
Infrastructure 28%
Non-Residential Construction
23%
Oil & Gas 8%
Residential Construction
12%
Municipal 10%
Other 19%
9%
7%
12%
9%
5%
5%
3%
8% 7%
10%
6%
7%
7%
9%

Notes: (1) Total rental revenues from Oil and Gas branch locations, including non-Oil and Gas end-market revenues
The Impact of Oil and Gas
Rental Revenue ($MM)
$83.7
$70.0
$13.7
$86.5 $79.0
$7.5
$-
$30.0
$60.0
$90.0
$120.0
Total Neff Excl. O&G Oil & Gas
Time Utilization ($MM)
67.6% 66.2%
75.4%
66.8% 67.2%
63.3%
55.0%
60.0%
65.0%
70.0%
75.0%
80.0%
Total Neff Neff Excl. O&G Oil & Gas (1) (1)
Oil & Gas Highlights
Oil & Gas branches were the main drivers of the decrease in total time utilization
Rental revenues in non-Oil & Gas branches were up by 12.7% in Q4 2015. Rental revenues in Oil and Gas branches were down
by 45.0%
Rental rates in non-Oil and Gas branches were up by 1.0% in Q4 2015. Rental rates in Oil and Gas branches were down by 8.6%
EBITDA in non-Oil & Gas branches was up by 11.4% in Q4 2015. EBITDA in Oil & Gas branches was down by 56.6%.
+3.3%
+12.7%
-45.0%
Q4 2014 Q4 2015
8
9
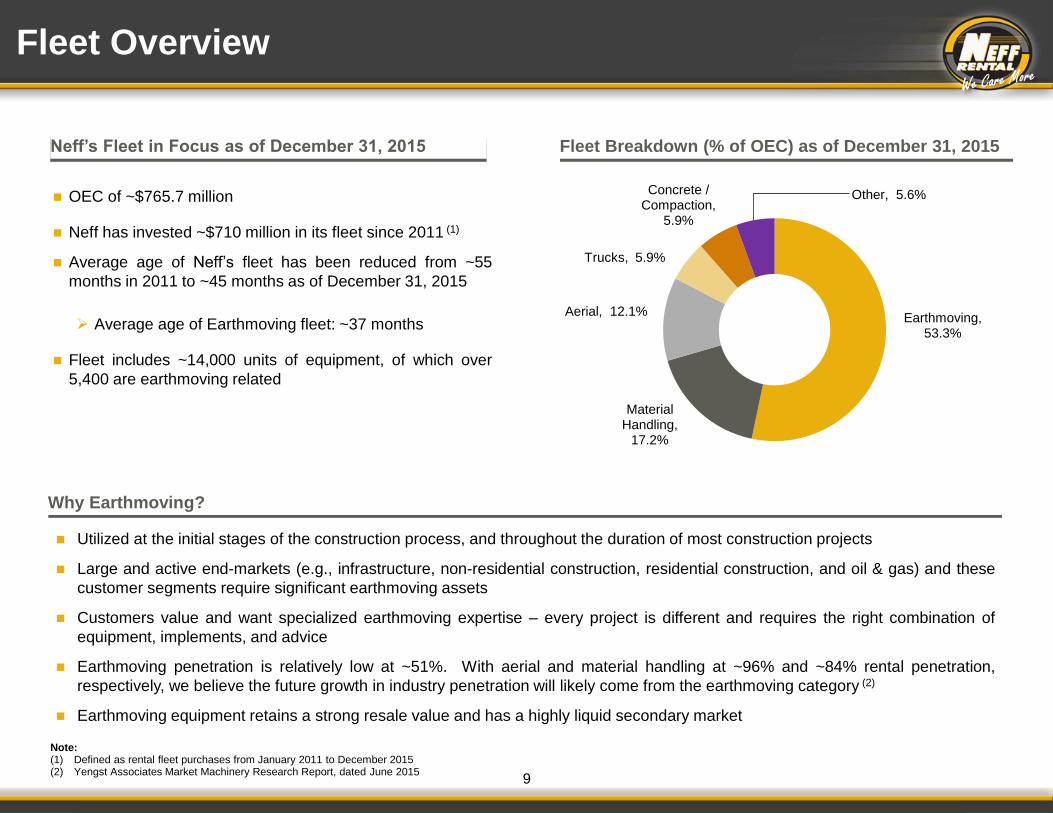
OEC of ~$765.7 million
Neff has invested ~$710 million in its fleet since 2011 (1)
Average age of Neff’s fleet has been reduced from ~55
months in 2011 to ~45 months as of December 31, 2015
Average age of Earthmoving fleet: ~37 months
Fleet includes ~14,000 units of equipment, of which over
5,400 are earthmoving related
Neff’s Fleet in Focus as of December 31, 2015
Fleet Overview
Fleet Breakdown (% of OEC) as of December 31, 2015
Why Earthmoving?
Utilized at the initial stages of the construction process, and throughout the duration of most construction projects
Large and active end-markets (e.g., infrastructure, non-residential construction, residential construction, and oil & gas) and these
customer segments require significant earthmoving assets
Customers value and want specialized earthmoving expertise – every project is different and requires the right combination of
equipment, implements, and advice
Earthmoving penetration is relatively low at ~51%. With aerial and material handling at ~96% and ~84% rental penetration,
respectively, we believe the future growth in industry penetration will likely come from the earthmoving category (2)
Earthmoving equipment retains a strong resale value and has a highly liquid secondary market
Earthmoving, 53.3%
Material Handling,
17.2%
Aerial, 12.1%
Trucks, 5.9%
Concrete / Compaction,
5.9%
Other, 5.6%
Note: (1) Defined as rental fleet purchases from January 2011 to December 2015 (2) Yengst Associates Market Machinery Research Report, dated June 2015

Mark Irion
Chief Financial Officer

Q4 2015 Results
11
Key Financial Metrics ($ in millions)
3-Months Ended December 31, 2014
3-Months Ended December 31, 2015
% ∆
Total Revenues $104.1 $106.1 +1.9%
Rental Revenues $83.7 $86.5 +3.3%
Adjusted EBITDA (1) $52.8 $49.4 (6.5%)
Adjusted EBITDA Margin (1) 50.7% 46.5% (420 bps)
Net Capital Expenditures ($2.6) ($6.3) nm
Select Operating Metrics ($ in millions)
3-Months Ended December 31, 2014
3-Months Ended December 31, 2015
% ∆
Average OEC $718.5 $782.6 +8.9%
Time Utilization 67.6% 66.8% (80 bps)
Weighted Average Rental Rate Growth 5.5% (1.3%)
Fleet Age (in months) 45 45 Flat
3-Months Ended December 31, 2015 – Year over Year Analysis
Note: (1) For a reconciliation of net income to Adjusted EBITDA, see page 17

YTD December 2015 Results
12
Key Financial Metrics ($ in millions)
12-Months Ended December 31, 2014
12-Months Ended December 31, 2015
% ∆
Total Revenues $372.0 $383.9 +3.2%
Rental Revenues $324.1 $336.0 +3.7%
Adjusted EBITDA (1) $186.1 $186.2 +0.0%
Adjusted EBITDA Margin (1) 50.0% 48.5% (150 bps)
Net Capital Expenditures $127.7 $125.8 (1.5%)
Select Operating Metrics ($ in millions)
12-Months Ended December 31, 2014
12-Months Ended December 31, 2015
% ∆
Average OEC $688.7 $761.9 +10.6%
Time Utilization 69.7% 66.8% (290 bps)
Weighted Average Rental Rate Growth 6.6% 1.0%
Fleet Age (in months) 45 45 Flat
12-Months Ended December 31, 2015 – Year over Year Analysis
Note: (1) For a reconciliation of net income to Adjusted EBITDA, see page 17

Debt and Liquidity Considerations
13
Summary Overview Current Debt Profile
Debt Maturity Profile
253.6
479.0
ABL @ L + 225 bps
Second Lien Term Loan @
L + 625 bps (1% LIBOR Floor)
$479.0
2015 2016 2017 2018 2019 2020 2021
$168
Unused
$257
Used
ABL 2nd Lien
Term Loan
Total debt of $732.6MM as of December 31, 2015
Total debt net of $2.0MM OID is $730.6MM
Total leverage of 3.9x based on 2015 Adjusted EBITDA of
$186.2MM
ABL leverage: 1.4x
Second lien leverage: 2.6x
Availability of $167.6MM on the ABL at December 31, 2015
Suppressed availability of $40.0MM
No debt maturities prior to 2018
$732.6
$425.0
Note: (1) Assumes $3.8 million in letters of credit obligation
(1)
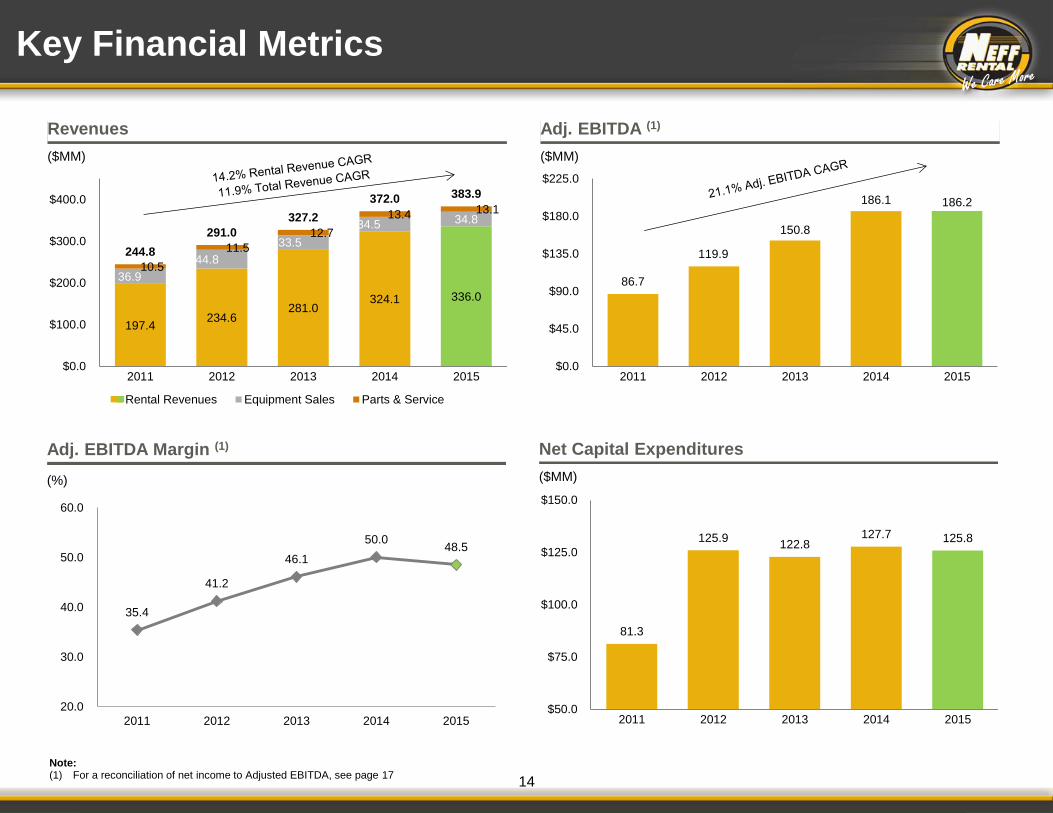
Net Capital Expenditures
($MM)
81.3
125.9 122.8
127.7 125.8
$50.0
$75.0
$100.0
$125.0
$150.0
2011 2012 2013 2014 2015
Key Financial Metrics
14
197.4 234.6
281.0 324.1 336.0
36.9
44.8
33.5
34.5 34.8
10.5
11.5
12.7
13.4 13.1
244.8
291.0
327.2
372.0 383.9
$0.0
$100.0
$200.0
$300.0
$400.0
2011 2012 2013 2014 2015
Rental Revenues Equipment Sales Parts & Service
86.7
119.9
150.8
186.1 186.2
$0.0
$45.0
$90.0
$135.0
$180.0
$225.0
2011 2012 2013 2014 2015
Revenues
($MM)
Adj. EBITDA (1)
($MM)
Note: (1) For a reconciliation of net income to Adjusted EBITDA, see page 17
35.4
41.2
46.1
50.0 48.5
20.0
30.0
40.0
50.0
60.0
2011 2012 2013 2014 2015
Adj. EBITDA Margin (1)
(%)

2016 Full Year Guidance
15
Current Guidance
Total revenue range: $390MM to $410MM
Adjusted EBITDA: $190MM to $200MM
Y-o-Y Rental rate increase: ~0-2%
Time utilization: ~68%
Net capital expenditures: $100MM to $110MM
Target leverage by end of 2016: 3.0x to 3.5x

Appendix

17
Reconciliation of Net Income to Adjusted EBITDA
“EBITDA" is defined as net income plus interest expense, provision for (benefit from) income taxes, depreciation of rental equipment, other depreciation and amortization and
amortization of debt issue costs. "Adjusted EBITDA" is defined as EBITDA further adjusted to give effect to non-cash items and other items that we do not consider to be indicative of
our ongoing operations, including for the periods presented loss on extinguishment of debt, transaction bonus, rental split expense, equity-based compensation and adjustment to tax
receivable agreement. Adjusted EBITDA is not a measure of performance in accordance with US GAAP and should not be considered as an alternative to net income (loss) or
operating cash flows determined in accordance with US GAAP. Additionally, Adjusted EBITDA is not intended to be a measure of cash flow for management's discretionary use, as it
excludes certain cash requirements such as interest payments, tax payments and debt service requirements. We believe that the inclusion of EBITDA and Adjusted EBITDA in this
investor presentation is appropriate because securities analysts, investors and other interested parties use these non-US GAAP financial measures as important measures of
assessing our operating performance across periods on a consistent basis. Adjusted EBITDA has limitations as an analytical tool and should not be considered in isolation or as a
substitute for analysis of our results as reported under US GAAP. Because EBITDA and Adjusted EBITDA are not calculated in the same manner by all companies, they may not be
comparable to other similarly titled measures used by other companies.
Notes:
(1) Represents expenses and realized losses that were incurred in connection with the extinguishment of debt.
(2) Represents the payment of incentive bonuses earned in connection with consummation of a refinancing to management and certain members of Neff Holdings' board of managers.
(3) Represents cash payments made to suppliers of equipment in connection with rental splits, which payments are credited against the purchase price of the applicable equipment if Neff
Holdings elects to purchase that equipment.
(4) Represents non-cash equity-based compensation expense recorded in the periods presented in accordance with US GAAP.
(5) For 2012, represents (i) the adjustment of certain interest rate swaps to fair value and (ii) loss on interest rate swaps. For 2015, represents loss on interest rate swap.
Reconciliation of Net income
to Adjusted EBITDA
$ 000’s 2012 2013 2014 2015 2014 2015
Net income 17,508$ 40,493$ 15,808$ 40,185$ 13,903$ 12,719$
Interest expense 23,221 24,598 40,481 43,025 12,168 10,851
Provision for (benefit from) income taxes 159 471 (5,359) 3,625 (749) 1,933
Depreciation of rental equipment 66,017 70,768 73,274 83,943 18,443 21,663
Other depreciation and amortization 9,041 8,968 9,591 10,498 2,442 2,702
Amortization of debt issue costs 1,461 1,929 3,061 1,547 366 403
EBITDA 117,407$ 147,227$ 136,856$ 182,823$ 46,573$ 50,271$
Loss on extinguishment of debt (1)
- - 20,241 - 4,345 -
Transaction bonus (2)
- - 24,506 - - -
Rental split expense (3)
932 2,343 3,658 2,300 1,782 535
Equity-based compensation (4)
1,478 1,224 883 1,249 93 348
Adjustment to tax receivable agreement - - - (2,424) - 52
Other (5)
102 - - 2,265 - (1,832)
Adjusted EBITDA 119,919$ 150,794$ 186,144$ 186,213$ 52,793$ 49,374$
Three Months Ended
December 31,

18
Other Financial Data and Operating Data
Other Financial Data and Operating Data
$ in 000's 2012 2013 2014 2015 2014 2015
Capital Expenditures
Purchases of rental equipment 159,192$ 144,483$ 149,174$ 147,483$ 13,244$ 8,524$
Purchases of non-rental equipment 11,556 11,852 13,018 13,134 1,289 1,392
Proceeds from sales of rental equipment (41,731) (30,976) (31,620) (32,143) (16,561) (15,470)
Proceeds from sales of non-rental equipment (3,097) (2,511) (2,859) (2,629) (563) (782)
Net Capital Expenditures 125,920$ 122,848$ 127,713$ 125,845$ (2,591)$ (6,336)$
OEC of rental equipment sales 95,888 69,834 69,605 69,324 40,499 32,959
Growth rental equipment capex 63,304 74,649 79,569 78,159 (27,255) (24,435)
Gross rental equipment capex 159,192$ 144,483$ 149,174$ 147,483$ 13,244$ 8,524$
Other Operating Data
Average OEC 527,266$ 606,624$ 688,733$ 761,855$ 718,506$ 782,555$
Fleet age in months (as of period end) 48 46 45 45 45 45
Weighted average rental rate growth 6.5% 6.4% 6.6% 1.0% 5.5% (1.3%)
Time utilization 68.7% 70.9% 69.7% 66.8% 67.6% 66.8%
Three Months Ended
December 31,

Net Capital Expenditures: Purchases of rental and non-rental equipment less proceeds from the sale of rental and non-rental
equipment.
Time Utilization: The daily average OEC of equipment on rent, divided by the OEC of all equipment in the rental fleet during the
relevant period.
EBITDA and Adjusted EBITDA: EBITDA represents net income (loss) plus interest expense, provision for (benefit from) income
taxes, depreciation of rental equipment, other depreciation and amortization and amortization of debt issue costs. Adjusted EBITDA
represents EBITDA further adjusted to give effect to non-cash and other items that we do not consider to be indicative of future
performance.
Fleet Age: The OEC weighted age of the entire fleet, excluding the benefit of refurbishments.
OEC: The first cost of acquiring the equipment, or in the case of used equipment purchases and rental splits, an estimate of the first
cost that would have been paid to acquire the equipment if it had been purchased new in its year of manufacture, as the daily average
OEC of equipment on rent, divided by the OEC of all equipment in the rental fleet during the relevant period.
Weighted Average Rental Rate Growth: The percentage change in the rate/price that is charged for equipment on rent. Overall
company rental rates change based on a combination of pricing, fleet composition and term of rental. This metric is used to evaluate
rate changes both year-over-year and sequentially (typically quarter-over-quarter). Rental rate changes are calculated based on the
year-over-year or sequential variance in average contract rates, weighted by the prior period revenue mix.
Return on invested capital (ROIC): The ROIC metric uses after-tax operating income for the trailing 12 months divided by average
stockholders’ equity (deficit) and debt and deferred taxes, net of average cash. To mitigate the volatility related to fluctuations in the
Company’s tax rate from period to period, a federal statutory tax rate of 35% is used to calculate after-tax operating income.
19
Glossary of Terms