Embed Size (px)
Citation preview

Q4 2014 Investor Presentation Svenn-Tore Larsen, CEO Pål Elstad, CFO
February 10, 2015

2
Summary – Q4 2014:
Revenue of MUSD 45.2, a 27% increase from Q4 2013, with growth across all key market areas
BT Smart sales of MUSD 22.9, a 24.5% increase from last quarter
2014 Total Revenue of MUSD 167.0 with Bluetooth Smart revenue of MUSD 62.9. First year with total revenue in excess of NOK 1 Billion
Successfully launched operations in Finland
Design activity for Bluetooth Smart will continue to drive high growth
Q4
20
14
Investo
r P
resentatio
n

3
Financial Highlights Pål Elstad, CFO
Q4
20
14
Investo
r P
resentatio
n

4
Q4 2014 Financial Highlights (MUSD) Q4
20
14
Investo
r P
resentatio
n
MUSD
Financial objectives Q4 2014 Q3 2014 Q4 2013 Comments
Growth
Revenue 45,2 49,0 35,6
Exceptionally strong growth within BT Smart. Q4
2014 > 2013
Order Inflow 32,9 43,7 27,7
Profitability
Gross Margin % 52,4 % 50,8 % 53,4 % Higher BT Smart revenue increase gross margin.
Operating Profit (EBIT) 6,3 9,8 4,6
EBIT Margin % 13,9 % 20,1 % 13,0 %
Net Profit after tax 6,7 7,0 3,3
Cash Flow
Free Cash Flow 9,7 13,9 -2,4 Strong cashflow
Cash Balance 34,1 24,4 26,1
Accounts Receivable 39,3 41,1 30,0
Inventory 27,9 20,6 22,2
Higher revenue drives EBIT growth
Opex increases with higher R&D and sales activity
Strong sales
Inventory normalized after Q3, however still low

5 Group Revenues Q4
20
14
Investo
r P
resentatio
n
Revenue split by technology, 2012 – Q4 2014 (MUSD)
Q4 2014 Revenue of MUSD 45.2 (27% increase from prior year)
First year with total revenue in excess of NOK 1 Billion (MUSD 167)
0
5
10
15
20
25
30
35
40
45
50
Q1 2012 Q2 2012 Q3 2012 Q4 2012 Q1 2013 Q2 2013 Q3 2013 Q4 2013 Q1 2014 Q2 2014 Q3 2014 Q4 2014
ASIC’s / Consulting
Bluetooth Smart
Proprietary wireless
Y-o-Y -5.2% Y-o-Y +34.3% Y-o-Y -5.6%

6 Market segments – Q4 2014 (Q4 2013) Q4
20
14
Investo
r P
resentatio
n
PC / Tablet Accessories Wireless PC mouse and keyboard, tablet accessories
Q4 Revenue: MUSD 18.4 (MUSD 17.5)
• Sales of PC accessories stabilize • First contribution from Tablets
Consulting services Custom electronics design
Q4 Revenue: MUSD 0.3 (MUSD 0.1)
• Project services for existing ASIC customers
Mobile / Wearable devices Sports, medical monitors, mobile accessories, proximity tags, watches
Q4 Revenue: MUSD 18.1 (MUSD 10.5)
• New product launches from main customers
Home electronics devices TV / appliance remotes, game controls, wireless charging, toys
Q4 Revenue: MUSD 2.6 (MUSD 1.0)
• New Bluetooth Smart toy and home media designs drive growth
ASICs (application specific IC’s) Wide sector span
Q4 Revenue: MUSD 2.0 (MUSD 2.9)
• Supporting existing customers only, not a focus area for growth. Sales fluctuates based on few designs.
Installed Sensor networks RFID systems, building sensors, industrial automation, automotive
Q4 Revenue: MUSD 3.7 (MUSD 3.6)
• Strong growth in Beacons and stable sales to large RFID customer

7
0
10
20
30
40
50
Q1/12 Q2/12 Q3/12 Q4/12 Q1/13 Q2/13 Q3/13 Q4/13 Q1/14 Q2/14 Q3/14 Q4/14
Order inflow / order backlog Q4
20
14
Investo
r P
resentatio
n
Order Inflow and Backlog 2012 – Q4 2014 (MUSD)
Order inflow of MUSD 32.9 in Q4 2014
Order backlog of MUSD 20.3 at quarter-end Order cycle remains short as BLE Revenue drives new revenue streams
Mid-life update on nRF-51 to XLR3 – managed transition closely
Backlog
Order Inflow

8
Gross margin Q4
20
14
Investo
r P
resentatio
n
Gross Margin % of revenue 2012 – Q4 2014
Gross margin of 52.4 % in Q4 2014 Gross margin increases from prior quarters, due to product mix within BT Smart
30%
40%
50%
60%
Q1/12 Q2/12 Q3/12 Q4/12 Q1/13 Q2/13 Q3/13 Q4/13 Q1/14 Q2/14 Q3/14 Q4/14

9
Operating profit (EBIT) Q4
20
14
Investo
r P
resentatio
n
Operating Profit by quarter 2012 – Q4 2014 (MUSD)
Operating profit in Q4 2014 of MUSD 6.3 (36.5% growth from prior year) Higher revenue offset by increased operating expenses
0
2
4
6
8
10
Q1/12 Q2/12 Q3/12 Q4/12 Q1/13 Q2/13 Q3/13 Q4/13 Q1/14 Q2/14 Q3/14 Q4/14

10 Operating Expenses
Operating expenses (incl. depreciation) of MUSD 17.4 in Q4 2014
Growth in expenses is driven by higher staffing and activity in R&D and Sales, plus IFRS accounting impact of options and capitalized R&D. Currency adjusted increase is 17%
Increased growth in operating expenses is projected from 2015 with the establishment of team in Finland
Q4
20
14
Investo
r P
resentatio
n
* Non-IFRS Operating expense is adjusted for options, capitalized R&D and related depreciation costs
** IFRS accounting expense from grant of options, plus related payroll taxes
*** Net Opex impact of Capitalized R&D and related depreciation costs
USD '000 Q4 2014 Q3 2014 Q4 2013 Growth Y-o-Y
Total Operating Expense (non-IFRS), 13 673 12 129 13 085 4 %
excluding Depreciation*
Add: Options expense** 2 071 1 337 853
Less: Capitalized R&D*** (206) (185) (1 009)
Total Operating Expense (IFRS), 15 538 13 281 12 930 20 %
excluding Depreciation

11
Q4 2014 Financial Summary Q4
20
14
Investo
r P
resentatio
n
Strong revenue growth across all targeted product segments
Revenue growth
Profitability
Cash Flow
Group revenue of MUSD 45.2 (MUSD 35.6)
– Bluetooth Smart sales grow to MUSD 22.9 , or 50.7% of revenue (from 27% in Q4 2013)
– Exceptionally strong growth in Bluetooth Smart
Order inflow of MUSD 32.9 (MUSD 27.7)
EBIT of MUSD 6.3 (MUSD 4.6)
– Higher revenue drives EBIT growth
– Higher gross margins
Free cash flow of MUSD 9.7 (MUSD -2.7)
– Growth will increase working capital requirements during 2015
– Ending cash balance of MUSD 34.1

12
Business Outlook Svenn-Tore Larsen, CEO
Q4
20
14
Investo
r P
resentatio
n

13 CES – 2015 Great Interest for Nordic
IPV6 – More than 3 500 downloads since release
15 unique vendors of Rezence Charges with Nordic inside
Major players displays wearable Bluetooth Smart Modules
Major players display remote controls with Bluetooth Smart
Massive publicity in Media in connection with CES
Q4
20
14
Investo
r P
resentatio
n
14 Record sales of Bluetooth Smart solutions
0
2
4
6
8
10
12
14
16
18
20
22
24
Q1/12 Q2/12 Q3/12 Q4/12 Q1/13 Q2/13 Q3/13 Q4/13 Q1/14 Q2/14 Q3/14 Q4/14
Total Nordic revenue from Bluetooth Smart, 2012 – Q4 2014 (MUSD)
Sales of Bluetooth Smart solutions increase to MUSD 22.9 in Q4 2014, as demand for «Internet of Things» applications grows
Q4
20
14
Investo
r P
resentatio
n
15
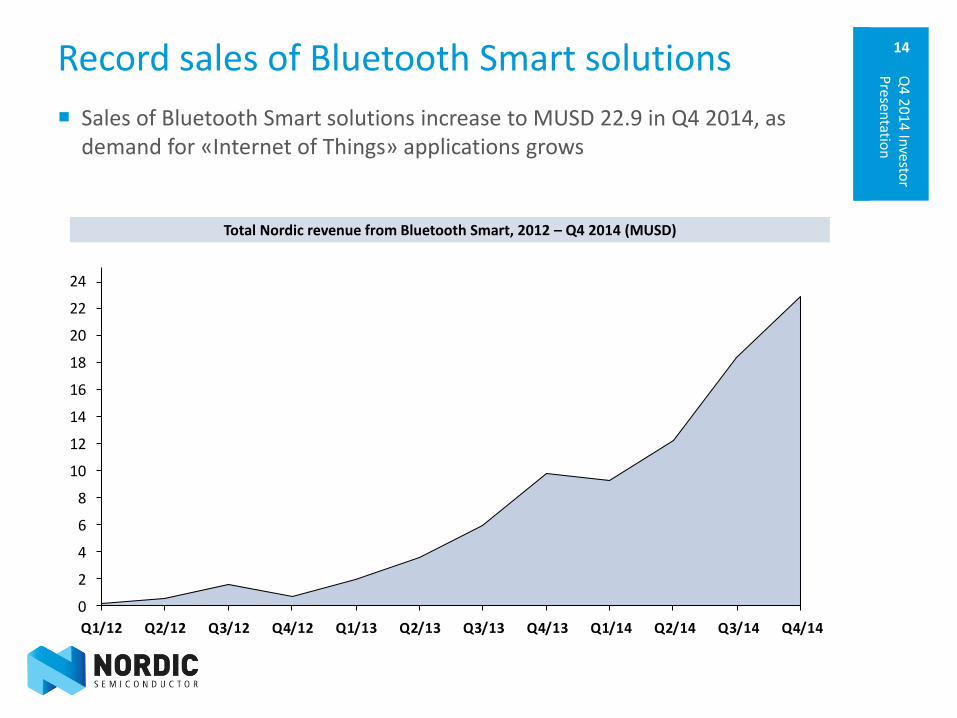
Exploding interest in the «IoT» is driving record sales of Nordic’s development kits
0
2000
4000
6000
8000
10000
12000
2011 2012 2013 1H2014
2H2014
Sales of development kits (units)
3415
5823
7836
Record high 11862 development kits sold in 2H 2014
Close to a tripling compared to 2013
Huge growth in demand for Bluetooth Smart development kits
Q4
20
14
Investo
r P
resentatio
n
10218
11862
16
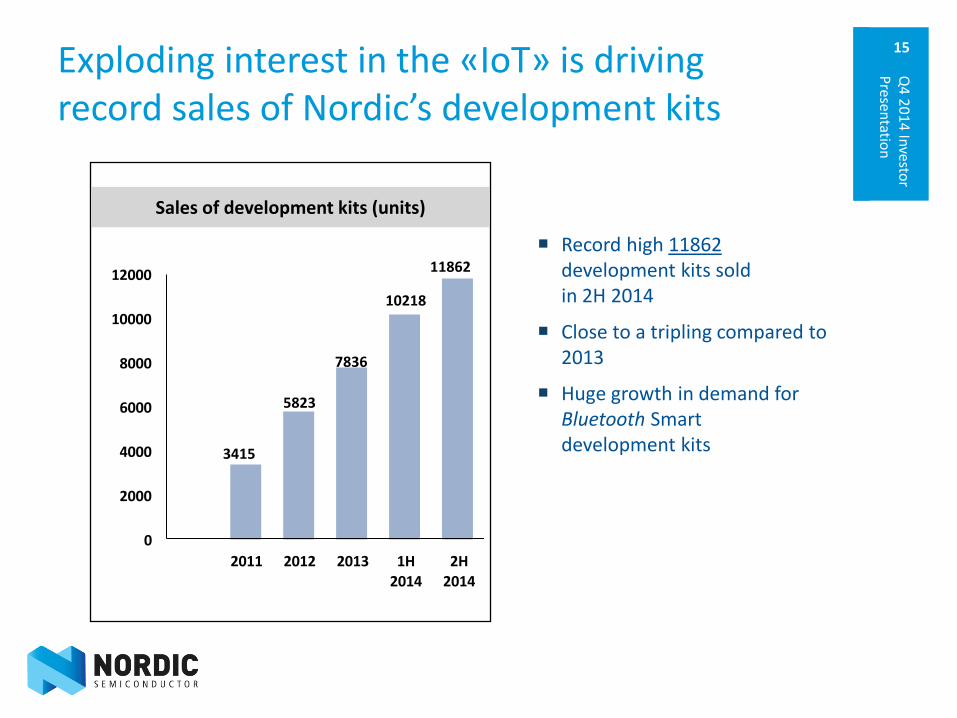
Massive opportunity in IoT for Nordic Product Strategy CONFIDENTIAL
28 billion
internet connected things in 2020
(Source: hbr.org)
Q4
20
14
Investo
r P
resentatio
n

17
Nordic’s IoT vision A large scale heterogeneous network
Ultimately bigger than the “core” internet
Not a single technology to rule the IoT
Some will be more relevant
… wireless is key
… open standard is key
… interoperability is key
… infrastructure / adoption is key
… native IP support is key
Different technologies for different things
Range, throughput, infrastructure, power, cost etc.
“Core” Internet Servers, Services, PCs,
Phones, routers (..)
Internet of Things
Edge router
Q4
20
14
Investo
r P
resentatio
n
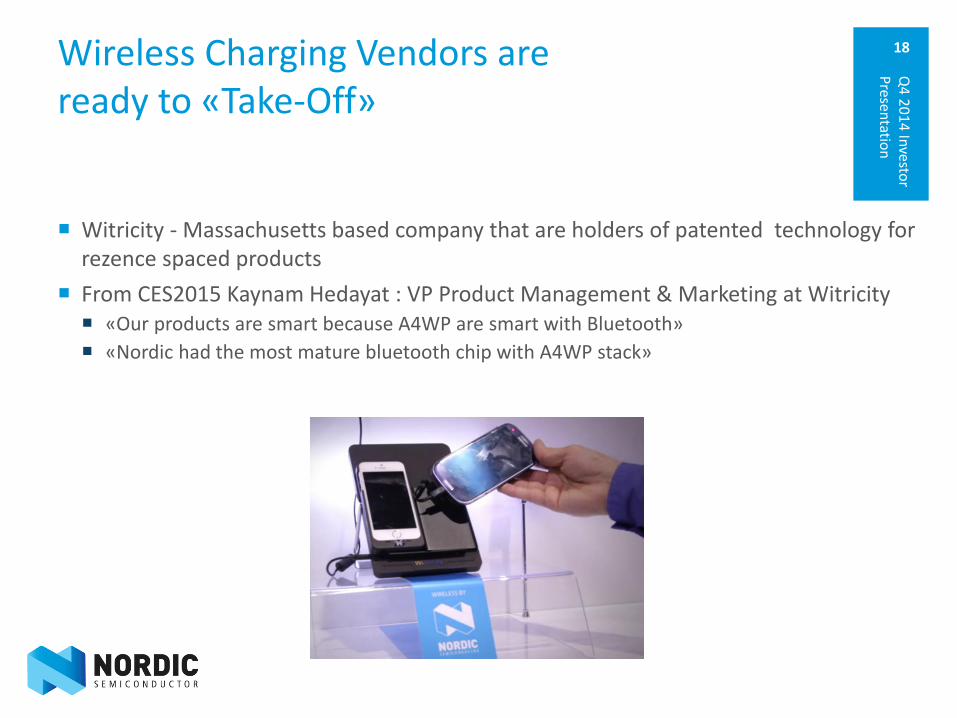
18 Wireless Charging Vendors are ready to «Take-Off»
Witricity - Massachusetts based company that are holders of patented technology for
rezence spaced products
From CES2015 Kaynam Hedayat : VP Product Management & Marketing at Witricity «Our products are smart because A4WP are smart with Bluetooth»
«Nordic had the most mature bluetooth chip with A4WP stack»
Q4
20
14
Investo
r P
resentatio
n

19
A major leap forward for Nordic R&D Finland up & running
Recent years have proven the importance of technological leadership. Nordic is now starting to see results of being an innovator in BLE
Nordic has taken advantage of a large pool of available talents in Oulu, Finland to set up a R & D center and invest in a related field with enormous market potential
In fierce competition with other tech giants Nordic secured the best talent available due to: Culture
Speed of execution
Reputation
Reliable road map to success
Q4
20
14
Investo
r P
resentatio
n

20 Core information regarding Finland
100 employees
USD 5 million/quarter expected cost going forward
Will be reported as a separate item
3-4 years of development until revenue can be expected
Product to be developed is within LTE
The project is based on Nordic`s existing technology platform coupled with the unique experience and skill within LTE of the Finnish engineers
Q4
20
14
Investo
r P
resentatio
n

21
Business Outlook
Strong growth in revenues, driven by Bluetooth Smart sales
Gross margin of approximately 50% in 2015
Higher OPEX in 2015 as a result of higher R&D spending in order to take advantage of upcoming complementary standards
Change in reporting format from 2015 No revenue guidance
Further development of market reporting
Q4
20
14
Investo
r P
resentatio
n

22
Mobile World Congress 2-5 March 2015 Q4
20
14
Investo
r P
resentatio
n

23
For more information on Nordic Sign up for a Nordic MyPage account on our website -
www.nordicsemi.com
Provides latest company and investor news directly to your Email address
• Wireless Quarterly magazine – learn more about Nordic’s products and markets
• Direct links to Nordic content on YouTube, Facebook, LinkedIn, Twitter
• Press releases
• Stock exchange notices
Q4
20
14
Investo
r P
resentatio
n