Embed Size (px)
Citation preview
Q3 FY17 Investor Update

19891994
2002
2004
2009
2011
2012
2013
Incorporated
IPO
AAA Rating
GDR Issue
Crossed Rs. 500 crs profit
Crossed Rs. 50,000 Cr loan portfolio
• Best HFC by CNBC TV 18• Construction Industry Award
•Crossed Rs. 1000 cr profit &Rs 75,000 Cr assets
2015
2
2014
• Best HFC by ABP News
•Crosses Rs 1 lakh cr in portfolio •Best Housing Finance Co. by BFSI Awards• Best data quality in HFCby CIBIL
A Journey of 27 Years…
•Business Today-Best CEO Award• Business World -Most Respected Co Award•Outlook Money-Best HFC•Best HFC by ABP News•Best Data Quality by CIBIL•Asia Pacific Entrepreneurship Award•Power Brands Awards by Franchise India
2016
2017
•Outlook Money-Best HFC•Business Today BFSI Best CEO

3
Q3 FY17 PAT at Rs 499.26 cr as against Rs 418.90 up 19%
Q3 FY17 Revenue from operations up by 13% to Rs 3513 cr
Outstanding Loan portfolio up by 15% to Rs. 135366 cr
Individual Loan Portfolio up by 15% to Rs 130878 cr
Q3FY17 Loan Disbursements Rs 9684 cr against Rs 8422 cr up by 15%
Individual Loan Disbursements Rs 8555 cr against Rs 8067 cr
Net Interest Income Rs 915 cr up by 23 %
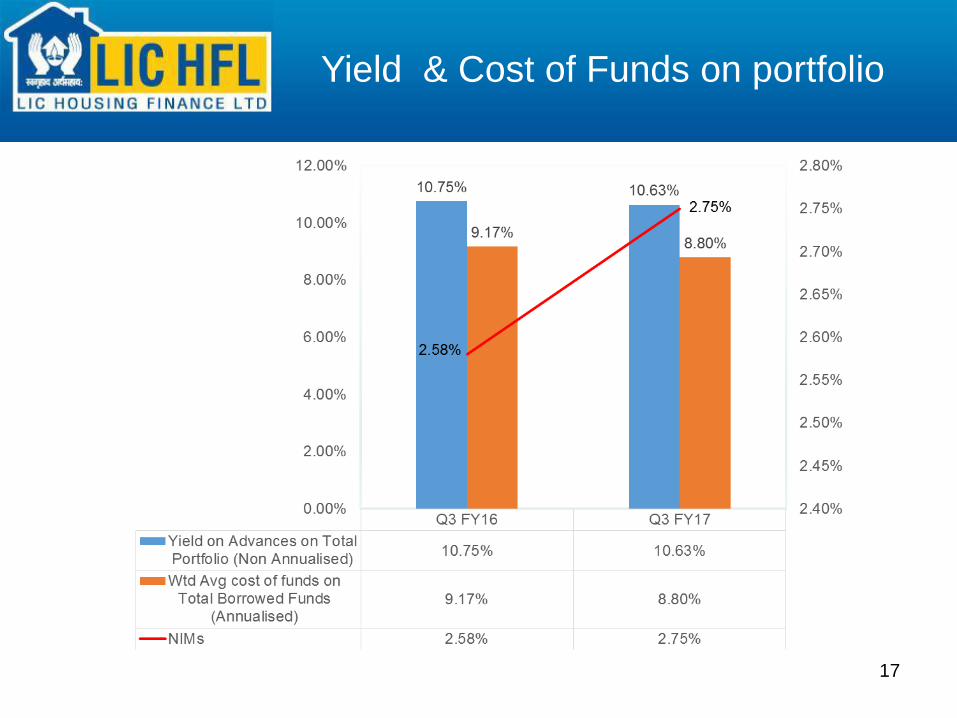
Net Interest Margins 2.75% for Q3 FY17 as against 2.58% for Q3FY16
Gross NPAs at 0.56% as against 0.58% as on 31.12.2016
Net NPAs 0.27% as against 0.32% on corresponding dates
Individual Loans Gross NPAs 0.32% against 0.32% as on 31.12.2016
Total Provisions at Rs 969 cr as against total Gross NPAs of Rs 759 cr
Executive Summary – Q3 FY17

4
Disbursement (Rs. Cr) CAGR 16%
Profit After Tax (Rs. cr) CAGR 16%Income (Rs. cr) CAGR 19%
Loan Portfolio (Rs.cr) CAGR 19%
Update – last 5 years
5
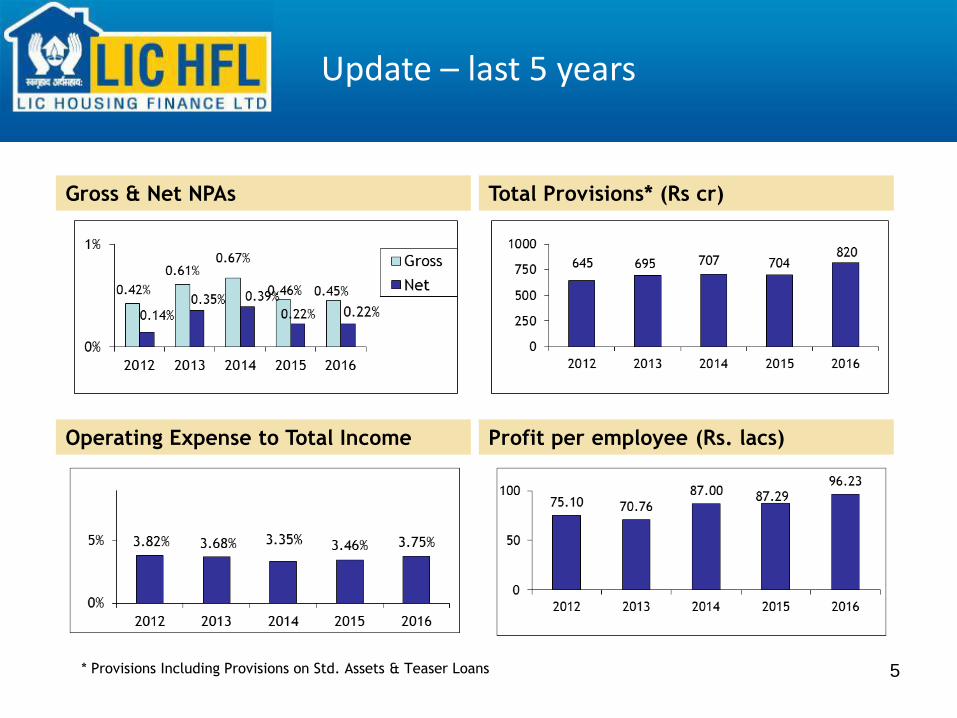
Gross & Net NPAs
Operating Expense to Total Income
Total Provisions* (Rs cr)
Profit per employee (Rs. lacs)
* Provisions Including Provisions on Std. Assets & Teaser Loans
Update – last 5 years

6
EPS (Rs) (Rs 2 pd up)
Return on Avg Equity
Book Value (Rs)(Rs 2 pd up)
Return on Avg Loan Assets
Update – last 5 years

7
• 7 Regional Offices
• 21 Back Offices
• 245 Marketing Offices
• Rep offices in Dubai & Kuwait
• Coverage of more than 450 centres
• 1735 Employees
Back offices
Operating offices
Regional offices
Corporate office
Nagercoil
ThiruvananthapuramKottayam
Ernakulam
Kozhikode
Thrissur
Tirumangalam
Madurai
ThanjavurPondicherry
Tiruchirapalli
Coimbatore
Salem
Vellore
ChennaiHosurMysore
Mangalore
Bengaluru
Panjim
Vashi
Mumbai
NelloreHubliTirupati
BellaryAnantapur
Kurnool
Guntur
Kakinada
Vijayawada
Hyderabad Rajahmundry
Visakapatnam
Warangal
Bhubaneshwar
Kolkata
Silchar
Guwahati
Siliguri
Gangtok
Patna
ShimlaJalandharAmritsar
LudhianaChandigarh
Dehradun
HaldwaniKarnal
Bareilly
GhaziabadNew Delhi
AgraLucknow
Kanpur
JaipurAjmer
Gwalior
Bikaner
Jodhpur
Rajkot
Udaipur
Ahmedabad
Vadodara Indore
Bhopal
Allahabad
Jabalpur
Varanasi
Ranchi
Jamshedpur
RourkelaBilaspur
RaipurNagpurJalgaonSuratVapi
AurangabadNasik
KalyanThaneJogeshwari
Pune
Kolhapur
Belgaum
Gulburga
Nallasopara
Kota
Hassan
Erode
Kannur
Kollam
Palghat
Gandhidham
Satara
Durg-Bhilai
Gorakhpur
Meerut
Behrampur
Cuttack
Dhanbad
Durgapur
Jorhat
Malda
GurgaonFaridabad
Noida
AmbalaBhatinda
HisarPatiala
Geographic Presence

8
HOME LOAN AGENTS (HLAs)
(Agents of LIC)
DIRECT SALES AGENTS (DSAs)
(Small Firms/Companies etc)
CUSTOMER RELATIONS
ASSOCIATES (CRAs)
(Individual Agents)
245Marketing Offices
39 branches of
LICHFL Financial Services(100% subsidiary of LICHFL)
Distribution Network

9
Origination Pattern &
Average Ticket Size

10
Loan Book Composition
O/s Portfolio Rs. 131096 crO/s Portfolio Rs. 135366 cr
31.12.2016 30.09.2016
11
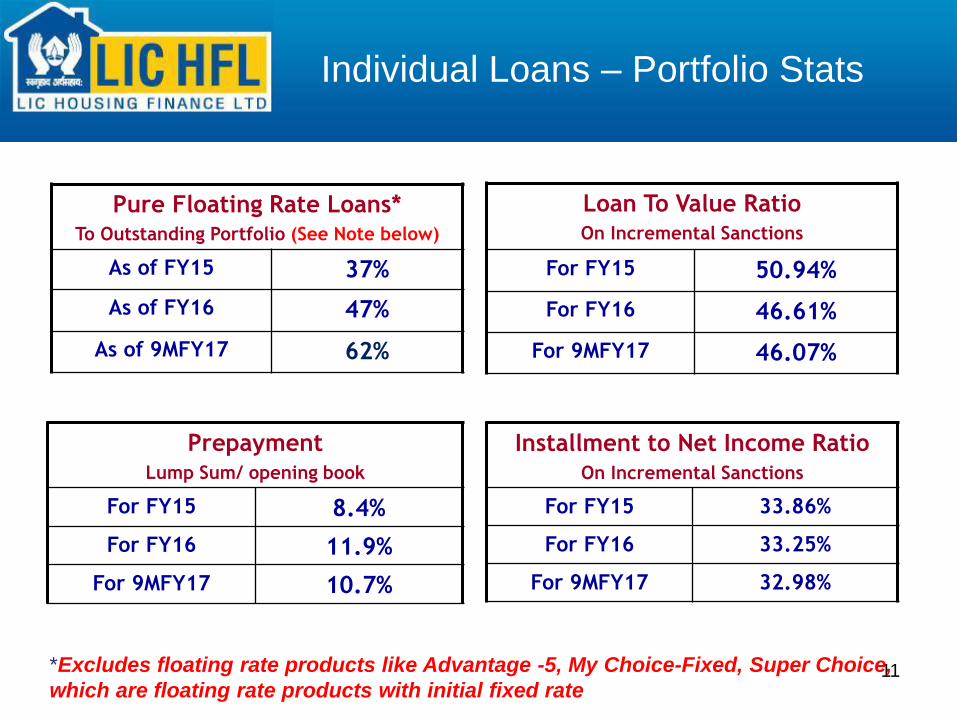
Installment to Net Income RatioOn Incremental Sanctions
For FY15 33.86%
For FY16 33.25%
For 9MFY17 32.98%
Loan To Value RatioOn Incremental Sanctions
For FY15 50.94%
For FY16 46.61%
For 9MFY17 46.07%
Pure Floating Rate Loans*To Outstanding Portfolio (See Note below)
As of FY15 37%
As of FY16 47%
As of 9MFY17 62%
PrepaymentLump Sum/ opening book
For FY15 8.4%
For FY16 11.9%
For 9MFY17 10.7%
*Excludes floating rate products like Advantage -5, My Choice-Fixed, Super Choice,
which are floating rate products with initial fixed rate
Individual Loans – Portfolio Stats
12
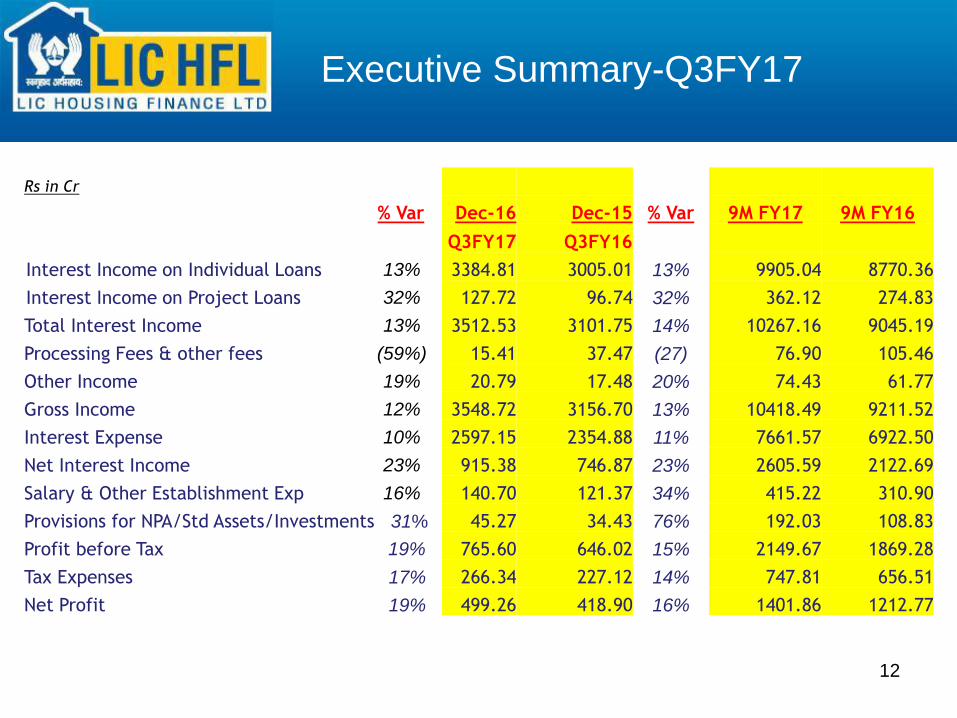
Executive Summary-Q3FY17
Rs in Cr
% Var Dec-16 Dec-15 % Var 9M FY17 9M FY16
Q3FY17 Q3FY16
Interest Income on Individual Loans 13% 3384.81 3005.01 13% 9905.04 8770.36
Interest Income on Project Loans 32% 127.72 96.74 32% 362.12 274.83
Total Interest Income 13% 3512.53 3101.75 14% 10267.16 9045.19
Processing Fees & other fees (59%) 15.41 37.47 (27) 76.90 105.46
Other Income 19% 20.79 17.48 20% 74.43 61.77
Gross Income 12% 3548.72 3156.70 13% 10418.49 9211.52
Interest Expense 10% 2597.15 2354.88 11% 7661.57 6922.50
Net Interest Income 23% 915.38 746.87 23% 2605.59 2122.69
Salary & Other Establishment Exp 16% 140.70 121.37 34% 415.22 310.90
Provisions for NPA/Std Assets/Investments 31% 45.27 34.43 76% 192.03 108.83
Profit before Tax 19% 765.60 646.02 15% 2149.67 1869.28
Tax Expenses 17% 266.34 227.12 14% 747.81 656.51
Net Profit 19% 499.26 418.90 16% 1401.86 1212.77

Executive Summary-Q3FY17
% Var Dec-16 Dec-15 % Var 9M FY17 9M FY16
Disbursements Q3FY17 Q3FY16
Individual 8555 8067 24374 21953
Project 1129 354 1975 981
Total 9684 8421 26349 22935
Borrowings during the period 13967 11603 37419 29351
Net Interest margins 2.75% 2.58% 2.67% 2.51%
Incremental Cost(i.e for the YTD) 8.19% 8.75%
Incremental Yield(overall,annualised) 10.69% 10.85%
Incremental Spreads 2.50% 2.10%
Outstanding Portfolio
Individual 130878 114305
Project 4488 3091
Total 135366 117396
Outstanding Liabilities 119428 103816
Rs cr

14
9M FY2017 9M FY2016
Return on Average Equity (%) 19% 19%
Return on Average Assets (%) 1.5% 1.4%
Earnings per share (on Rs 2 pd up) 27.78 24.03
Capital Adequacy Ratio
Tier I
Tier II
Total
Sept 2016
13.99
2.65
16.63
Sept 2015
12.46
3.04
15.51
Financial Highlights

15
Bank9.2%
NCD80.7%
Sub. Debt & Upper Tier II
2%
Deposits4.3%
NHB2.4%
CP0.7%
FCNRB Loans0.4%
Outstanding Borrowings – Rs. 119428 cr
Source Wtd
Avg
Cost
(%)
Banks 9.50%
Non Convertible Debenture 8.75%
Deposits 8.37%
National Housing Bank 8.57%
FCNRB Loans 9.66%
Sub. Debt & Upper Tier II 9.18%
Commercial Paper 6.83%
Total 8.80%
as on 31.12.2016
Liability Profile
During Q3FY17, Borrowings were Rs 13967 @ 7.84%

16
Change in Liability Mix
Wtd. Avg. cost
of Funds
Bank funding has
reduced from
32% in FY12 to
25% in FY14.
Retail Deposits
increased to 2.2%
8.80% 8.94% 9.08% 9.14% 9.48
Bank Funding down
from 32% in FY12 to
9.2% in Q3FY17.
Retail Deposits have
also increased in the
same period
17
Yield & Cost of Funds on portfolio

18
NIMs

19
31.12.2016 31.12.2015
Gross NPA (Rs. cr) 759 682
Gross NPA (%) 0.56% 0.58%
Provisions for NPA (Rs. cr) 398 308
Net NPA(%) 0.27% 0.32%
Provisions incl standard asset prov.(Rs. cr) 969 788
Gross & Net NPAs
Provisions cover incl standard asset prov.(%) 128% 116%

20
Gross & Net NPAs
21
DISCLAIMER
This presentation is made purely for information. We have attempted to provide relevantinformation which we believe will help in knowing the Company. The users may use their ownjudgment and are advised to make their own calculations before deciding on any matter basedon the information given herein.
While every care is taken to verify the accuracy of the information given in this presentation,neither the Company nor its officials would in any way be liable for any action taken or nottaken by the viewers or the users of this presentation or for any claims, losses etc.
Thank you