Embed Size (px)
Citation preview

Q3 2021 Earnings Presentation
November 8, 2021
2
FORWARD-LOOKING STATEMENTSThis presentation contains “forward-looking statements” within the meaning of the Private Securities Litigation Reform Act of 1995. These forward-looking statements reflect our current views with respect to, among other things, ouroperations and financial performance. Forward-looking statements include all statements that are not historical facts. These forward-looking statements relate to matters such as our industry, business strategy, goals, and expectationsconcerning our market position, future operations, margins, profitability, capital expenditures, liquidity and capital resources, and other financial and operating information. In some cases, you can identify these forward-lookingstatements by the use of words such as “anticipate,” “assume,” “believe,” “continue,” “could,” “estimate,” “expect,” “intend,” “may,” “plan,” “potential,” “predict,” “project,” “future,” “will,” “seek,” “foreseeable,” “target,” “guidance,” thenegative version of these words, or similar terms and phrases.These forward-looking statements are subject to various risks, uncertainties, assumptions, or changes in circumstances that are difficult to predict or quantify. Such risks and uncertainties include, but are not limited to, thefollowing: the impact of COVID-19 and related risks on our results of operations, financial position, and/or liquidity; our operations in a highly regulated industry and the fact that we are subject to numerous and evolving laws andregulations, including with respect to personal data and data security; our reliance on third-party data providers; negative changes in external events beyond our control, including our customers’ onboarding volumes, economic driverswhich are sensitive to macroeconomic cycles, and the COVID-19 pandemic; potential harm to our business, brand, and reputation as a result of security breaches, cyber-attacks, or the mishandling of personal data; the continuedintegration of our platforms and solutions with human resource providers such as applicant tracking systems and human capital management systems as well as our relationships with such human resource providers; disruptions,outages, or other errors with our technology and network infrastructure, including our data centers, servers, and third-party cloud and internet providers and our migration to the cloud; our ability to obtain, maintain, protect and enforceour intellectual property and other proprietary information; our indebtedness could adversely affect our ability to raise additional capital to fund our operations, limit our ability to react to changes in the economy or our industry, andprevent us from meeting our obligations; and our Sponsor (Silver Lake Group, L.L.C., together with its affiliates, successors, and assignees) controls us and may have interests that conflict with ours or those of our stockholders.For additional information on these and other factors that could cause First Advantage’s actual results to differ materially from expected results, please see our prospectus, dated June 22, 2021, filed with the Securities and ExchangeCommission (the “SEC”) pursuant to Rule 424(b)(4) of the Securities Act of 1933, as such factors may be updated from time to time in our periodic filings with the SEC, which are accessible on the SEC’s website at www.sec.gov. Theforward-looking statements included in this presentation are made only as of the date of this presentation, and we undertake no obligation to publicly update or review any forward-looking statement, whether as a result of newinformation, future developments, or otherwise, except as required by law.
NON-GAAP FINANCIAL INFORMATIONThis presentation contains “non-GAAP financial measures” that are financial measures that either exclude or include amounts that are not excluded or included in the most directly comparable measures calculated and presented inaccordance with accounting principles generally accepted in the United States (“GAAP”). Specifically, we make use of the non-GAAP financial measures “Adjusted EBITDA,” “Adjusted EBITDA Margin,” “Adjusted Net Income,” and“Adjusted Diluted Earnings Per Share.”Adjusted EBITDA, Adjusted EBITDA Margin, Adjusted Net Income, and Adjusted Diluted Earnings Per Share have been presented in this presentation as supplemental measures of financial performance that are not required by orpresented in accordance with GAAP because we believe they assist investors and analysts in comparing our operating performance across reporting periods on a consistent basis by excluding items that we do not believe areindicative of our core operating performance. Management believes these non-GAAP measures are useful to investors in highlighting trends in our operating performance, while other measures can differ significantly depending onlong-term strategic decisions regarding capital structure, the tax jurisdictions in which we operate, and capital investments. Management uses Adjusted EBITDA, Adjusted EBITDA Margin, Adjusted Net Income, and Adjusted DilutedEarnings Per Share to supplement GAAP measures of performance in the evaluation of the effectiveness of our business strategies, to make budgeting decisions, to establish discretionary annual incentive compensation, and tocompare our performance against that of other peer companies using similar measures. Management supplements GAAP results with non-GAAP financial measures to provide a more complete understanding of the factors and trendsaffecting the business than GAAP results alone.Adjusted EBITDA, Adjusted EBITDA Margin, Adjusted Net Income, and Adjusted Diluted Earnings Per Share are not recognized terms under GAAP and should not be considered as an alternative to net income (loss) as a measure offinancial performance or cash provided by (used in) operating activities as a measure of liquidity, or any other performance measure derived in accordance with GAAP. The presentations of these measures have limitations asanalytical tools and should not be considered in isolation or as a substitute for analysis of our results as reported under GAAP. Because not all companies use identical calculations, the presentations of these measures may not becomparable to other similarly titled measures of other companies and can differ significantly from company to company.We define Adjusted EBITDA as net income before interest, taxes, depreciation, and amortization, and as further adjusted for loss on extinguishment of debt, share-based compensation, transaction and acquisition-related charges,integration and restructuring charges, and other non-cash charges. We define Adjusted EBITDA Margin as Adjusted EBITDA divided by total revenues. We define Adjusted Net Income for a particular period as net income before taxesadjusted for debt-related costs, acquisition-related depreciation and amortization, share-based compensation, transaction and acquisition-related charges, integration and restructuring charges, and other non-cash charges, to whichwe then apply the related effective tax rate. We define Adjusted Diluted Earnings Per Share as Adjusted Net Income divided by adjusted weighted average number of shares outstanding—diluted. For reconciliations of these non-GAAP financial measures to the most directly comparable GAAP measures, see the reconciliations included at the end of this presentation. Numerical figures included in the reconciliations have been subject to rounding adjustments.Accordingly, numerical figures shown as totals in various tables may not be arithmetic aggregations of the figures that precede them.
Disclaimer

3
Company Overview, Q3 2021 HighlightsScott StaplesChief Executive Officer

4
Key Strategies
1. Average retention rate from 2018 to 2020. 2. Tenure for top 100 customers.3. As of Q3’21.4. LTM Q3’21.5. LTM Q3’20 period is presented on a pro forma basis for the “Silver Lake Transaction” and the related refinancing (On January 31, 2020, a fund managed by Silver Lake
acquired substantially all of the Company's equity interests from the Predecessor equity owners, primarily funds managed by Symphony Technology Group). See appendix for pro forma reconciliation.
6. See appendix for Adjusted EBITDA and Adjusted EBITDA Margin reconciliation.
OUR MARKET
OUR CUSTOMERS
~95%5575M30K 12 YearGross
Retention Rate 1
of Fortune 100165 of Fortune 500
Screens in 2020
Customersin 2020
Average Tenure 2
OUR FINANCIALS 4
31%$202M37%$656M 50%Adjusted EBITDA
Margin 6Adjusted EBITDA 6Revenue
Y/Y Growth 5Revenue
85% North America15% International
Adjusted EBITDA Y/Y Growth 5, 6
Leading Global Provider of Technology Solutions for Screening, Verifications, Safety, and Compliance Related to Human Capital
Company Snapshot
$13B Total Addressable Market
$7B of Whitespace and Attractive Growth
OUR TECHNOLOGY 3
2,750+600+ 70+1 600M+Robotic Process Automation Bots
Currently Deployed
Automated and / or Integrated Data
Providers
Human Capital Management Software
Integrations
Core GlobalPlatform
Records in Proprietary Databases
5
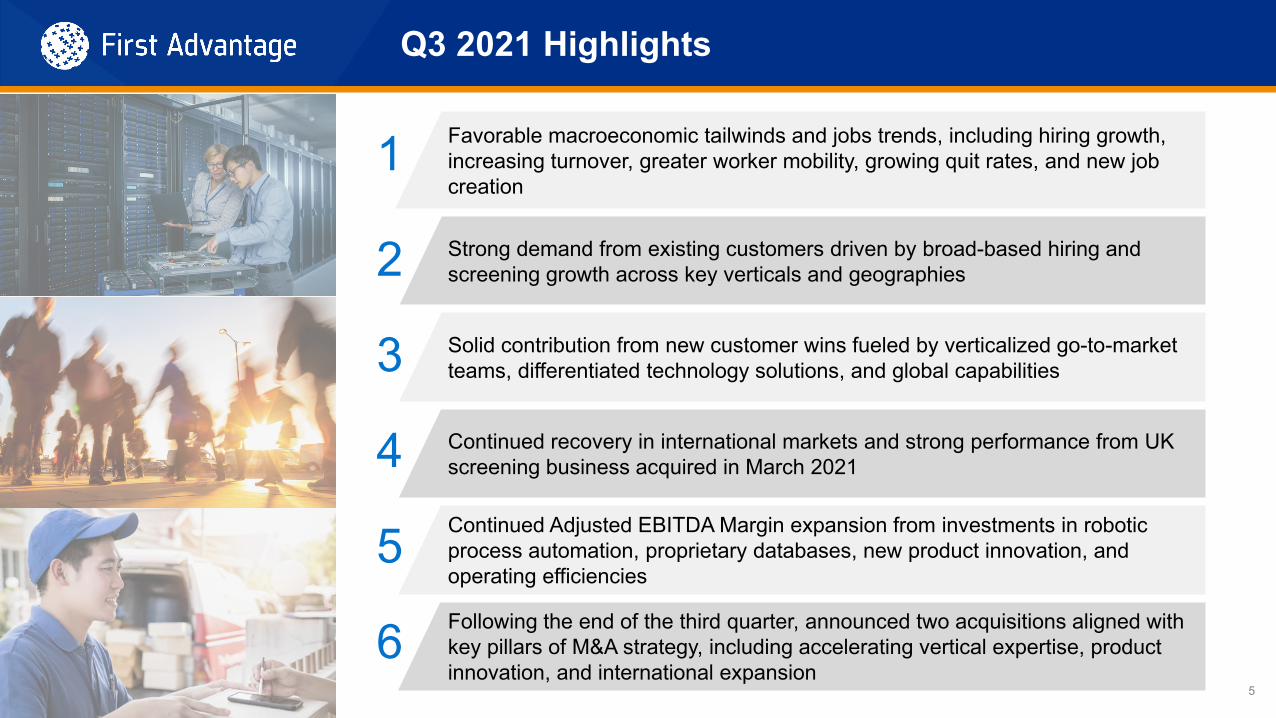
Favorable macroeconomic tailwinds and jobs trends, including hiring growth, increasing turnover, greater worker mobility, growing quit rates, and new job creation
Strong demand from existing customers driven by broad-based hiring and screening growth across key verticals and geographies
Solid contribution from new customer wins fueled by verticalized go-to-market teams, differentiated technology solutions, and global capabilities
Continued recovery in international markets and strong performance from UK screening business acquired in March 2021
Continued Adjusted EBITDA Margin expansion from investments in robotic process automation, proprietary databases, new product innovation, and operating efficiencies
Following the end of the third quarter, announced two acquisitions aligned with key pillars of M&A strategy, including accelerating vertical expertise, product innovation, and international expansion
1
2
3
4
5
Q3 2021 Highlights
6
6
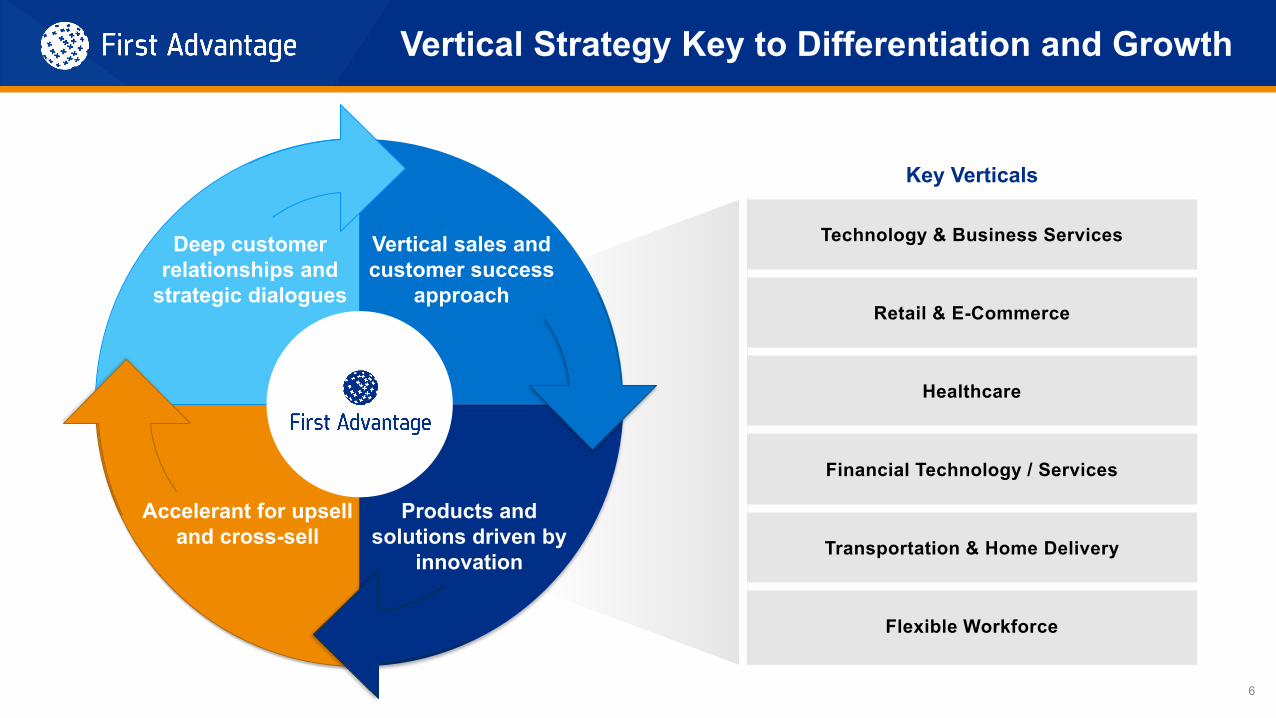
Vertical Strategy Key to Differentiation and Growth
Products and solutions driven by
innovation
Accelerant for upsell and cross-sell
Deep customer relationships and
strategic dialogues
Vertical sales and customer success
approach
Key Verticals
Technology & Business Services
Retail & E-Commerce
Healthcare
Financial Technology / Services
Transportation & Home Delivery
Flexible Workforce
7
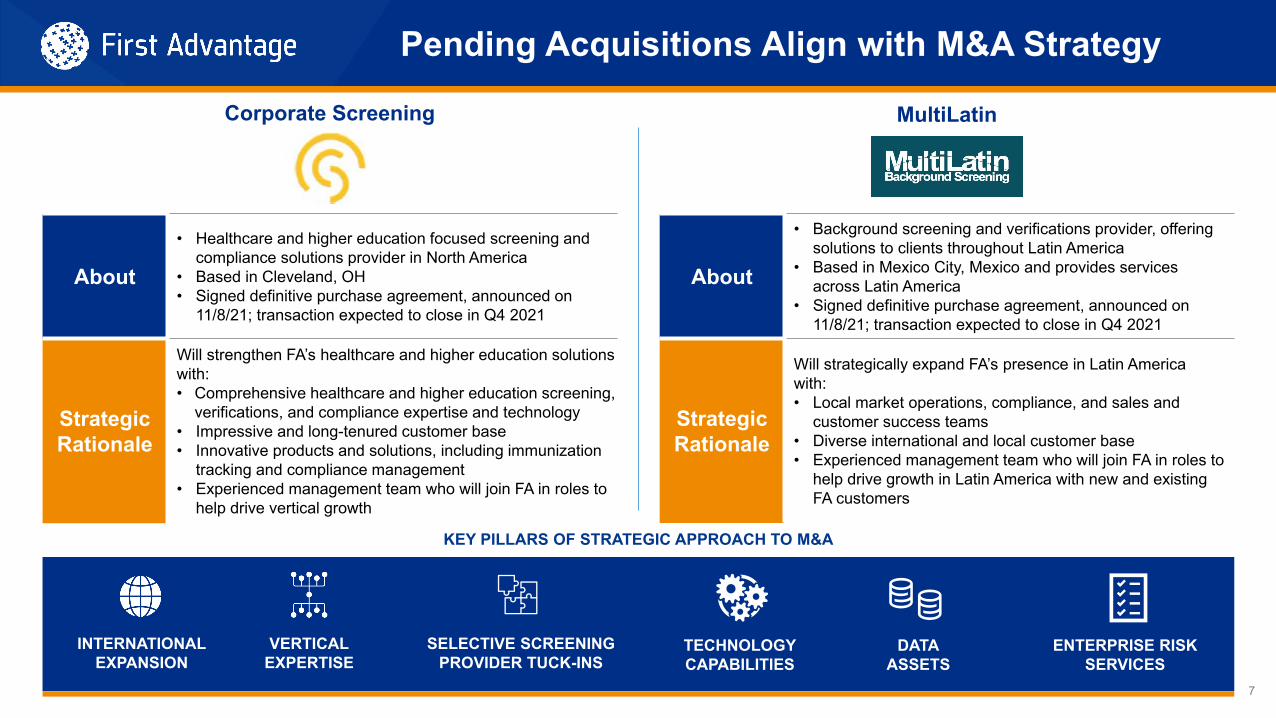
Pending Acquisitions Align with M&A Strategy
About
• Healthcare and higher education focused screening and compliance solutions provider in North America
• Based in Cleveland, OH• Signed definitive purchase agreement, announced on
11/8/21; transaction expected to close in Q4 2021
StrategicRationale
Will strengthen FA’s healthcare and higher education solutions with:• Comprehensive healthcare and higher education screening,
verifications, and compliance expertise and technology• Impressive and long-tenured customer base• Innovative products and solutions, including immunization
tracking and compliance management• Experienced management team who will join FA in roles to
help drive vertical growth
Corporate Screening MultiLatin
About
• Background screening and verifications provider, offering solutions to clients throughout Latin America
• Based in Mexico City, Mexico and provides services across Latin America
• Signed definitive purchase agreement, announced on 11/8/21; transaction expected to close in Q4 2021
StrategicRationale
Will strategically expand FA’s presence in Latin America with:• Local market operations, compliance, and sales and
customer success teams• Diverse international and local customer base• Experienced management team who will join FA in roles to
help drive growth in Latin America with new and existing FA customers
KEY PILLARS OF STRATEGIC APPROACH TO M&A
INTERNATIONALEXPANSION
VERTICALEXPERTISE
SELECTIVE SCREENINGPROVIDER TUCK-INS
TECHNOLOGYCAPABILITIES
DATAASSETS
ENTERPRISE RISKSERVICES

8
2,750+ active intelligent bots
RPA and Proprietary Databases Drive Key Metrics
Verified!TM
Database GrowthRepository of education and work history records
National Criminal FileTM
Database GrowthRepository of criminal records
Evolution of Intelligent Robotic Solutions
Pre-2016 2017–2018 2019–2020 2021 andBeyond
Simple automation
replacesmanual tasks
RPA enablement
drives accuracy,
compliance& cycle time
Intelligent, modular &
transformative robotic
automations
C3
ConfigurableConnectedCapabilities
302M392M
576M
2019 2020 Sep-21
FASTERTURNAROUND
IMPROVEDQUALITY
ENHANCEDEFFICIENCY
EXPANDEDMARGIN
GROWTH IN AUTOMATION AND DATABASE FILES DRIVE KEY CUSTOMER AND BUSINESS METRICS
INCREASEDACCURACY
6M10M
36M
2019 2020 Sep-21
9
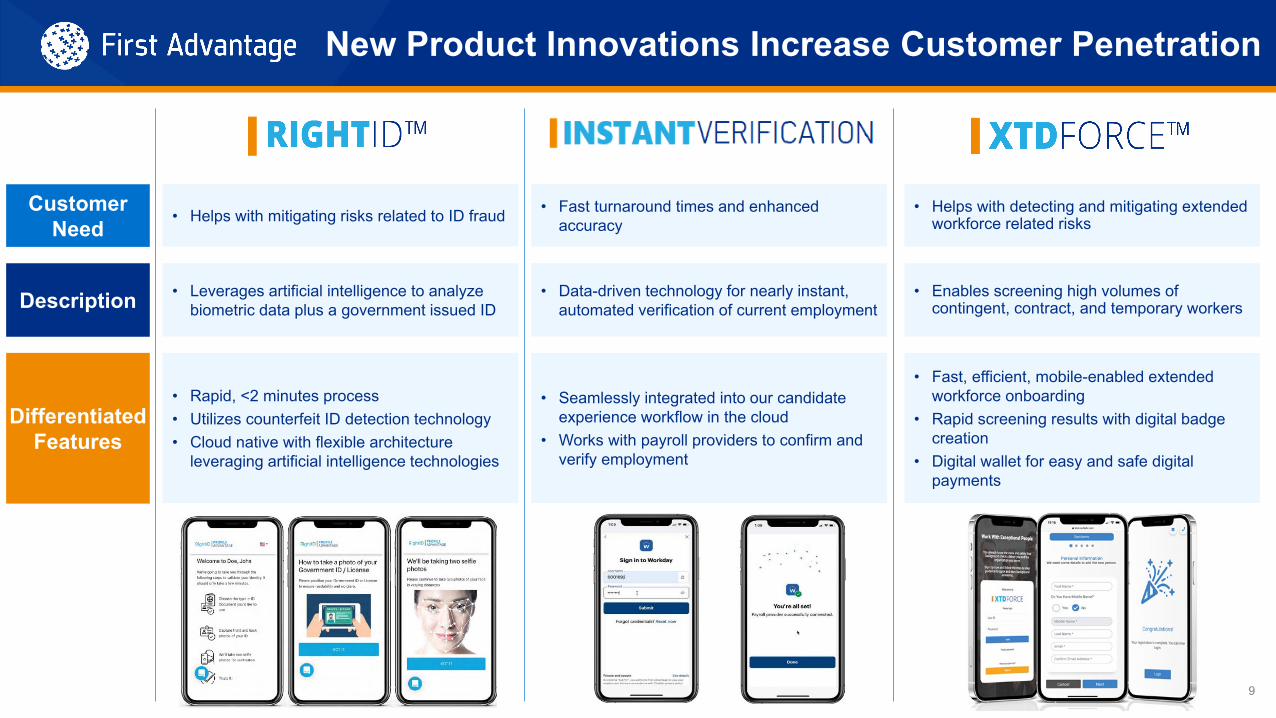
New Product Innovations Increase Customer Penetration
Description
Differentiated Features
Customer Need
• Fast turnaround times and enhanced accuracy
• Seamlessly integrated into our candidate experience workflow in the cloud
• Works with payroll providers to confirm and verify employment
• Data-driven technology for nearly instant, automated verification of current employment
• Helps with mitigating risks related to ID fraud
• Rapid, <2 minutes process • Utilizes counterfeit ID detection technology• Cloud native with flexible architecture
leveraging artificial intelligence technologies
• Leverages artificial intelligence to analyze biometric data plus a government issued ID
• Helps with detecting and mitigating extended workforce related risks
• Fast, efficient, mobile-enabled extended workforce onboarding
• Rapid screening results with digital badge creation
• Digital wallet for easy and safe digital payments
• Enables screening high volumes of contingent, contract, and temporary workers

10
David GamseyEVP, Chief Financial Officer Q3 2021 Financial Results, Outlook
11
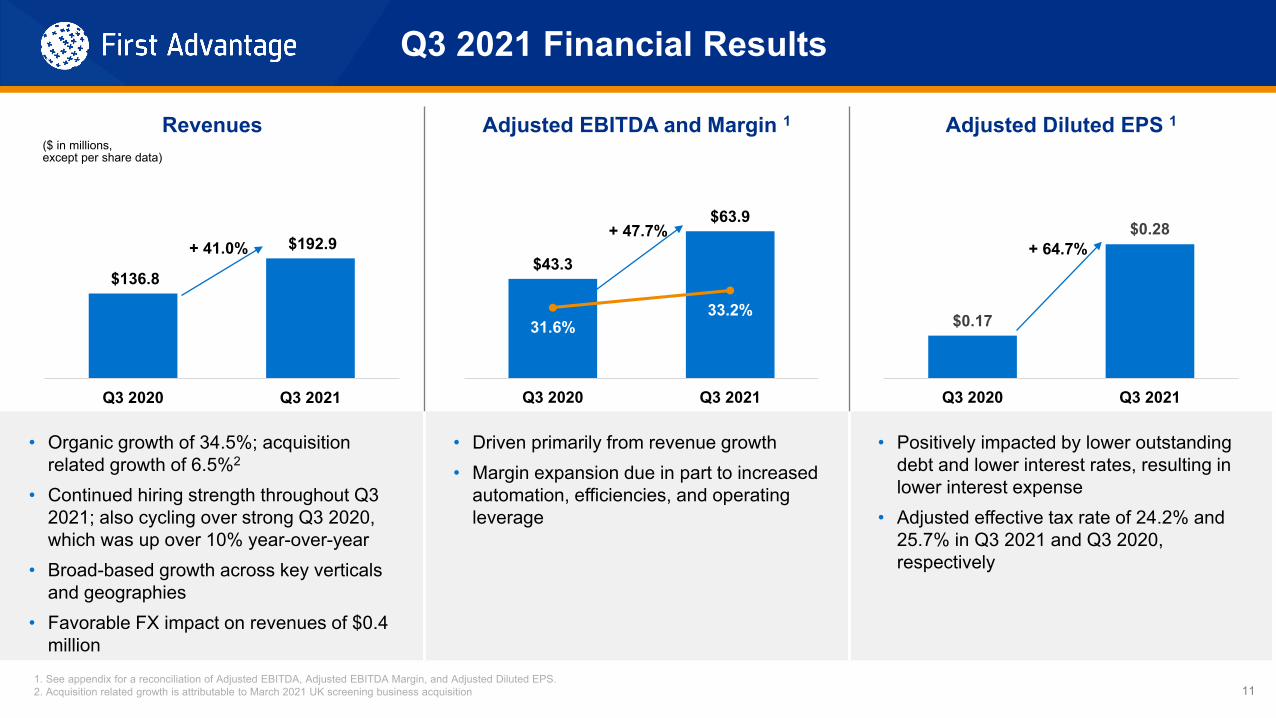
Revenues Adjusted EBITDA and Margin 1 Adjusted Diluted EPS 1
• Organic growth of 34.5%; acquisition related growth of 6.5%2
• Continued hiring strength throughout Q3 2021; also cycling over strong Q3 2020, which was up over 10% year-over-year
• Broad-based growth across key verticals and geographies
• Favorable FX impact on revenues of $0.4 million
• Driven primarily from revenue growth• Margin expansion due in part to increased
automation, efficiencies, and operating leverage
• Positively impacted by lower outstanding debt and lower interest rates, resulting in lower interest expense
• Adjusted effective tax rate of 24.2% and 25.7% in Q3 2021 and Q3 2020, respectively
$136.8
$192.9
Q3 2020 Q3 2021
$43.3
$63.9
31.6%33.2%
25%
27%
29%
31%
33%
35%
37%
39%
Q3 2020 Q3 2021
$0.17
$0.28
Q3 2020 Q3 2021
+ 41.0%+ 47.7%
+ 64.7%
1. See appendix for a reconciliation of Adjusted EBITDA, Adjusted EBITDA Margin, and Adjusted Diluted EPS.2. Acquisition related growth is attributable to March 2021 UK screening business acquisition
Q3 2021 Financial Results
($ in millions,except per share data)

12
Revenues1
• Deep customer relationships; focus on enterprise customers; upsell/cross-sell• Diverse, attractive industry verticals• Verticalized sales force driving market share gains• Highly resilient during COVID-19 downturn• UK screening business acquisition closed on March 31, 2021• Historically, Q1 is softest seasonal quarter
$109.7 $121.6 $123.8 $126.7$110.8 $105.0
$136.8$156.5
$132.1
$174.8$192.9
Q1 '19 Q2 '19 Q3 '19 Q4 '19 Q1 '20 Q2 '20 Q3 '20 Q4 '20 Q1 '21 Q2 '21 Q3 '21
COVID-19($ in millions)
Established Track Record of Revenue Growth and Resiliency
7.8% (Full Year) 1.1% (13.7%) 10.5% 23.6% 19.2% 66.5% 41.0%
Year/Year Growth (%)
1. Q1’20 is presented on a pro forma basis for the Silver Lake Transaction and the related refinancing. See appendix for pro forma reconciliation.

13
Adjusted EBITDA and Margin1,2
• Higher revenues driving Adjusted EBITDA growth• Expanding utilization of proprietary databases and increasing automation with third-party data providers• Technological innovations including robotic process automation initiatives• Leveraging existing G&A infrastructure• Variable and flexible cost structure; reacted quickly during COVID-19 crisis• Disciplined balance between cost efficiency and strategic investments; continuing to invest in technology and sales
while leveraging G&A costs
Established Track Record of Adjusted EBITDA Growth and Resiliency
1. See appendix for Adjusted EBITDA and Adjusted EBITDA Margin reconciliation.2. Q1’20 is presented on a pro forma basis for the Silver Lake Transaction and the related refinancing. See appendix for pro forma reconciliation.
$25.1$33.4 $33.5 $31.8
$27.2$31.7
$43.3 $44.6$36.6
$56.3$63.9
22.9%27.4% 27.1% 25.1% 24.6%
30.1% 31.6% 28.5% 27.7% 32.2% 33.2%
Q1 '19 Q2 '19 Q3 '19 Q4 '19 Q1 '20 Q2 '20 Q3 '20 Q4 '20 Q1 '21 Q2 '21 Q3 '21
($ in millions)
8.4% (5.1%) 29.3% 40.3% 34.5% 77.9% 47.7%
Year/Year Growth (%)
COVID-19
14
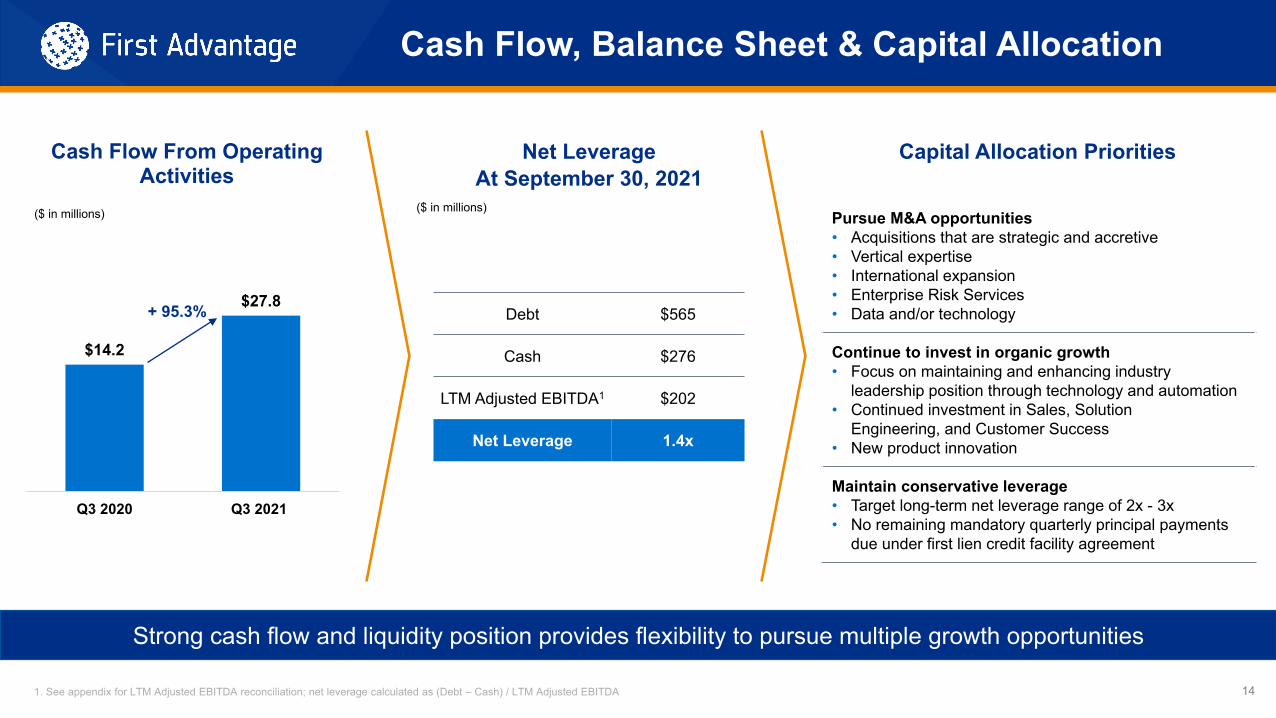
Debt $565
Cash $276
LTM Adjusted EBITDA1 $202
Net Leverage 1.4x
Net Leverage At September 30, 2021
Capital Allocation Priorities
Cash Flow, Balance Sheet & Capital Allocation
Pursue M&A opportunities• Acquisitions that are strategic and accretive • Vertical expertise• International expansion• Enterprise Risk Services• Data and/or technology
Continue to invest in organic growth• Focus on maintaining and enhancing industry
leadership position through technology and automation• Continued investment in Sales, Solution
Engineering, and Customer Success• New product innovation
Maintain conservative leverage• Target long-term net leverage range of 2x - 3x• No remaining mandatory quarterly principal payments
due under first lien credit facility agreement
$14.2
$27.8
Q3 2020 Q3 2021
Cash Flow From Operating Activities
+ 95.3%
Strong cash flow and liquidity position provides flexibility to pursue multiple growth opportunities
1. See appendix for LTM Adjusted EBITDA reconciliation; net leverage calculated as (Debt – Cash) / LTM Adjusted EBITDA
($ in millions) ($ in millions)

15
Metric($ in millions)
20204 Prior GuidanceAs of 8/12/21
Revised GuidanceAs of 11/8/21 Y/Y % Growth
Revenues $509.2 $640 to $650 $680 to $686 +34% to 35%
Adjusted EBITDA2 $146.8 $186 to $190 $208 to $211 +42% to 44%
Adjusted Net Income2,3 $65.6 $110 to $113 $125 to $128 +91% to 95%
Capital Expenditures(consisting of purchases of property and equipment and capitalized software development costs)
$17.7 $25 to $26 $25 to $26 N/A
Revised Full Year 2021 Guidance1
1. Actual results may differ materially from First Advantage’s Full Year 2021 Guidance as a result of, among other things, the factors described under “Forward-Looking Statements” in this presentation. Guidance does not include results from Corporate Screening and MultiLatin, for which the signing of definitive purchase agreements were announced by First Advantage on November 8, 2021.
2. A reconciliation of the foregoing guidance for the Non-GAAP metrics of Adjusted EBITDA and Adjusted Net Income to GAAP net income (loss) cannot be provided without unreasonable effort because of the inherent difficulty of accurately forecasting the occurrence and financial impact of the various adjusting items necessary for such reconciliation that have not yet occurred, are out of our control, or cannot be reasonably predicted. For the same reasons, the Company is unable to assess the probable significance of the unavailable information, which could have a material impact on its future GAAP financial results.
3. Assumes adjusted effective tax rate will be in the range of 25.5% to 26.5% for 2021.4. 2020 is presented on a pro forma basis to give effect to the Silver Lake Transaction and the related refinancing as if it had occurred on January 1, 2020. See appendix for pro forma reconciliation. Capital Expenditures represents
the mathematical addition of purchases of property and equipment and capitalized software development costs for the Predecessor and Successor periods in 2020. Purchases of property and equipment for the Predecessor and Successor periods was $1.0 million and $5.3 million, respectively. Capitalized software development costs for the Predecessor and Successor periods was $0.9 million and $10.5 million, respectively.

16
Metric Long-Term Targets Key Drivers
Revenue Growth 8 – 10%(organic)
• Proven growth formula• Existing customer base growth• Upsell / cross-sell to existing customers• New customer wins• Net of existing customer attrition
• Performance track record• Identified market opportunity• M&A is incremental to target
Adjusted EBITDA Growth 11 – 14%(organic)
• Growth in revenues• Continued automation• Further operating efficiencies
Adjusted Net Income Growth 14 – 18%(organic)
• Above factors• Leveraging non-operating expenses
Long-Term Targets1
1. Actual results may differ materially from First Advantage’s long-term targets as a result of, among other things, the factors described under “Forward-Looking Statements” in this presentation.

17
Closing RemarksScott StaplesChief Executive Officer

18
Investment Highlights
A global leader in large, fragmented, and growing market
Macro-economic tailwinds driving a robust
hiring environment
Differentiated and embedded technology platform that provides
mission-critical solutions in an increasingly complex market
Verticalized go-to-market strategy drives deep, long-term
customer relationships and diversified industry exposure
Proprietary databases extending competitive advantage through product differentiation, faster
turnaround times, and cost efficiencies
Resilient financial model and consistent track record of strong organic revenue growth, margin
expansion, and cash flow generation

19
Supplemental Materials andReconciliations to GAAP Measures
Appendix
20
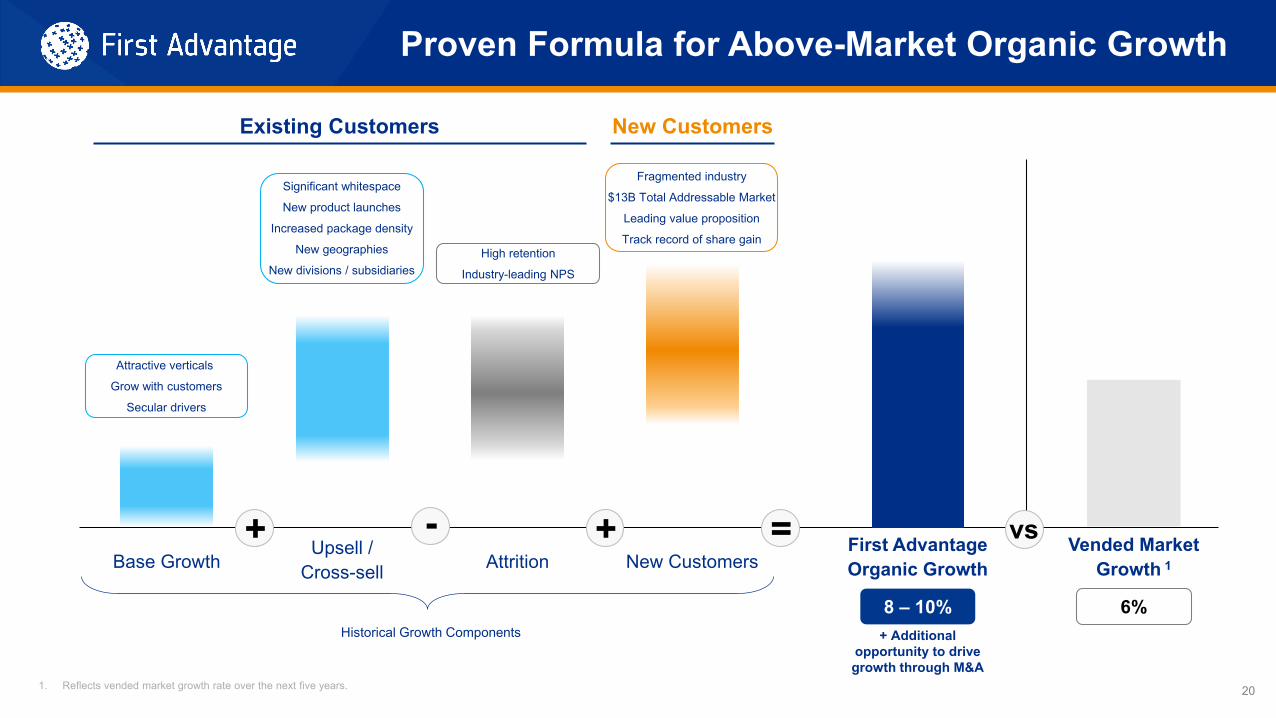
Fragmented industry
$13B Total Addressable Market
Leading value proposition
Track record of share gain
1. Reflects vended market growth rate over the next five years.
Proven Formula for Above-Market Organic Growth
+ - = vs
Existing Customers New Customers
+ First Advantage Organic Growth
+ Additional opportunity to drive growth through M&A
8 – 10%Historical Growth Components
Vended Market Growth 1Base Growth
Attractive verticals
Grow with customers
Secular drivers
Upsell / Cross-sell
Significant whitespace
New product launches
Increased package density
New geographies
New divisions / subsidiaries
Attrition
High retention
Industry-leading NPS
New Customers
6%

21
(a) Represents charges incurred related to acquisitions and similar transactions, primarily consisting of change in control-related costs, professional service fees, and other third-party costs. Additionally, the three months ended June 30, 2021 (Successor) and September 30, 2021 (Successor) include incremental professional service fees incurred related to the initial public offering.(b) Represents charges from organizational restructuring and integration activities outside of the ordinary course of business.(c) Represents non-cash and other charges primarily related to legal exposures inherited from legacy acquisitions, foreign currency (gains) losses, and (gains) losses on the sale of assets.
Adjusted EBITDA

22
(a) Represents charges incurred related to acquisitions and similar transactions, primarily consisting of change in control-related costs, professional service fees, and other third-party costs. (b) Represents charges from organizational restructuring and integration activities outside of the ordinary course of business.(c) Represents non-cash and other charges primarily related to legal exposures inherited from legacy acquisitions, foreign currency (gains) losses, and (gains) losses on the sale of assets.
To facilitate comparability, we present the combination of consolidated results for Q1'2020, consisting of the Successor consolidated results from February 1, 2020 to March 31, 2020, the Predecessor consolidated results for the period from January 1, 2020 to January 31, 2020 and certain pro forma adjustments that give effect to the Silver Lake Transaction and the related refinancing as if it had occurred on January 1, 2020. The pro forma information above has been prepared on a basis consistent withArticle 11 of Regulation S-X, but does not constitute Article 11 pro forma information because it only presents the pro forma, reflecting the Silver Lake Transaction and the related refinancing as if they had occurred as of January 1, 2020.
Adjusted EBITDA (2020 Pro Forma LTM for Silver Lake Transaction)

23
Adjusted EBITDA(2020 Pro Forma for Silver Lake Transaction)
(a) Represents charges incurred related to acquisitions and similar transactions, primarily consisting of change in control-related costs, professional service fees, and other third-party costs. (b) Represents charges from organizational restructuring and integration activities outside of the ordinary course of business.(c) Represents non-cash and other charges primarily related to legal exposures inherited from legacy acquisitions, foreign currency (gains) losses, and (gains) losses on the sale of assets.
To facilitate comparability, we present the combination of consolidated results for year ended December 31, 2020, consisting of the Successor consolidated results from February 1, 2020 to December 31, 2020, the Predecessor consolidated results for the period from January 1, 2020 to January 31, 2020 and certain pro forma adjustments that give effect to the Silver Lake Transaction and the related refinancing as if it had occurred on January 1, 2020. The pro forma information above has been prepared on a basis consistent with Article 11 of Regulation S-X, but does not constitute Article 11 pro forma information because it only presents the pro forma, reflecting the Silver Lake Transaction and the related refinancing as if they had occurred as of January 1, 2020.

24
(a) Represents the loss on extinguishment of debt and non-cash interest expense related to the amortization of debt issuance costs for the financing for the Silver Lake Transaction.(b) Represents the depreciation and amortization expense related to intangible assets and developed technology assets recorded due to the application of ASC 805, Business Combinations.(c) Represents charges incurred related to acquisitions and similar transactions, primarily consisting of change in control-related costs, professional service fees, and other third-party costs. Additionally, the three months ended September 30, 2021 (Successor) includes incremental professional service fees incurred related to the initial public offering.(d) Represents charges from organizational restructuring and integration activities outside of the ordinary course of business.(e) Represents non-cash and other charges primarily related to legal exposures inherited from legacy acquisitions, foreign currency (gains) losses, and (gains) losses on the sale of assets. (f) Effective tax rates of 25.7% and 24.2% have been used to compute Adjusted Net Income for the three months ended September 30, 2020 and 2021, respectively. As of December 31, 2020, we had net operating loss carryforwards of approximately $197.6 million, $166.2 million, and $36.0 million for federal, state, and foreign income tax purposes, respectively, available to reduce future income subject to income taxes. As a result, the amount of actual cash taxes we pay for federal, state, and foreign income taxes differs significantly from the effective income tax rate computed in accordance with GAAP, and from the normalized rates shown above.
Adjusted Net Income

25
(a) Represents the loss on extinguishment of debt and non-cash interest expense related to the amortization of debt issuance costs for the financing for the Silver Lake Transaction.(b) Represents the depreciation and amortization expense related to intangible assets and developed technology assets recorded due to the application of ASC 805, Business Combinations.(c) Represents charges incurred related to acquisitions and similar transactions, primarily consisting of change in control-related costs, professional service fees, and other third-party costs (d) Represents charges from organizational restructuring and integration activities outside of the ordinary course of business.(e) Represents non-cash and other charges primarily related to legal exposures inherited from legacy acquisitions, foreign currency (gains) losses, and (gains) losses on the sale of assets. (f) Effective tax rate of 25.7% has been used to compute Adjusted Net Income for the 2020 periods. As of December 31, 2020, we had net operating loss carryforwards of approximately $197.6 million, $166.2 million, and $36.0 million for federal, state, and foreign income tax purposes, respectively, available to reduce future income subject to income taxes. As a result, the amount of actual cash taxes we pay for federal, state, and foreign income taxes differs significantly from the effective income tax rate computed in accordance with GAAP, and from the normalized rates shown above
To facilitate comparability, we present the combination of consolidated results for year ended December 31, 2020, consisting of the Successor consolidated results from February 1, 2020 to December 31, 2020, the Predecessor consolidated results for the period from January 1, 2020 to January 31, 2020 and certain pro forma adjustments that give effect to the Silver Lake Transaction and the related refinancing as if it had occurred on January 1, 2020. The pro forma information above has been prepared on a basis consistent with Article 11 of Regulation S-X, but does not constitute Article 11 pro forma information because it only presents the pro forma, reflecting the Silver Lake Transaction and the related refinancing as if they had occurred as of January 1, 2020.
Adjusted Net Income (2020 Pro Forma for Silver Lake Transaction)
26
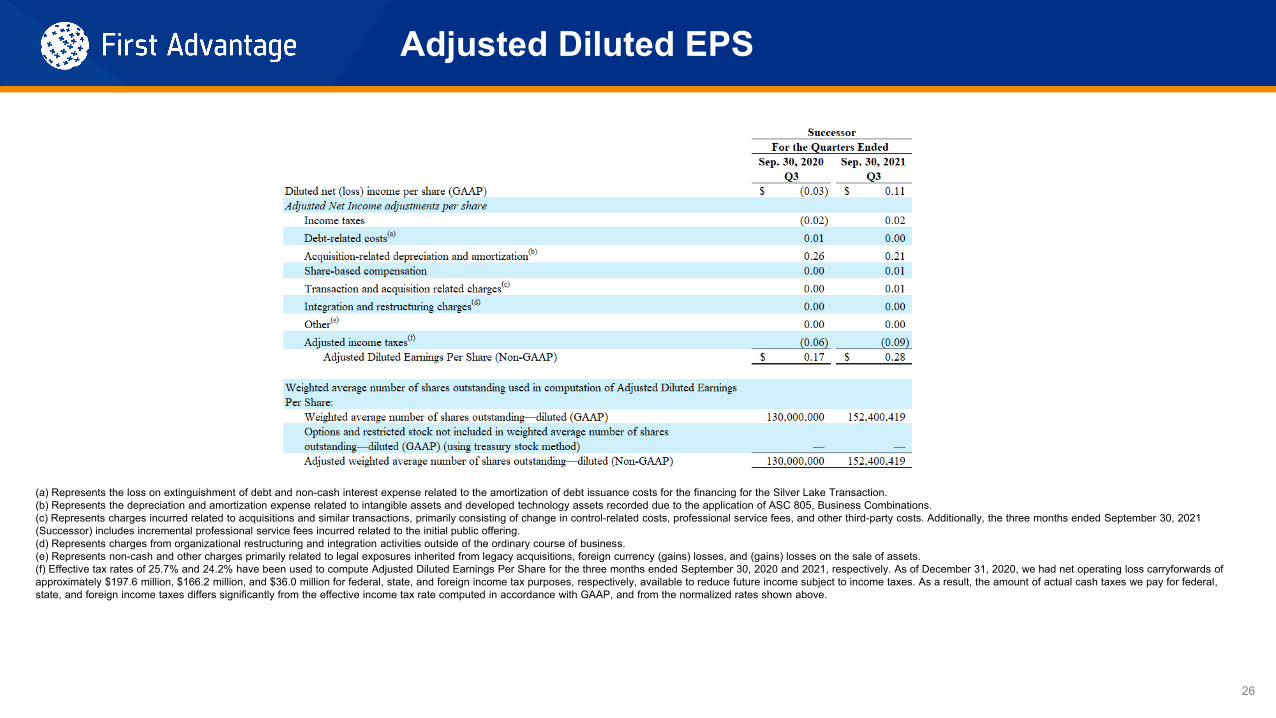
(a) Represents the loss on extinguishment of debt and non-cash interest expense related to the amortization of debt issuance costs for the financing for the Silver Lake Transaction.(b) Represents the depreciation and amortization expense related to intangible assets and developed technology assets recorded due to the application of ASC 805, Business Combinations.(c) Represents charges incurred related to acquisitions and similar transactions, primarily consisting of change in control-related costs, professional service fees, and other third-party costs. Additionally, the three months ended September 30, 2021 (Successor) includes incremental professional service fees incurred related to the initial public offering.(d) Represents charges from organizational restructuring and integration activities outside of the ordinary course of business.(e) Represents non-cash and other charges primarily related to legal exposures inherited from legacy acquisitions, foreign currency (gains) losses, and (gains) losses on the sale of assets. (f) Effective tax rates of 25.7% and 24.2% have been used to compute Adjusted Diluted Earnings Per Share for the three months ended September 30, 2020 and 2021, respectively. As of December 31, 2020, we had net operating loss carryforwards of approximately $197.6 million, $166.2 million, and $36.0 million for federal, state, and foreign income tax purposes, respectively, available to reduce future income subject to income taxes. As a result, the amount of actual cash taxes we pay for federal, state, and foreign income taxes differs significantly from the effective income tax rate computed in accordance with GAAP, and from the normalized rates shown above.
Adjusted Diluted EPS