Embed Size (px)
Citation preview

Q3 2017 and9-month RevenueOCTOBER 25TH, 2017

2
Q3 and 9-month revenue 2017 / Highlights
• Q3’17 Revenue: €597m
• Organic growth*: +6%
• Reported growth: +5%
• 9-month 2017 revenue: €1,819m
• Organic growth*: +5%
• Key Highlights: Acceleration towards our 2017 objectives
• Back-end loaded year after a confirmed steadiness in North America
• Double digit growth in ePayments despite a tough comparison basis
• Resilience in Europe & Africa with growth fueled by Eastern Europe
• Growth in Middle East and Chinese stabilization offsetting Indonesian contraction
• Guidance 2017 confirmed
• Organic growth* : c.7%
• EBITDA margin slightly increasing vs. 2016 (20.6%)
*Growth rate at constant FX & scope
Ingenico Group – Q3 and 9-month revenue 2017 – October 25th 2017
3
Strategic highlights since beginning of 2017
Ingenico Group – Q3 and 9-month revenue 2017 – October 25th 2017
• Bambora acquisition, strategic move towards payment services with disruptive approach
• Unique customer-centric technology solutions driving value for merchants
• Merchant acquiring step change for the Retail business unit
• Expanded global presence
• Continuous bolt-on operations to strengthen our positions in payment services
• TechProcess, leading Indian online and mobile payment gateway
• IECISA*, leading payment service provider in Spain and innovative payment solutions
• Forefront operational developments
• Tetra continuous deployment (c.30% of shipments expected in Q4 2017)
• Taylor-made and value-added services for our clients
• Address nextgen payment solutions (Joinedapp, SlimPay, The Family, Luckycycle)
• Operating model optimized and operational excellence plan (€20-25m costs efficiency**)
* IECISA Electronic Payment System
** on a full-year basis

4
Q3’17 organic growth / +6%
Year-on year: +5%• Organic impact: 6%
• FX impact: -€18m
By traditional business segments• Terminals: +3%
• Payment Services: +11%
By new business segments• Retail: +4%
• Banks & Acquirers: +7%
Revenue (in €M)
*including the previous year acquisitions on a pro forma basis
Ingenico Group – Q3 and 9-month revenue 2017 – October 25th 2017
548
570574
597
Q3'15 Q3'16 Q3'16PF* Q3'17

5
Q3’17 organic growth / Highlights per region
B&A:- Ongoing stabilization of the market, back-end loaded year
- Canada impacted by tough comparison basis
Retail:- New verticals driven (Retail and hospitality)
- Mobile solutions dynamics
B&A:- Brazil impacted by the macro situation but Retail segment seems to show a slight recovery
- Strong growth in other countries- Tetra and managed services in Mexico
B&A:- Strong resilience of Western Europe
- Electronic payment shift in Eastern Europe
Retail:- In-store services fueled by Axis platform
- Integrated solutions combining hardware and payment services
B&A:- Successful deployment of the aPOS in China
- Normalization of the Indian market
- Performance in SEA excluding Indonesia
- Strong momentum in Middle East countries
Retail:- Performance still driven by terminals with fiscal memory in Turkey
Retail:- Infrastructure enhancement and platform stability
- Continuous increase of client satisfaction
- Improving churn rate- Increase in volumes collected
: Share of group revenues made within the region*Growth rate at constant FX & scope
Ingenico Group – Q3 and 9-month revenue 2017 – October 25th 2017
North America (-5%*)
Europe & Africa (+4%*)
Latin America (+10%*)
APAC & Middle-East (+8%*)
ePayments (+10%*)
24%
20%
39%
9%
8%

6
Focus on Brazil / Mainly a macro driven situation
Ingenico Group – Q3 and 9-month revenue 2017 – October 25th 2017
• Macro-economic situation down since 2 years*
• GDP down 3.6%/y in 2015-2016 after +2.3% CAGR from 2010 to 2014
• Unemployment rate surge from 6.8% in 2014 to 13.1% in 2017
• Household final consumption spending down 4%/y in average in 2015-16
• 2 years of shrinkage in retail sales
• GDP stabilization in 2017 (GDP expected to grow at +0.7%)
• Moving competitive landscape
• Traditional POS players to compete with acquirers own products range
• Acquirer market fragmentation as a result of Central Bank regulations
• Price competition from new entrants
• Our key initiatives to address the market: improved situation going forward
• Address a more fragmented acquirers market
• Dedicated range of products based on android solutions and
entry level products
*Source: IMF World Economic Outlook (October 2017) and World Bank database (GDP data at constant price)
7
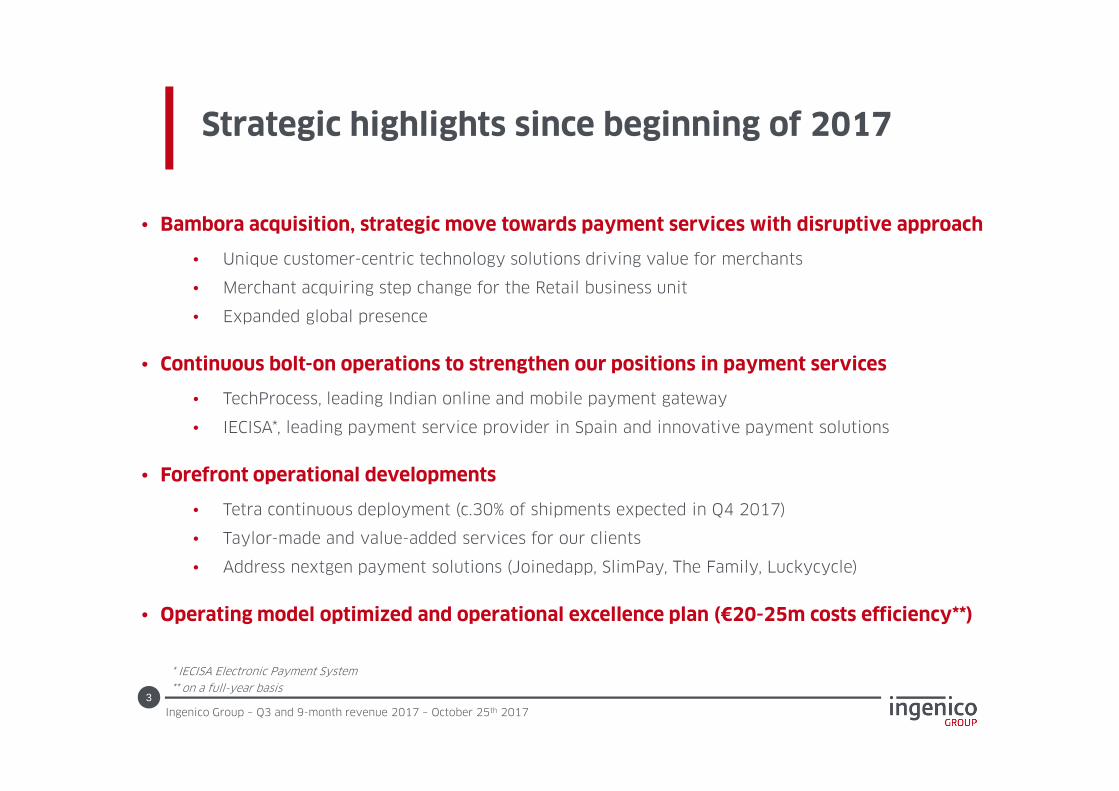
2017 trends by region
Ingenico Group – Q3 and 9-month revenue 2017 – October 25th 2017
*Growth rate at constant FX & scope
Europe & Africa
North America
APAC & MELatin
AmericaePayments
Initial trends Flattish FlattishDouble digit
growthSingle digit
growthDouble digit
growth
New trendsMid-single
digit growthSlight decrease
to flattishDouble digit
growthFlattish to low
single digit growthDouble digit
growth
Underlying factors
• Strong momentum across Western Europe
• Acceleration in Eastern Europe
• Market stabilization
• Expected strong Q4 2017
• Slight growth in China
• Dynamics in Middle East
• Weakness in Indonesia
• Weakness in Brazil
• Double digit growth in other Latam countries
• In line with expectations
• Expected strong Q4 2017
Organic growth* : c.7% confirmed

8
2017 objectives / Confirmed
Ingenico Group – Q3 and 9-month revenue 2017 – October 25th 2017
EBITDA margin
Slightly
increasing
vs. 2016
Organic growth
c. 7%

Appendices

10
9-month 2017 organic growth / +5%
Year-on year: +7%• Organic impact: 5%
• FX impact: -€5m
By traditional business segments• Terminals: +3%
• Payment Services: +11%
By new business segments• Retail: +3%
• Banks & Acquirers: +7%
Revenue (in €M)
*including the previous year acquisitions on a pro forma basis
Ingenico Group – Q3 and 9-month revenue 2017 – October 25th 2017
1,606
1,703 1,717
1,819
9M'15 9M'16 9M'16PF* 9M'17

11
€1,819M
+5%*
*Growth rate at constant FX & scope
9-month 2017 / Revenue by region
APAC & Middle East+12%*
ePayments+11%*
Latin America-3%*
North America-13%*
Europe & Africa+5%*
Ingenico Group – Q3 and 9-month revenue 2017 – October 25th 2017
23%
7%
10%
23%
37%

12
385 385 359
359 359 415
9M'16 9M'16PF* 9M'17
instore online
*2016PF revenue includes Nera contribution as of January 1st, 2016
744 744775
Bank & Acquirers Retail
Like-for-like: +7%
• Resilient market in Europe
• Back-end loaded semester in North America
• Increasing estate management services
Ingenico Group – Q3 and 9-month revenue 2017 – October 25th 2017
Like-for-like: +3%
• Traction of in-store services in Europe
• In-store globally impacted by tough comparison basis in North America
• Progressive ramp-up of omnichannel offer
• Continuous dynamic of ePayments
9-month 2017 / New organization
960 973
1 044
9M'16 9M'16PF* 9M'17
B&A

13
Disclaimer
This document includes forward‐looking statements relating to Ingenico Group’s future prospects,
development and business strategies. By their nature, forward‐looking statements involve risks and
uncertainties and are not guarantees of future performance. Ingenico Group’s financial condition and
results of operations and the development of the industry in which Ingenico operates may differ
materially from those made in or suggested by the forward‐looking statements contained in this
document. In addition, even if Ingenico Group’s financial condition and results of operations and the
development of the industry in which Ingenico operates are consistent with the forward‐looking
statements contained in this document, those results or developments may not be indicative of results
or developments in future periods. Ingenico does not undertake any obligation to review or confirm
analysts’ expectations or estimates or to release publicly any revisions to any forward‐ looking
statements to reflect events that occur or circumstances that arise after the date of this document. In
addition, the occurrence of certain of the risks described in the “Risk Factors” sections of the French
language Document de Référence 2016 filed with the Autorité des marchés financiers (the “AMF”) on
March 29th 2017 under number D.17-0248 may have an impact on these forward‐looking statements.

� Laurent MARIE, VP Investor Relations(T): +33 1 58 01 92 98 (M): +33 7 84 50 18 90
� Kevin WORINGER, Investor Relations Manager(T): +33 1 58 01 85 09 (M): +33 6 02 18 59 08
INVESTOR RELATIONS