Embed Size (px)
Citation preview
Q3-2016: Performance
review
January 28, 2016

2
Certain statements in these slides are forward-looking statements.
These statements are based on management's current expectations and
are subject to uncertainty and changes in circumstances. Actual results
may differ materially from those included in these statements due to a
variety of factors. More information about these factors is contained in
ICICI Bank's filings with the US Securities and Exchange Commission.
All financial and other information in these slides, other than financial
and other information for specific subsidiaries where specifically
mentioned, is on an unconsolidated basis for ICICI Bank Limited only
unless specifically stated to be on a consolidated basis for ICICI Bank
Limited and its subsidiaries. Please also refer to the statement of
unconsolidated, consolidated and segmental results required by Indian
regulations that has, along with these slides, been filed with the stock
exchanges in India where ICICI Bank’s equity shares are listed and with
the New York Stock Exchange and the US Securities and Exchange
Commission, and is available on our website www.icicibank.com
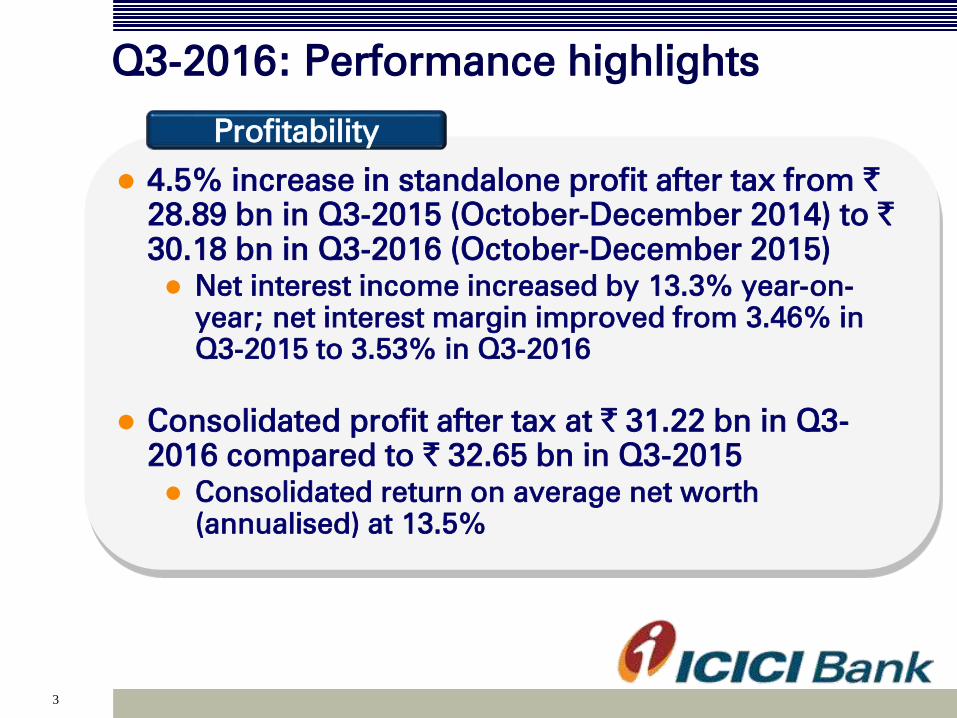
Q3-2016: Performance highlights
3
4.5% increase in standalone profit after tax from `28.89 bn in Q3-2015 (October-December 2014) to `30.18 bn in Q3-2016 (October-December 2015)
Net interest income increased by 13.3% year-on-
year; net interest margin improved from 3.46% in
Q3-2015 to 3.53% in Q3-2016
Consolidated profit after tax at ` 31.22 bn in Q3-
2016 compared to ` 32.65 bn in Q3-2015
Consolidated return on average net worth
(annualised) at 13.5%
Profitability
4
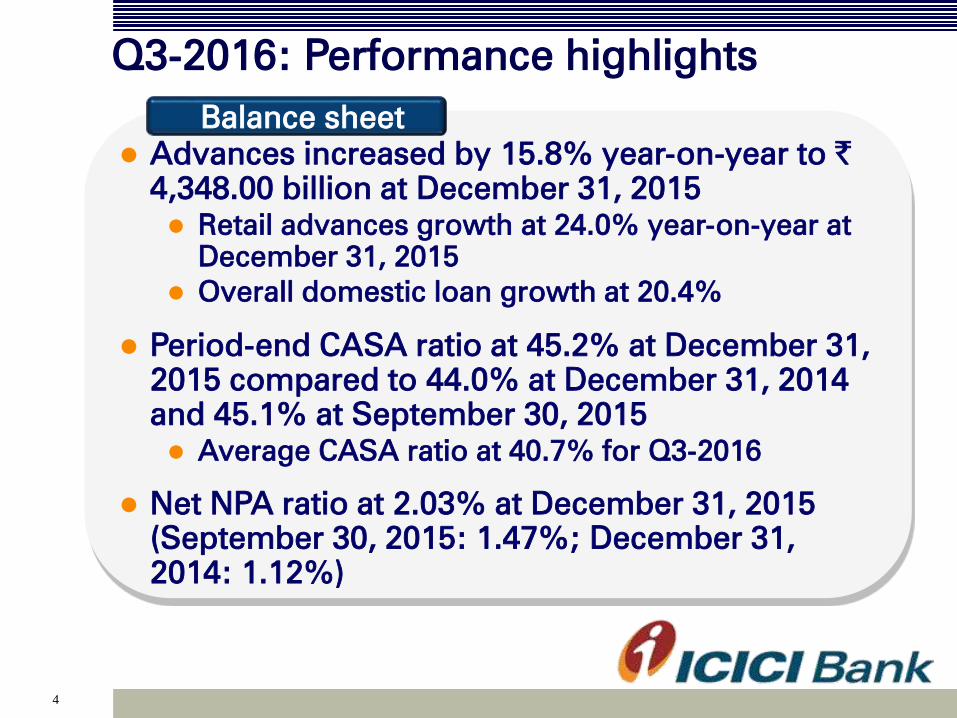
Advances increased by 15.8% year-on-year to `4,348.00 billion at December 31, 2015
Retail advances growth at 24.0% year-on-year at
December 31, 2015
Overall domestic loan growth at 20.4%
Period-end CASA ratio at 45.2% at December 31,
2015 compared to 44.0% at December 31, 2014
and 45.1% at September 30, 2015
Average CASA ratio at 40.7% for Q3-2016
Net NPA ratio at 2.03% at December 31, 2015
(September 30, 2015: 1.47%; December 31,
2014: 1.12%)
Balance sheet
Q3-2016: Performance highlights

5
Standalone results

6
Profit & loss statement
1. Includes net foreign exchange gains relating to overseas operations of ` 6.42 billion in
FY2015, ` 1.92 billion in Q3-2015, ` 1.90 billion in Q2-2016 and ` 1.43 billion in Q3-2016
2. Includes ₹ 12.43 bn of profit on sale of 4% shareholding in ICICI Life in Q3-2016
NII
Non-interest income
- Fee income
- Other income1
- Treasury income2
Total income
Operating expenses
Operating profit
` billion
190.40 48.12 139.60 52.51 54.53 158.20 13.3%
121.76 30.91 86.80 30.07 42.17 102.14 36.4%
82.87 21.10 61.50 22.35 22.62 66.07 7.2%
21.96 5.381
15.63 5.50 5.13 17.36 (4.6)%
16.93 4.43 9.67 2.22 14.42 18.71 -
312.16 79.03 226.40 82.58 96.70 260.34 22.4%
114.96 28.66 83.88 31.00 31.10 92.78 8.5%
197.20 50.37 142.52 51.58 65.60 167.56 30.2%
FY
2015
Q3-
2015
9M-
2015
Q2-
2016
Q3-
2016
9M-
2016
Q3-o-Q3
growth

7
Profit & loss statement
Operating profit
Provisions
Profit before tax
Tax
Profit after tax
` billion
197.20 50.37 142.52 51.58 65.60 167.56 30.2%
39.00 9.80 25.56 9.42 28.44 47.42 -
158.20 40.57 116.96 42.16 37.16 120.14 (8.4)%
46.45 11.68 34.43 11.86 6.98 29.90 (40.2)%
111.75 28.89 82.53 30.30 30.18 90.24 4.5%
FY
2015
Q3-
2015
9M-
2015
Q2-
2016
Q3-
2016
9M-
2016
Q3-o-Q3
growth
8
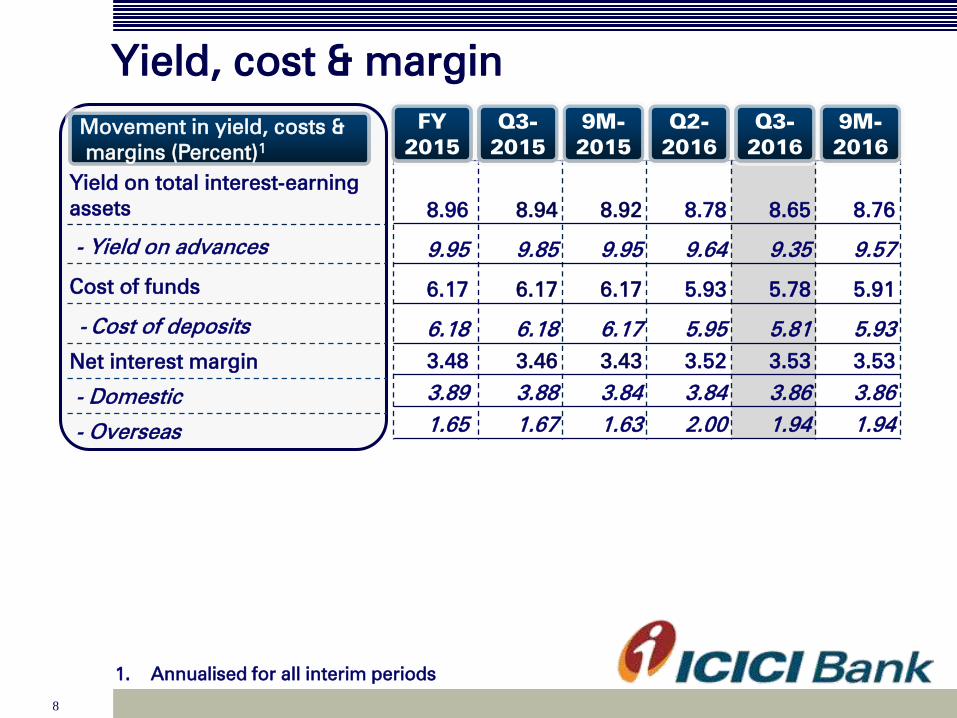
Yield, cost & margin
Yield on total interest-earning
assets
- Yield on advances
Cost of funds
- Cost of deposits
Net interest margin
- Domestic
- Overseas
Movement in yield, costs &
margins (Percent)1
8.96 8.94 8.92 8.78 8.65 8.76
9.95 9.85 9.95 9.64 9.35 9.57
6.17 6.17 6.17 5.93 5.78 5.91
6.18 6.18 6.17 5.95 5.81 5.93
3.48 3.46 3.43 3.52 3.53 3.53
3.89 3.88 3.84 3.84 3.86 3.86
1.65 1.67 1.63 2.00 1.94 1.94
FY
2015
Q3-
2015
9M-
2015
Q2-
2016
1. Annualised for all interim periods
Q3-
2016
9M-
2016

9
Other key ratios
Return on average networth1
Return on average assets1
Weighted average EPS1
Book value (`)
Fee to income
Cost to income
Average CASA ratio
Percent
14.3 14.3 14.1 14.2 13.6 14.1
1.86 1.90 1.85 1.89 1.82 1.87
19.3 19.8 18.9 20.8 20.7 20.7
139 141 141 149 154 154
26.5 26.7 27.2 27.1 23.4 25.4
36.8 36.3 37.1 37.5 32.2 35.6
39.5 39.3 39.4 40.7 40.7 40.8
1. Annualised for all interim periods
FY
2015
Q3-
2015
9M-
2015
Q2-
2016
Q3-
2016
9M-
2016
10
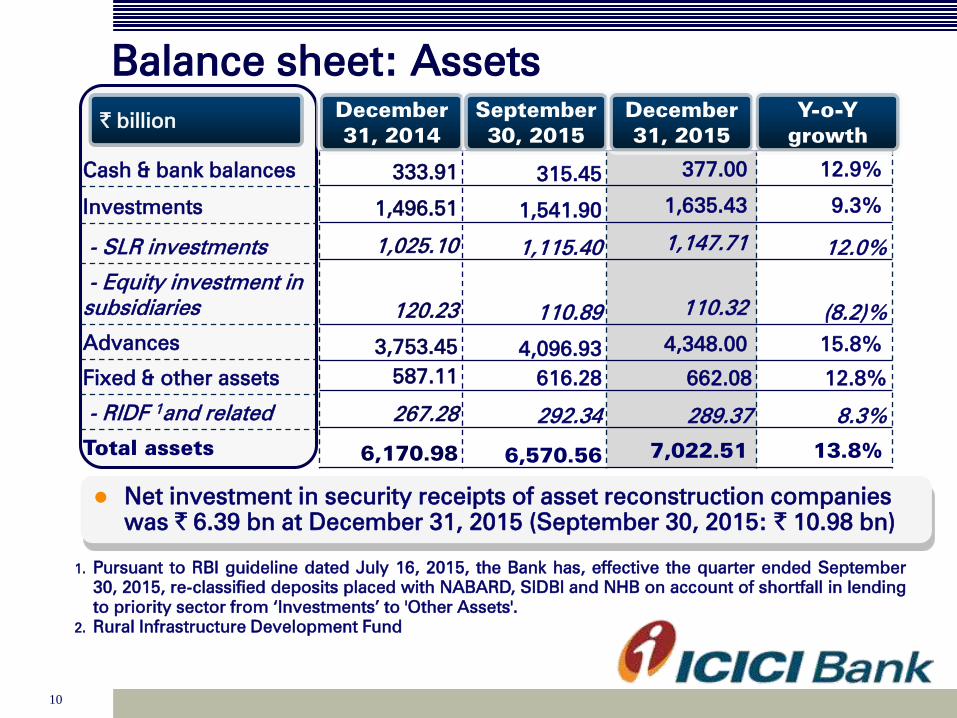
Balance sheet: Assets
Cash & bank balances
Investments
- SLR investments
- Equity investment in
subsidiaries
Advances
Fixed & other assets
- RIDF 1and related
Total assets
` billion
333.91 315.45 377.00 12.9%
1,496.51 1,541.90 1,635.43 9.3%
1,025.10 1,115.40 1,147.71 12.0%
120.23 110.89 110.32 (8.2)%
3,753.45 4,096.93 4,348.00 15.8%
587.11 616.28 662.08 12.8%
267.28 292.34 289.37 8.3%
6,170.98 6,570.56 7,022.51 13.8%
December
31, 2014
September
30, 2015
December
31, 2015
Y-o-Y
growth
Net investment in security receipts of asset reconstruction companies
was ` 6.39 bn at December 31, 2015 (September 30, 2015: ` 10.98 bn)
1. Pursuant to RBI guideline dated July 16, 2015, the Bank has, effective the quarter ended September
30, 2015, re-classified deposits placed with NABARD, SIDBI and NHB on account of shortfall in lending
to priority sector from ‘Investments’ to 'Other Assets'.
2. Rural Infrastructure Development Fund

11
Composition of loan book (y-o-y)
Total loan book: ` 3,753 bn
1. Including impact of exchange rate movement
2. Domestic corporate loans include builder finance
Total loan book: ` 4,348 bn
December 31, 2015December 31, 2014
1
22
1

12
Composition of retail loan book (y-o-y)
Total retail advances growth of 24.0% y-o-y at December 31, 2015
1. December 31, 2014: Vehicle loans includes auto loans
11.6%, commercial business 7.1%
2. December 31, 2015: Vehicle loans includes auto loans
11.3%, commercial business 6.3%
Total retail loan book: ` 1,904 bnTotal retail loan book: ` 1,535 bn
December 31, 2014 December 31, 2015
21

13
Composition of loan book (q-o-q)
Total loan book: ` 4,097 bn
September 30, 2015
1. Including impact of exchange rate movement
2. Domestic corporate loans include builder finance
2
1
December 31, 2015
Total loan book: ` 4,348 bn
2
1
14
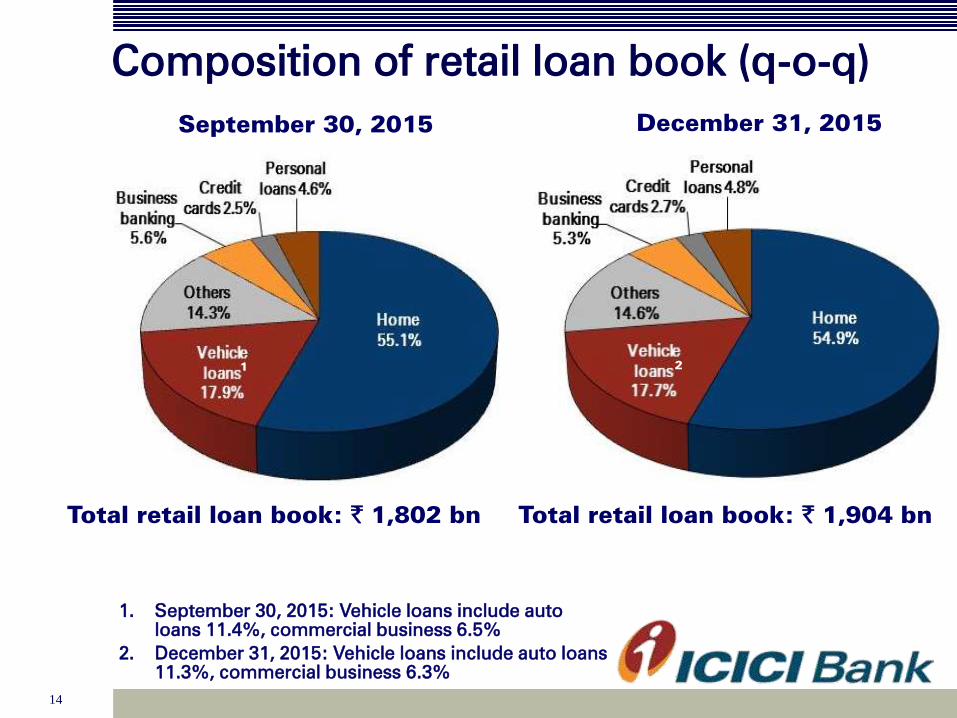
Composition of retail loan book (q-o-q)
Total retail loan book: ` 1,802 bn
September 30, 2015
1. September 30, 2015: Vehicle loans include auto
loans 11.4%, commercial business 6.5%
2. December 31, 2015: Vehicle loans include auto loans
11.3%, commercial business 6.3%
Total retail loan book: ` 1,904 bn
December 31, 2015
21

15
Equity investment in subsidiaries
ICICI Prudential Life Insurance
ICICI Bank Canada
ICICI Bank UK
ICICI Lombard General Insurance
ICICI Home Finance
ICICI Bank Eurasia LLC
ICICI Securities Limited
ICICI Securities Primary Dealership
ICICI AMC
ICICI Venture Funds Mgmt
Others
Total
` billion
35.93 35.93 35.36
30.51 27.32 27.32
21.20 18.05 18.05
14.22 14.22 14.22
11.12 11.12 11.12
3.00 - -
1.87 1.87 1.87
1.58 1.58 1.58
0.61 0.61 0.61
0.05 0.05 0.05
0.14 0.14 0.14
120.23 110.89 110.32
December
31, 2014
September
30, 2015
December
31, 2015

16
Balance sheet: Liabilities
Net worth
- Equity capital
- Reserves
Deposits
- Savings
- Current
Borrowings1,2
Other liabilities
Total liabilities
` billion
818.21 865.66 895.92 9.5%
11.59 11.62 11.63 0.3%
806.62 854.04 884.30 9.6%
3,553.40 3,846.18 4,073.14 14.6%
1,105.33 1,207.20 1,269.18 14.8%
459.16 527.69 571.81 24.5%
1,529.94 1,561.09 1,771.61 15.8%
269.43 297.63 281.84 4.6%
6,170.98 6,570.56 7,022.51 13.8%
December
31, 2014
September
30, 2015
December
31, 2015
Y-o-Y
growth
1. Borrowings include preference shares amounting to ` 3.50 bn
2. Including impact of exchange rate movement
Credit/deposit ratio of 84.8% on the domestic balance sheet at
December 31, 2015
17
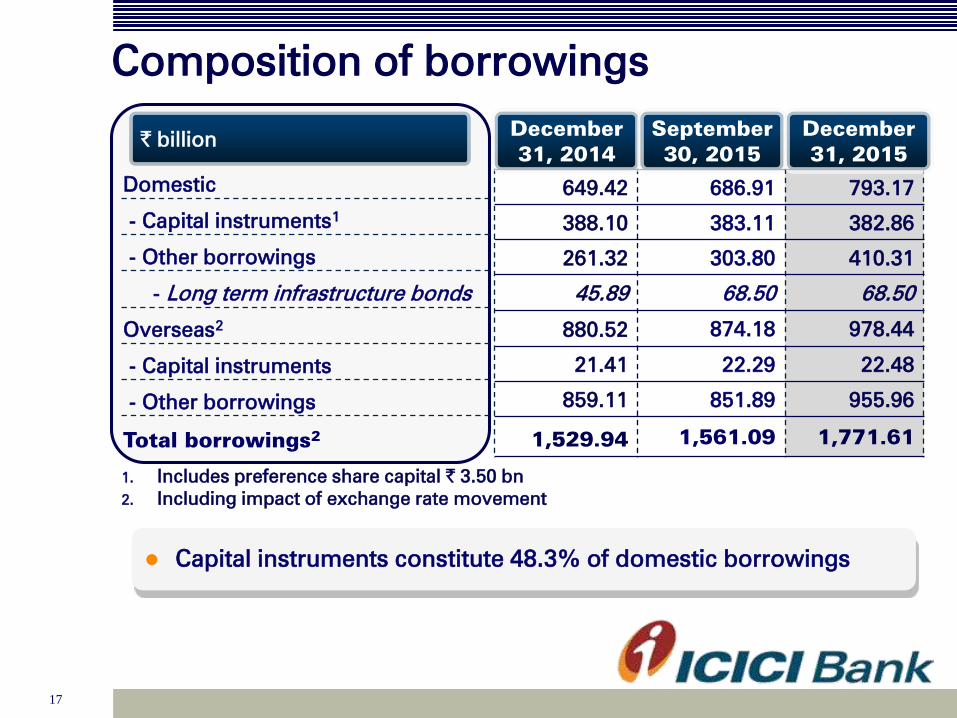
Composition of borrowings
Domestic
- Capital instruments1
- Other borrowings
- Long term infrastructure bonds
Overseas2
- Capital instruments
- Other borrowings
Total borrowings2
` billion
649.42 686.91 793.17
388.10 383.11 382.86
261.32 303.80 410.31
45.89 68.50 68.50
880.52 874.18 978.44
21.41 22.29 22.48
859.11 851.89 955.96
1,529.94 1,561.09 1,771.61
December
31, 2014
September
30, 2015
December
31, 2015
1. Includes preference share capital ` 3.50 bn
2. Including impact of exchange rate movement
Capital instruments constitute 48.3% of domestic borrowings

18
Capital adequacy
Total Capital
- Tier I
- Tier II
Risk weighted assets
- On balance sheet
- Off balance sheet
Standalone Basel III
932.54 16.15% 935.93 15.77%
698.10 12.09% 699.75 11.79%
234.44 4.06% 236.18 3.98%
5,774.20 5,934.01
4,728.12 4,876.34
1,046.08 1,057.67
September 30, 20151
December 31, 20151
1. In line with the applicable guidelines, the Basel III capital ratios reported by the Bank for
the interim periods do not include profits for the period
` bn % ` bn %
Including the profits for 9M-2016, the capital adequacy ratio for
the Bank as per Basel III norms would have been 16.74% and the
Tier I ratio would have been 12.76% at December 31, 2015
19
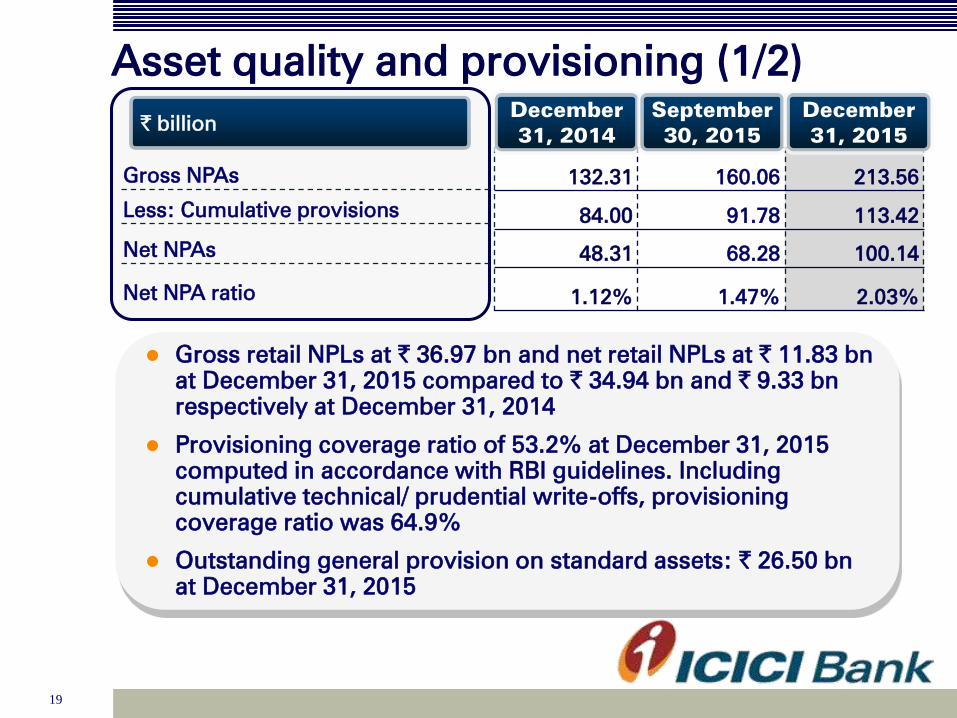
Asset quality and provisioning (1/2)
Gross NPAs
Less: Cumulative provisions
Net NPAs
Net NPA ratio
` billion
132.31 160.06 213.56
84.00 91.78 113.42
48.31 68.28 100.14
1.12% 1.47% 2.03%
December
31, 2014
September
30, 2015
December
31, 2015
Gross retail NPLs at ` 36.97 bn and net retail NPLs at ` 11.83 bn
at December 31, 2015 compared to ` 34.94 bn and ` 9.33 bn
respectively at December 31, 2014
Provisioning coverage ratio of 53.2% at December 31, 2015
computed in accordance with RBI guidelines. Including
cumulative technical/ prudential write-offs, provisioning
coverage ratio was 64.9%
Outstanding general provision on standard assets: ` 26.50 bn
at December 31, 2015

20
Asset quality and provisioning (2/2)
RBI has recently asked banks to review certain loan accounts and their
classification over the two quarters ending December 31, 2015 and
March 31, 2016. The Bank is undertaking this exercise over the
timeframe stipulated by RBI
Net loans to companies whose facilities have been restructured was
` 112.94 bn at December 31, 2015 compared to ` 118.68 bn at
September 30, 2015 and ` 120.52 bn at December 31, 2014
The aggregate gross NPAs and gross restructured loans increased by `70.57 billion from ` 263.36 billion at December 31, 2014 to ` 333.93
billion at December 31, 2015
The aggregate net NPAs and net restructured loans increased by ` 44.25
billion from ` 168.83 billion at December 31, 2014 to ` 213.08 billion at
December 31, 2015

21
Movement of NPA
Opening gross NPA
Add: Gross additions
- of which: slippages from
restructured assets
Less: Gross deletions
Net additions
Less: Write-offs & sale
Closing balance of gross NPAs
Gross NPA ratio1
` billion
116.95 152.86 160.06 105.54
22.79 22.42 65.44 80.78
7.76 9.31 13.55 45.29
5.07 7.09 5.00 16.36
17.72 15.33 60.44 64.42
2.36 8.13 6.94 17.54
132.31 160.06 213.56 152.42
3.00% 3.36% 4.21% 3.29%
Q3-2015 Q3-2016
1. Based on customer assets
Q2-2016 FY2015

22
Distribution network
Metro
Urban
Semi urban
Rural
Total branches
Branches
865 935 1,011 1,040 25.0%
782 865 933 947 22.8%
989 1,114 1,217 1,258 30.3%
464 839 889 911 21.9%
3,100 3,753 4,050 4,156 100.0%
10,481 11,315 12,451 13,372 -
At Mar
31, 2013
At Mar
31, 2014
At
Dec 31,
2015
ATMs
Total ATMs
At Mar
31, 2015
% share
at Dec
31, 2015

23
Consolidated results

24
Consolidated profit & loss statement
NII
Non-interest income
- Fee income
- Premium income
- Other income
Total income
Operating expenses
Operating profit
` billion
226.46 57.06 166.09 62.64 64.88 188.46 13.7%
352.52 91.45 246.16 104.04 105.70 290.49 15.6%
97.01 24.87 71.96 25.57 25.10 75.21 0.9%
220.77 56.27 151.06 70.54 62.95 181.27 11.9%
34.74 10.31 23.14 7.93 17.65 34.01 71.2%
578.98 148.51 412.25 166.68 170.58 478.95 14.9%
350.23 87.83 245.50 105.79 97.46 286.68 11.0%
228.75 60.68 166.75 60.89 73.12 192.27 20.5%
FY
2015
Q3-
2015
9M-
2015
Q2-
2016
Q3-
2016
9M-
2016
Q3-o-Q3
growth
25
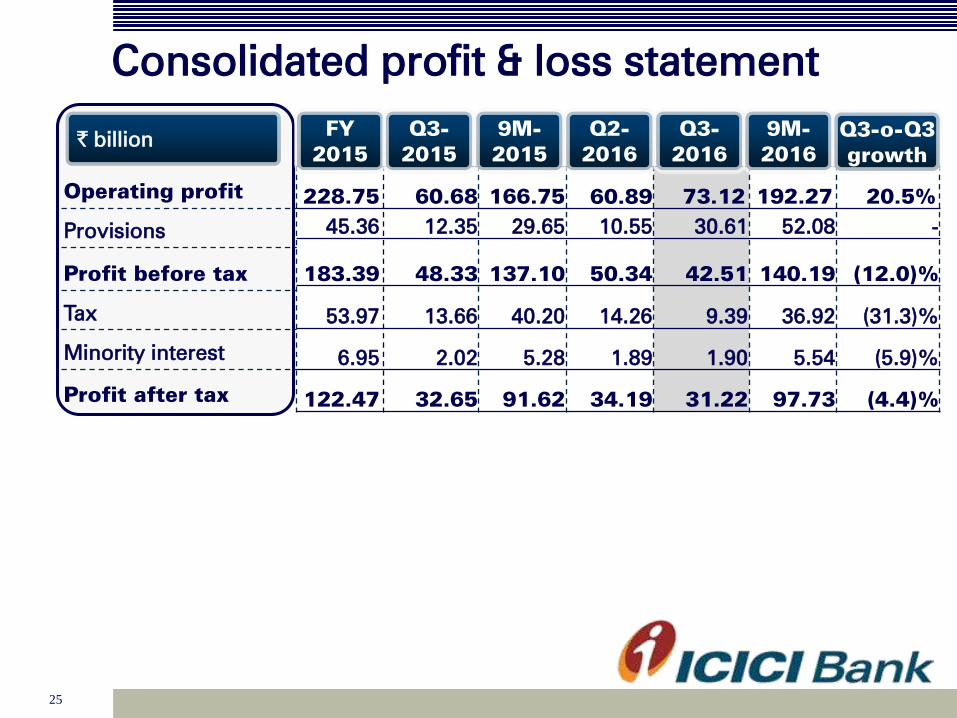
Consolidated profit & loss statement
Operating profit
Provisions
Profit before tax
Tax
Minority interest
Profit after tax
` billion
228.75 60.68 166.75 60.89 73.12 192.27 20.5%
45.36 12.35 29.65 10.55 30.61 52.08 -
183.39 48.33 137.10 50.34 42.51 140.19 (12.0)%
53.97 13.66 40.20 14.26 9.39 36.92 (31.3)%
6.95 2.02 5.28 1.89 1.90 5.54 (5.9)%
122.47 32.65 91.62 34.19 31.22 97.73 (4.4)%
FY
2015
Q3-
2015
9M-
2015
Q2-
2016
Q3-
2016
9M-
2016
Q3-o-Q3
growth

26
Consolidated balance sheet
Cash & bank balances
Investments
Advances
Fixed & other assets
Total assets
` billion
404.81 367.76 442.59 9.3%
2,597.91 2,757.07 2,842.86 9.4%
4,270.84 4,657.57 4,928.59 15.4%
657.35 725.72 736.89 12.1%
7,930.91 8,508.12 8,950.93 12.9%
860.04 911.96 942.99 9.6%
24.11 25.76 28.86 19.7%
3,810.27 4,120.72 4,351.30 14.2%
1,917.44 2,035.71 2,208.15 15.2%
884.00 927.71 950.96 7.6%
435.05 486.26 468.67 7.7%
7,930.91 8,508.12 8,950.93 12.9%
December
31, 2014
September
30, 2015
Y-o-Y
growth
December
31, 2015
Net worth
Minority interest
Deposits
Borrowings
Liabilities on policies in
force
Other liabilities
Total liabilities
1. Pursuant to RBI guideline dated July 16, 2015, the Bank has,
effective the quarter ended June 30, 2015, re-classified
deposits placed with NABARD, SIDBI and NHB on account
of shortfall in lending to priority sector from ‘Investments’ to
'Other Assets'.
27
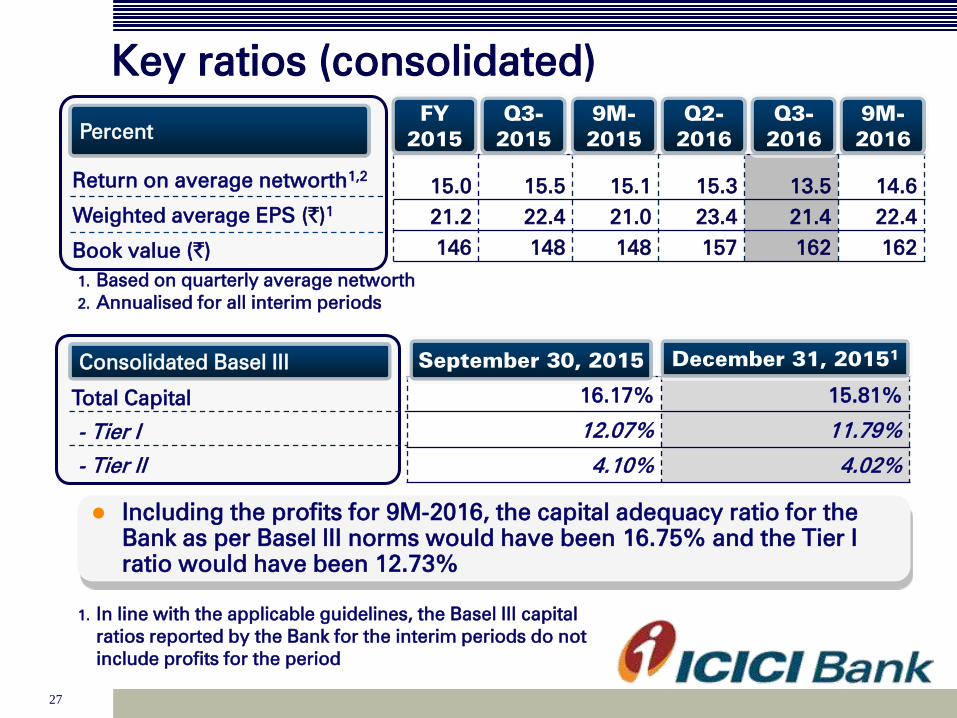
Key ratios (consolidated)
1. Based on quarterly average networth
2. Annualised for all interim periods
Total Capital
- Tier I
- Tier II
Consolidated Basel III
16.17% 15.81%
12.07% 11.79%
4.10% 4.02%
September 30, 2015 December 31, 20151
1. In line with the applicable guidelines, the Basel III capital
ratios reported by the Bank for the interim periods do not
include profits for the period
Including the profits for 9M-2016, the capital adequacy ratio for the
Bank as per Basel III norms would have been 16.75% and the Tier I
ratio would have been 12.73%
Return on average networth1,2
Weighted average EPS (`)1
Book value (`)
Percent
15.0 15.5 15.1 15.3 13.5 14.6
21.2 22.4 21.0 23.4 21.4 22.4
146 148 148 157 162 162
FY
2015
Q3-
2015
9M-
2015
Q2-
2016
Q3-
2016
9M-
2016

28
Overseas subsidiaries

29
ICICI Bank UK asset profile
Total assets: USD 4.7 bnTotal assets: USD 4.6 bn
1. Includes cash & advances to banks, T Bills
2. Includes securities re-classified to loans & advances
December 31, 2015September 30, 2015
1
22
1

30
ICICI Bank UK liability profile
Total liabilities: USD 4.7 bnTotal liabilities: USD 4.6 bn
Profit after tax of USD 0.6 mn in Q3-2016 compared to USD 6.1 mn in Q3-2015
and USD 0.6 million in Q2-2016
Capital adequacy ratio at 15.6%
Proportion of retail term deposits in total deposits at 34% at December 31, 2015
December 31, 2015September 30, 2015

31
ICICI Bank Canada asset profile
1. Includes cash & advances to banks and government securities
2. Based on IFRS, securitised portfolio of CAD 2,759 mn and CAD 2,920 mn considered as
part of insured mortgage portfolio at September 30, 2015 and December 31, 2015
respectively
Total assets: CAD 6.7 bnTotal assets: CAD 6.5 bn
December 31, 2015September 30, 2015
1
2
2
1

32
ICICI Bank Canada liability profile
Profit after tax of CAD 5.4 mn in Q3-2016 compared to CAD 3.0 mn in Q3-2015
and CAD 6.6 mn in Q2-2016
Capital adequacy ratio at 23.7%
1. As per IFRS, proceeds of CAD 2,725 mn and CAD
2,882 mn from sale of securitised portfolio
considered as part of borrowings at September
30, 2015 and December 31, 2015 respectively
Total liabilities: CAD 6.7 bnTotal liabilities: CAD 6.5 bn
1
September 30, 2015 December 31, 2015
1

33
Domestic subsidiaries

34
ICICI Home Finance
Profit after tax of ` 400.9 mn in Q3-2016 compared to ` 497.5 mn in Q3-2015
Capital adequacy ratio of 26.6% at December 31, 2015
Net NPA ratio: 0.7%
At December 31, 2015: Net worth ` 15.21 bn; Deposits ` 2.86 bn and Borrowings
& other liabilities ` 73.29 bn
Total assets: ` 91.36 bnTotal assets: ` 90.11 bn
September 30, 2015 December 31, 2015

35
ICICI Life
New business premium
Renewal premium
Total premium
Annualised premium equivalent (APE)
New Business Profit (NBP)
NBP margin
Profit after tax
Assets Under Management
Expense ratio3
Cost to RWRP4
` billion
13.59 13.87 53.32
25.17 30.73 99.75
38.76 44.60 153.07
12.90 12.59 47.44
1.471
1.742
6.432
11.4%1
13.8%2
13.6%2
4.62 4.36 16.34
945.93 1,017.31 1,001.83
15.7% 14.9% 15.4%
46.9% 52.4% 49.1%
Q3-2015 FY2015
1. Based on Traditional Embedded Value methodology and target acquisition cost basis
2. Based on Indian Embedded Value methodology and target acquisition cost basis
3. All expenses (including commission) / (Total premium –
90% of single premium)
4. RWRP: Retail weighted received premium
5. Source: IRDAI
Q3-2016
Sustained leadership in private space with an overall market share
of 12.1%5 and private sector market share of 23.5%
5in 9M-2016
36
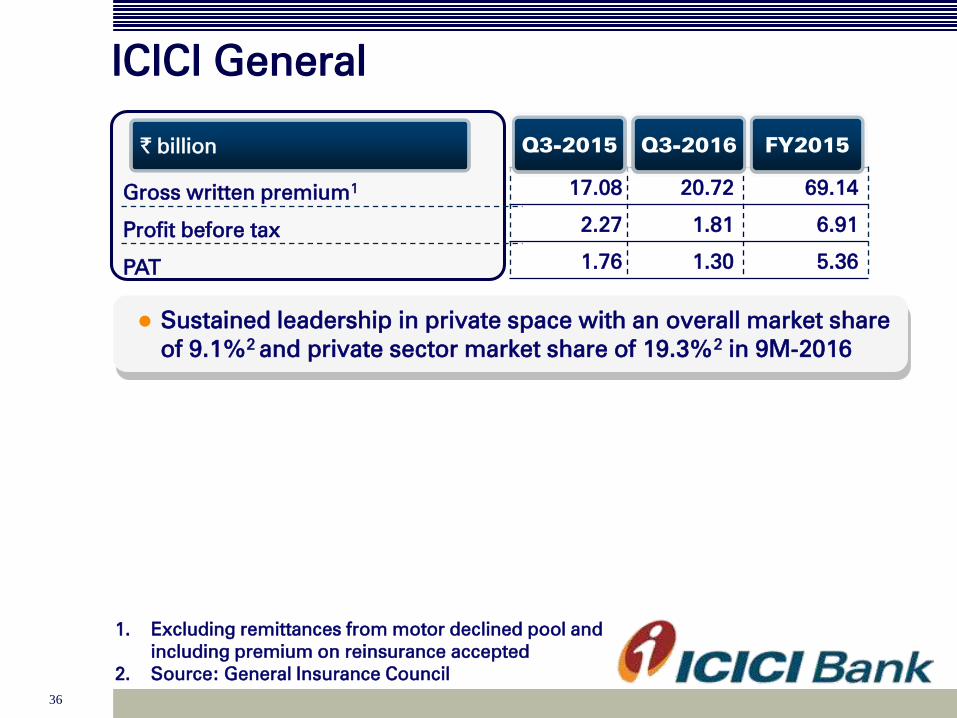
ICICI General
Gross written premium1
Profit before tax
PAT
` billion
17.08 20.72 69.14
2.27 1.81 6.91
1.76 1.30 5.36
Q3-2015 FY2015
1. Excluding remittances from motor declined pool and
including premium on reinsurance accepted
2. Source: General Insurance Council
Q3-2016
Sustained leadership in private space with an overall market share
of 9.1%2 and private sector market share of 19.3%
2in 9M-2016
37
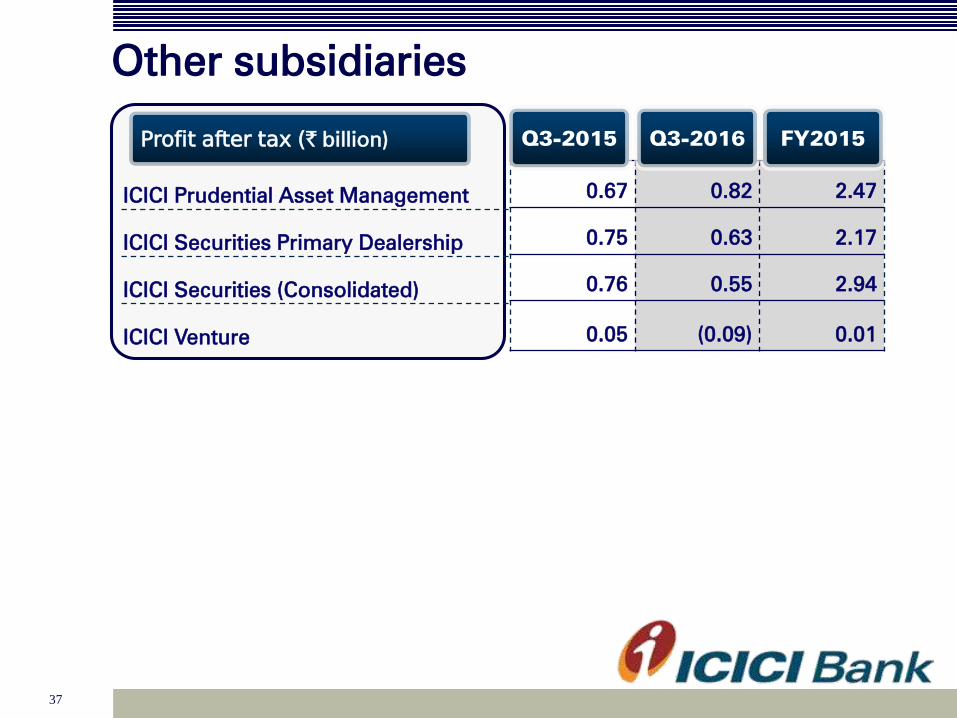
Other subsidiaries
ICICI Prudential Asset Management
ICICI Securities Primary Dealership
ICICI Securities (Consolidated)
ICICI Venture
Profit after tax (` billion)
0.67 0.82 2.47
0.75 0.63 2.17
0.76 0.55 2.94
0.05 (0.09) 0.01
Q3-2015 FY2015Q3-2016

38
Thank you