Embed Size (px)
Citation preview
Slide 1, Oct’19
Q2FY20 Investor Presentation
October 2019
HeidelbergCement India Limited (HCIL)
Slide 2, Oct’19
Cautionary Statement
Statements in this presentation, which describe the Company’s objectives, projections,
estimates, expectations or predictions, may be considered to be “forward-looking
statements” within the meaning of applicable Securities Laws and Regulations. These
statements are based on certain assumptions and expectations of future events. Actual
results could however materially differ from those expressed or implied.
Important factors that could make a difference to the Company’s operations include global
and Indian political, economic and demand-supply conditions, finished goods prices, raw
materials cost and availability, cyclical demand and pricing in the Company’s principal
markets, changes in Government regulations, Policies, tax regimes, economic developments
within India besides other factors such as litigation and industrial relations as well as the
ability to implement strategies.
The Company assumes no responsibility to publicly amend, modify or revise any forward-
looking statements, on the basis of any subsequent development, information or events or
otherwise.
Slide 3, Oct’19
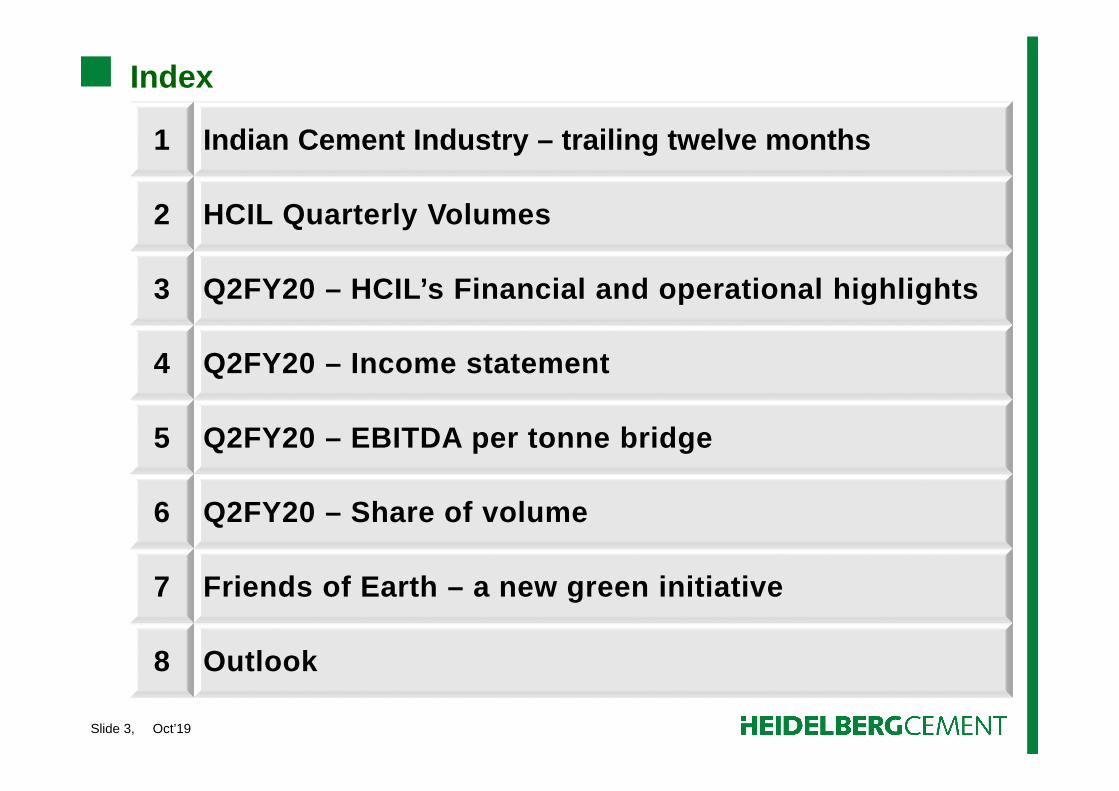
Index
1 Indian Cement Industry – trailing twelve months
2 HCIL Quarterly Volumes
3 Q2FY20 – HCIL’s Financial and operational highlight s
4 Q2FY20 – Income statement
5 Q2FY20 – EBITDA per tonne bridge
6 Q2FY20 – Share of volume
7 Friends of Earth – a new green initiative
8 Outlook
Slide 4, Oct’19
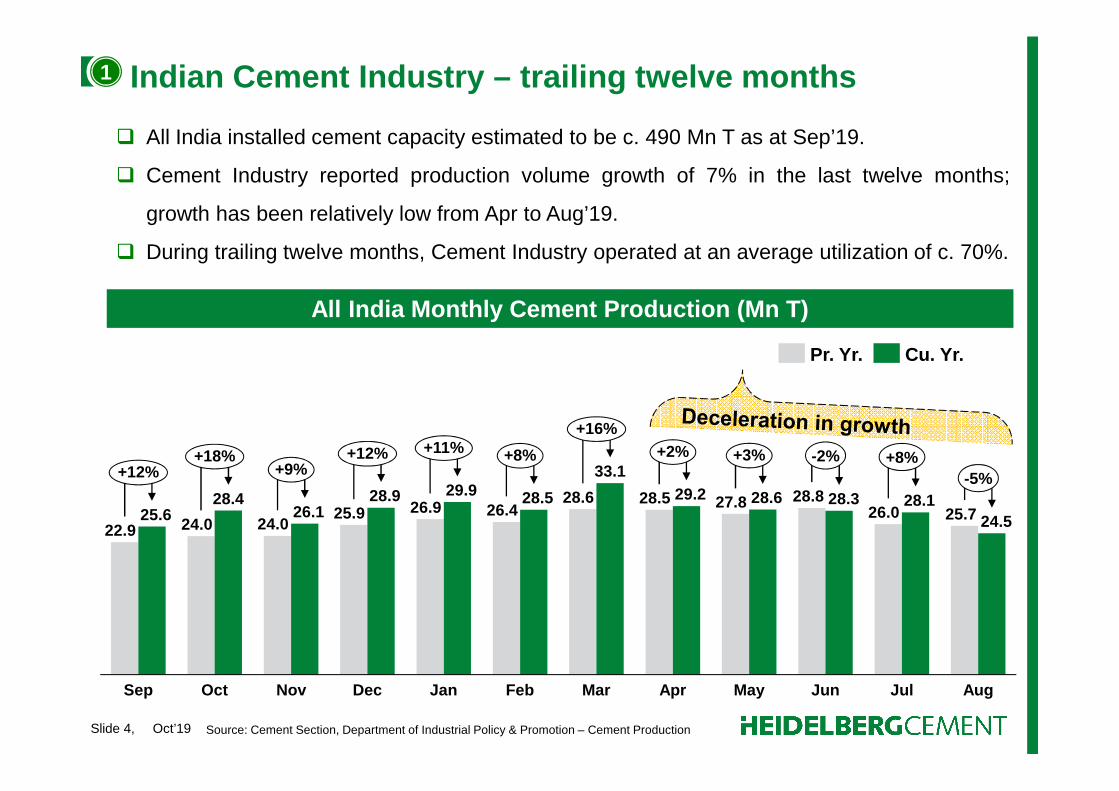
Indian Cement Industry – trailing twelve months
Source: Cement Section, Department of Industrial Policy & Promotion – Cement Production
All India installed cement capacity estimated to be c. 490 Mn T as at Sep’19.
Cement Industry reported production volume growth of 7% in the last twelve months;
growth has been relatively low from Apr to Aug’19.
During trailing twelve months, Cement Industry operated at an average utilization of c. 70%.
1
22.9 24.0 24.025.9 26.9 26.4
28.6 28.5 27.8 28.826.0 25.725.6
28.426.1
28.9 29.9 28.5
33.129.2 28.6 28.3 28.1
24.5
MarOctSep Jan AugJulJunMayAprFebDecNov
+12%+18%
+9%+12% +11% +8%
+16%+2% +3% -2% +8%
-5%
Pr. Yr. Cu. Yr.
All India Monthly Cement Production (Mn T)
Slide 5, Oct’19
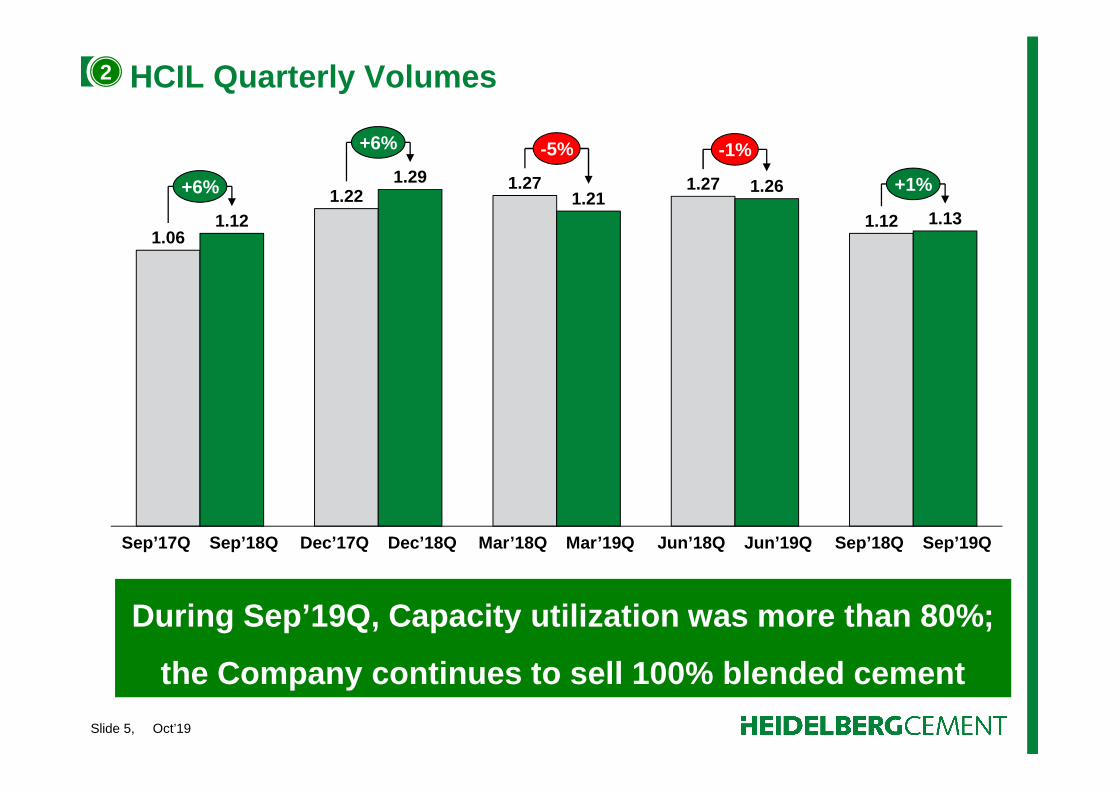
HCIL Quarterly Volumes
1.06
1.221.27 1.27
1.121.12
1.291.21
1.26
1.13
Sep’18Q Sep’19QSep’17Q Sep’18Q Dec’17Q Dec’18Q Mar’18Q Mar’ 19Q Jun’18Q Jun’19Q
+6%
+6% -5% -1%
+1%
2
During Sep’19Q, Capacity utilization was more than 8 0%;
the Company continues to sell 100% blended cement
Slide 6, Oct’19
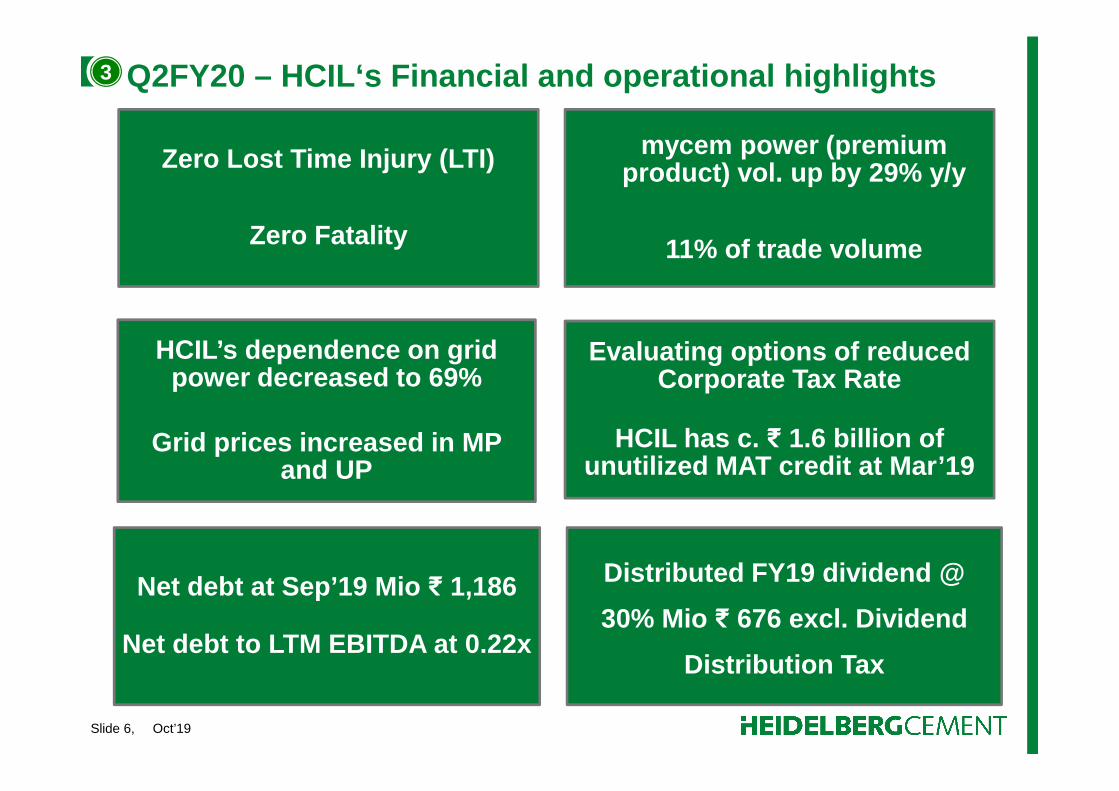
Q2FY20 – HCIL‘s Financial and operational highlights
Zero Lost Time Injury (LTI)
Zero Fatality
mycem power (premium product) vol. up by 29% y/y
11% of trade volume
HCIL’s dependence on grid power decreased to 69%
Grid prices increased in MP and UP
Evaluating options of reduced Corporate Tax Rate
HCIL has c. ₹ 1.6 billion of unutilized MAT credit at Mar’19
Net debt at Sep’19 Mio ₹ 1,186
Net debt to LTM EBITDA at 0.22x
Distributed FY19 dividend @
30% Mio ₹ 676 excl. Dividend
Distribution Tax
3
Slide 7, Oct’19
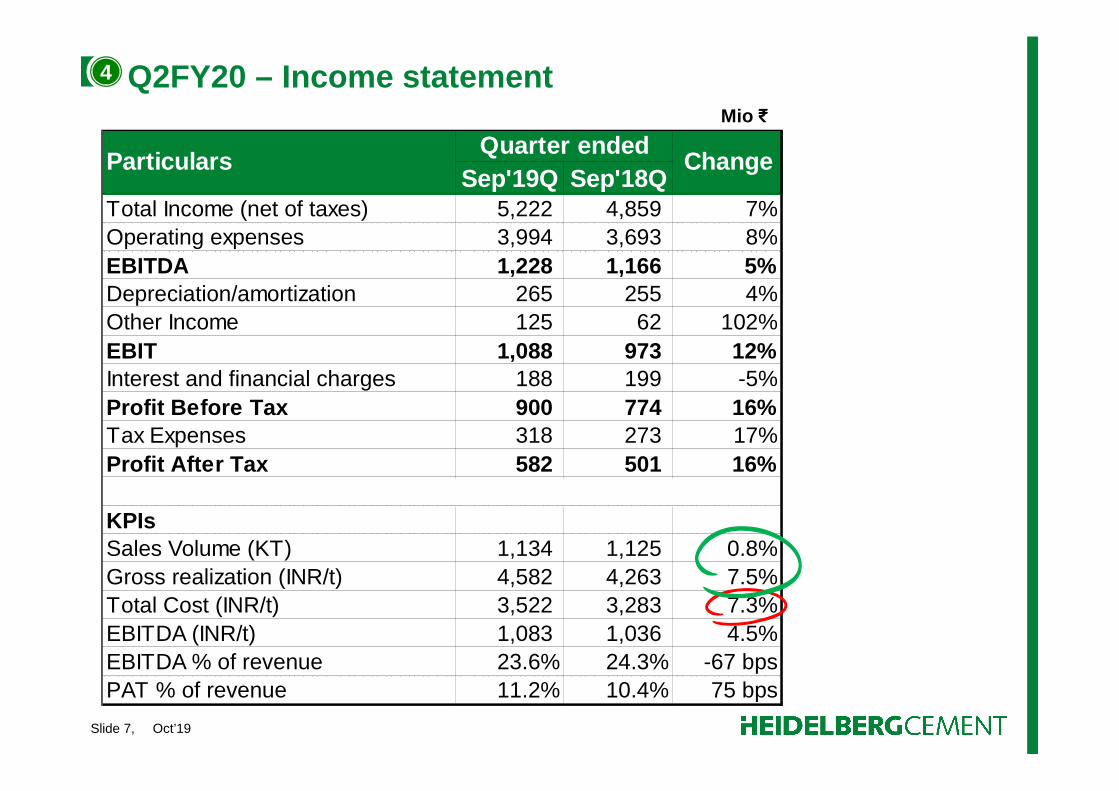
Sep'19Q Sep'18QTotal Income (net of taxes) 5,222 4,859 7%Operating expenses 3,994 3,693 8%EBITDA 1,228 1,166 5%Depreciation/amortization 265 255 4%Other Income 125 62 102%EBIT 1,088 973 12%Interest and financial charges 188 199 -5%Profit Before Tax 900 774 16%Tax Expenses 318 273 17%Profit After Tax 582 501 16%
KPIsSales Volume (KT) 1,134 1,125 0.8%Gross realization (INR/t) 4,582 4,263 7.5%Total Cost (INR/t) 3,522 3,283 7.3%EBITDA (INR/t) 1,083 1,036 4.5%EBITDA % of revenue 23.6% 24.3% -67 bpsPAT % of revenue 11.2% 10.4% 75 bps
ParticularsQuarter ended
Change
Q2FY20 – Income statementMio ₹
4
Slide 8, Oct’19
₹ p
er to
nne
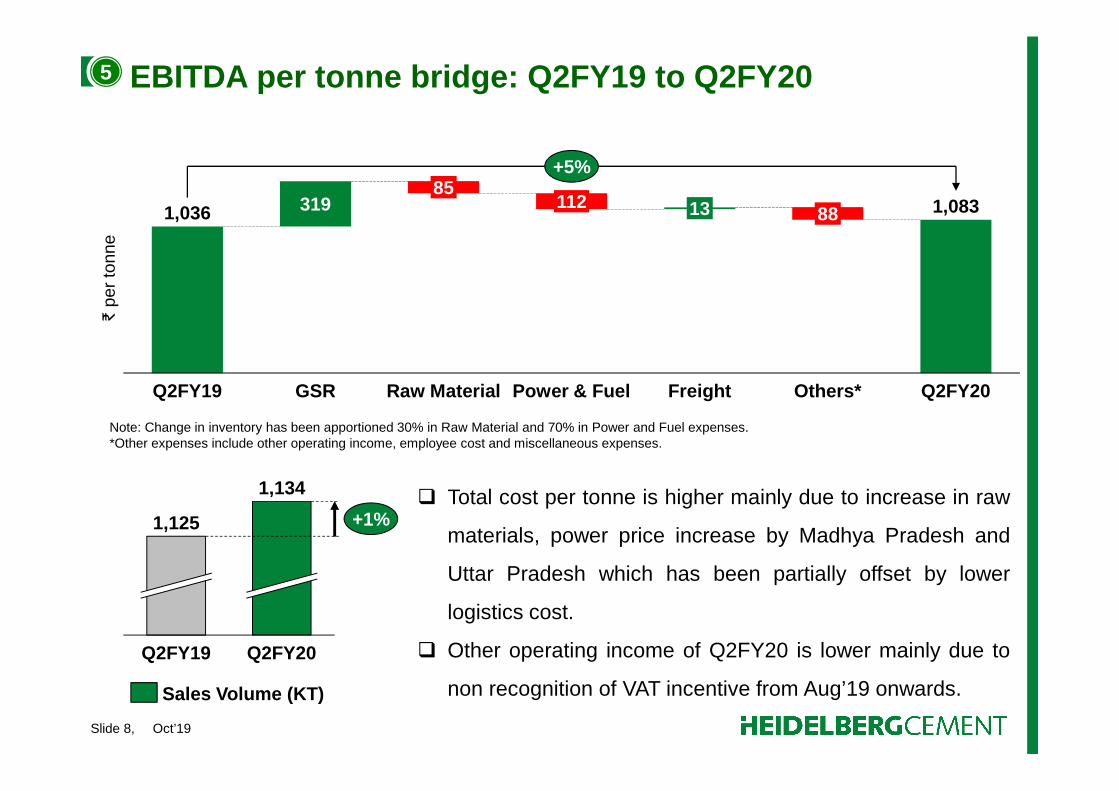
Total cost per tonne is higher mainly due to increase in raw
materials, power price increase by Madhya Pradesh and
Uttar Pradesh which has been partially offset by lower
logistics cost.
Other operating income of Q2FY20 is lower mainly due to
non recognition of VAT incentive from Aug’19 onwards.
EBITDA per tonne bridge: Q2FY19 to Q2FY20
Q2FY19 Q2FY20
1,125
1,134
+1%
Sales Volume (KT)
5
1,036 1,083319
GSRQ2FY19 Others*Raw Material Power & Fuel
13
Q2FY20Freight
85112
88
+5%
Note: Change in inventory has been apportioned 30% in Raw Material and 70% in Power and Fuel expenses.*Other expenses include other operating income, employee cost and miscellaneous expenses.
Slide 9, Oct’19
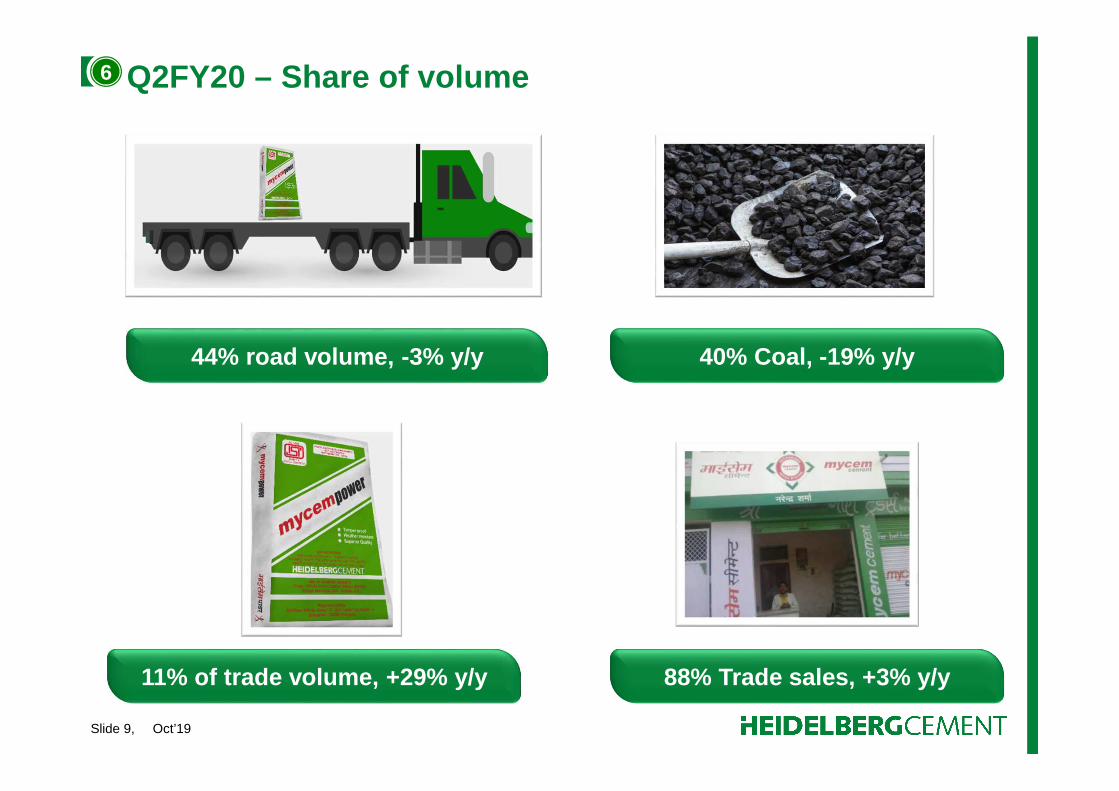
Q2FY20 – Share of volume
44% road volume, -3% y/y 40% Coal, -19% y/y
11% of trade volume, +29% y/y 88% Trade sales, +3% y/y
6

Slide 10, Oct’19
Friends of Earth – a new green initiative7
Slide 11, Oct’19
Positives:
Cement demand is likely to grow around mid single digit in calendar year 2020.
Stability in Central and State Govt. to drive investments in housing and infrastructure
projects – housing for all, concrete roads, railways, metros, civil aviation, irrigation, mega
Industrial and dedicated freight corridors etc.
Multiple reduction in interest rates by RBI – benefit for home buyers / builders
Stability of Brent crude is likely to help control fuel and diesel prices
Concerns:
Liquidity situation may affect cement and other sectors; concerted efforts by the Govt.
Imbalanced monsoon may have affect in select regions
Weakness in economy may lead to depreciation of Indian Rupee
Outlook8

Slide 12, Oct’19
HeidelbergCement India Limited – Investor Relations
For additional information, please contact:
Amit AngraEmail: [email protected]: +91-124-4503-700 (B)Tel: +91-124-4503-782 (D)
Address:HeidelbergCement India, 9th Floor, Infinity Tower C, DLF Cyber City, Phase 2, Gurugram, Haryana 122002, India
Website: www.mycemco.com

Slide 13, Oct’19
Safety is our foremost priority
Bird’s-eye view of clinker plant at Narsingarh, Damoh