Embed Size (px)
Citation preview

Q2’2016 RESULTS PRESENTATION
28 July 2016

EURONEXT PRESENTING TEAM
Stephane Boujnah
CEO & Chairman of the
Managing Board
Giorgio Modica
Group Chief Financial
Officer
Lee Hodgkinson
Head of Markets &
Global Sales
2

3
EXECUTIVE SUMMARY
1
� Resilience in revenue: €132.3 million, +1.7% vs Q2 2015; revenue generated by non-volumes operations more than offset decrease in transaction-based businesses
� Substantial reduction in operational expenses excl. D&A: -9% to €54.6 million, thanks to strict execution of the cost reduction plans
� Profitability increase: EBITDA margin of 58.7%
� EPS of €0.71, up 73% vs Q2 2015
Most profitable quarter since IPO
2Resilient business model
� Enhance agility to strengthen the resilience of the core business and growth in selected segments
� Euronext core business revenue to growth 2%1 CAGR over the period
� Six growth initiatives identified to bring €70 million of revenue and €35 million of EBITDA
� Cost discipline to remain a key focus of the Group, a target of €22 million of gross efficiencies identified (€15 million net of inflation)
� Associated restructuring expenses to reach €33 million
� EBITDA margin expected to range between 61% and 63% by 2019
3
� Strong listing performance driven by an increase in both IPO and secondary market activity
� Effective yield management: decrease in cash trading revenue limited to -6.6% in spite of the 19.4% drop in volumes thanks higher revenue capture (+ 11% compared to Q2’15)
� Cost management as a continuous driver for increased profitability
1: Growth has to be calculated based on 2015 revenue excluding clearing
New financial targets for 2015-2019 released
EURONEXT BUSINESS OVERVIEW

INVESTORS DE-RISKED EUROPEAN EQUITY EXPOSURE IN H1 2016
� Our core business activities have been mainly impacted
by the dominance of politics over economics
� Cash ADV remained at elevated levels vs historical 5-year
averages, but reduced vs H1 2015
� Meaningful equity fund outflows, last occurrence of
sustained outflow H2 2014
� Investor cash levels are 5.8 percent of portfolios, highest
levels since November 2001 (Source: BofA Merrill Lynch
Fund Manager Survey)
� Eurozone economy has shown resilience in the face of
the UK referendum
� Investors remain cautious, periods of politically-induced
market volatility likely in the months ahead
(Data source: Euronext)
(Data source: EPFR Global)
5

TRANSACTIONAL BUSINESSES – LIGHTER VOLUMES ON CASH TRADING
� Cash trading revenue of €45.8 million, down by -6.6% due to reduced volumes (-19.4%) which is offset by more trading days (+5%) and a higher revenue capture (+11%):
� Lower volumes were recorded during the quarter as investors reduced risk exposure ahead of the UK referendum on 23 June 2016
� The variation of the average basis point by +11% results from the fewer SLP flow and the fall of the average trade size
� Continuous growth of our ETF franchise, with 40 new listings during Q2 2016, record number of new listings in excess of 100 during the first six months of 2016.
� Market share for the quarter was 61.3%, steadily increasing since the beginning of the year, from 60.4% in January to 62.2% in June
Stable market share for the last four years
6
Superior market quality, depth and liquidity
0.45 0.50
Q2'15 Q2'16
20%
40%
60%
80%Euronext Market Share MTF Market Share
Blue Chips(June 2016)
Presence time at
EBBO (%)
EBBO with greatest size (%)
EBBO setter (%)
Relative spread (bps)
Displayed market
depth (€)
Euronext 79% 42% 59% 5.20 49 227
BATS Europe 35% 0% 2% 9.53 16 618
Chi-X 60% 4% 14% 6.64 22 553
Equiduct 2% 0% 1% 72.90 24 825
Turquoise 55% 3% 10% 7.20 20 171
Average daily turnover Q2’16/Q2’15 (€mm)
8,778
8,076
591
71 40
7,077
6,456
560
35 27
TOTAL CASH EQUITIES ETF STRUCT. PRODS BONDSQ2'15 Q2'16
-19.4% -20.1% -5.3% -49.7% -33.9%
Revenue per trade (bps, single counted1)
1 Total cash trading revenues divided by value traded, single counted
+11%
TRANSACTIONAL BUSINESSES – DERIVATIVES IMPACTED BY LOWER VOLATILITY
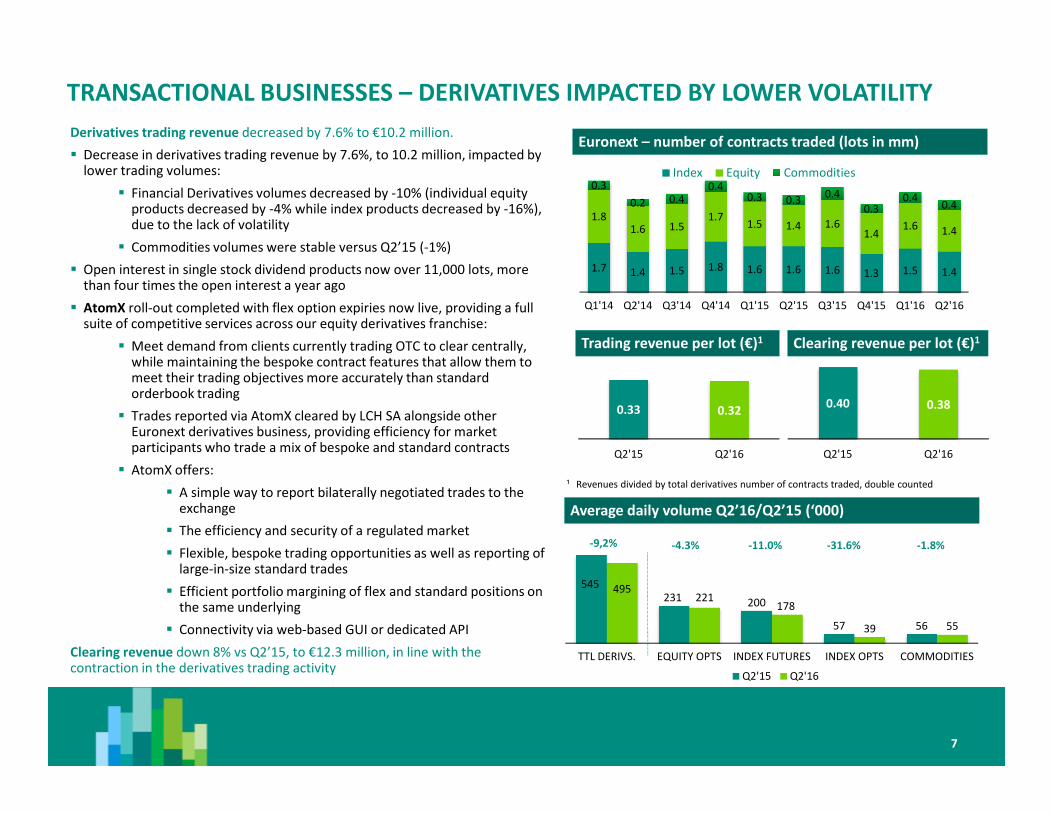
¹ Revenues divided by total derivatives number of contracts traded, double counted
7
Euronext – number of contracts traded (lots in mm)
0.33 0.32
Q2'15 Q2'16
Derivatives trading revenue decreased by 7.6% to €10.2 million.
� Decrease in derivatives trading revenue by 7.6%, to 10.2 million, impacted by lower trading volumes:
� Financial Derivatives volumes decreased by -10% (individual equity products decreased by -4% while index products decreased by -16%), due to the lack of volatility
� Commodities volumes were stable versus Q2’15 (-1%)
� Open interest in single stock dividend products now over 11,000 lots, more than four times the open interest a year ago
� AtomX roll-out completed with flex option expiries now live, providing a full suite of competitive services across our equity derivatives franchise:
� Meet demand from clients currently trading OTC to clear centrally, while maintaining the bespoke contract features that allow them to meet their trading objectives more accurately than standard orderbook trading
� Trades reported via AtomX cleared by LCH SA alongside other Euronext derivatives business, providing efficiency for market participants who trade a mix of bespoke and standard contracts
� AtomX offers:
� A simple way to report bilaterally negotiated trades to the exchange
� The efficiency and security of a regulated market
� Flexible, bespoke trading opportunities as well as reporting of large-in-size standard trades
� Efficient portfolio margining of flex and standard positions on the same underlying
� Connectivity via web-based GUI or dedicated API
Clearing revenue down 8% vs Q2’15, to €12.3 million, in line with the contraction in the derivatives trading activity
0.40 0.38
Q2'15 Q2'16
1.7 1.4 1.5 1.8 1.6 1.6 1.6 1.3 1.5 1.4
1.81.6 1.5
1.71.5 1.4 1.6
1.41.6 1.4
0.3
0.2 0.40.4
0.3 0.30.4
0.30.4
0.4
Q1'14 Q2'14 Q3'14 Q4'14 Q1'15 Q2'15 Q3'15 Q4'15 Q1'16 Q2'16
Index Equity Commodities
Average daily volume Q2’16/Q2’15 (‘000)
545231 200
57 56
495 221
178
39 55
TTL DERIVS. EQUITY OPTS INDEX FUTURES INDEX OPTS COMMODITIES
Q2'15 Q2'16
Trading revenue per lot (€)1 Clearing revenue per lot (€)1
-9,2% -4.3% -11.0% -31.6% -1.8%

STRONG PERFORMANCE FOR LISTING
2.1 2.7
19.6
43.6
Q2'15 Q2'16SME Large Cap
8
Listing Fees
Listing Activity (money raised in €bn)
Listing activity (number of listings)
8.4 7.5
5.9 8.4
2.8
5.10.8
1.1
1.4
1.2
Q2'2015 Q2'2016Fixed fees Follow ons IPOs Other Bond Fees
+21%� Listing revenue were €23.3 million in Q2 2016, an increase of 21% compared to the
€19.3 million achieved in Q2 2015.
� A strong quarter for new listing with 14 new deals raising €3 billion with several
benchmark operations, including Large cap and SME IPO, the listing of Coca Cola
and the first listing of a SPAC in France
� Excellent performance of our secondary markets, contributing to the financing of
European companies in a challenging environment, with €18.6 billion raised in
secondary equity deals
� In total €46.3 billion were raised in Q2 2016 on Euronext markets, more than twice
Q2 2015 level. Small and medium sized companies raised €2.7 billion, of which €1.2
billion through new listings
10 10
2 1
2 3
Q2'15 Q2'16
SME (domestic) SME (international) Large Cap
+113%
Interntional Tech SME

RESILIENT PERFORMANCE FOR OTHER NON-TRANSACTIONAL BUSINESSES
9
� Revenues: €8.2 million, +2.9% vs €8.0 million in Q2 2015
� Positively impacted by revenue from SLE connections as a result of change in fees structure and increase in the number of connections
� Impact is slightly lowered by a reduced level of project activity pending Optiq sales
Market solutions28 July, 2016
� Key financial highlights:
� Market data & indices revenue in Q2 2016 was up 11.5% compared to the same quarter in 2015, to €27.3 million (vs €24.5 million) still benefiting from:
� The positive impact of the new products and services launched during the course of 2015
� Some fee changes starting 1 January 2016
� Key business highlights:
� Stable number of products listed on Euronext, linked to blue chip indices compared to end Q1’16: 7,800
� Combined AUM of ETFs linked to Euronext’s main indices: €5.8 billion at the end of Q2’16, down €580m due to Brexit
� Now approximately 22,000 subscribers to the market data App. Chargeable versions of the app, the market data and listing websites with real time content to be delivered in Q4’16
� Disaggregated data packages ready to ensure MiFIDcompliance –work on the pricing model in progress
� Partnerships and agreements:
� Discussions continue with a tier one exchange to be Euronext Index Sales agent in APAC excluding China
� Ongoing discussion with two tier one exchanges to licencethe CAC 40 for futures and options trading in other timezones
� 28 June: signature of an index cooperation agreement with Shenzhen Stock Exchange regarding promotion and marketing of each Exchanges indices
Market data & indices
� Revenues for Interbolsa in Portugal stable at €5.0 million (Q2 2015:
€5.1 million)
� Slight recovery from Q1 2016 thanks to an increase in public debt
assets under custody and higher settlement activity (from €122
billion end of March 2016 to €128 billion end of June 2016)
� Another major landmark for Interbolsa: the Eurosystem has
completed the ad-hoc assessment of the Securities Settlement
Systems that have joined T2S in the second migration wave, on the
basis of which the Governing Council concluded that Interbolsa
continues to be eligible for use in Eurosystem monetary policy and
intraday credit operations
Settlement & Custody
2,2 2,2 2,4 2,3 2,8 2,51,8
2,71,9 1,7
2,61,4 1,4 1,3
2,31,8
1,6
1,8
1,7 2,2
3,6
3,7 3,7 3,6
3,6
3,73,8
4,0
4,1 4,1
0,5 0,7
0,5
0,7
0,4
0,5 0,2
0
1
2
3
4
5
6
7
8
9
10
Q1-14 Q2-14 Q3-14 Q4-14 Q1-15 Q2-15 Q3-15 Q4-15 Q1-16 Q2-16
Solutions SFTI COLO Connection Fees Other
Revenues (€m)

FINANCIALS

FINANCIAL HIGHLIGHTS1
11
REVENUE
€132.3m +1.7%
€6mof net
efficiencies
OPERATING
EXPENSES
ex. D&A
€54.6m -9%
EBITDA
MARGIN
58.7%+48bps
NET PROFIT
€49.3m+72%
GROSS CASH
POSITION
€152.8m by 30th June
2016
EPS
€0.71
(basic)
� Most profitable quarter since IPO with an
EBITDA margin of 58.7%
� Resilient revenue capture
� Strong cash position after the payment of
€86.2 million dividend in May 2016, and
total liquidity of ~€430 million
� Additional €1 million contribution made
early July to the assets managed under the
liquidity contract
� Acquisitions:
� Shareholder agreement expected
to be signed in Q3 2016 for the
acquisition of a 20% equity stake in
EuroCCP, subject to regulatory
approvals
� As part of the innovation strategy
acquisition of a 34% stake in
Tredzone, a highly specialized low
latency software developer, for an
amount of €1.4 million in Q3 2016
1: Changes vs Q2’2015

GROWTH IN REVENUES DRIVEN BY NON-TRANSACTIONAL REVENUE
Comments
12
� Listing: strong performance driven by an increase in both IPO and secondary market activity
� Cash trading revenue: decrease due to lighter volumes as investors reduced risk exposure ahead of the UK referendum on 23 June 2016
� Derivatives trading and clearing revenue: impacted by lack of volatility
� Market data: good performance, still benefiting from the positive impact of the new products and services launched during the course of 2015 as well as from some fee adjustments starting 1 January 2016
� Settlement & custody: revenue slightly recovered from Q1 2016 thanks to an increase in public debt assets under custody and higher settlement activity
� Market solutions: positively impacted by revenue from SLE connections as a result of change in fees structure and increase in the number of connections. Impact slightly lowered by a reduced level of project activity pending Optiq sales
Revenues (unaudited)
(€mm)Q2'16 Q2'15
∆∆∆∆ Q2'16
vs Q2’15
Listing 23.3 19.3 +20.9%
Trading revenue 56.0 60.1 -6.8%
o/w cash trading 45.8 49.0 -6.6%
o/w derivatives trading 10.2 11.0 -7.6%
Market data & indices 27.3 24.5 +11.5%
Post-trade 17.3 18.4 -6.2%
o/w clearing 12.3 13.3 -8.0%
o/w settlement & custody 5.0 5.1 -1.6%
Market solutions & other 8.2 8.0 +2.9%
Other income 0.2 0.0 n/s
Revenue and other income 132.3 130.1 1.7%

SUBSTANTIAL REDUCTION IN OPERATING EXPENSES
Comments
20
60
100
140
180
220
260
300
580
620
660
700
740
780
820
860
900
Jan
-14
Ma
r-1
4
Ma
y-1
4
Jul-
14
Se
p-1
4
No
v-1
4
Jan
-15
Ma
r-1
5
Ma
y-1
5
Jul-
15
Se
p-1
5
No
v-1
5
Jan
-16
Ma
r-1
6
Ma
y-1
6
Pro
ject
co
ntr
act
ors
Pe
rma
ne
nt
em
plo
ye
es
� After the completion of the first saving plan at the end of Q1’16 (M€ 85), €6 million of additional savings were delivered in Q2’16, resulting from the strict execution of the cost reduction plan
� All other categories of expenses are down, except accommodation costs that were impacted by one-off expenses in Q2’16
� Compensation costs fell by M€ -3.9, or -13%, as part of the continuous efforts of improving efficiency across the organization (average headcount from 703 in Q2’15 to 617 in Q2’16)
� Headcount end of June was down to 608 FTEs while project contractors were up to 113, due to the various projects within the organization (Optiq, relocation of IT operations from Belfast to Porto, MiFid2, etc.)
� Total FTEs expected to grow in the next quarters due to the temporary overlapping between Belfast and Porto
Operating expenses (unaudited)
(€mm) Q2'16 Q2'15
∆∆∆∆ Q2'16
vs Q2’15
Salaries and employee benefits (26.4) (30.3) -12.8%
System and communications (4.3) (4.3) -0.1%
Professional services (9.0) (10.2) -12.0%
Clearing expenses (6.8) (7.0) -2.8%
Accommodation (3.0) (2.7) 10.1%
Other expenses (5.0) (5.4) -7.1%
Total operational expenses(54.6) (60.0) -9.0%
(excl. D&A)
Depreciation and amortisation (3.8) (4.5) -16.1%
Total operational expenses (58.4) (64.5) -9.5%
13

SIMPLIFIED INCOME STATEMENT
Comments
� EBITDA margin of 58.7% benefited from combination of slight increase in revenue and strong decrease in cost
� Depreciation & amortisation decrease due to 2015 accelerated depreciation of headquarters in France and Belgium
� Exceptional costs include expenses for employee termination benefits in the various Euronext locations, and expenses related to the update on the French restructuring plans and the relocation of Belfast IT operations to Porto. Exceptional costs in Q2 2015 (€24.6 million) included the recognition of the provision for the French restructuring plans (€22.1 million) and some redundancy costs in Europe
� Net financing income/expense was impacted by directional change of GBP/EUR exchange rate, resulting in a lower exchange loss in Q2’16.
� Higher dividend paid by Euroclear translated into + 36% in result from equity investments
� Income tax of 31.8%, slightly higher than the normalized tax rate due to some discrete items such as the impact of the French restructuring plans
� +72% in net profit, to €49.3 million, representing an EPS of €0.71 basic and €0.70 fully diluted, compared with €0.41 in Q2 2015 (both basic and fully diluted)
14
Income statement (unaudited)
(€mm) Q2'16 Q2'15
∆∆∆∆ Q2'16
vs Q2’15
EBITDA 77.7 70.1 +11%
Margin 58.7% 53.9% +48bps
Depreciation and amortisation (3.8) (4.5) -16%
Total expenses (58.4) (64.5) -9%
Operating profit (before exceptional items) 73.9 65.6 +13%
Margin 55.9% 50.4% +54bps
Exceptional items (5.2) (24.6) -79%
Operating profit 68.7 41.1 +67%
Net financing income/(expense) (0.8) (1.2) -29%
Results from equity investments and other
income 4.5 3.3 +36%
Profit before income tax 72.4 43.2 +68%
Income tax expense (23.0) (14.5) +59%
Tax rate -31.8% -33.6% -18bps
Profit for the period 49.3 28.7 +72%

BALANCE SHEET
� Assets:
� Cash and cash equivalents as of 30 June 2016 in line with 31 December 2015, despite dividend payment (€86.2 million) thanks to the strong cash flow generation
� No other significant item to report
� Liabilities:
� Other non-current liabilities increased due to the increase in post-employment benefit liability, following a significant decrease in discount rates
� Other current liabilities decreased due to the execution of the French restructuring plans
Comments
15
Balance sheet summary (unaudited)
(€mm) H1’16 FY’15
∆∆∆∆ H1'16
vs FY’15
Non-current assets
Property, plant and equipment 27 29 -5%
Goodwill and other intangibles 321 321 0%
Equity investments 114 114 0%
Other non-current assets 15 20 -27%
Current assets
Cash and cash equivalents 153 159 -4%
Other current assets 112 107 +5%
Total assets 742 750 -1%
Non-current liabilities
Borrowings 109 108 0%
Other non-current liabilities 22 16 +42%
Current liabilities
Trade and other payables 105 106 -1%
Other current liabilities 62 73 -15%
Total liabilities 298 303 -2%
Total equity 444 447 -1%
Total equity and liabilities 742 750 -1%

CASH FLOW & LIQUIDITY
� No significant change in available liquidity vs year-end 2015
� In case of RCF full withdrawal, Euronext would remain comfortably
within the covenants
16
� Operating Cash Flow: Q2’16 profit before tax of €+72.4 million, negative impact from
changes in working capital of €-21.0 million (French restructuring plans) and income
taxes paid for €-13.8 million in Q2’16
� Investing Cash Flow: Q2’16 Capital expenditures amounted to €-3.4 million
� Financing Cash Flow: Q2’16 mainly driven by the €-86.2 million dividend paid
� Non cash exchange gain: The conversion of the UK entities cash positions to Euro
caused a forex impact of €-1.8 million on the cash flow in Q2’16.
� Total negative Cash flow in Q2’16 of €-48.1 million
Liquidity (unaudited)
Actual Actual
(€mm) H1'16 FY'15
Cash beginning of period 158.6 241.6
Debt repayment - (140.0)
Dividend (86.2) (58.8)
Cash accumulation 80.4 115.8
Cash end of period 152.8 158.6
Minimum Cash for operations (110.0) (110.0)
Strategic Cash 42.8 48.6
RCF 390.0 390.0
Available Liquidity 432.8 438.6
Cash flow statement (unaudited)
(€mm) Q2'16 Q2'15
∆∆∆∆ Q2'16
vs Q2’15
Net cash provided by/(used in) operating activities 42.0 27.4 +54%
Net cash provided by/(used in) investing activities (3.4) (2.4) +40%
o/w capital expenditures (3.4) (7.4) -55%
Net cash provided by/(used in) financing activities (86.7) (59.6) +46%
Net increase/(decrease) in cash and cash equivalents (48.1) (34.6) +39%
Cash and cash equivalents – beginning of period 202.8 162.0 +25%
Non cash exchange gains/(losses) (1.8) 1.0 -292%
Cash and cash equivalents – end of period 152.8 128.4 +19%


