Embed Size (px)
Citation preview

29 October 2009
Singapore Post Limited (Reg. No. 199201623M)
Q2 & H1 FY2009/10 Results Financial year ending 31 March 2010
Contents• Overview
• Group Results
• Segment Results
• Financial Position, Dividend
• Summary
The following presentation contains forward looking statements by the management of Singapore Post Limited ("SingPost"), relating to financial trends for future periods, compared to the results for previous periods.
Some of the statements contained in this presentation that are not historical facts are statements of future expectations with respect to the financial conditions, results of operations and businesses, and related plans and objectives. Forward looking information is based on management's current views and assumptions including, but not limited to, prevailing economic and market conditions. These statements involve known and unknown risks and uncertainties that could cause actual results, performance or events to differ materially from those in the statements as originally made. Such statements are not, and should not be construed as a representation as to future performance of SingPost. In particular, such targets should not be regarded as a forecast or projection of future performance of SingPost. It should be noted that the actual performance of SingPost may vary significantly from such statements.
“$” means Singapore dollars unless otherwise indicated.
Forward-looking Statements – Important Note
3
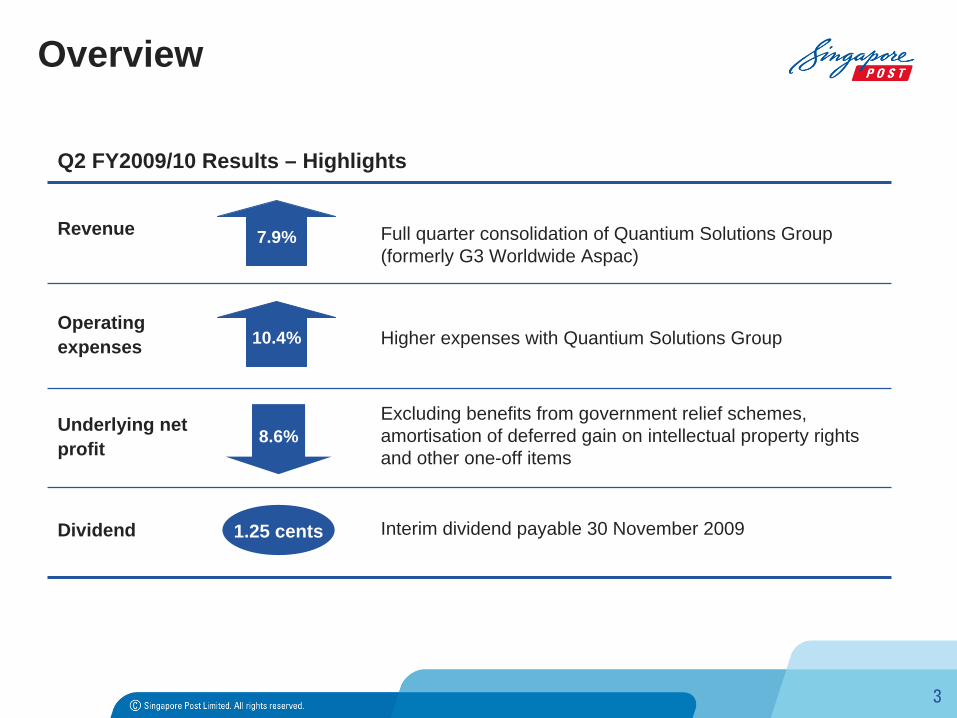
Revenue
Q2 FY2009/10 Results – Highlights
Full quarter consolidation of Quantium Solutions Group (formerly G3 Worldwide Aspac)
Operating expenses Higher expenses with Quantium Solutions Group
Underlying net profit
Excluding benefits from government relief schemes, amortisation of deferred gain on intellectual property rights and other one-off items
8.6%
Overview
Dividend Interim dividend payable 30 November 20091.25 cents
10.4%
7.9%

4
Overview
Acquisition of Quantium Solutions Group –Platform for regional expansion
Positioning Group for growth• Continual management of costs and capacity • Strengthening and building network and businesses
for future growth• Extending core competencies into region
Strategic investment in company focused on postal innovation and technology
Leveraging innovation

5
Q2 FY2009/10 P&L
$M Q2 FY08/09 Q2 FY09/10 Change % change
Revenue 120.7 130.3 +9.5 +7.9%
Other income 7.3 13.1 +5.7 +78.1%
Operating expenses 83.4 92.1 +8.7 +10.4%
Operating profit 44.6 51.2 +6.6 +14.8%
Share of assoc & JVs 3.0 <0.1 (2.9) (98.7%)
Net finance costs 1.7 2.2 +0.5 +31.7%
Profit before tax 45.9 49.0 +3.1 +6.8%
Income tax 8.4 8.4 - +0.1%
Net profit* 37.4 40.5 +3.1 +8.3%
Underlying net profit* 38.7 35.4 (3.3) (8.6%)
* Profit after tax attributable to equity holders of the Company; underlying net profit excludes one-off items.
6
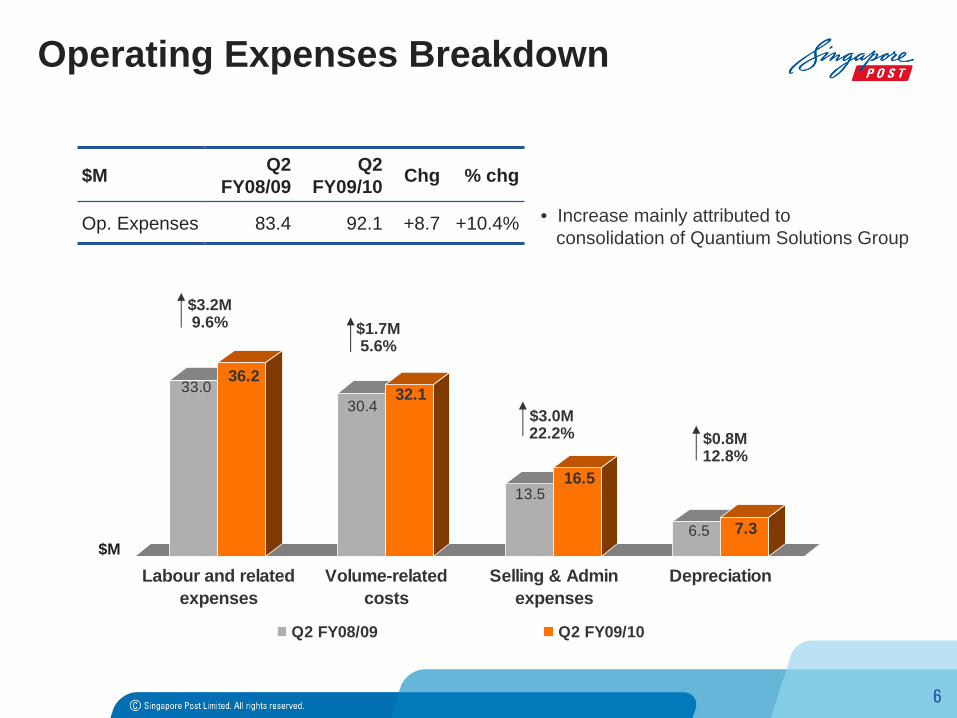
33.036.2
30.432.1
13.516.5
6.5 7.3
Labour and relatedexpenses
Volume-relatedcosts
Selling & Adminexpenses
Depreciation
Q2 FY08/09 Q2 FY09/10
$3.2M9.6% $1.7M
5.6%
$3.0M22.2% $0.8M
12.8%
$M Q2 FY08/09
Q2 FY09/10 Chg % chg
Op. Expenses 83.4 92.1 +8.7 +10.4%
Operating Expenses Breakdown
$M
• Increase mainly attributed to consolidation of Quantium Solutions Group
7
H1 FY2009/10 P&L
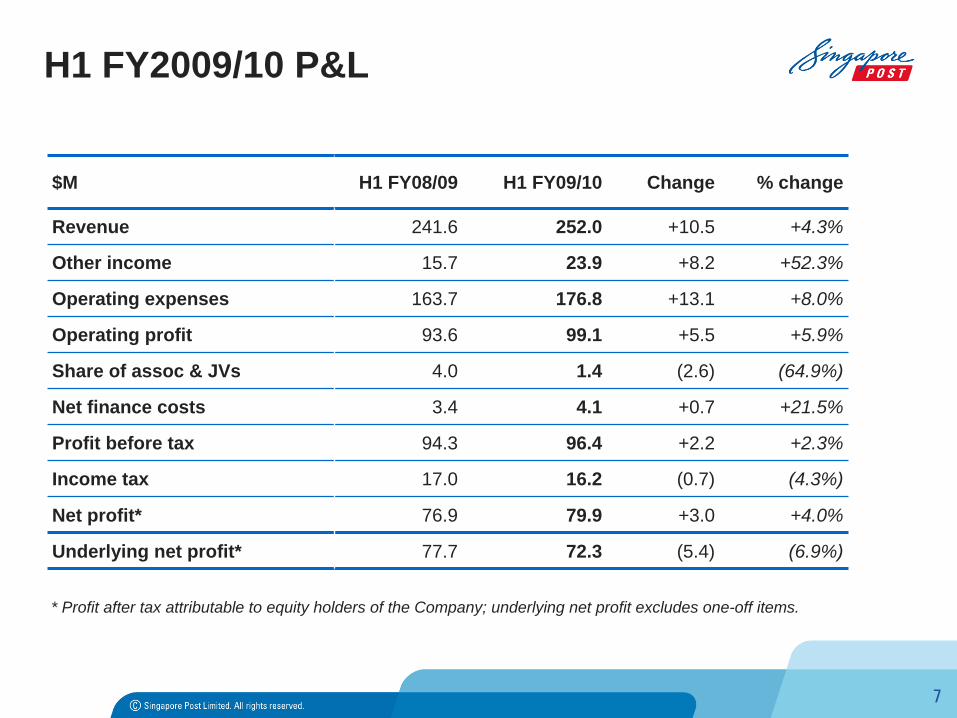
$M H1 FY08/09 H1 FY09/10 Change % change
Revenue 241.6 252.0 +10.5 +4.3%
Other income 15.7 23.9 +8.2 +52.3%
Operating expenses 163.7 176.8 +13.1 +8.0%
Operating profit 93.6 99.1 +5.5 +5.9%
Share of assoc & JVs 4.0 1.4 (2.6) (64.9%)
Net finance costs 3.4 4.1 +0.7 +21.5%
Profit before tax 94.3 96.4 +2.2 +2.3%
Income tax 17.0 16.2 (0.7) (4.3%)
Net profit* 76.9 79.9 +3.0 +4.0%
Underlying net profit* 77.7 72.3 (5.4) (6.9%)
* Profit after tax attributable to equity holders of the Company; underlying net profit excludes one-off items.
Segment Results• Mail
• Logistics
• Retail
Financial Position, Dividend
Summary
9
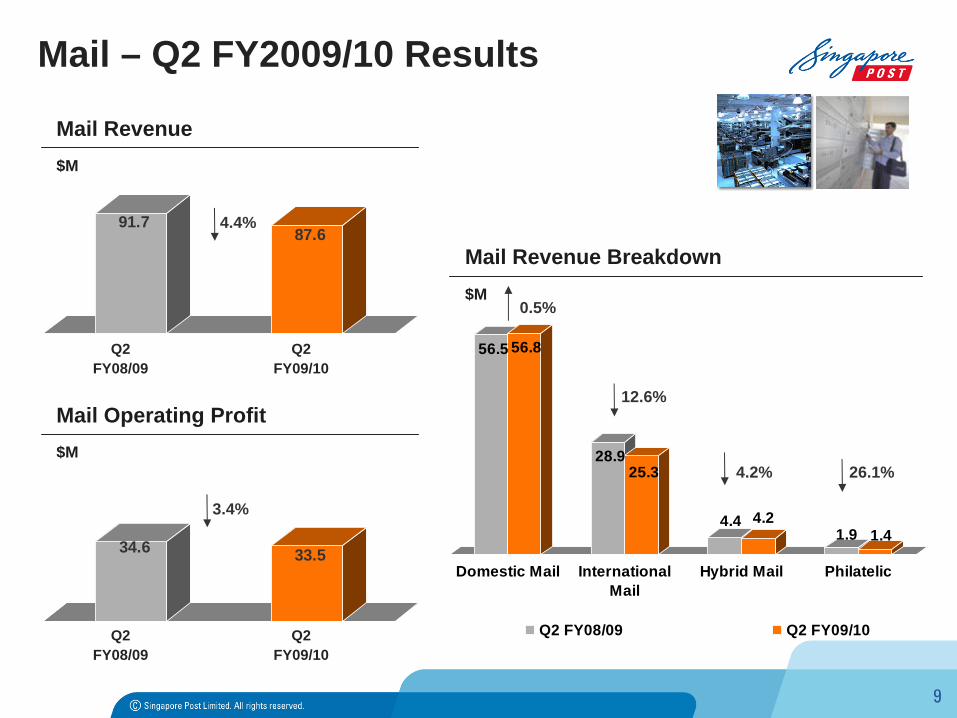
Mail – Q2 FY2009/10 Results
91.787.6
Q2 FY08/09
Q2 FY09/10
Mail Revenue
4.4%
$M
34.6 33.5
Q2 FY08/09
Q2 FY09/10
Mail Operating Profit
3.4%
$M
56.5 56.8
28.925.3
4.4 4.21.9 1.4
Domestic Mail InternationalMail
Hybrid Mail Philatelic
Q2 FY08/09 Q2 FY09/10
Mail Revenue Breakdown$M
0.5%
12.6%
4.2% 26.1%
10
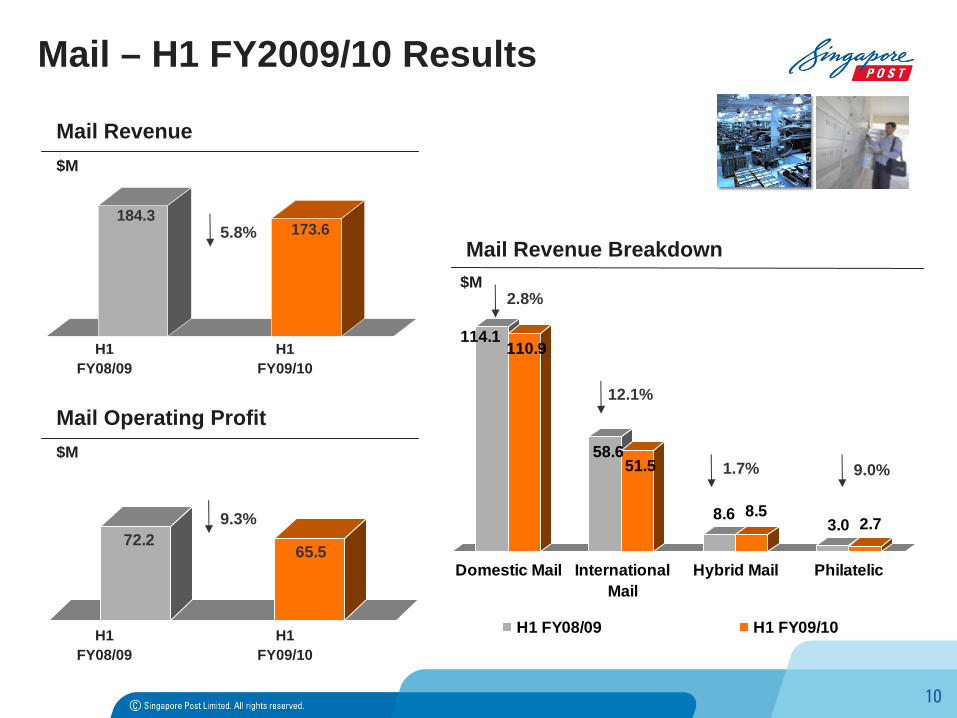
Mail – H1 FY2009/10 Results
184.3173.6
H1 FY08/09
H1 FY09/10
Mail Revenue
5.8%
$M
72.265.5
H1 FY08/09
H1 FY09/10
Mail Operating Profit
9.3%
$M
114.1110.9
58.651.5
8.6 8.53.0 2.7
Domestic Mail InternationalMail
Hybrid Mail Philatelic
H1 FY08/09 H1 FY09/10
Mail Revenue Breakdown$M
12.1%
2.8%
1.7% 9.0%

11
Logistics – Q2 FY2009/10 Results
18.8
45.6
Q2 FY08/09
Q2 FY09/10
Logistics Revenue
142.1%
$M
2.23.2
Q2 FY08/09
Q2 FY09/10
Logistics Operating Profit$M
42.7%
Logistics Revenue Breakdown$M
28.2
14.813.2
3.8 3.8
QuantiumSolutions Group
Speedpost WFD* & others
Q2 FY08/09 Q2 FY09/10
10.6%
* Warehousing, Fulfilment and Distribution
1.9%
12
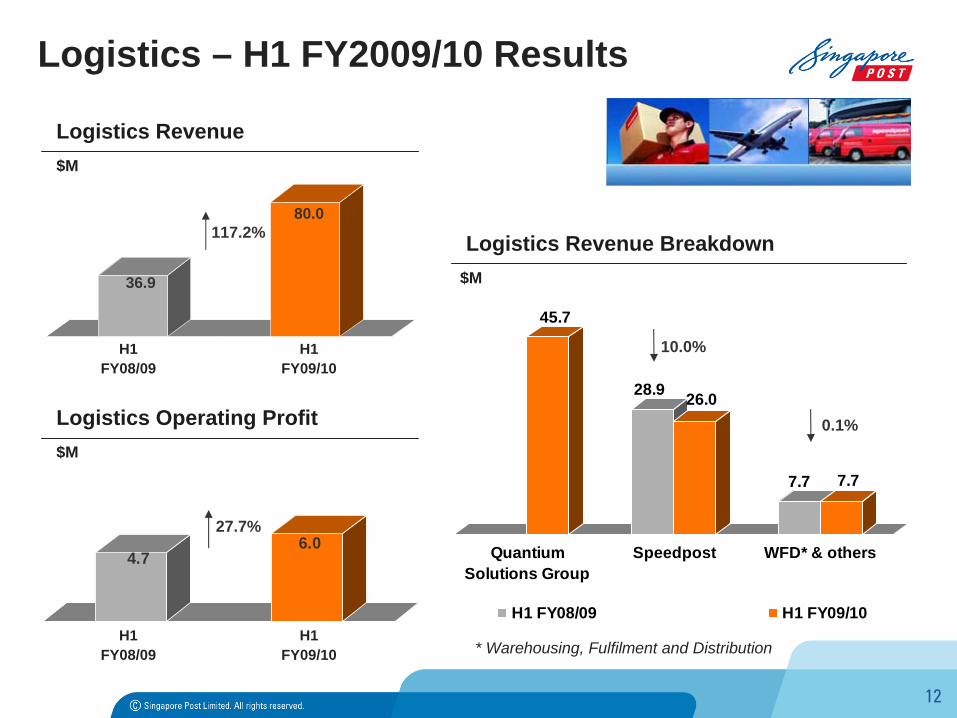
Logistics – H1 FY2009/10 Results
36.9
80.0
H1 FY08/09
H1 FY09/10
Logistics Revenue
117.2%
$M
4.76.0
H1 FY08/09
H1 FY09/10
Logistics Operating Profit$M
27.7%
45.7
28.9 26.0
7.7 7.7
QuantiumSolutions Group
Speedpost WFD* & others
H1 FY08/09 H1 FY09/10
Logistics Revenue Breakdown$M
0.1%
10.0%
* Warehousing, Fulfilment and Distribution
13
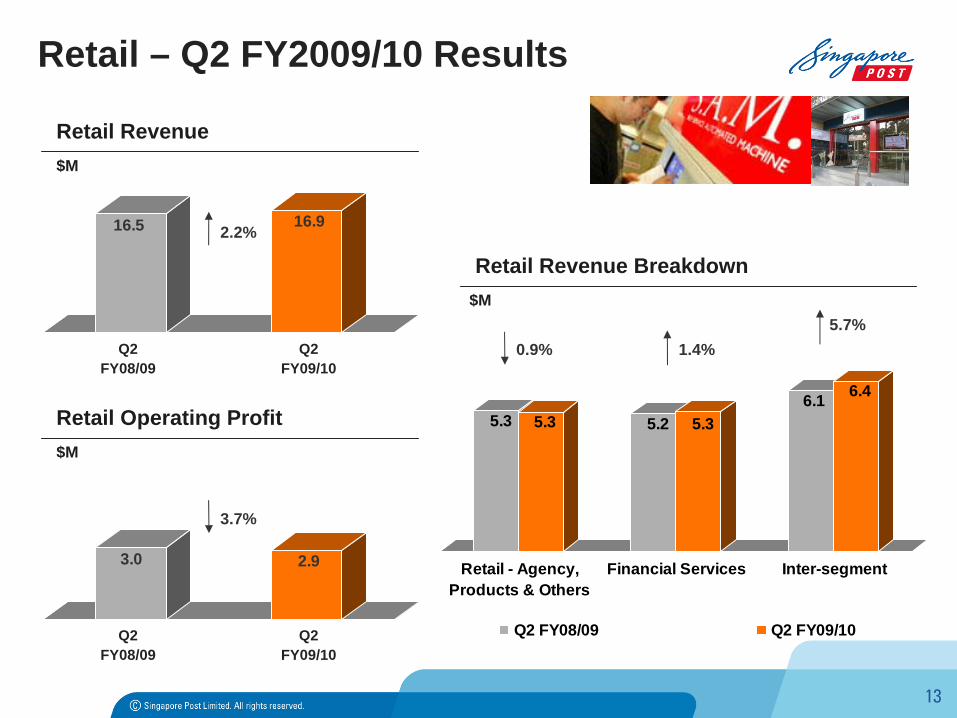
Retail – Q2 FY2009/10 Results
16.5 16.9
Q2 FY08/09
Q2 FY09/10
Retail Revenue$M
3.0 2.9
Q2 FY08/09
Q2 FY09/10
Retail Operating Profit
3.7%
$M
2.2%
Retail Revenue Breakdown$M
5.3 5.3 5.2 5.36.1 6.4
Retail - Agency,Products & Others
Financial Services Inter-segment
Q2 FY08/09 Q2 FY09/10
0.9% 1.4%5.7%
14
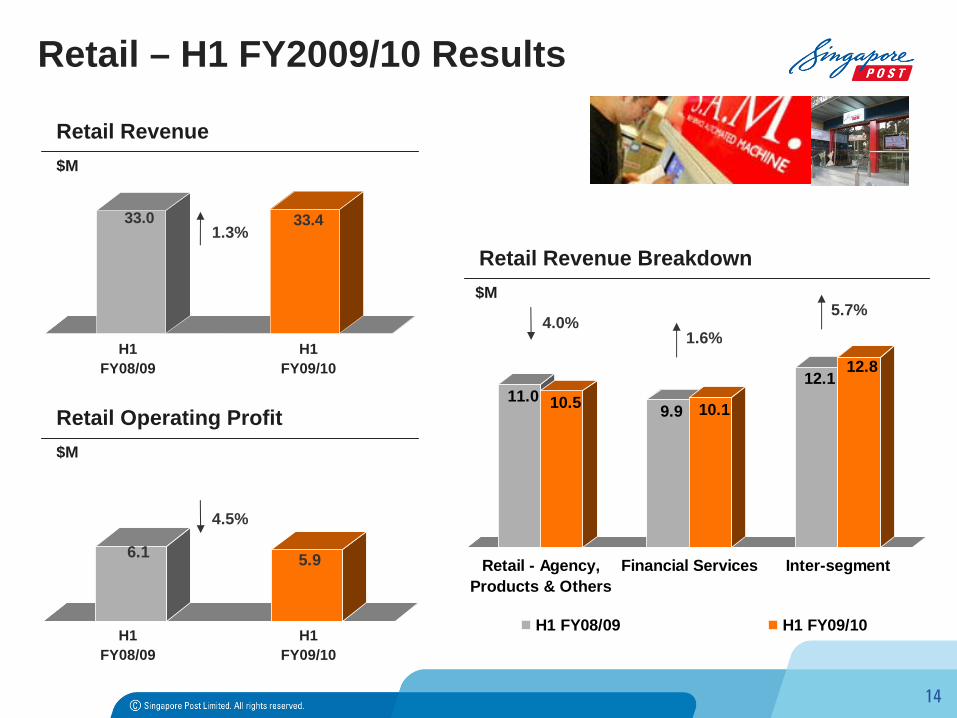
Retail – H1 FY2009/10 Results
33.0 33.4
H1 FY08/09
H1 FY09/10
Retail Revenue$M
6.1 5.9
H1 FY08/09
H1 FY09/10
Retail Operating Profit
4.5%
$M
1.3%
11.0 10.5 9.9 10.1
12.112.8
Retail - Agency,Products & Others
Financial Services Inter-segment
H1 FY08/09 H1 FY09/10
Retail Revenue Breakdown$M
1.6%4.0%
5.7%
15
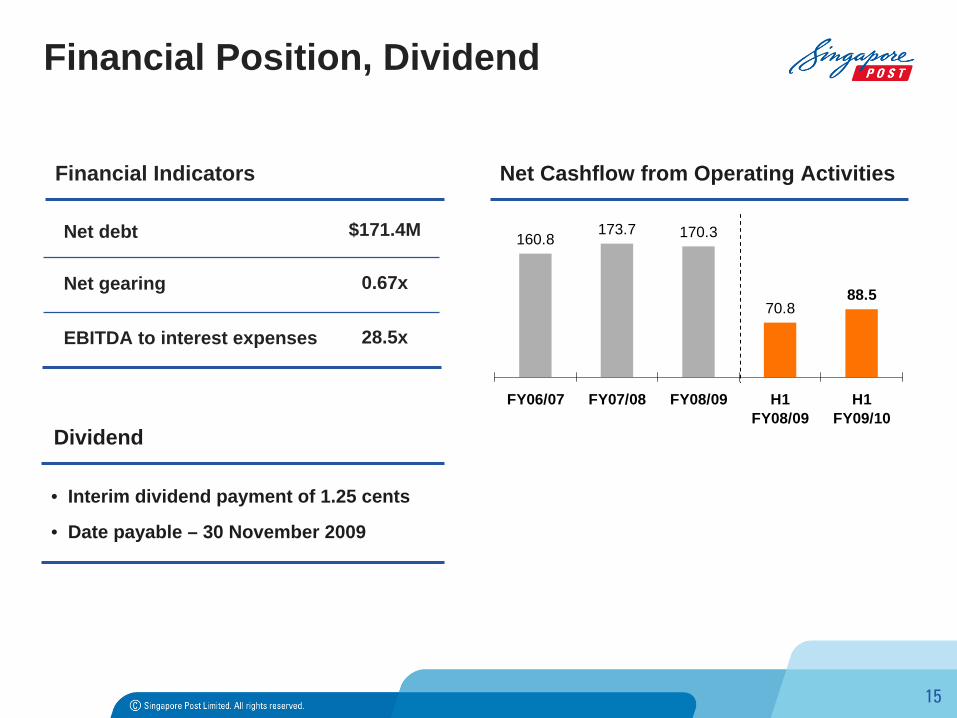
Financial Position, Dividend
Net debt
Financial Indicators
Net gearing
$171.4M
0.67x
EBITDA to interest expenses 28.5x
• Interim dividend payment of 1.25 cents
• Date payable – 30 November 2009
Dividend
160.8173.7 170.3
70.888.5
FY06/07 FY07/08 FY08/09 H1FY08/09
H1FY09/10
Net Cashflow from Operating Activities

16
Summary
Q2 & H1 FY2009/10 results
• Consolidation of Quantium Solutions Group acquired in May 2009
• Impact of weak economic environment
• Healthy cash flows and financial position
Positioning SingPost for growth
• Continual management of costs and capacity
• Strengthening and building network and businesses for future growth
• Extending and expanding into region