Embed Size (px)
Citation preview
Q2 FY’19
Industry Update &
Key Performance Highlights
13th November, 2018

This presentation may contain certain forward looking statements concerning JSPL’s future business prospects and business profitability, which are subject to a number of risks and uncertainties and the actual results could materially differ from those in such forward looking statements.
The risks and uncertainties relating to these statements include, but are not limited to, risks and uncertainties regarding fluctuations in earnings, our ability to manage growth, competition (both domestic and international), economic growth in India and the target countries for exports, ability to attract and retain highly skilled professionals, time and cost over runs on contracts, our ability to manage our international operations, government policies and actions with respect to investments, fiscal deficits, regulations, etc., interest and other fiscal costs generally prevailing in the economy. Past performance may not be indicative of future performance. We do not undertake to update our forward-looking statements.
This presentation is not intended, and does not, constitute or form part of any offer, invitation or the solicitation of an offer to purchase, otherwise acquire, subscribe for, sell or otherwise dispose of, any securities in JSPL or any of it’s subsidiary undertakings or any other invitation or inducement to engage in investment activities, neither shall this presentation nor the fact of it’s distribution form the basis of, or be relied on in connection with, any contract or investment decision. Few numbers in this presentation are purely indicative & provisional and could change later.
2

Q2 FY’19
INDUSTRY UPDATE
BRIEF BACKGROUND OPERATIONAL PERFORMANCE
3
1286
659
1347
699
World China
9m CY17 9m CY18
4.6%
6% 75
78
61
80 79
64
India Japan USA
6% 1%
5%
Y-o-Y Growth
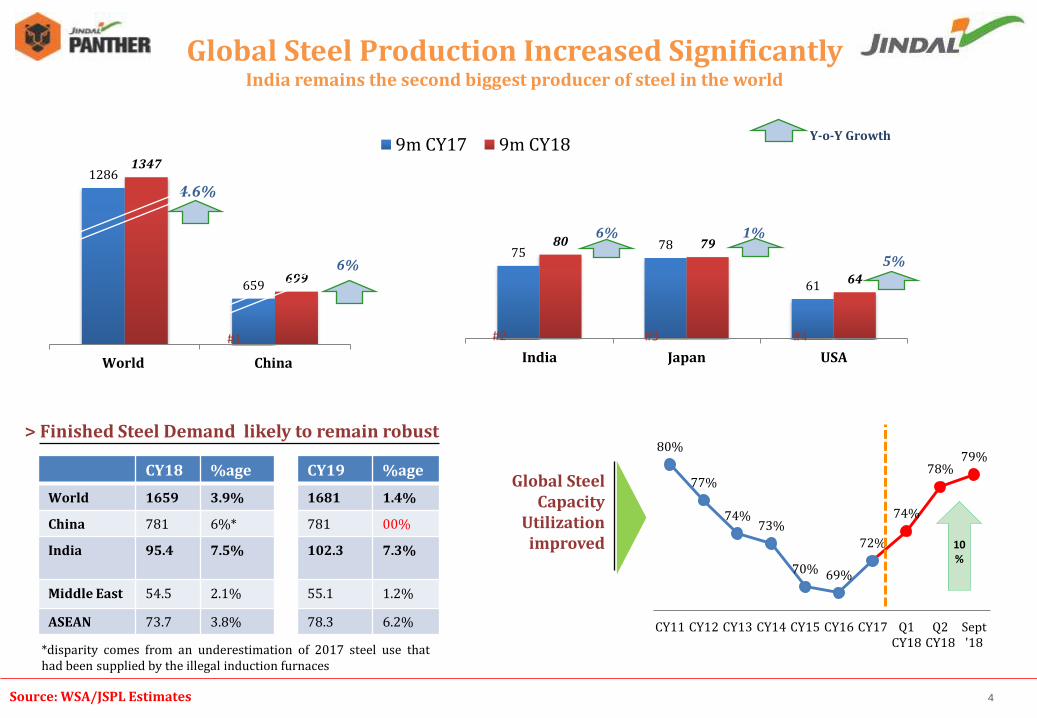
Global Steel Production Increased Significantly India remains the second biggest producer of steel in the world
#1 #2 #3 #4
80%
77%
74% 73%
70% 69%
72%
74%
78% 79%
CY11 CY12 CY13 CY14 CY15 CY16 CY17 Q1CY18
Q2CY18
Sept'18
10%
Global Steel Capacity
Utilization improved
Source: WSA/JSPL Estimates
CY18 %age CY19 %age
World 1659 3.9% 1681 1.4%
China 781 6%* 781 00%
India 95.4 7.5% 102.3
7.3%
Middle East 54.5 2.1% 55.1 1.2%
ASEAN 73.7 3.8% 78.3 6.2%
> Finished Steel Demand likely to remain robust
*disparity comes from an underestimation of 2017 steel use that had been supplied by the illegal induction furnaces
4
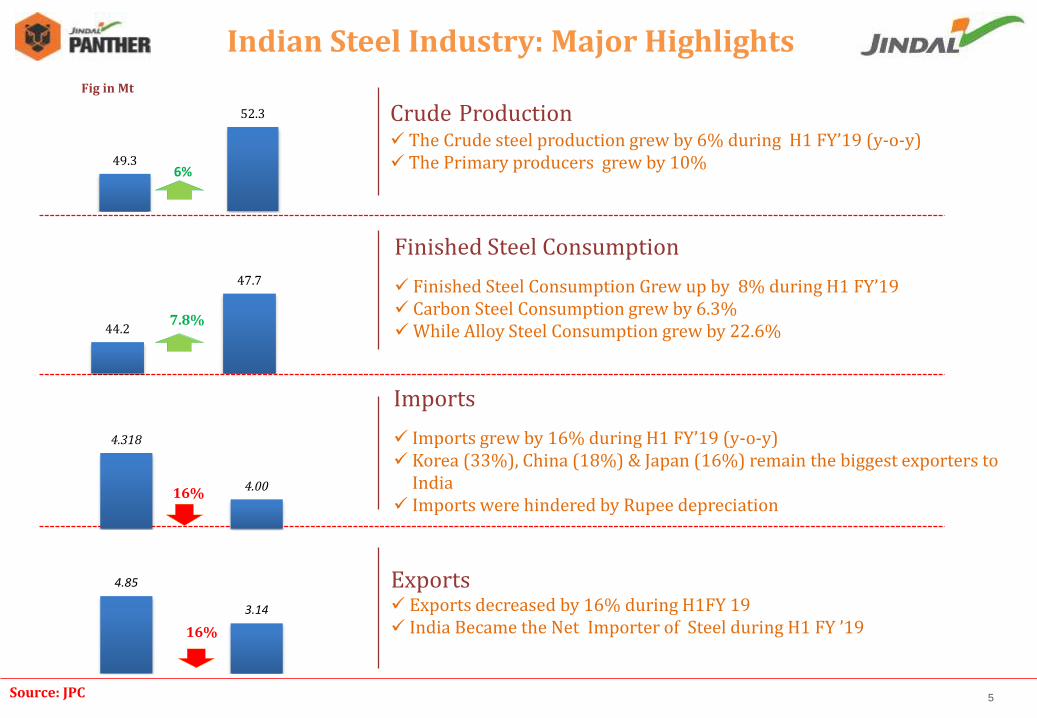
Indian Steel Industry: Major Highlights
Source: JPC 5
Crude Production The Crude steel production grew by 6% during H1 FY’19 (y-o-y) The Primary producers grew by 10%
Finished Steel Consumption
Finished Steel Consumption Grew up by 8% during H1 FY’19 Carbon Steel Consumption grew by 6.3% While Alloy Steel Consumption grew by 22.6%
Imports
Imports grew by 16% during H1 FY’19 (y-o-y) Korea (33%), China (18%) & Japan (16%) remain the biggest exporters to
India Imports were hindered by Rupee depreciation
Exports Exports decreased by 16% during H1FY 19 India Became the Net Importer of Steel during H1 FY ’19
Fig in Mt
6% 49.3
52.3
44.2
47.7
7.8%
4.318
4.00 16%
4.85
3.14
16%
8.3 8.6 8.9
9.0
9.6 10.2
3.6% 3.0%
3.7%
1.9%
6.5% 6.1%
0.0
2.0
4.0
6.0
8.0
10.0
12.0
14.0
16.0
18.0
20.0
0.0%
1.5%
3.0%
4.5%
6.0%
7.5%
CY14 CY15 CY16 CY17 CY18f CY19f
Co
nst
ruct
ion
GV
A (
Rs.
Tn
)
Co
nst
ruct
ion
Gro
wth
(%
)
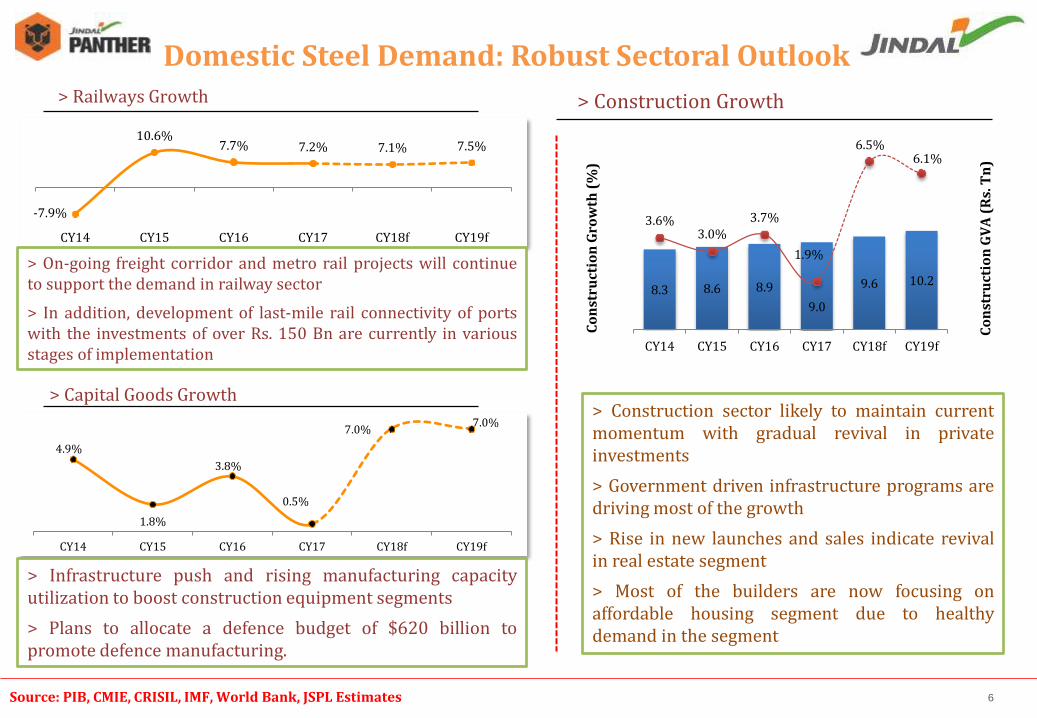
> Construction Growth
> Construction sector likely to maintain current momentum with gradual revival in private investments
> Government driven infrastructure programs are driving most of the growth
> Rise in new launches and sales indicate revival in real estate segment
> Most of the builders are now focusing on affordable housing segment due to healthy demand in the segment
Domestic Steel Demand: Robust Sectoral Outlook
Source: PIB, CMIE, CRISIL, IMF, World Bank, JSPL Estimates
-7.9%
10.6% 7.7% 7.2% 7.1% 7.5%
CY14 CY15 CY16 CY17 CY18f CY19f
> Railways Growth
> On-going freight corridor and metro rail projects will continue to support the demand in railway sector
> In addition, development of last-mile rail connectivity of ports with the investments of over Rs. 150 Bn are currently in various stages of implementation
4.9%
1.8%
3.8%
0.5%
7.0% 7.0%
CY14 CY15 CY16 CY17 CY18f CY19f
> Capital Goods Growth
> Infrastructure push and rising manufacturing capacity utilization to boost construction equipment segments
> Plans to allocate a defence budget of $620 billion to promote defence manufacturing.
6
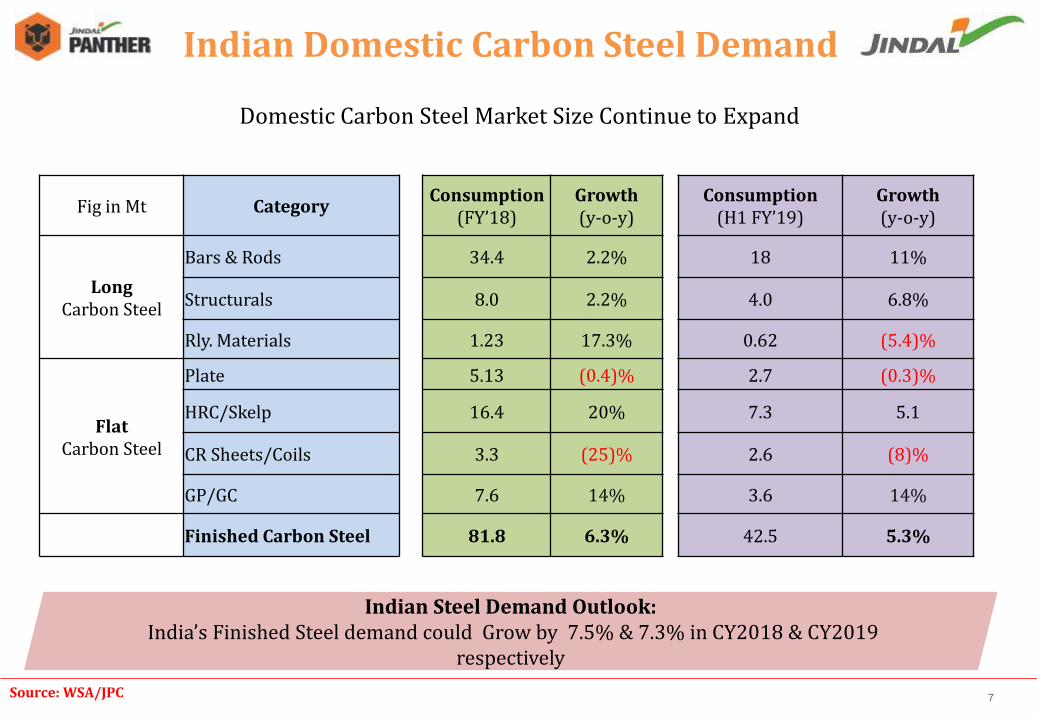
Fig in Mt Category Consumption
(FY’18) Growth (y-o-y)
Consumption (H1 FY’19)
Growth (y-o-y)
Long Carbon Steel
Bars & Rods 34.4 2.2% 18 11%
Structurals 8.0 2.2% 4.0 6.8%
Rly. Materials 1.23 17.3% 0.62 (5.4)%
Flat Carbon Steel
Plate 5.13 (0.4)% 2.7 (0.3)%
HRC/Skelp 16.4 20% 7.3 5.1
CR Sheets/Coils 3.3 (25)% 2.6 (8)%
GP/GC 7.6 14% 3.6 14%
Finished Carbon Steel 81.8 6.3% 42.5 5.3%
Domestic Carbon Steel Market Size Continue to Expand
Indian Steel Demand Outlook: India’s Finished Steel demand could Grow by 7.5% & 7.3% in CY2018 & CY2019
respectively
Indian Domestic Carbon Steel Demand
Source: WSA/JPC 7
INDUSTRY UPDATE
STEEL SECTOR
8
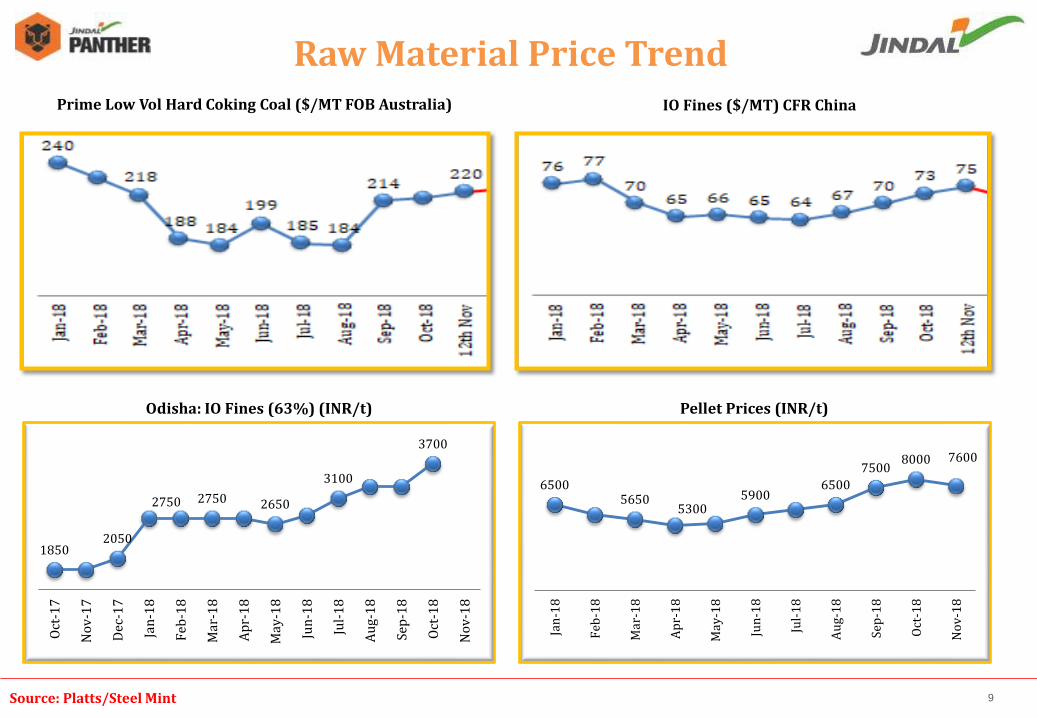
Source: Platts/Steel Mint 9
Raw Material Price Trend Prime Low Vol Hard Coking Coal ($/MT FOB Australia) IO Fines ($/MT) CFR China
Pellet Prices (INR/t)
1850 2050
2750 2750 2650
3100
3700
Oct
-17
No
v-1
7
Dec
-17
Jan
-18
Feb
-18
Mar
-18
Ap
r-1
8
May
-18
Jun
-18
Jul-
18
Au
g-1
8
Sep
-18
Oct
-18
No
v-1
8
Odisha: IO Fines (63%) (INR/t)
6500 5650
5300 5900
6500
7500 8000 7600
Jan
-18
Feb
-18
Mar
-18
Ap
r-1
8
May
-18
Jun
-18
Jul-
18
Au
g-1
8
Sep
-18
Oct
-18
No
v-1
8

Wire Rod: ($/MT FOB China) Plate Price Trend ($/MT FOB China)
International Price Trend
Long product Long product price trend continue to soften in Middle East and African Markets
564
577
602 599
616 620
613 607
599
578
565
Jan
-18
Feb
-18
Mar
-18
Ap
r-1
8
May
-18
Jun
-18
Jul-
18
Au
g-1
8
Sep
-18
Oct
-18
No
v-1
8
569 565
596
560 549 547 542
520 511
499 509
Jan
-18
Feb
-18
Mar
-18
Ap
r-1
8
May
-18
Jun
-18
Jul-
18
Au
g-1
8
Sep
-18
Oct
-18
No
v-1
8
Rebar : ($/MT FOB Turkey )
567
576
588
566 570
580
572
584
590
577
558
Jan
-18
Feb
-18
Mar
-1
8
Ap
r-1
8
May
-1
8
Jun
-18
Jul-
18
Au
g-1
8
Sep
-18
Oct
-18
No
v-
18
International Finished Product Price Trend
Source: Platts/Steel Mint/ MB/ JSPL Research 10
INDUSTRY UPDATE
POWER SECTOR
11

Source: IEX 12
Power Exchange Prices
2.25
1.97 1.86
2.13
1.91 1.84
1.86 2.05
3.06
2.55
2.20 2.11
1.90 1.77
2.06
2.35
1.72
1.89
1.76 1.74
2.01 2.06 1.98
1.80
2.03
2.05
2.06
2.36
2.50
2.19
2.05 2.67
3.68 3.68
3.20
2.65
3.19 3.22
4.02 3.97
4.57
3.68
3.45 3.33
4.69
5.73
3.85
1.30
1.80
2.30
2.80
3.30
3.80
4.30
4.80
5.30
5.80
Jan Feb Mar Apr May Jun Jul Aug Sep Oct Nov Dec
RTC Power Exchange Prices – W3 Area (Rs./kWh)
2015 2016 2017 2018
*Till 12th Nov’18
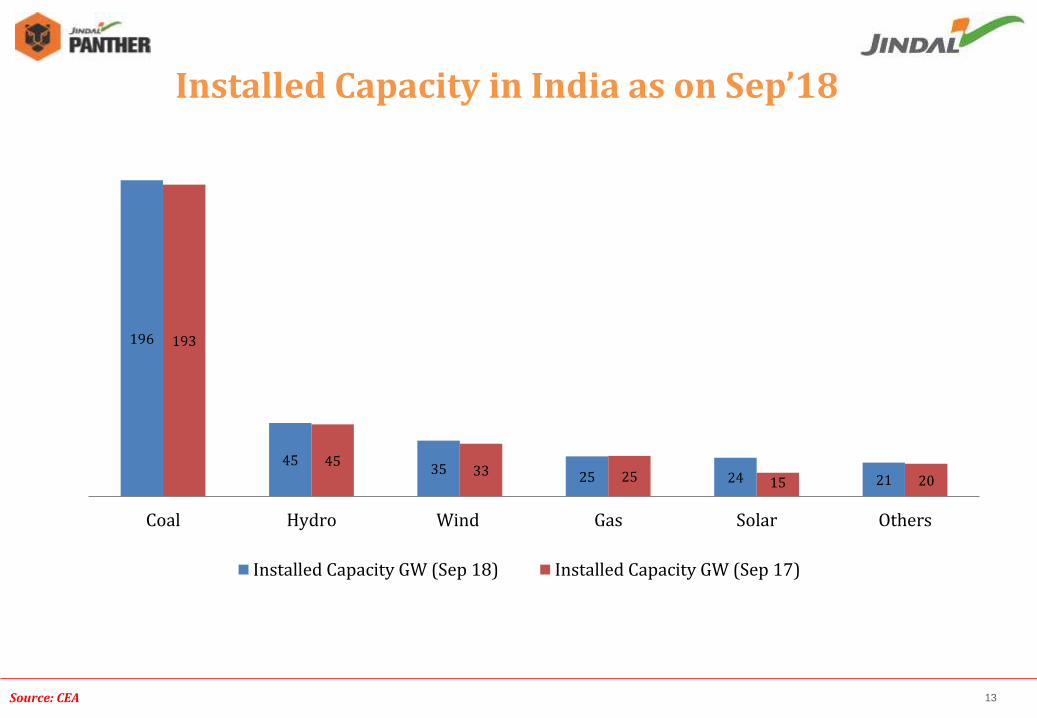
Source: CEA 13
Installed Capacity in India as on Sep’18
196
45 35
25 24 21
193
45 33 25 15 20
Coal Hydro Wind Gas Solar Others
Installed Capacity GW (Sep 18) Installed Capacity GW (Sep 17)
INDUSTRY UPDATE
BRIEF BACKGROUND OPERATIONAL PERFORMANCE
14
Q2 FY’19

Steel Power Global Ventures
Current Capacities – Domestic & Global
Business Segments
*Domestic **1000 MW Divestment announced
8.6 MTPA Steel* 3.11 MTPA* Iron ore 9 MTPA* Pellet Plant
IPP – 3400MW** CPP – 1634 MW
2 MTPA Steel Coal & Iron Ore Mines
15
Capacity in deail
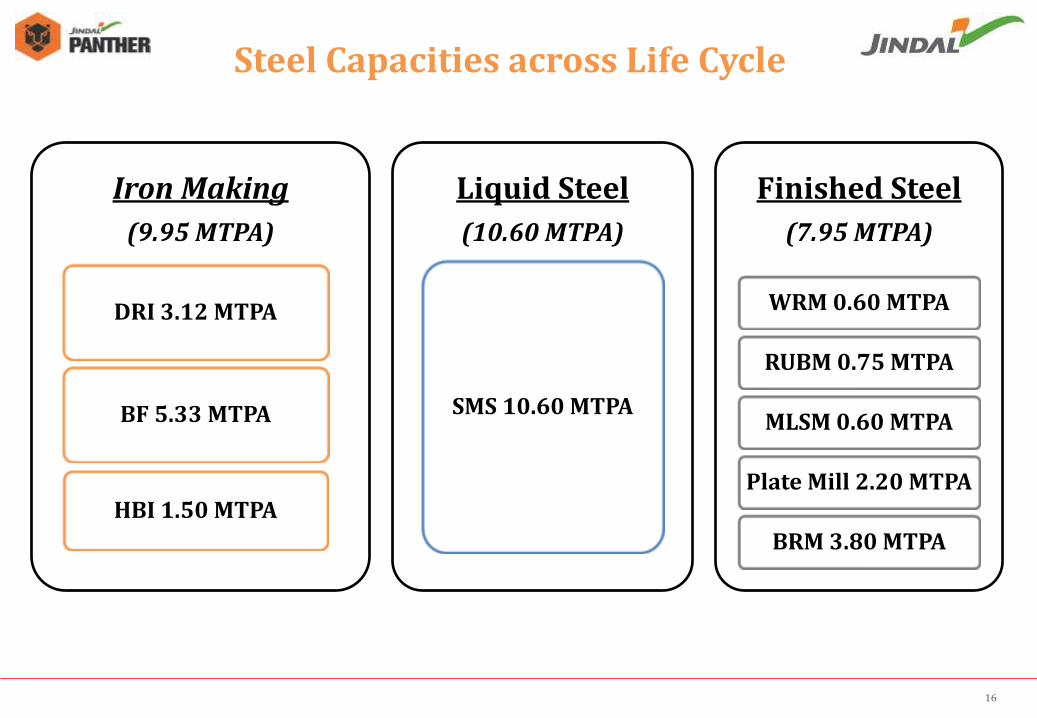
Iron Making
(9.95 MTPA)
BF 5.33 MTPA
DRI 3.12 MTPA
HBI 1.50 MTPA
Liquid Steel
(10.60 MTPA)
SMS 10.60 MTPA
Finished Steel
(7.95 MTPA)
WRM 0.60 MTPA
RUBM 0.75 MTPA
MLSM 0.60 MTPA
Plate Mill 2.20 MTPA
BRM 3.80 MTPA
Steel Capacities across Life Cycle
16
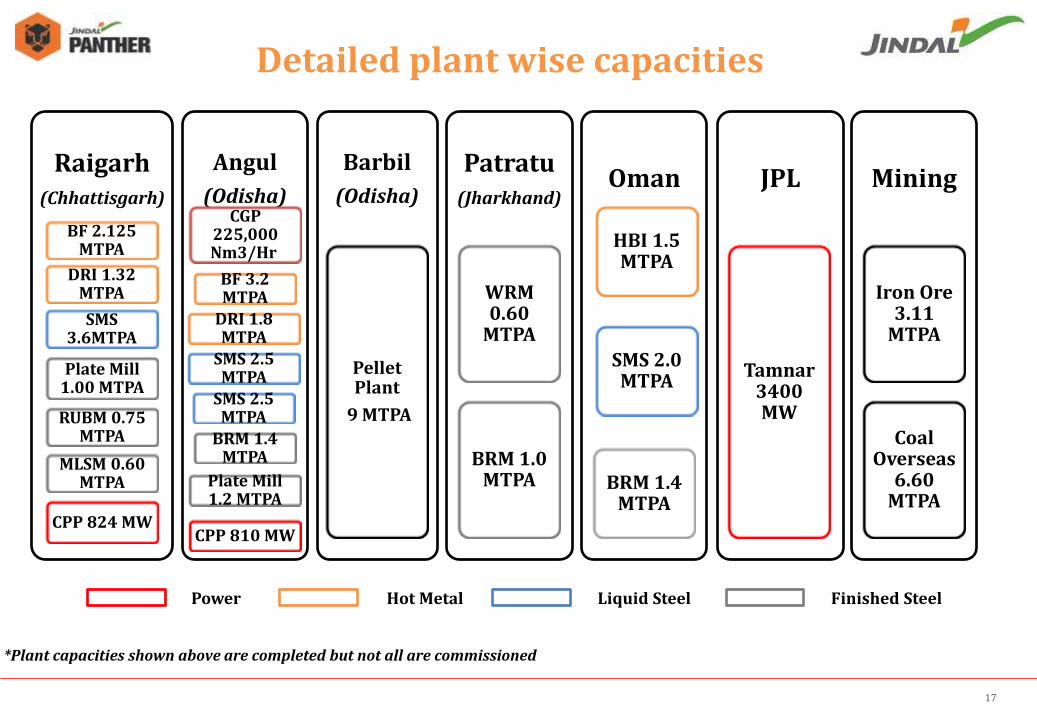
Capacity in deail
Raigarh (Chhattisgarh)
SMS 3.6MTPA
BF 2.125 MTPA
DRI 1.32 MTPA
Plate Mill 1.00 MTPA
RUBM 0.75 MTPA
MLSM 0.60 MTPA
CPP 824 MW
Angul
(Odisha)
SMS 2.5 MTPA
SMS 2.5 MTPA
DRI 1.8 MTPA
BF 3.2 MTPA
CGP 225,000 Nm3/Hr
Plate Mill 1.2 MTPA
BRM 1.4 MTPA
CPP 810 MW
Barbil
(Odisha)
Pellet Plant
9 MTPA
Patratu (Jharkhand)
WRM 0.60
MTPA
BRM 1.0 MTPA
Oman
SMS 2.0 MTPA
HBI 1.5 MTPA
BRM 1.4 MTPA
JPL
Tamnar 3400 MW
Mining
Iron Ore 3.11
MTPA
Coal Overseas
6.60 MTPA
Detailed plant wise capacities
Power Hot Metal Liquid Steel Finished Steel
*Plant capacities shown above are completed but not all are commissioned
17
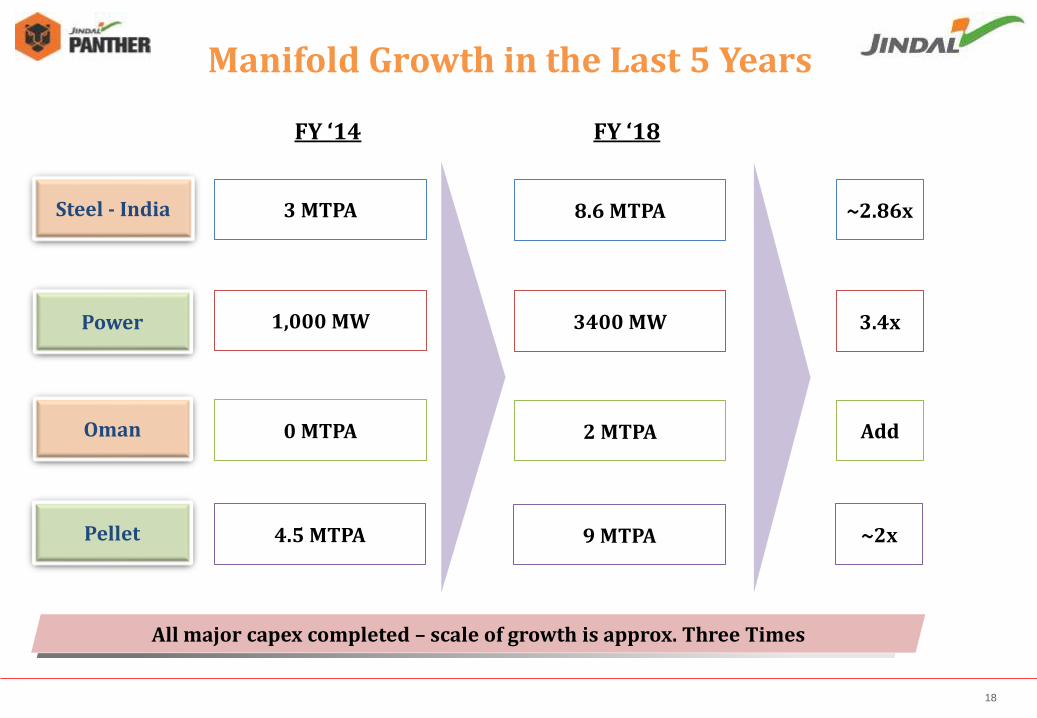
FY ‘14 FY ‘18
Steel - India 3 MTPA 8.6 MTPA
Power 1,000 MW 3400 MW
Oman
~2.86x
3.4x
0 MTPA 2 MTPA Add
Pellet 4.5 MTPA 9 MTPA ~2x
All major capex completed – scale of growth is approx. Three Times
Manifold Growth in the Last 5 Years
18
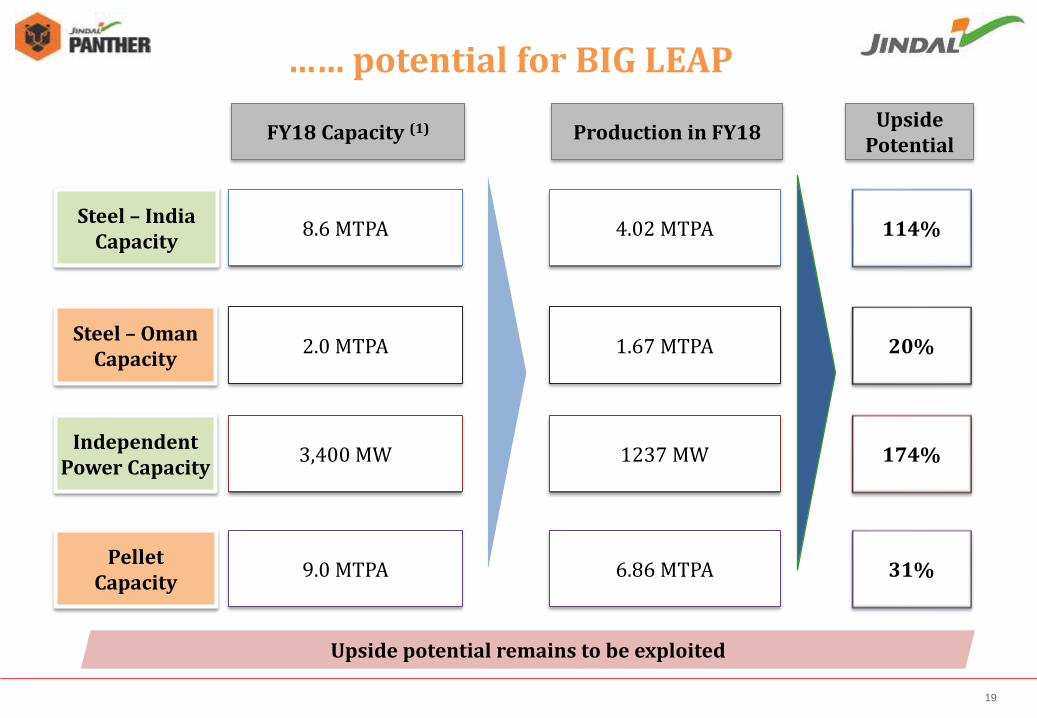
FY18 Capacity (1) Production in FY18 Upside
Potential
Steel – India Capacity
8.6 MTPA 4.02 MTPA 114%
Independent Power Capacity
3,400 MW 1237 MW 174%
Steel – Oman Capacity
2.0 MTPA 1.67 MTPA 20%
Pellet Capacity
9.0 MTPA 6.86 MTPA 31%
Upside potential remains to be exploited
…… potential for BIG LEAP
19
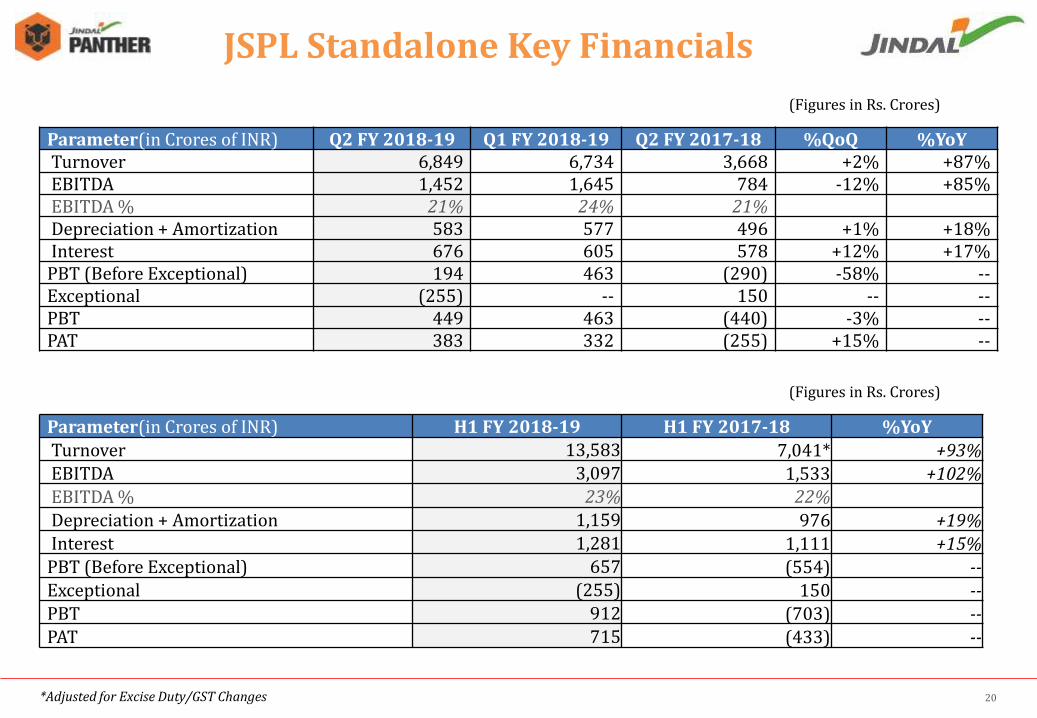
(Figures in Rs. Crores)
20
JSPL Standalone Key Financials
Parameter(in Crores of INR) Q2 FY 2018-19 Q1 FY 2018-19 Q2 FY 2017-18 %QoQ %YoY Turnover 6,849 6,734 3,668 +2% +87% EBITDA 1,452 1,645 784 -12% +85% EBITDA % 21% 24% 21% Depreciation + Amortization 583 577 496 +1% +18% Interest 676 605 578 +12% +17% PBT (Before Exceptional) 194 463 (290) -58% -- Exceptional (255) -- 150 -- -- PBT 449 463 (440) -3% -- PAT 383 332 (255) +15% --
*Adjusted for Excise Duty/GST Changes
Parameter(in Crores of INR) H1 FY 2018-19 H1 FY 2017-18 %YoY
Turnover 13,583 7,041* +93% EBITDA 3,097 1,533 +102% EBITDA % 23% 22% Depreciation + Amortization 1,159 976 +19% Interest 1,281 1,111 +15% PBT (Before Exceptional) 657 (554) -- Exceptional (255) 150 -- PBT 912 (703) -- PAT 715 (433) --
(Figures in Rs. Crores)
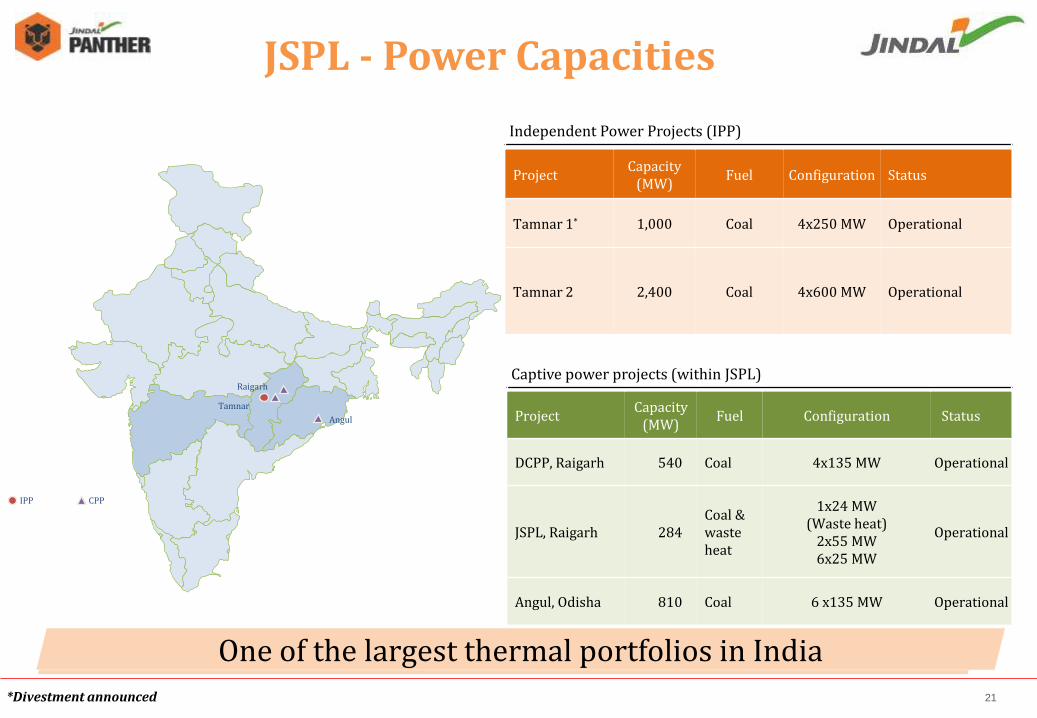
Angul
Tamnar
Raigarh Captive power projects (within JSPL)
Project Capacity
(MW) Fuel Configuration Status
DCPP, Raigarh 540 Coal 4x135 MW Operational
JSPL, Raigarh 284 Coal & waste heat
1x24 MW (Waste heat)
2x55 MW 6x25 MW
Operational
Angul, Odisha 810 Coal 6 x135 MW Operational
Independent Power Projects (IPP)
Project Capacity
(MW) Fuel Configuration Status
Tamnar 1* 1,000 Coal 4x250 MW Operational
Tamnar 2 2,400 Coal 4x600 MW Operational
IPP CPP
One of the largest thermal portfolios in India
JSPL - Power Capacities
*Divestment announced 21
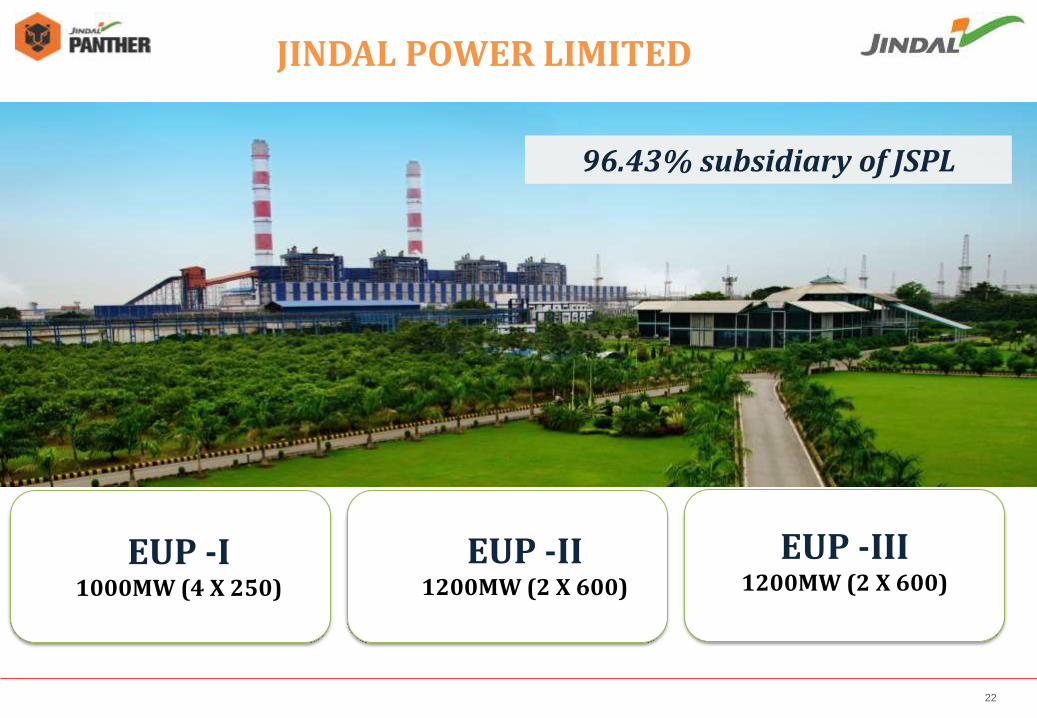
96.43% subsidiary of JSPL
JINDAL POWER LIMITED
EUP -I 1000MW (4 X 250)
EUP -II 1200MW (2 X 600)
EUP -III 1200MW (2 X 600)
22
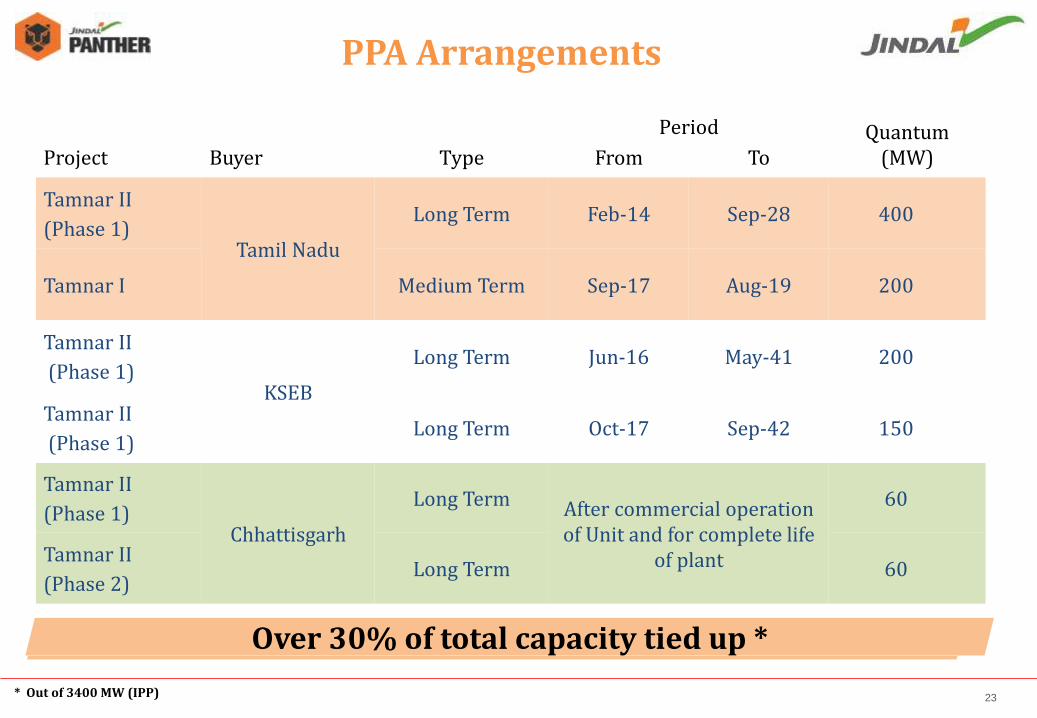
Project Buyer Type
Period Quantum (MW) From To
Tamnar II
(Phase 1) Tamil Nadu
Long Term Feb-14 Sep-28 400
Tamnar I Medium Term Sep-17 Aug-19 200
Tamnar II
(Phase 1) KSEB
Long Term Jun-16 May-41 200
Tamnar II
(Phase 1) Long Term Oct-17 Sep-42 150
Tamnar II
(Phase 1) Chhattisgarh
Long Term After commercial operation of Unit and for complete life
of plant
60
Tamnar II
(Phase 2) Long Term 60
PPA Arrangements
Over 30% of total capacity tied up *
* Out of 3400 MW (IPP) 23

Tamnar-I, 1,000 MW (EUP I)
Coal sourced through – market purchase and e-auction
Bilateral/short term/ exchange
TNEB – 200 MW
Open access available
Tamnar-II - 1,200 MW (EUP II)
Long term linkage from Mahanadi Coal Limited (MCL) and South Eastern Coalfields Limited (SECL)
TNEB – 400MW
CSEB – 60MW
KSEB – 200MW
KSEB – 150MW
Open access available
Tamnar-II - 1,200 MW (EUP III)
Coal sourced through – market purchase and e-auction
CSEB – 60MW
Open access available
FSA
PPA
Evacuation
Raw materials, transmission & PPAs in place for achieving higher PLF
Key Contractual Arrangements for JPL
24
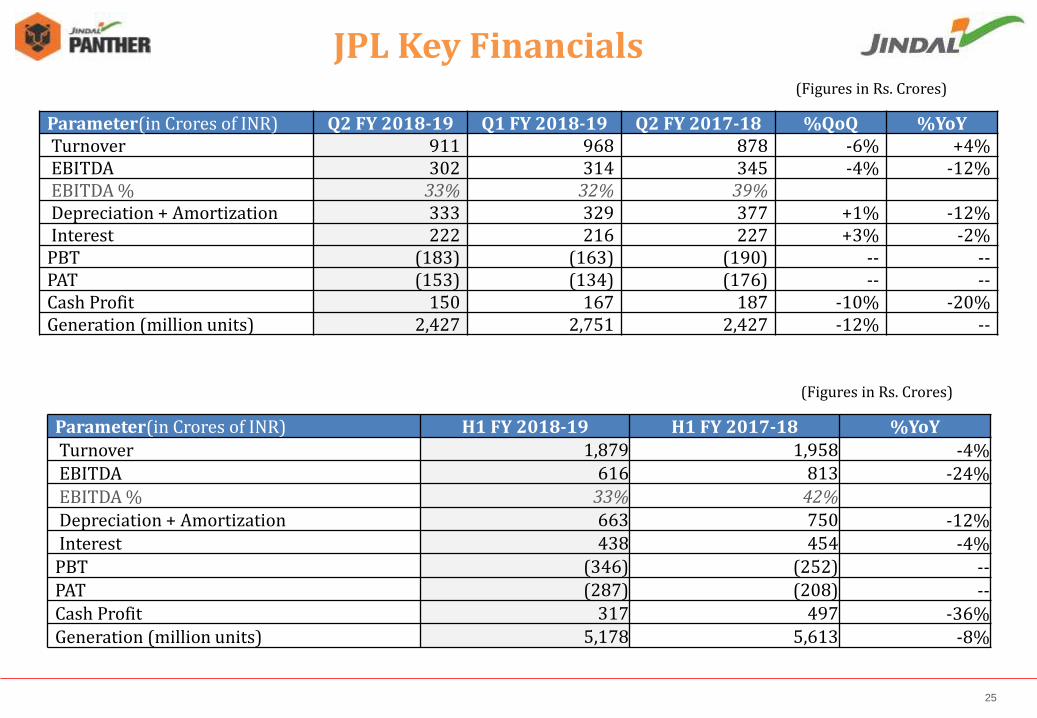
(Figures in Rs. Crores)
25
JPL Key Financials
Parameter(in Crores of INR) Q2 FY 2018-19 Q1 FY 2018-19 Q2 FY 2017-18 %QoQ %YoY Turnover 911 968 878 -6% +4% EBITDA 302 314 345 -4% -12% EBITDA % 33% 32% 39% Depreciation + Amortization 333 329 377 +1% -12% Interest 222 216 227 +3% -2% PBT (183) (163) (190) -- -- PAT (153) (134) (176) -- -- Cash Profit 150 167 187 -10% -20% Generation (million units) 2,427 2,751 2,427 -12% --
Parameter(in Crores of INR) H1 FY 2018-19 H1 FY 2017-18 %YoY
Turnover 1,879 1,958 -4% EBITDA 616 813 -24% EBITDA % 33% 42%
Depreciation + Amortization 663 750 -12% Interest 438 454 -4% PBT (346) (252) -- PAT (287) (208) -- Cash Profit 317 497 -36% Generation (million units) 5,178 5,613 -8%
(Figures in Rs. Crores)
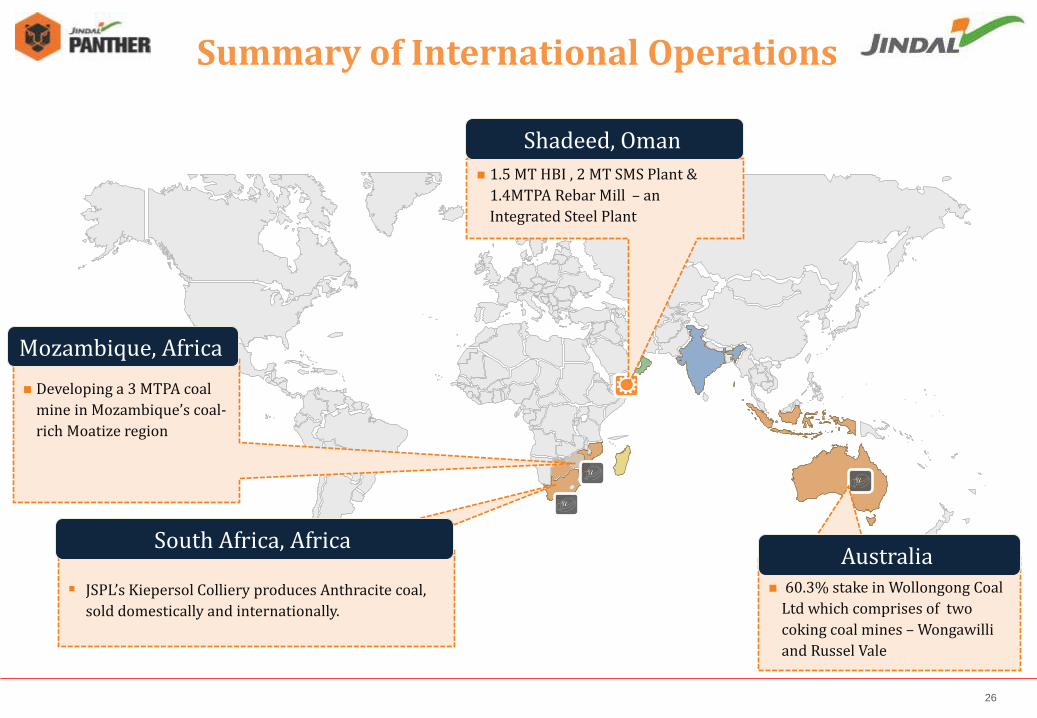
Developing a 3 MTPA coal
mine in Mozambique’s coal-
rich Moatize region
Mozambique, Africa
JSPL’s Kiepersol Colliery produces Anthracite coal,
sold domestically and internationally.
South Africa, Africa
60.3% stake in Wollongong Coal
Ltd which comprises of two
coking coal mines – Wongawilli
and Russel Vale
Australia
1.5 MT HBI , 2 MT SMS Plant &
1.4MTPA Rebar Mill – an
Integrated Steel Plant
Shadeed, Oman
Summary of International Operations
26
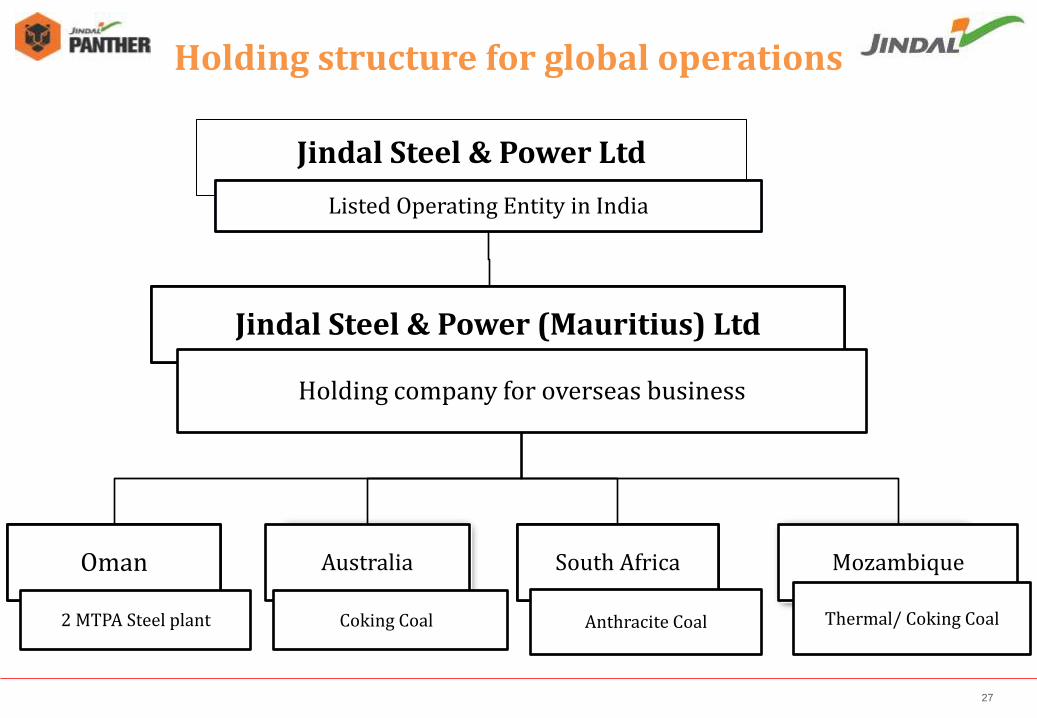
Oman
Holding structure for global operations
Jindal Steel & Power Ltd
Listed Operating Entity in India
Australia
Coking Coal
South Africa
Anthracite Coal
Mozambique
Thermal/ Coking Coal
Jindal Steel & Power (Mauritius) Ltd
Holding company for overseas business
2 MTPA Steel plant
27

28 - -
(Figures in Rs. Crores)
JSPL Consolidated Key Financials
Parameter(in Crores of INR) Q2 FY 2018-19 Q1 FY 2018-19 Q2 FY 2017-18 %QoQ %YoY
Turnover 9,982 9,665 6,123 +3% +63%
EBITDA 2,207 2,277 1,373 -3% +61%
EBITDA % 22% 24% 22%
Depreciation + Amortization 1,031 1,040 998 -1% +3%
Interest 1,086 973 927 +12% +17%
PBT (Before Exceptional) 91 264 (550) -65% --
Exceptional (255) -- 150 -- --
PBT 347 264 (699) +31% --
PAT 279 110 (499) +154% --
28 *Adjusted for Excise Duty/GST Changes
Parameter(in Crores of INR) H1 FY 2018-19 H1 FY 2017-18 %YoY
Turnover 19,648 11,792* +67% EBITDA 4,484 2,726 +64% EBITDA % 23% 23% Depreciation + Amortization 2,071 1,960 +6% Interest 2,059 1,827 +13% PBT (Before Exceptional) 355 (1,060) -- Exceptional (255) 150 -- PBT 610 (1,209) -- PAT 389 (921) --
(Figures in Rs. Crores)

INDUSTRY UPDATE
BRIEF BACKGROUND OPERATIONAL PERFORMANCE
29
Q2 FY’19
0.00
0.20
0.40
0.60
0.80
1.00
1.20
1.40
1.60
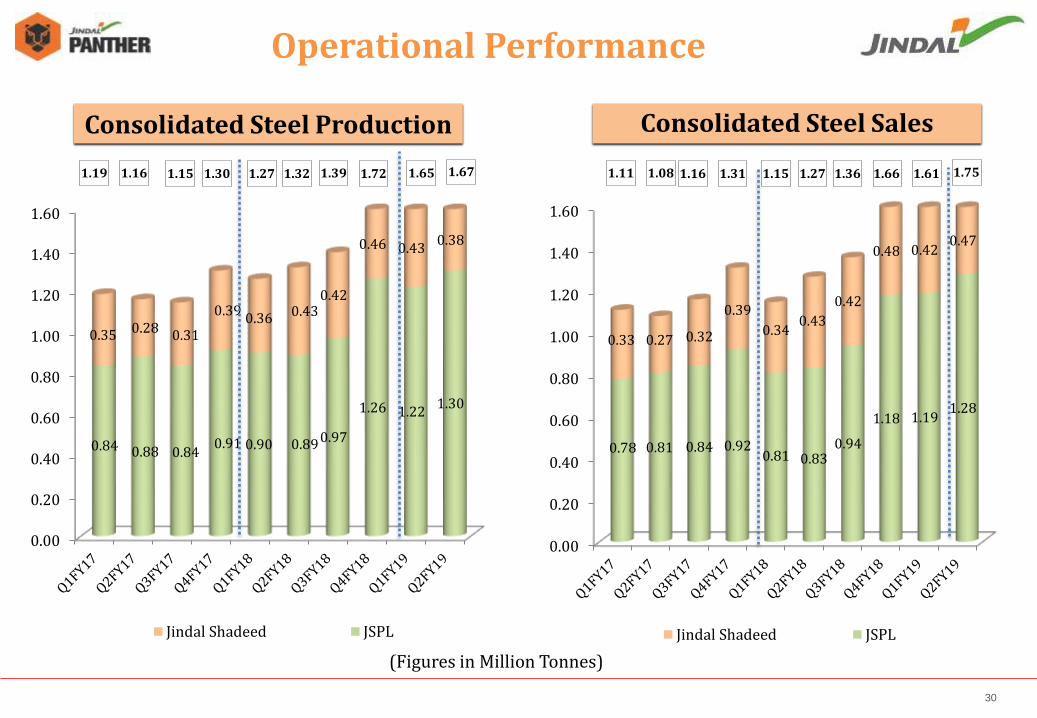
0.84 0.88 0.84 0.91 0.90 0.89 0.97
1.26 1.22 1.30
0.35 0.28 0.31
0.39 0.36 0.43
0.42
0.46 0.43 0.38
Jindal Shadeed JSPL
1.27 1.72 1.15 1.30
Consolidated Steel Production
(Figures in Million Tonnes)
1.32
Consolidated Steel Sales
0.00
0.20
0.40
0.60
0.80
1.00
1.20
1.40
1.60
0.78 0.81 0.84 0.92 0.81 0.83
0.94
1.18 1.19 1.28
0.33 0.27 0.32
0.39
0.34 0.43
0.42
0.48 0.42 0.47
Jindal Shadeed JSPL
1.15 1.61 1.16 1.31 1.27
30
1.39 1.36
Operational Performance
1.19 1.16 1.08 1.11 1.66 1.65 1.67 1.75
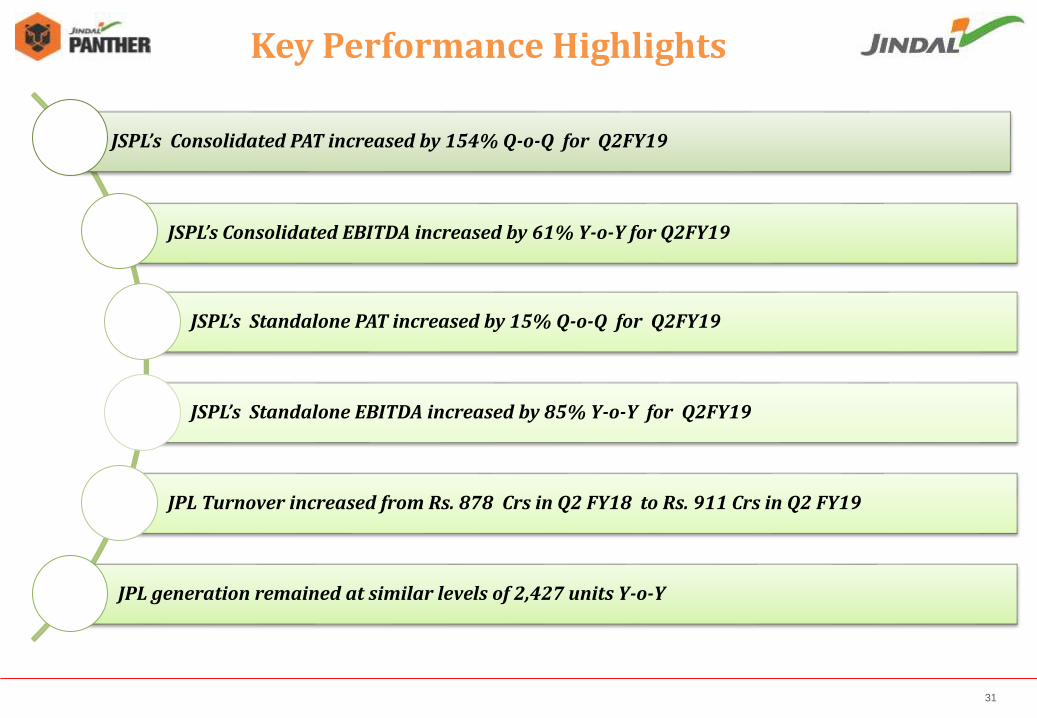
JSPL’s Consolidated PAT increased by 154% Q-o-Q for Q2FY19
JSPL’s Consolidated EBITDA increased by 61% Y-o-Y for Q2FY19
JSPL’s Standalone PAT increased by 15% Q-o-Q for Q2FY19
JSPL’s Standalone EBITDA increased by 85% Y-o-Y for Q2FY19
JPL Turnover increased from Rs. 878 Crs in Q2 FY18 to Rs. 911 Crs in Q2 FY19
JPL generation remained at similar levels of 2,427 units Y-o-Y
31
Key Performance Highlights
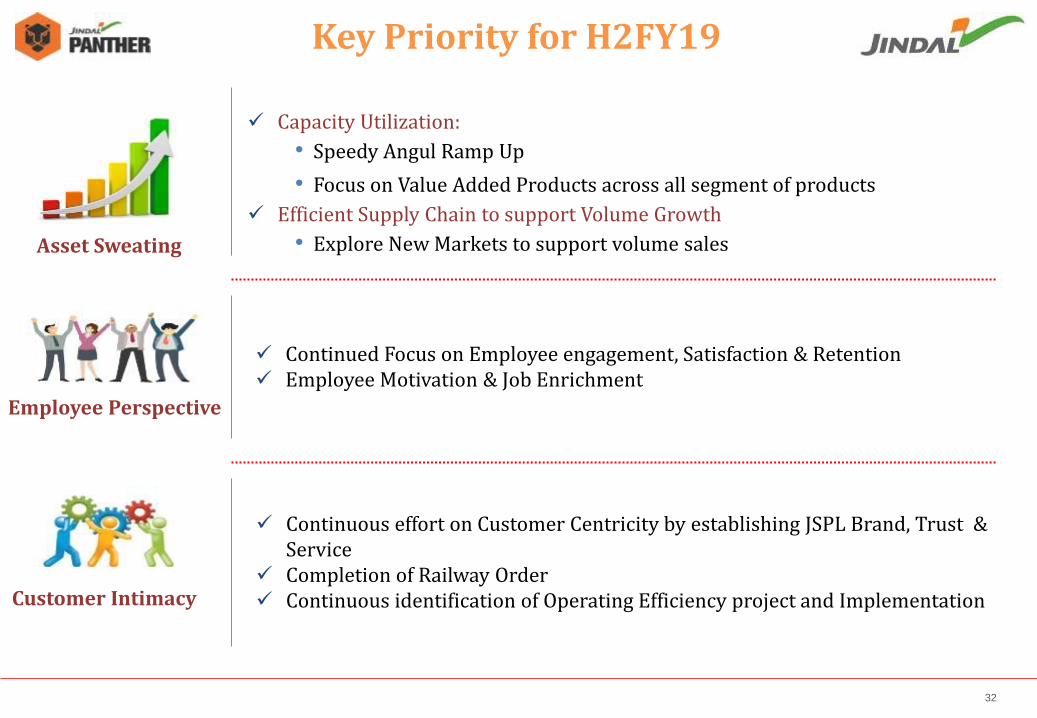
Capacity Utilization:
• Speedy Angul Ramp Up
• Focus on Value Added Products across all segment of products
Efficient Supply Chain to support Volume Growth
• Explore New Markets to support volume sales Asset Sweating
Key Priority for H2FY19
32
Employee Perspective
Customer Intimacy
Continued Focus on Employee engagement, Satisfaction & Retention Employee Motivation & Job Enrichment
Continuous effort on Customer Centricity by establishing JSPL Brand, Trust & Service
Completion of Railway Order Continuous identification of Operating Efficiency project and Implementation
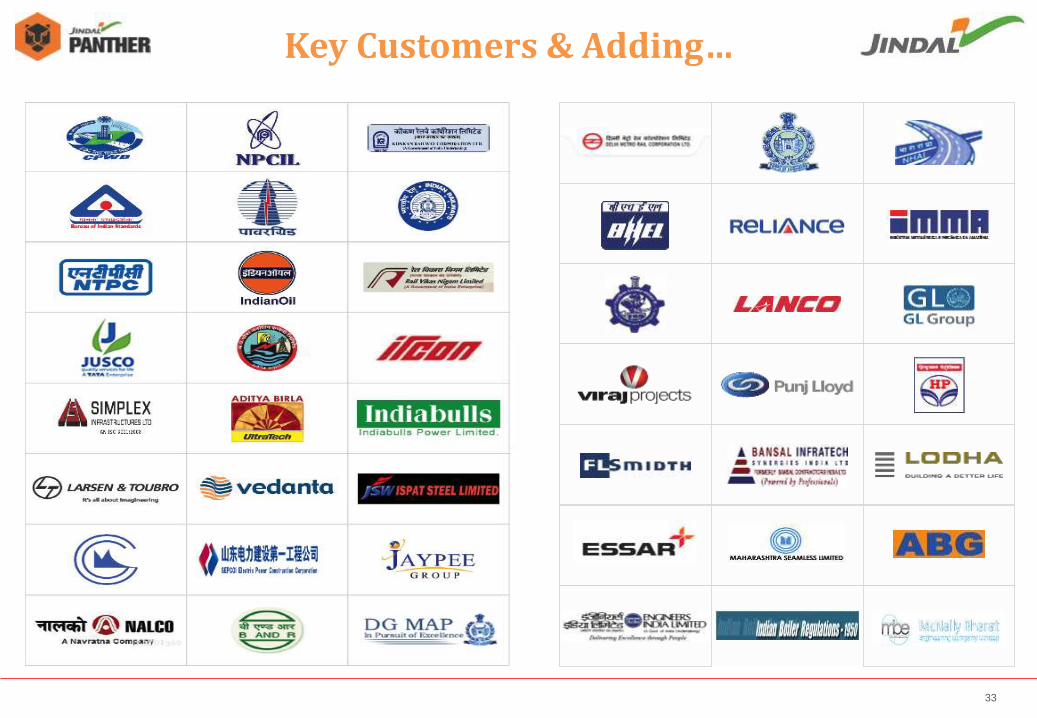
Key Customers & Adding…
33
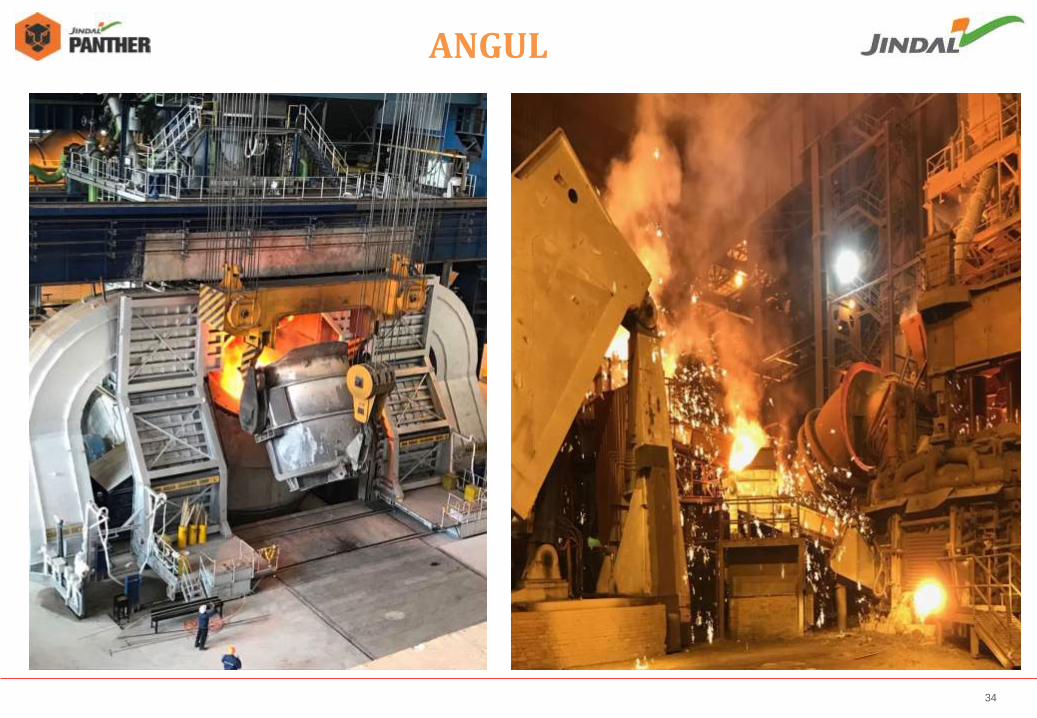
ANGUL
34

RAIGARH
35
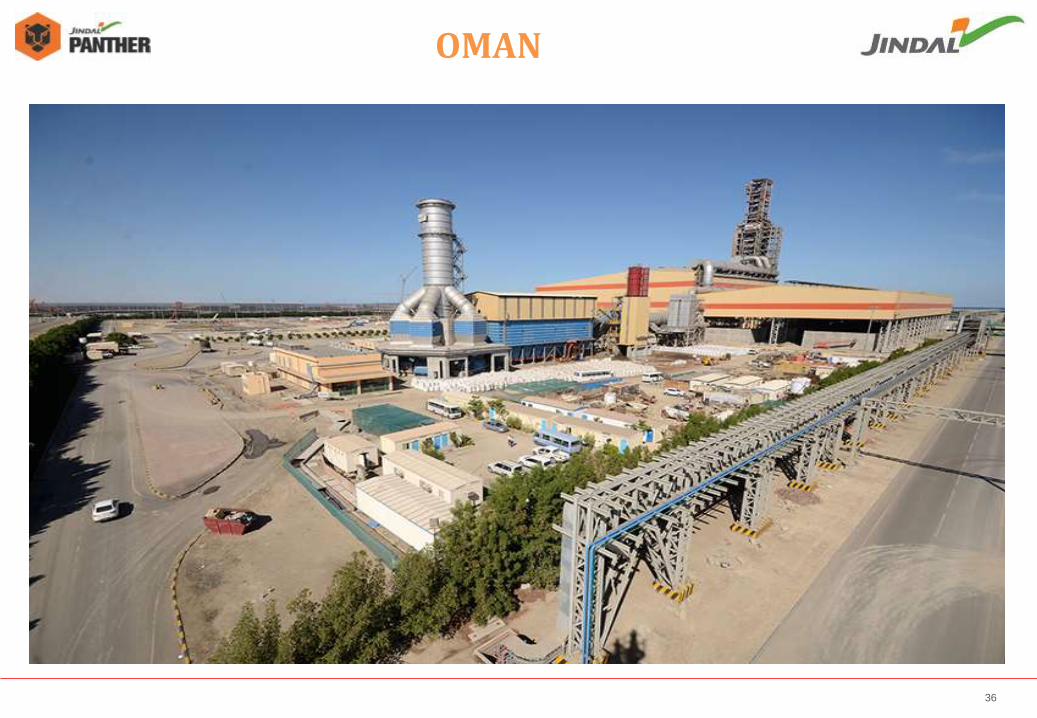
OMAN
36

For any information please contact: - Mr. Nishant Baranwal – Head, Investor Relations Tel : +91 11-41462198 Mobile:+91 8800690255 Email: - [email protected] Ms. Shweta Bagaria – Assistant Manager, Investor Relations Tel: +91-124-6612073 Mobile: +91 95995 53717 Email: [email protected]
37
THANK YOU
38