Embed Size (px)
Citation preview

1 © 2019 Experian Public
Experian AutomotiveQuarterly Briefing
Second quarter 2019 automotive market share,trends and registrations
Marty MillerSenior Automotive Industry Consultant

2 © Experian Public
Today’s presentation
What’s on the Road
Marty MillerSenior Product Manager, VIO
VIO by model year, segment, age and market share
U.S. light duty vehicles through June 30, 2019
New, Used and other market changes
Industry news and special market analysis:
1. - The Canadian vehicle market

3 © Experian Public
The right vehicles. The right customers. The right data to know the difference.
• We deliver an integrated perspective using the highest quality automotive information and market intelligence focused on these key areas:
– Automotive Credit
– Automotive Marketing
– Vehicle Market Statistics
– AutoCheck® Vehicle History
• Our success comes from delivering actionable insights and lasting partnerships with our clients
Experian AutomotiveDriving the automotive industry forward
https://www.experian.com/automotive/auto-data

4 © Experian Public
Creating unparalleled market-wide insights
The power of Experian dataYour unified source of automotive data enabling you to link insight into action
Powering innovativesolution engines that
drive results
Best-in-class data unified and enhanced
Data unification
Act
Optimization feedback
Your One Source
VehiclesLinkage &
Identity
.
Solutionengines
Market intelligence
Conquest & acquisition
Performance measurement
Audience engagement
Loyalty
Recall
Creditsolutions
Vehicle history reports
People
Market
Credit

5 © Experian Public
File One℠Credit Database
It takes 3 things to sell a vehicle...Only Experian provides all three data sources under one roof
.
Creating unparalleled market-wide insights
Vehicles
.
People
Market
Credit
North American Vehicle Database℠
Consumer View℠Marketing Database
1
2
3 Customer2
Credit3
Vehicles1

6 © Experian Public
U.S. and Canada total Vehicles in Operation = 325.4M
Light DutyPassenger Cars, Light Trucks, Vans
Cars and GVW Class 1 – 3
Medium & Heavy DutyLarge Vans, Delivery Trucks, Buses, RVs,
Cement Trucks, Semi-Tractors
GVW Class 4 - 8
Power SportsMotorcycles, All-Terrain,
Utility Task, Snowmobiles
Source: Experian Automotive VIO as of March 31, 2019 (all motorized and road registered vehicles)

7 © Experian Public
What’s on the road today?
Light Duty Vehicles
Vehicles in Operation

8 © Experian Public8 © Experian Public
*U.S. Vehicles in Operation data as of June 30, 2019 sourced from Experian Automotive, including U.S. and Puerto Rico (U.S. light duty vehicles only).1 – includes estimated annual households that relocated with the same vehicle(s)
Light duty vehicles* over the last 12 monthsChanges in U.S. vehicles in operation
Q2 2019*
Q2 2019 VIO changes
16.9NEW Vehicles
Registered
MILLION12.7Vehicles went
out of operation
MILLION41.9USED vehicles
changed owners
MILLION
Vehicles on the road
Q2 2019 Total*
278.1 MILLION
Vehicles on the road
Q2 2018 Total*
273.9MILLION 32%
Total VIOchanges1

9 © Experian Public
U.S. VIO change by Model Year (in millions)Q2 2018 to Q2 2019
Current 20Model Years88.2% of VIO
Current 25Model Years95.3% of VIO
Source: Experian Automotive VIO as of June 30, 2019 (light duty registered vehicles only)

10 © Experian Public
U.S. Summary Stats – for all light duty VIOas of Q2 2019
Source: Experian Automotive VIO as of June 30, 2019 (light duty registered vehicles only)

11 © Experian Public
U.S. VIO Top 20 segments on the road market share
Source: Experian Automotive VIO as of June 30, 2019 (light duty registered vehicles only)

12 © Experian Public
U.S. VIO by manufacturer market share
Source: Experian Automotive VIO as of June 30, 2019 (light duty registered vehicles only)
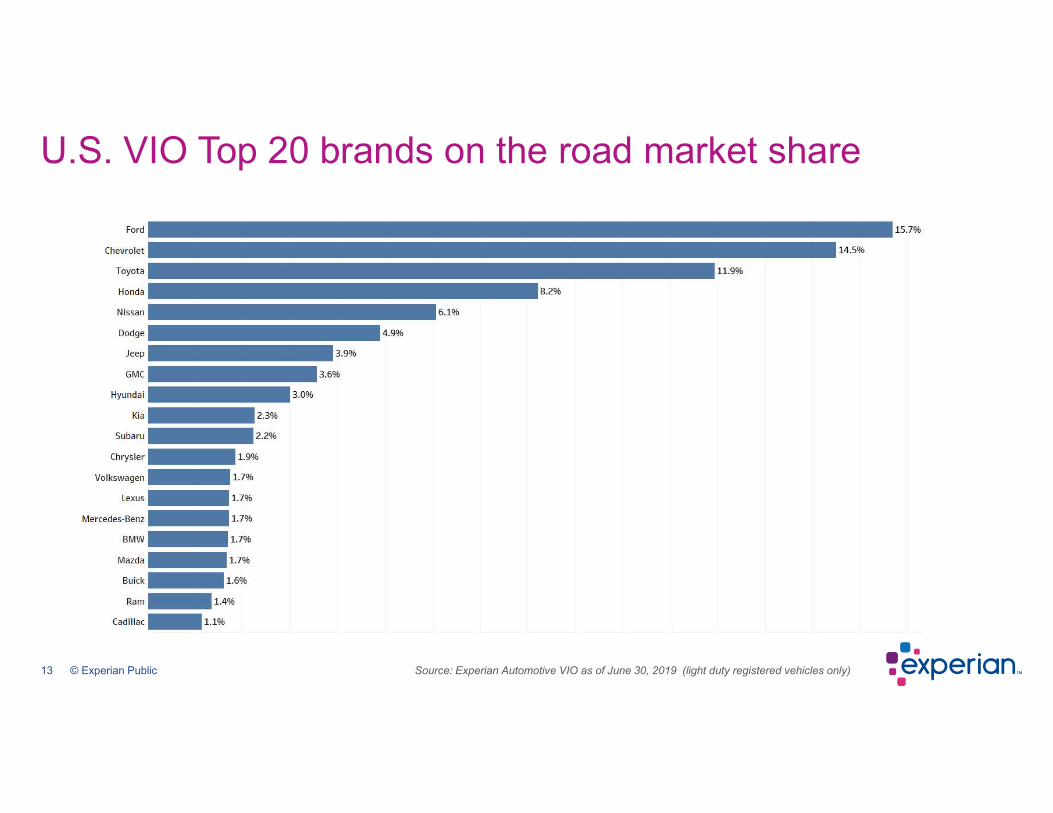
13 © Experian Public
U.S. VIO Top 20 brands on the road market share
Source: Experian Automotive VIO as of June 30, 2019 (light duty registered vehicles only)

14 © Experian Public
U.S. VIO top 20 Make/Model market share
Source: Experian Automotive VIO as of June 30, 2019 (light duty registered vehicles only)

15 © Experian Public
• 6 to 12 model year old vehicles• Aged out of general OEM manufacturer warranties for any repairs• Likely require more part replacement & services (e.g. shocks, timing belt service, engine repairs) that
may be performed by aftermarket service shops using parts from aftermarket part manufacturers• Sizing the Sweet Spot helps identify overall market potential and changes can have implications to those
that service it
The Aftermarket “Sweet Spot”
• 13 model years old & older• Less costs may be spent to service them due to their age and vehicle value
“Post Sweet Spot” vehicles
• 5 model years old & newer; many covered by the vehicle’s manufacturer warranty• Identifies models coming into the Sweet Spot
“Pre Sweet Spot” vehicles
The aftermarket “Sweet Spot” overview“Post” and “Pre” Sweet Spot defined

16 © Experian Public
U.S. trend of total VIO compared to sweet spot volumesVIO by model year (in millions)
30.4% vehicles within “Sweet Spot”
(MY2008 – 2014)
Pre-SweetSpot
Post-SweetSpot
Total VIO vs Sweet Spot total
Source: Experian Automotive VIO as of June 30, 2019 (light duty registered vehicles only)

17 © Experian Public
Sweet Spot market share opportunities by state
Source: Experian Automotive VIO as of June 30, 2019 (light duty registered vehicles only)

18 © Experian Public
The electric market by ZIP Code
Source: Experian Automotive VIO as of June 30, 2019 (light duty registered vehicles only)

19 © Experian Public
Volumes of New vs Used and Domestic vs Import
over the last 12 months
Market analysis through the 2nd quarter (January through June)
Electric vehicle market summary
New and Used Vehicles

20 © Experian Public
New and Used vehicle registrations through the 2nd quarter
Source: Experian Automotive as of January through June of each year (light duty vehicles only)
New Registrations Used Registrations

21 © Experian Public
New vehicle registrations through the 1st quarterBy manufacturer
Source: Experian Automotive as of January through June of each year (light duty vehicles only)

22 © Experian Public
New vehicle registrations through the 2nd quarterTop 25 brands of 2019
Source: Experian Automotive as of January through June of each year (light duty vehicles only)

23 © Experian Public
New vehicle registrations through the 1st quarterBy top 20 make/models
Source: Experian Automotive as of January through June of each year (light duty vehicles only)

24 © Experian Public
New vehicle registrations through the 2nd quarterBy body style type
Source: Experian Automotive as of January through June of each year (light duty vehicles only)

25 © Experian Public
New vehicle registrations through the 2nd quarterBy generation
Source: Experian Automotive as of January through June of each year (light duty vehicles only)

26 © Experian Public
The electric market by Make – New registrationsJanuary – June 2019
Source: Experian Automotive as of January through June of each year (light duty vehicles only)

27 © Experian Public
Canadian vehicle market
Automotive Analysis
26.2 million
Source: Experian Automotive VIO as of June 30, 2019 (light duty registered vehicles only)
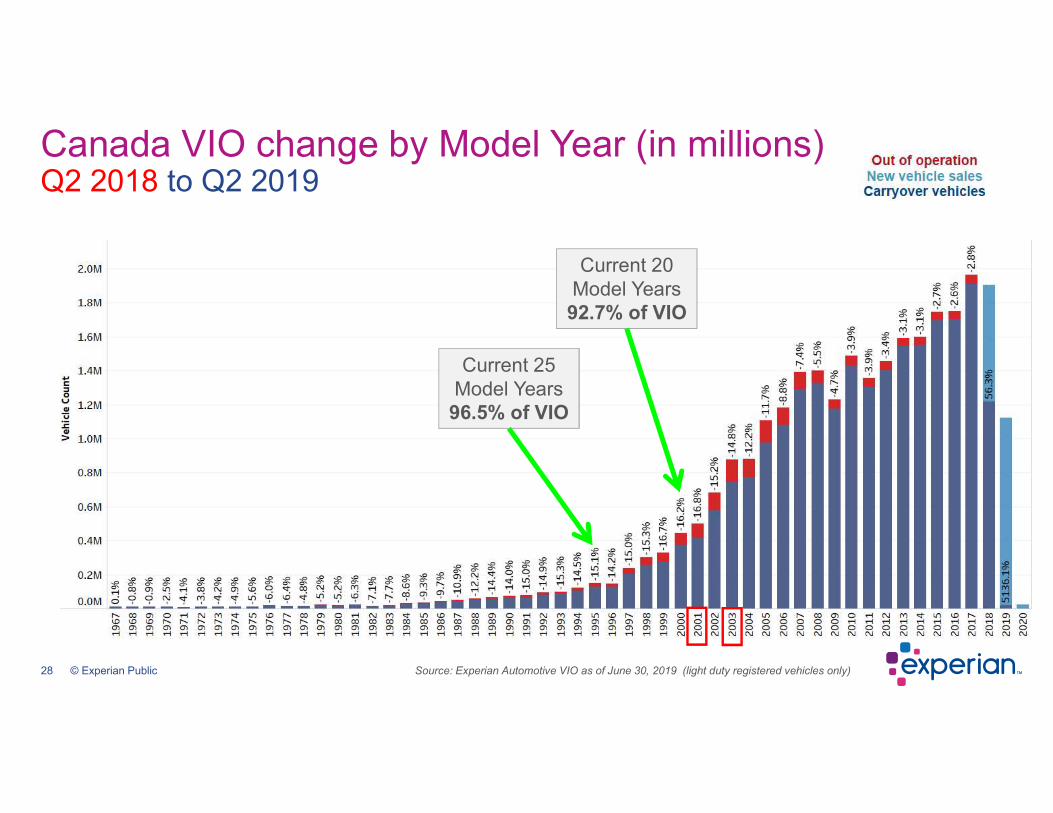
28 © Experian Public
Canada VIO change by Model Year (in millions)Q2 2018 to Q2 2019
Current 20Model Years92.7% of VIO
Current 25Model Years96.5% of VIO
Source: Experian Automotive VIO as of June 30, 2019 (light duty registered vehicles only)

29 © Experian Public
Canada Summary Stats - for all light duty VIOas of Q2 2019
Source: Experian Automotive VIO as of June 30, 2019 (light duty registered vehicles only)

30 © Experian Public
Canada VIO Top 20 segments on the road market share
Source: Experian Automotive VIO as of June 30, 2019 (light duty registered vehicles only)

31 © Experian Public
Canada VIO by manufacturer market share
Source: Experian Automotive VIO as of June 30, 2019 (light duty registered vehicles only)

32 © Experian Public
Canada VIO Top 20 brands on the road market share
Source: Experian Automotive VIO as of June 30, 2019 (light duty registered vehicles only)

33 © Experian Public
Canada VIO top 20 Make/Model market share
Source: Experian Automotive VIO as of June 30, 2019 (light duty registered vehicles only)
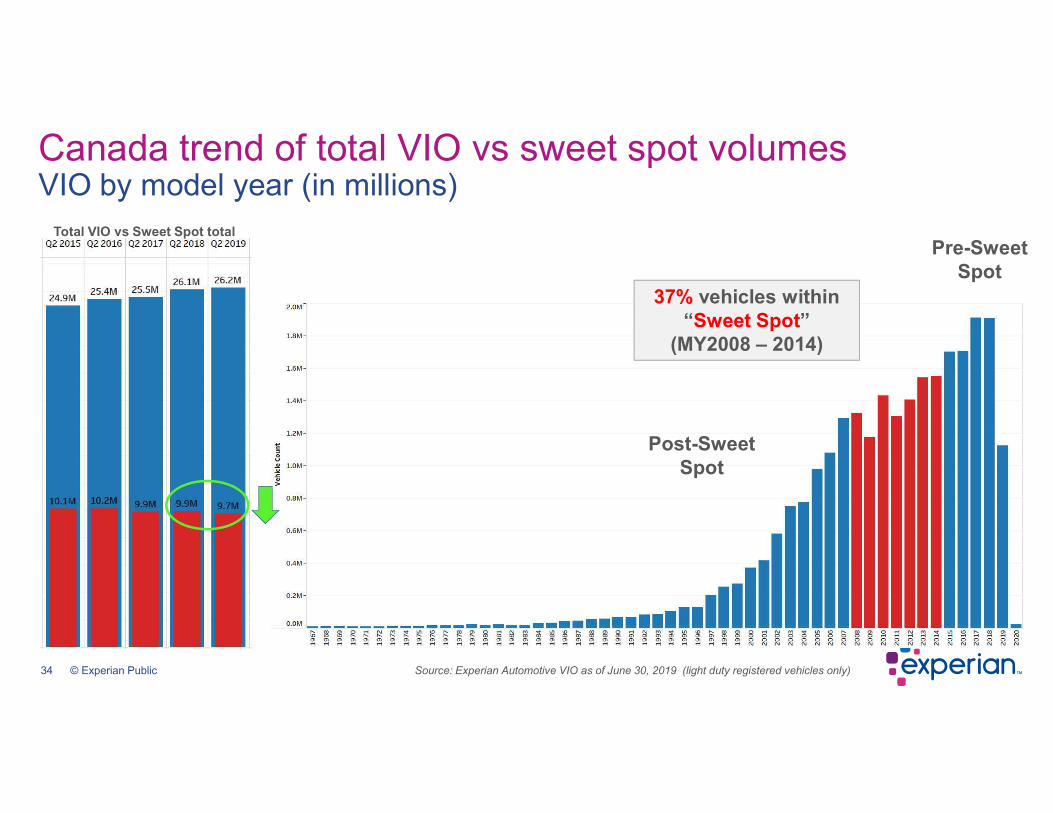
34 © Experian Public
Canada trend of total VIO vs sweet spot volumesVIO by model year (in millions)
37% vehicles within “Sweet Spot”
(MY2008 – 2014)
Pre-SweetSpot
Post-SweetSpot
Total VIO vs Sweet Spot total
Source: Experian Automotive VIO as of June 30, 2019 (light duty registered vehicles only)
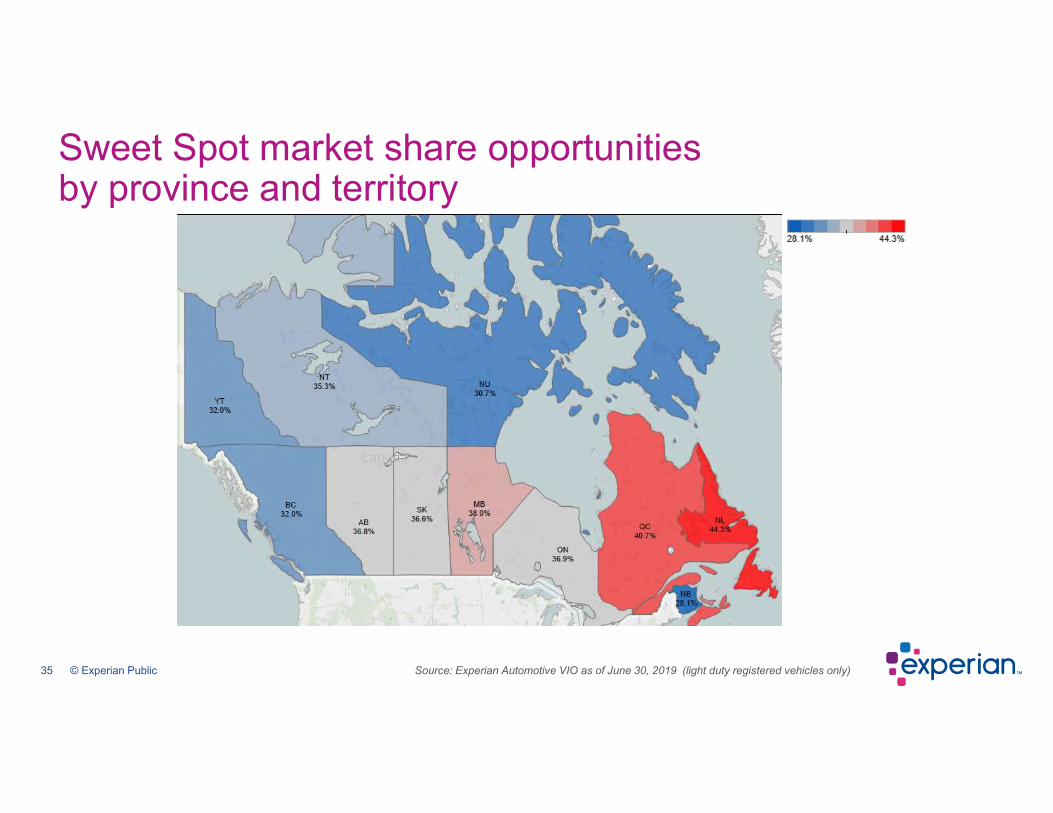
35 © Experian Public
Sweet Spot market share opportunities by province and territory
Source: Experian Automotive VIO as of June 30, 2019 (light duty registered vehicles only)

36 © Experian Public
The electric market by FSA Code
Source: Experian Automotive VIO as of June 30, 2019 (light duty registered vehicles only)

37 © Experian Public
• Total light duty VIO continues to grow to 278.1 million in the U.S. market and 26.2 million in Canada
• The Aftermarket Sweet Spot has started growing in the U.S. as we predicted a few years ago, though the Sweet Spot has declined slightly in Canada.
• U.S. New and Used registrations have decreased slightly though still remain strong as New vehicle registrations has dipped below 17 million for the first time in many years.
• Cross-overs registrations within the U.S. of new vehicles continue to increase in sales over prior time periods, and dominate with nearly half of all new vehicle registrations.
• The electric vehicle market is growing as registrations increased over the first half of 2019.
• Canada, while similar in land size to the U.S., is 9.4% in vehicle market size compared to the U.S., and they also are different in the types of vehicles they drive.
– More imports than domestic brands
– Tend to own the types of vehicles that are built in Canada
Summary

38 © Experian Public
Today’s presentation
Follow us on Twitter#EXPAuto@Experian_Auto
Connect with us on LinkedInExperian Automotive

39 © Experian Public
Thank youExperian Automotive is prepared to meet your needs with an integrated solution statically designed to drive your business forward

©2019 Experian Information Solutions, Inc. All rights reserved. Experian and the Experian marks used herein are trademarks or registered trademarks of Experian Information Solutions, Inc. Other product and company names mentioned herein are the trademarks of their respective owners. No part of this copyrighted work may be reproduced, modified, or distributed in any form or manner without the prior written permission of Experian. Experian Public