Embed Size (px)
Citation preview

Q2 2016 Management’s Discussion and Analysis August 9, 2016
1 | SECOND QUARTER 2016 MD&A
TABLE OF CONTENTS
Second Quarter 2016 Overview ...................................... 2
Outlook ............................................................................ 3
Risks ................................................................................ 4
About Stuart Olson Inc. ................................................... 5
Results of Operations ...................................................... 7
Consolidated Results ....................................................... 7
Results of Operations by Business Group .................... 11
Liquidity .......................................................................... 18
Capital Resources ......................................................... 20
Dividends ...................................................................... 21
Off-Balance Sheet Arrangements ................................. 21
Related Party Transactions ........................................... 21
Quarterly Financial Information ..................................... 22
Critical Accounting Estimates ....................................... 23
Changes in Accounting Policies .................................... 23
Financial Instruments .................................................... 24
Non-IFRS Measures ..................................................... 25
Forward-Looking Information ........................................ 29
The following Management’s Discussion and Analysis (“MD&A”) of the operating performance and financial condition of Stuart Olson Inc. (“Stuart
Olson”, the “Company”, “we”, “us”, or “our”) for the three and six months ended June 30, 2016, dated August 9, 2016, should be read in conjunction
with the June 30, 2016 Condensed Consolidated Interim Financial Statements and related notes thereto, the December 31, 2015 Audited Consolidated
Annual Financial Statements and related notes thereto, and the December 31, 2015 MD&A. Additional information relating to Stuart Olson is available
under the Company’s SEDAR profile at www.sedar.com and on our website at www.stuartolson.com. Unless otherwise specified all amounts are
expressed in Canadian dollars. The information presented in this MD&A, including information relating to comparative periods in 2015 and 2014, is
presented in accordance with International Financial Reporting Standards (IFRS) unless otherwise noted.
Certain measures in this MD&A do not have any standardized meaning as prescribed by IFRS and, therefore, are considered non-IFRS measures.
These non-IFRS measures are commonly used in the construction industry, and by management of Stuart Olson Inc. as alternative methods for
assessing operating results and to provide a consistent basis of comparison between periods. These measures are not in accordance with IFRS, and
do not have any standardized meaning. Therefore, the non-IFRS measures in this MD&A are unlikely to be comparable to similar measures used by
other entities. Non-IFRS measures include: contract income margin; work-in-hand; backlog; active backlog; book-to-bill ratio; working capital; adjusted
free cash flow; adjusted free cash flow (FCF) per share; adjusted earnings before interest, taxes, depreciation and amortization (adjusted EBITDA);
adjusted EBITDA margin; earnings before tax (EBT); long-term indebtedness; indebtedness to capitalization; and net long term indebtedness to
adjusted EBITDA. Further information regarding these measures can be found in the Non-IFRS Measures section of this MD&A.
We encourage readers to read the section entitled “Forward-Looking Information” at the end of this document.

2 | SECOND QUARTER 2016 MD&A
SECOND QUARTER 2016 OVERVIEW
• We ended Q2 2016 with a strong $2.1 billion backlog that includes a diverse mix of public, private and industrial
projects from Ontario to British Columbia. The backlog is predominantly made up of low-risk contract arrangements.
• Revenue for the second quarter was $227.2 million, compared to $303.7 million in the second quarter of 2015. The
year-over-year change reflects the direct and indirect impacts of wildfires in Northern Alberta, which significantly
disrupted Industrial Group operations in the second quarter and negatively impacted results. Revenue results for the
Buildings Group also reflect delays in the rollout of new infrastructure opportunities, as well as delays in the
commencement of new projects currently in pre-construction.
• To ensure we operate efficiently in a challenging economic environment, we continued to assess our cost structure
in the quarter, with a focus on reducing overhead. Restructuring initiatives in Q2, together with year-to-date initiatives,
are designed to deliver permanent expense reductions going forward. Initiatives undertaken in the second quarter
included the planned sublease, termination and consolidation of leased office spaces within all three operating
groups and a realignment of the operating structure within the Industrial Group and the Commercial Systems Group.
Restructuring and impairment charges of $5.4 million related to these initiatives were recognized during the quarter.
We expect to continue to aggressively match our cost structure to the activity of the business over the second half
of 2016 and expect those initiatives to further reduce expenses in future periods. Contract income margin was 9.5%,
down slightly from 10.4% last year. While prior-year contract income included the benefit of $2.5 million in positive
intersegment eliminations, Q2 2016 results included both the negative impact of the Northern Alberta wildfires and
the recognition of restructuring costs.
• We generated second quarter adjusted EBITDA of $7.2 million (adjusted EBITDA margin of 3.2%), compared to
$12.9 million (adjusted EBITDA margin of 4.2%) in Q2 2015. Our adjusted EBITDA results reflect lower contract
income, partially offset by a reduction in core administrative costs (before depreciation and restructuring costs) and
lower share-based compensation expense.
• We reported a second quarter net loss of $3.4 million (diluted loss per share of $0.13), compared to net earnings of
$1.7 million (diluted earnings per share of $0.06) in Q2 2015. The decrease in net earnings primarily reflects the
lower adjusted EBITDA and the recognition of restructuring costs, partially offset by reduced financing costs,
depreciation and tax expense. Excluding the after-tax impact of the $5.4 million in restructuring and impairment
charges, we would have reported a second quarter net profit of $0.5 million (diluted earnings per share of $0.02).
• We ended the second quarter with a cash balance of $34.1 million and additional borrowing capacity of
approximately $59.5 million at June 30, 2016.
• On July 13, 2016, we successfully amended our revolving credit facility (“Revolver”), extending the maturity by one
year to 2021 and negotiating improved terms. This amendment maintains our maximum borrowing capacity of
$175.0 million.
• On August 9, 2016, our Board of Directors (“Board”) declared a quarterly common share dividend of $0.12 per share.
The dividend is designated as an eligible dividend under the Income Tax Act (Canada) and is payable October 13,
2016 to shareholders of record on September 30, 2016.
$322.9 $303.7
$227.2
Q2 2014 Q2 2015 Q2 2016
Revenue ($ millions)
$9.8
$12.9
$7.2
Q2 2014 Q2 2015 Q2 2016
Adjusted EBITDA($ millions)
$-
$0.06
$(0.13)
Q2 2014 Q2 2015 Q2 2016
Diluted EPS ($ per share)
$0.17
$0.41
$(0.20)
Q2 2014 Q2 2015 Q2 2016
Adjusted FCF ($ per share)

3 | SECOND QUARTER 2016 MD&A
OUTLOOK
We anticipate that 2016 consolidated revenue will be lower than the level achieved in 2015. Our revenue outlook reflects
the negative impact of the Northern Alberta wildfires on Industrial Group activity in the oil sands, as well as the
continuation of challenging market conditions in Alberta related to the “lower-for-longer” oil price environment. These
impacts are tempered by our strong $2.1 billion backlog which provides line of sight to activity levels for 2016 and into
2017, and reflects our access to many different segments and geographic markets within the Canadian construction
market. Both the Buildings Group and Commercial Systems Group are executing backlogs dominated by public projects
across multiple provinces. The Industrial Group also continues to successfully pursue new business opportunities both
within and outside of Alberta.
Adjusted EBITDA and adjusted EBITDA margin are expected to decline in 2016, reflecting the impact of the wildfires on
our Industrial Group business, the continuation of challenging economic conditions in the Alberta market as a whole,
and an increased proportion of lower-risk, and correspondingly lower-margin, maintenance, repair and operations
(“MRO”) projects within our Industrial Group. Adjusted EBITDA results in the second half of 2016 are also expected to
include the reversal of intercompany eliminations that favourably impacted 2015 results.
Industrial Group Outlook
We expect 2016 revenue for the Industrial Group to be below 2015 levels as a result of oil sands production shutdowns
and slowdowns related to the recent wildfires in Northern Alberta, as well as the related deferral of oil sands project
opportunities that were expected to benefit the Industrial Group's financial results in the second half of the year. These
impacts will be partially offset by our execution of industrial projects outside of Alberta, including a large power distribution
project in Manitoba and the completion of the mining project in the Northwest Territories in 2016.
Industrial Group adjusted EBITDA and adjusted EBITDA margin as a percentage of revenue are also expected to be
significantly lower year-over-year as a result of the productivity challenges and additional costs associated with
demobilizing and remobilizing on oil sands sites due to the wildfire crisis. Competitive market pressures in Alberta and
an increased proportion of revenue coming from lower-risk cost-reimbursable MRO projects are also expected to
negatively impact adjusted EBITDA and adjusted EBITDA margin from the group.
We expect to execute approximately $128.2 million of the Industrial Group’s June 30, 2016 backlog in the balance of
2016. New contract awards and scope changes are expected to supplement the Industrial Group’s 2016 revenue from
backlog.
Buildings Group Outlook
We expect the Buildings Group to achieve higher adjusted EBITDA and adjusted EBITDA margin in 2016 on lower
revenue compared to 2015. This reduction in revenue is in part due to the strategic shift undertaken in 2015 by the
Buildings Group to discontinue industrial sector projects and to re-focus efforts on the group’s core strengths in the public
and private construction markets. In addition, this lower revenue also reflects delays in the rollout of new infrastructure
opportunities, as well as delays in the commencement of new projects currently in pre-construction. The Buildings
Group’s 2016 revenue will be supported by predominantly public projects in multiple provinces, including the group’s
growing activity in Ontario. The higher adjusted EBITDA expectations primarily reflect the favourable shift in project mix,
and to a lesser extent, a change in project stage of completion with several larger public projects scheduled to reach
completion in 2016.
We expect to execute approximately $267.4 million of the Buildings Group’s June 30, 2016 backlog during the remainder
of 2016. Longer term, we see a continued strong pipeline of public projects arising from increased infrastructure spending
at both the provincial and federal levels across Canada.

4 | SECOND QUARTER 2016 MD&A
Commercial Systems Group Outlook
Commercial Systems Group 2016 revenue is expected to be lower than in 2015, reflecting the completion in 2015 of a
number of significant projects. Adjusted EBITDA and adjusted EBITDA margins are expected to be moderately lower
than in 2015, reflecting the competitive market environment in Alberta.
During 2016, the Commercial Systems Group expects to execute approximately $73.2 million of its June 30, 2016
backlog. New awards, short-duration projects, building maintenance and tenant improvement work on existing projects
are expected to supplement the secured revenue in backlog to be executed in the year.
RISKS
Various factors could cause our actual results to differ materially from the results anticipated by management. The factors
are described in more detail throughout this document and the section of Stuart Olson’s Annual Information Form entitled
“Risk Factors”. Readers are also encouraged to review the section of this MD&A entitled “Forward-Looking Information”.

5 | SECOND QUARTER 2016 MD&A
ABOUT STUART OLSON INC.
Stuart Olson provides private, public and industrial construction services to a diverse range of customers in Western
Canada, Ontario and the Northwest Territories.
The branding of our three business groups is organized as follows:
Industrial Group
The Industrial Group operates under the general contracting brand of Stuart Olson and under our endorsed brands of
Laird, Studon, Northern, Fuller Austin and Sigma Power. The Industrial Group serves clients in a wide range of industrial
sectors including oil and gas, petrochemical, refining, mining, pulp and paper and power generation. With Industrial
Group offices and projects across Western Canada, Ontario and the Northwest Territories, we have developed a national
platform to deliver industrial services.
Originally organized as separate service companies, the Industrial Group increasingly operates as an integrated
industrial contractor, capable of self-performing larger projects in the industrial construction and MRO space. The
Industrial Group provides full service general contracting, including mechanical, process insulation, metal siding and
cladding, heating, ventilating and air conditioning (“HVAC”), asbestos abatement, electrical and instrumentation, high
voltage testing and commissioning, as well as power line construction and maintenance services.

6 | SECOND QUARTER 2016 MD&A
Buildings Group
Our Buildings Group provides services to clients in the private and public sectors. It operates projects and branch offices
across Western Canada and Ontario.
Projects undertaken by the Buildings Group include the construction, expansion and renovation of buildings ranging from
schools, hospitals and sports arenas, to high-rise office towers, retail and high technology facilities. The Buildings Group
focuses on alternative methods of project delivery such as construction management and design-build approaches.
These methods provide cost reductions for clients as a result of the project efficiencies we are able to generate. These
approaches also support our ability to deliver on-time and on-budget project completion, assist us in building long-term
relationships with clients, reduce project execution risk and improve our contract margins.
The majority of the revenue generated by the Buildings Group is from repeat clients or arises through pre-qualification
processes and select invitational tenders. Our business model is to pursue and negotiate larger construction
management-type contracts rather than hard-bid projects. The Buildings Group subcontracts approximately 85% of its
project work to subcontractors and suppliers and closely manages the construction process to deliver on commitments.
Commercial Systems Group
The Commercial Systems Group, operating under the Canem brand, is one of the largest electrical and data systems
contracting companies in Western Canada with offices and projects in Manitoba, Alberta and British Columbia. Canem
is an industry leader in the provision of complex systems used in today’s high-tech, high performance buildings. It not
only designs, builds and installs a building’s core electrical infrastructure, it also provides the services and systems that
support information management, building systems integration, energy management, green data centres, security and
risk management and lifecycle services. Additionally, Canem provides ongoing maintenance and on-call service to
customers, and manages regional and national multi-site installations and roll outs.
Canem focuses primarily on large, complex projects that contain both data and electrical components, or that require
extensive logistical expertise. Canem’s strategy is to deliver these services on a tendered (hard-bid) basis and as part
of an integrated project delivery process that includes close involvement with customers from the earliest stages of
design. Canem is also an industry leader in the use of off-site assembly of modularized system components (pre-
fabrication), which significantly improves worksite productivity.

7 | SECOND QUARTER 2016 MD&A
RESULTS OF OPERATIONS
Consolidated Results
Three months ended Six months ended
June 30 June 30
$millions, except percentages and per share amounts 2016 2015(2) 2016 2015(2)
Contract revenue 227.2 303.7 470.2 586.6
Contract income 21.6 31.7 45.0 56.6
Contract income margin(1) 9.5% 10.4% 9.6% 9.6%
Administrative costs 24.4 24.3 46.7 44.1
Adjusted EBITDA(1) 7.2 12.9 13.5 23.4
Adjusted EBITDA margin(1) 3.2% 4.2% 2.9% 4.0%
Net (loss) earnings (3.4) 1.7 (4.3) 2.7
(Loss) earnings per share Basic (loss) earnings per share (0.13) 0.06 (0.16) 0.10
Diluted (loss) earnings per share (0.13) 0.06 (0.16) 0.10
Dividends declared per share 0.12 0.12 0.24 0.24
Adjusted free cash flow(1) (5.3) 10.8 (7.9) 10.3
Adjusted free cash flow per share(1) (0.20) 0.41 (0.30) 0.39
$millions Jun. 30,
2016 Dec. 31,
2015
Backlog(1) 2,096.1 1,960.9
Working capital(1) 58.3 64.4
Long-term debt (excluding current portion) 50.4 46.6
Convertible debentures (excluding equity portion) 73.4 72.5
Total assets 631.0 646.8
Notes: (1) “Contract income margin”, “adjusted EBITDA”, “adjusted EBITDA margin”, “adjusted free cash flow”, “adjusted free cash flow per share”,
“backlog” and “working capital” are non-IFRS measures. Refer to “Non-IFRS Measures” for definitions of these terms. (2) Adjusted EBITDA for the three and six months ended June 30, 2015 is presented as calculated based on our current definition. Please
refer to the “Non-IFRS Measures” section for more information on our definition and the calculation.

8 | SECOND QUARTER 2016 MD&A
Three-Month Results
For the three months ended June 30, 2016, we generated consolidated contract revenue of $227.2 million, 25.2% lower
than the $303.7 million recorded in the same period in 2015. Revenue decreased by $35.0 million or 24.5% year-over-
year in the Buildings Group, by $33.1 million or 31.0% in the Industrial Group and by $12.6 million or 19.7% in the
Commercial Systems Group. Partially offsetting these decreases was a $4.2 million or 42.9% reduction in intersegment
revenue eliminated on consolidation, reflecting lower levels of intersegment activity in the Q2 2016 period.
Second quarter contract income of $21.6 million decreased by $10.1 million or 31.9% from $31.7 million last year. While
contract income generated by the Buildings Group increased by $0.2 million or 2.1%, this was offset by a $6.1 million or
49.6% decrease in contract income from the Industrial Group and a $1.7 million or 23.3% decrease from the Commercial
Systems Group. The timing of intersegment eliminations further reduced contract income by $2.5 million year-over-year.
Intersegment eliminations occur when two or more of our business groups work together on a project. Over the life of
the project, the impact of the eliminations to contract income will net to nil; however, the impact of eliminations may be
temporarily significant from period-to-period depending on a number of factors. These factors include the number of
intercompany projects under construction, the scale of the projects, contract terms and project stage of completion.
Contract income as a percentage of revenue decreased modestly to 9.5% from 10.4% year-over-year.
Second quarter 2016 administrative costs remained relatively flat at $24.4 million, compared to $24.3 million last year
as the benefits of our cost containment measures were offset by restructuring charges recognized during the quarter.
Administrative cost savings of $4.5 million in the Corporate Group and $0.2 million in the Industrial Group were offset by
increased costs of $4.1 million in the Buildings Group and $0.7 million in the Commercial Systems Group. These
increases in group administrative costs were driven by restructuring costs recognized by each group.
For the three months ended June 30, 2016, adjusted EBITDA decreased by $5.7 million or 44.2% to $7.2 million, from
$12.9 million in Q2 2015. Adjusted EBITDA margin decreased to 3.2% from 4.2% year-over-year. The change in adjusted
EBITDA primarily reflects the lower contract income, partially offset by lower core administrative costs (before
depreciation and restructuring costs).
We recorded a consolidated net loss of $3.4 million (diluted loss per share of $0.13) in the second quarter of 2016. This
compares to net earnings of $1.7 million (diluted earnings per share of $0.06) in the second quarter of 2015. The $5.1
million year-over-year decline in net earnings primarily reflects lower adjusted EBITDA and the impact of $4.9 million of
restructuring and impairment costs, partially offset by reduced finance costs and tax expense. Excluding the after-tax
impact of the $5.4 million in restructuring and impairment charges, we would have reported a second quarter net profit
of $0.5 million (diluted earnings per share of $0.02).
Adjusted free cash flow in the second quarter of 2016 was an outflow of $5.3 million (outflow of $0.20 per share), a
decline of $16.1 million from an inflow of $10.8 million (inflow of $0.41 per share) in the second quarter of 2015. The
year-over-year change reflects the decline in adjusted EBITDA, restructuring charges and the settlement of a provision
in the quarter.
Six-Month Results
For the six months ended June 30, 2016, consolidated contract revenue decreased by $116.4 million or 19.8% to $470.2
million, from $586.6 million in the same period in 2015. On a segmented basis, first-half revenue decreased by $90.5
million or 30.6% in the Buildings Group, by $22.4 million or 11.8% in the Industrial Group, and by $11.6 million or 9.6%
in the Commercial Systems Group. We recorded intersegment revenue eliminations of $11.5 million during the first half
of 2016, a decrease of $8.1 million or 41.3% from the same period in 2015. This decrease reflects reduced intersegment
activity between our business groups.
9 | SECOND QUARTER 2016 MD&A
Contract income was $45.0 million in the first six months of 2016, a decline of $11.6 million or 20.5% from $56.6 million
in 2015. While contract income generated by the Buildings Group increased by $2.4 million or 14.6%, this was offset by
a $6.9 million or 32.1% decrease in contract income from the Industrial Group and a $0.9 million or 6.0% decrease from
the Commercial Systems Group. The timing of intersegment eliminations further reduced contract income by $6.2 million
year-over-year.
Contract income margin remained unchanged at 9.6% as our improving core operating performance helped to offset the
negative impacts of the Northern Alberta wildfires and the non-cash impact of intersegment eliminations.
Administrative restructuring and impairment charges of $5.6 million incurred in the first half of 2016 increased
administrative costs to $46.7 million, from $44.1 million in the same period in 2015. Administrative expenses were down
by $1.4 million or 7.1% in the Corporate Group and by $0.5 million or 3.6% in the Industrial Group. These savings were
offset by an increase of $4.2 million or 35.6% in the Buildings Group and $0.5 million or 7.1% in the Commercial Systems
Group.
Adjusted EBITDA for the first six months of 2016 declined 42.3% to $13.5 million, from $23.4 million in the same period
of 2015. This $9.9 million decrease primarily reflects the lower contract income, partly offset by lower core administrative
costs (before depreciation and restructuring charges). First-half adjusted EBITDA margin decreased to 2.9% from 4.0%
in 2015.
We reported a first-half consolidated net loss of $4.3 million in 2016 (diluted loss per share of $0.16), compared to
consolidated net earnings of $2.7 million (diluted earnings per share of $0.10) in the first six months of 2015. The year-
over-year reduction reflects the lower adjusted EBITDA and restructuring charges incurred in the first half of 2016. These
impacts were partially offset by reduced finance costs, lower amortization from intangible assets recorded as part of the
Studon acquisition and lower income tax expense. Excluding the impact of the $6.5 million of first half restructuring and
impairment charges, we would have reported a second quarter net profit of $0.4 million (diluted earnings per share of
$0.01).
Adjusted free cash flow in the first six months of 2016 was an outflow of $7.9 million (outflow of $0.30 per share), a
decline of $18.2 million from an inflow of $10.3 million (inflow of $0.39 per share) in the first six months of 2015. The
year-over-year change reflects the decline in adjusted EBITDA, non-recurring 2016 restructuring costs, the settlement
of a provision in 2016 and an increase in cash payments in the first half of 2016 to settle final 2015 tax balances.

10 | SECOND QUARTER 2016 MD&A
Consolidated Backlog
$millions, except percentages Jun. 30, 2016 Dec. 31, 2015
Industrial Group 766.1 493.5
Buildings Group 1,197.8 1,334.0
Commercial Systems Group 132.2 133.4
Consolidated backlog 2,096.1 1,960.9
Construction management 47.1% 57.9%
Cost-plus 35.9% 28.2%
Design-build 5.6% 5.3%
Tendered (hard bid) 11.4% 8.6%
Consolidated backlog as at June 30, 2016 was $2,096.1 million, an increase of $135.2 million or 6.9% from backlog of
$1,960.9 million as at December 31, 2015. As at June 30, 2016, backlog consisted of work-in-hand of $929.3 million
(December 31, 2015 - $897.2 million) and active backlog of $1,166.8 million (December 31, 2015 - $1,063.7 million).
Approximately 47.1% of the backlog consists of construction management (“CM”) contracts, 35.9% cost-plus
arrangements, 5.6% design-build contracts and 11.4% tendered (hard-bid) work. New contract awards and net increases
in contract value of $269.3 million were added to work-in-hand in the second quarter of 2016.
Our book-to-bill ratio for the second quarter and first half of 2016 was 0.42 to 1.0 and 1.29 to 1.0, respectively. Revenue
exceeded backlog additions in the second quarter of 2016 primarily due to delays in the rollout of new infrastructure
project opportunities. Backlog additions significantly exceeded revenue in the first half of the year primarily as a result of
the large five-year master services agreement (“MSA”) awarded to the Industrial Group, which added $400.0 million to
backlog in the first quarter of 2016. The remaining $100.0 million balance of the total $500.0 million MSA award was
added to backlog in the fourth quarter of 2015.
11 | SECOND QUARTER 2016 MD&A
RESULTS OF OPERATIONS BY BUSINESS GROUP
Industrial Group Results
Three months ended Six months ended
June 30 June 30
$millions, except percentages 2016 2015(3) 2016 2015(3)
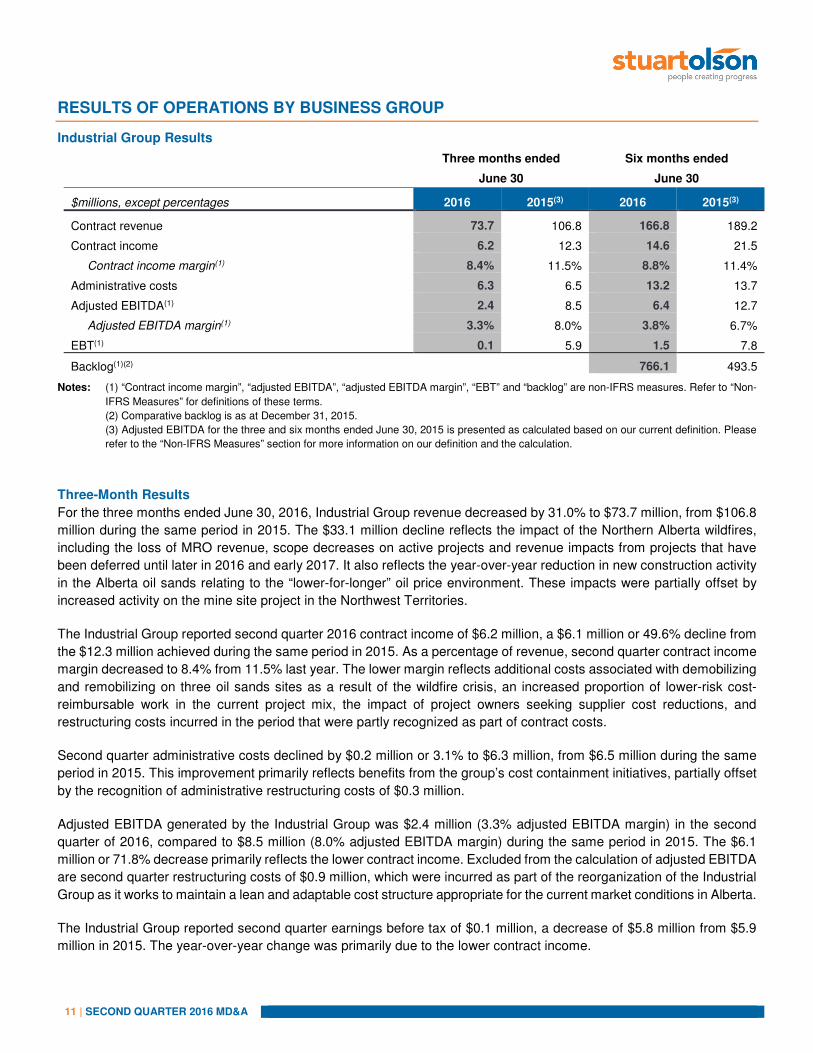
Contract revenue 73.7 106.8 166.8 189.2
Contract income 6.2 12.3 14.6 21.5
Contract income margin(1) 8.4% 11.5% 8.8% 11.4%
Administrative costs 6.3 6.5 13.2 13.7
Adjusted EBITDA(1) 2.4 8.5 6.4 12.7
Adjusted EBITDA margin(1) 3.3% 8.0% 3.8% 6.7%
EBT(1) 0.1 5.9 1.5 7.8
Backlog(1)(2) 766.1 493.5
Notes: (1) “Contract income margin”, “adjusted EBITDA”, “adjusted EBITDA margin”, “EBT” and “backlog” are non-IFRS measures. Refer to “Non-
IFRS Measures” for definitions of these terms.
(2) Comparative backlog is as at December 31, 2015.
(3) Adjusted EBITDA for the three and six months ended June 30, 2015 is presented as calculated based on our current definition. Please
refer to the “Non-IFRS Measures” section for more information on our definition and the calculation.
Three-Month Results
For the three months ended June 30, 2016, Industrial Group revenue decreased by 31.0% to $73.7 million, from $106.8
million during the same period in 2015. The $33.1 million decline reflects the impact of the Northern Alberta wildfires,
including the loss of MRO revenue, scope decreases on active projects and revenue impacts from projects that have
been deferred until later in 2016 and early 2017. It also reflects the year-over-year reduction in new construction activity
in the Alberta oil sands relating to the “lower-for-longer” oil price environment. These impacts were partially offset by
increased activity on the mine site project in the Northwest Territories.
The Industrial Group reported second quarter 2016 contract income of $6.2 million, a $6.1 million or 49.6% decline from
the $12.3 million achieved during the same period in 2015. As a percentage of revenue, second quarter contract income
margin decreased to 8.4% from 11.5% last year. The lower margin reflects additional costs associated with demobilizing
and remobilizing on three oil sands sites as a result of the wildfire crisis, an increased proportion of lower-risk cost-
reimbursable work in the current project mix, the impact of project owners seeking supplier cost reductions, and
restructuring costs incurred in the period that were partly recognized as part of contract costs.
Second quarter administrative costs declined by $0.2 million or 3.1% to $6.3 million, from $6.5 million during the same
period in 2015. This improvement primarily reflects benefits from the group’s cost containment initiatives, partially offset
by the recognition of administrative restructuring costs of $0.3 million.
Adjusted EBITDA generated by the Industrial Group was $2.4 million (3.3% adjusted EBITDA margin) in the second
quarter of 2016, compared to $8.5 million (8.0% adjusted EBITDA margin) during the same period in 2015. The $6.1
million or 71.8% decrease primarily reflects the lower contract income. Excluded from the calculation of adjusted EBITDA
are second quarter restructuring costs of $0.9 million, which were incurred as part of the reorganization of the Industrial
Group as it works to maintain a lean and adaptable cost structure appropriate for the current market conditions in Alberta.
The Industrial Group reported second quarter earnings before tax of $0.1 million, a decrease of $5.8 million from $5.9
million in 2015. The year-over-year change was primarily due to the lower contract income.

12 | SECOND QUARTER 2016 MD&A
Six-Month Results
For the six months ended June 30, 2016, the Industrial Group generated revenue of $166.8 million, a decrease of $22.4
million or 11.8% from $189.2 million in the first half of 2015. The year-over-year change in revenue reflects the impact
of the Northern Alberta wildfires, including the loss of MRO revenue, scope decreases on active projects, and revenue
impacts from projects that have been deferred until later in 2016. Revenue results also reflect the year-over-year
reduction in new oil sands construction activity related to the “lower-for-longer” oil price environment. These impacts
were partially offset by increased activity at the mine site project in the Northwest Territories.
The Industrial Group generated first half contract income of $14.6 million, a decrease of $6.9 million or 32.1% from the
$21.5 million achieved during the same period in 2015. First half contract income margin was 8.8% compared to 11.4%
last year, reflecting additional costs associated with demobilizing and remobilizing on oil sands sites as a result of the
wildfire crisis, project owners seeking supplier cost reductions, a greater proportion of lower-risk cost reimbursable MRO
work in this year’s project mix, and restructuring costs incurred in the Q2 2016 period that were partly recognized as part
of contract costs.
First half 2016 administrative costs decreased by $0.5 million or 3.6% to $13.2 million, from $13.7 million during the
same period in 2015. This improvement primarily reflects the benefit of cost containment initiatives undertaken in
response to the economic environment in Alberta, partially offset by first half administrative restructuring costs of $1.0
million.
Adjusted EBITDA from the Industrial Group decreased by $6.3 million or 49.6% to $6.4 million (3.8% adjusted EBITDA
margin) in the first half of 2016, from $12.7 million (6.7% adjusted EBITDA margin) during the same period in 2015. The
year-over-year decrease relates primarily to the decline in contract income.
Year-to-date Industrial Group earnings before tax declined by $6.3 million or 80.8% to $1.5 million in 2016, from $7.8
million last year. The decrease in earnings before tax primarily reflects the decline in adjusted EBITDA.
Backlog
As at June 30, 2016, Industrial Group backlog increased to $766.1 million, from a backlog of $493.5 million at December
31, 2015. The $272.6 million or 55.2% increase was primarily due to the addition of $400.0 million of backlog related to
the $500.0 million five-year MSA award in the first half of the year to provide MRO services to a longstanding oil sands
customer in Alberta. The remaining $100.0 million of this $500.0 million award was subject to a purchase order issued
to us in the previous year for work to be undertaken in 2016, and was included in backlog at the end of 2015. As at June
30, 2016, 82.6% of the Industrial Group’s backlog was composed of cost-plus projects and 17.4% was tendered (hard-
bid) projects. The June 30, 2016 backlog consisted of $324.1 million of work-in-hand and $442.0 million of active backlog,
compared to $328.2 million of work-in-hand and $165.3 million of active backlog at December 31, 2015. With respect to
work-in-hand, the Industrial Group contracted $82.4 million of new awards during the quarter and executed $73.7 million
of contract revenue.

13 | SECOND QUARTER 2016 MD&A
Buildings Group Results
Three months ended Six months ended
June 30 June 30
$millions, except percentages 2016 2015(3) 2016 2015(3)
Contract revenue 107.8 142.8 205.6 296.1
Contract income 9.7 9.5 18.8 16.4
Contract income margin(1) 9.0% 6.7% 9.1% 5.5%
Administrative costs 9.9 5.8 16.0 11.8
Adjusted EBITDA(1) 4.2 4.2 7.8 5.8
Adjusted EBITDA margin(1) 3.9% 2.9% 3.8% 2.0%
EBT(1) (0.1) 3.9 2.9 5.0
Backlog(1)(2) 1,197.8 1,334.0
Notes: (1) “Contract income margin”, “adjusted EBITDA”, “adjusted EBITDA margin”, “EBT” and “backlog” are non-IFRS measures. Refer to “Non-
IFRS Measures” for definitions of these terms.
(2) Comparative backlog is as at December 31, 2015.
(3) Adjusted EBITDA for the three and six months ended June 30, 2015 is presented as calculated based on our current definition. Please
refer to the “Non-IFRS Measures” section for more information on our definition and the calculation.
Three-Month Results
For the three months ended June 30, 2016, the Buildings Group generated revenue of $107.8 million, a decrease of
$35.0 million or 24.5% from $142.8 million in the same period in 2015. The primary factors in this decrease were the
planned wind-down of the Buildings Group’s industrial project activity, the completion of projects in Manitoba that
provided significant revenue in the second quarter of 2015, delays in the rollout of new infrastructure opportunities and
delays in the commencement of new projects currently in pre-construction. These impacts were partially offset by the
Buildings Group’s increased activity levels in the Ontario market.
Contract income increased to $9.7 million in the second quarter of 2016, from $9.5 million during the same period in
2015. The $0.2 million or 2.1% improvement reflects higher contract income margin, which climbed to 9.0% from 6.7%
year-over-year. The improvement in margin reflects additional profit realized on two significant projects nearing
completion in 2016. It also reflects the group’s strategic move away from the higher-risk industrial projects that generated
negative margin during Q2 2015.
Second quarter 2016 administrative costs increased by $4.1 million or 70.7% to $9.9 million, from $5.8 million last year.
The increase in administrative costs was driven by the recognition of $3.9 million in non-cash onerous lease restructuring
and impairment costs associated with consolidating and reducing the Buildings Group’s office space as we continue to
lower costs and increase efficiencies in a challenging economic environment.
The Buildings Group generated second quarter adjusted EBITDA of $4.2 million, unchanged from $4.2 million last year.
Adjusted EBITDA margin climbed to 3.9% from 2.9% year-over-year reflecting higher contract income on lower revenue.
The Buildings Group incurred a second quarter 2016 loss before tax of $0.1 million, compared to earnings before tax of
$3.9 million in Q2 2015. This $4.0 million decline reflects the restructuring charges recognized in 2016.
Six-Month Results
For the six months ended June 30, 2016, the Buildings Group generated revenue of $205.6 million, a decrease of $90.5
million or 30.6% from revenue of $296.1 million during the same period in 2015. The year-over-year change reflects
lower activity levels due to delays in the rollout of new infrastructure opportunities, delays in the commencement of new
projects currently in pre-construction and the planned reduction in Buildings Group industrial site project activity, partially
offset by the group’s increased activity levels in the Ontario market.
14 | SECOND QUARTER 2016 MD&A
First half 2016 Buildings Group contract income increased by 14.6% to $18.8 million, from $16.4 million during the same
period in 2015. The $2.4 million increase was principally driven by a contract income margin of 9.1% in the first six
months of 2016, compared to 5.5% during the same period in 2015. The higher contract income margin reflects different
project mix between the two periods and the move away from the higher-risk industrial projects that generated negative
margin during the first half of 2015.
The Buildings Group administrative costs increased $4.2 million or 35.6% to $16.0 million in the first six months of 2016,
from $11.8 million in the same period last year. The increase is primarily due to the recognition of $3.9 million in non-
cash onerous lease restructuring and impairment costs during the first half of 2016.
Adjusted EBITDA for the six months ended June 30, 2016 increased 34.5% to $7.8 million (3.8% adjusted EBITDA
margin), from $5.8 million (2.0% adjusted EBITDA margin) in the first half of 2015. This $2.0 million improvement reflects
the improvement in contract income.
First half earnings before tax declined to $2.9 million, from $5.0 million in 2015. The $2.1 million or 42.0% year-over-
year decline reflects the restructuring costs recognized in 2016, partially offset by higher adjusted EBITDA.
Backlog
As at June 30, 2016, the Buildings Group’s backlog was $1,197.8 million, compared to $1,334.0 million at December 31,
2015. The $136.2 million or 10.2% decrease primarily reflects reductions in both public and private backlog in Alberta
and British Columbia as a result of delays in the rollout of new infrastructure opportunities. As at June 30, 2016, 79.1%
of the Buildings Group’s backlog was composed of CM assignments, 9.7% was cost-plus projects, 9.8% was design-
build contracts and 1.4% was tendered (hard-bid) projects. The June 30, 2016 backlog consisted of $504.7 million of
work-in-hand and $693.1 million of active backlog, compared to $447.6 million of work-in-hand and $886.3 million of
active backlog as at December 31, 2015. With respect to work-in-hand, the segment secured $142.3 million of new
awards and project scope increases during the quarter, and executed $107.8 million of contract revenue.

15 | SECOND QUARTER 2016 MD&A
Commercial Systems Group Results
Three months ended Six months ended
June 30 June 30
$millions, except percentages 2016 2015(3) 2016 2015(3)
Contract revenue 51.3 63.9 109.3 120.9
Contract income 5.6 7.3 14.0 14.9
Contract income margin(1) 10.9% 11.4% 12.8% 12.3%
Administrative costs 4.1 3.4 7.5 7.0
Adjusted EBITDA(1) 2.6 4.3 8.1 8.9
Adjusted EBITDA margin(1) 5.1% 6.7% 7.4% 7.4%
EBT(1) 1.6 3.9 6.7 8.0
Backlog(1)(2) 132.2 133.4
Notes: (1) “Contract income margin”, “adjusted EBITDA”, “adjusted EBITDA margin”, “EBT” and “backlog” are non-IFRS measures. Refer to “Non-
IFRS Measures” for definitions of these terms.
(2) Comparative backlog is as at December 31, 2015.
(3) Adjusted EBITDA for the three and six months ended June 30, 2015 is presented as calculated based on our current definition. Please
refer to the “Non-IFRS Measures” section for more information on our definition and the calculation.
Three-Month Results
For the three months ended June 30, 2016, the Commercial Systems Group generated revenue of $51.3 million,
compared to $63.9 million in Q2 2015. The $12.6 million or 19.7% decline reflects year-over-year changes in project
stage of completion as well as the 2015 wrap up of a number of projects in British Columbia that contributed significant
revenue to last year’s results.
Second quarter contract income from the Commercial Systems Group decreased $1.7 million or 23.3% to $5.6 million,
from $7.3 million in Q2 2015. As a percentage of revenue, contract income margin decreased to 10.9% from 11.4%,
reflecting year-over-year changes in project mix and stage of completion, as well as competitive pricing pressure.
Second quarter administrative costs increased to $4.1 million, from $3.4 million. This $0.7 million or 20.6% increase
relates to restructuring costs recognized in the second quarter of 2016 associated with changes in the operational
structure, as we continue to look for ways to increase operating efficiencies in light of Alberta’s challenging economic
environment.
Adjusted EBITDA from the Commercial Systems Group decreased to $2.6 million (5.1% adjusted EBITDA margin) in the
second quarter of 2016, from $4.3 million (6.7% adjusted EBITDA margin) last year. The year-over-year changes in
adjusted EBITDA and adjusted EBITDA margin reflect the decrease in contract income.
The group generated earnings before tax of $1.6 million in the second quarter of 2016. This was $2.3 million or 59.0%
lower than the $3.9 million achieved during the same period in 2015. The year-over-year decline was due to a
combination of the lower adjusted EBITDA and the restructuring charge recognized in Q2 2016.
Six-Month Results
For the six months ended June 30, 2016, revenue from the Commercial Systems Group decreased to $109.3 million,
from $120.9 million during the same period in 2015. The $11.6 million or 9.6% reduction reflects changes in project stage
of completion and the 2015 wrap up of a number of projects in British Columbia and Manitoba that contributed significant
revenue to last year’s results.

16 | SECOND QUARTER 2016 MD&A
First half 2016 contract income decreased by $0.9 million, or 6.0%, to $14.0 million, from $14.9 million during the same
period in 2015. Year-to-date contract income margin increased to 12.8% from 12.3% in 2015, reflecting changes in
project mix and project stage of completion.
Year-to-date 2016 administrative costs increased to $7.5 million or by 7.1%, from $7.0 million in 2015, primarily due to
restructuring costs recognized in 2016.
Adjusted EBITDA from the Commercial Systems Group was $8.1 million in the first six months of 2016, compared to
$8.9 million last year. The $0.8 million or 9.0% decrease primarily reflects the lower contract income. Adjusted EBITDA
margin remained stable at 7.4%.
The group generated first half earnings before tax of $6.7 million. This was $1.3 million or 16.3% lower than the $8.0
million achieved during the same period in 2015. The year-over-year decline is attributable to a combination of the lower
adjusted EBITDA and the restructuring charge recognized in the first half of 2016.
Backlog
Commercial Systems Group backlog was $132.2 million at June 30, 2016, compared to $133.4 million at December 31,
2015, a decline of $1.2 million or 0.9%. As at June 30, 2016, the group’s backlog was composed of 32.2% CM and cost-
plus projects, 0.3% design-build projects, and 67.5% tendered projects. The June 30, 2016 backlog consisted of $100.5
million of work-in-hand and $31.7 million of active backlog compared to $121.4 million of work-in-hand and $12.1 million
of active backlog at December 31, 2015. With respect to work-in-hand, the group secured $44.5 million of new awards
and increases in contract value during the quarter and executed $51.3 million of construction activity.
Corporate Group Results
Three months ended Six months ended
June 30 June 30
$millions 2016 2015(2) 2016 2015(2)
Administrative costs 4.0 8.5 10.0 11.4
Finance costs 2.2 3.9 4.3 8.0
Adjusted EBITDA(1) (2.2) (6.6) (6.3) (7.7)
EBT(1) (6.1) (12.3) (14.2) (19.2)
Note: (1) “Adjusted EBITDA” and “EBT” are non-IFRS measures. Refer to “Non-IFRS Measures” for the definition of the term.
(2) Adjusted EBITDA for the three and six months ended June 30, 2015 is presented as calculated based on our current definition. Please
refer to the “Non-IFRS Measures” section for more information on our definition and the calculation.
Three-Month Results
For the three months ended June 30, 2016, Corporate Group administrative costs decreased to $4.0 million, from $8.5
million in the second quarter of 2015. The $4.5 million or 52.9% decrease is primarily related to a year-over-year
reduction in incentive plan accruals and a reduction in share-based compensation expenses due to a 13.6% decline in
our share price in the quarter and its impact on share-based compensation expense. This compares to a 27.3% increase
in our share price in Q2 2015.
The Corporate Group’s finance costs decreased to $2.2 million in the second quarter of 2016, from $3.9 million during
the same period last year. The $1.7 million or 43.6% improvement reflects reduced interest costs related to having just
one set of convertible debentures outstanding in Q2 2016, as compared to having two sets of convertible debentures
outstanding in Q2 2015. This improvement was partially offset by an increase in interest costs related to the higher draw
on our Revolver in 2016, compared to the nominal balances drawn on the Revolver in the first half of 2015.

17 | SECOND QUARTER 2016 MD&A
Corporate Group adjusted EBITDA improved to a loss of $2.2 million in Q2 2016, from a loss of $6.6 million in Q2 2015.
The $4.4 million or 66.7% improvement primarily reflects the decrease in administrative costs. The Corporate Group
incurred a second quarter 2016 loss before tax of $6.1 million, compared to a loss before tax of $12.3 million in the
comparable period in 2015. The year-over-year decline was due to decreased administrative and finance costs.
Six-Month Results
For the six months ended June 30, 2016, Corporate Group administrative expenses decreased to $10.0 million, from
$11.4 million in the second half of 2015. The $1.4 million or 12.3% decrease is primarily related to a year-over-year
change in the amount of incentive plan accruals. This change was partially offset by an increase in share-based
compensation expenses due to a 4.0% increase in our share price in the first half of 2016 and its impact on share-based
compensation expense, as compared to a 10.2% decrease in our share price in the first half of 2015.
The Corporate Group’s finance costs were $4.3 million in the second half of 2016, compared to $8.0 million during the
same period last year. The $3.7 million or 46.3% decrease reflects having just one set of higher interest convertible
debentures outstanding in the first half of 2016 compared to two sets in the first half of 2015. This was partially offset by
increased Revolver interest costs in 2016 from having nominal balances drawn on the Revolver in the first half of 2015.
First half Corporate Group adjusted EBITDA improved to a loss of $6.3 million, from a loss of $7.7 million in the 2015
period. The $1.4 million or 18.2% improvement reflects the decrease in administrative costs. For the six months ended
June 30, 2016, the Corporate Group incurred a loss before tax of $14.2 million, an improvement of $5.0 million or 26.0%
compared to the loss before tax of $19.2 million in the comparable period in 2015. This year-over-year improvement
reflects the decrease in administrative and finance costs.

18 | SECOND QUARTER 2016 MD&A
LIQUIDITY
Cash and Borrowing Capacity
We monitor our liquidity principally through cash and cash equivalents and available borrowing capacity under our
revolving credit facility.
Current cash and cash equivalents at June 30, 2016 were $34.1 million, consistent with the $33.7 million held at
December 31, 2015.
As at June 30, 2016, we had additional borrowing capacity under our Revolver of $59.5 million, as compared to available
capacity of $106.2 million at December 31, 2015. The $45.3 million reduction reflects the 2016 impact of restructuring
charges and the Northern Alberta wildfires on our last-twelve-month EBITDA (calculated in accordance with the definition
of EBITDA as set out in the Revolver agreement) for the period ending June 30, 2016, combined with a slightly higher
balance drawn on our Revolver to invest in working capital needed to fund operating activities.
Debt and Capital Structure
Long-term indebtedness, including the current portion of long-term debt and convertible debentures, increased to $135.0
million at June 30, 2016, from $131.7 million at December 31, 2015. Long-term indebtedness consists of $80.5 million
(December 31, 2015 - $80.5 million) principal value at maturity of outstanding convertible debentures and the principal
value of long-term debt of $54.5 million (December 31, 2015 - $51.2 million) before the deduction of deferred financing
fees.
The current portion of long-term debt was $2.0 million as at June 30, 2016 (December 31, 2015 - $2.4 million).
We monitor our capital structure through the use of indebtedness to capitalization and net long-term indebtedness to
adjusted EBITDA metrics. Indebtedness to capitalization at June 30, 2016 was 38.6%, which is consistent with 36.9%
as at December 31, 2015 and is in line with our long-term targeted range of 20.0% to 40.0%.
As at June 30, 2016, our net long-term indebtedness to adjusted EBITDA ratio was 2.4x, which is modestly lower than
the 2.5x presented at June 30, 2015 and within the targeted three-to-five year planning range of 2.0x to 3.0x.
As at June 30, 2016, we were in full compliance with our Revolver covenants.
Ratio Covenant
Actual as at
Jun. 30, 2016
Interest coverage >3.00:1.00 4.20
Total debt to EBITDA(1) <3.00:1.00 1.40
Notes: (1) Total debt and EBITDA are calculated in accordance with their definitions in our Revolver agreement.
The outstanding balance under the Revolver fluctuates from quarter-to-quarter as it is drawn to finance working capital
requirements, capital expenditures and acquisitions, and is repaid with funds from operations, dispositions or financing
activities.
Revolver Amendments
Subsequent to quarter-end, on July 13, 2016, we completed the negotiation of improved terms and an extension to our
Revolver, which now consists of a $150.0 million credit facility and a $25.0 million operating facility. The combination of
these two facilities maintains our maximum available borrowing capacity of $175.0 million. The syndicated portion of the
facility continues to include a $75.0 million accordion feature. The maturity date of the Revolver was extended to July
16, 2021.
19 | SECOND QUARTER 2016 MD&A
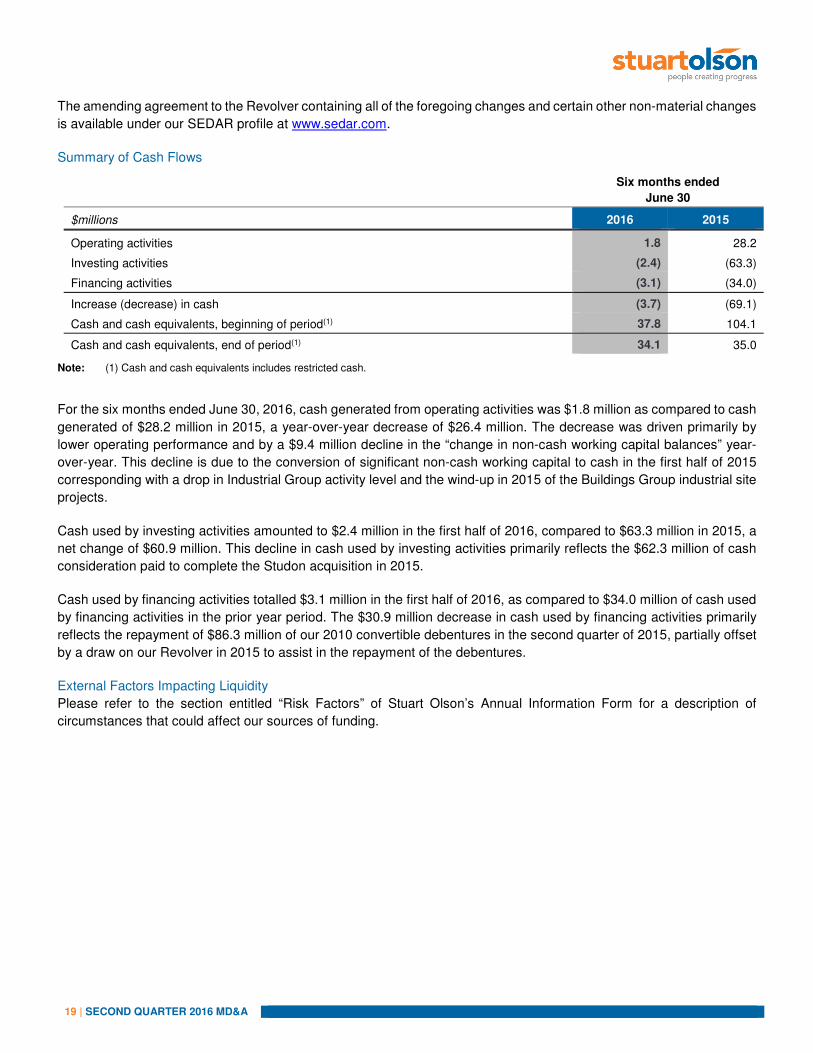
The amending agreement to the Revolver containing all of the foregoing changes and certain other non-material changes
is available under our SEDAR profile at www.sedar.com.
Summary of Cash Flows
Six months ended
June 30
$millions 2016 2015
Operating activities 1.8 28.2
Investing activities (2.4) (63.3)
Financing activities (3.1) (34.0)
Increase (decrease) in cash (3.7) (69.1)
Cash and cash equivalents, beginning of period(1) 37.8 104.1
Cash and cash equivalents, end of period(1) 34.1 35.0
Note: (1) Cash and cash equivalents includes restricted cash.
For the six months ended June 30, 2016, cash generated from operating activities was $1.8 million as compared to cash
generated of $28.2 million in 2015, a year-over-year decrease of $26.4 million. The decrease was driven primarily by
lower operating performance and by a $9.4 million decline in the “change in non-cash working capital balances” year-
over-year. This decline is due to the conversion of significant non-cash working capital to cash in the first half of 2015
corresponding with a drop in Industrial Group activity level and the wind-up in 2015 of the Buildings Group industrial site
projects.
Cash used by investing activities amounted to $2.4 million in the first half of 2016, compared to $63.3 million in 2015, a
net change of $60.9 million. This decline in cash used by investing activities primarily reflects the $62.3 million of cash
consideration paid to complete the Studon acquisition in 2015.
Cash used by financing activities totalled $3.1 million in the first half of 2016, as compared to $34.0 million of cash used
by financing activities in the prior year period. The $30.9 million decrease in cash used by financing activities primarily
reflects the repayment of $86.3 million of our 2010 convertible debentures in the second quarter of 2015, partially offset
by a draw on our Revolver in 2015 to assist in the repayment of the debentures.
External Factors Impacting Liquidity
Please refer to the section entitled “Risk Factors” of Stuart Olson’s Annual Information Form for a description of
circumstances that could affect our sources of funding.

20 | SECOND QUARTER 2016 MD&A
CAPITAL RESOURCES
Our objectives in managing capital are to ensure that we have sufficient liquidity to pursue growth objectives while
maintaining a prudent amount of financial leverage.
Capital is comprised of equity and long-term indebtedness, including convertible debentures. Our primary uses of capital
are to finance operations, execute our growth strategies and fund capital expenditure programs.
Capital expenditures, including property, equipment and intangible assets, are associated with our need to maintain and
support existing operations. For 2016, we are continuing to restrict capital spending to only those assets we are
contractually committed to acquire or that are needed in order to execute our backlog of work. We expect to keep capital
expenditures for 2016 within a range of $6.5 million to $8.0 million as we continue to monitor and assess the health of
the Western Canadian construction market in a low commodity price environment. Cash capital expenditures, net of
tenant inducement cash receipts, are expected to be $5.0 million to $6.5 million in 2016.
Working Capital
As at June 30, 2016, we had working capital of $58.3 million, compared to $64.4 million at December 31, 2015. The $6.1
million decrease primarily reflects a reduction in non-cash working capital as we resolved and collected a number of
aged receivables and applied these funds to the repayment of balances drawn under the Revolver, as well as by first
half payments made in 2016 to settle our final 2015 tax balances.
On the basis of our current cash and cash equivalents, our ability to generate cash from operations and the undrawn
portion of our Revolver, we believe we have the capital resources and liquidity necessary to meet our commitments,
support operations, finance capital expenditures, support growth strategies and fund declared dividends.
For additional information regarding our management of capital, please refer to Note 12 of the June 30, 2016 Condensed
Consolidated Interim Financial Statements.
Contractual Obligations
The following are our contractual financial obligations as at June 30, 2016. Interest payments on the Revolver have not
been included in the table below as they are subject to variability based upon outstanding balances at various points
throughout the year. Further information is included in Note 11(b)(iii) of the June 30, 2016 Condensed Consolidated
Interim Financial Statements.
$thousands
Carrying
amount
Contractual
cash flows
Not later
than 1 year
Later than 1
year and
less than 3
years
Later than 3
years and
less than 5
years
Later than 5
years
Trade and other payables $ 169,660 $ 169,660 $ 169,660 $ nil $ nil $ nil
Provisions including current portion 11,527 14,568 7,355 2,024 1,429 3,760
Convertible debentures (debt portion) 73,399 97,405 4,830 9,660 82,915 nil
Long-term debt including current portion 52,429 54,577 2,081 248 52,248 nil
Operating lease commitments nil 58,775 8,284 13,783 13,782 22,926
$ 307,015 $ 394,985 $ 192,210 $ 25,715 $ 150,374 $ 26,686
Scheduled long-term debt principal repayments due within one year of June 30, 2016 were $2.0 million (December 31,
2015 - $2.4 million).

21 | SECOND QUARTER 2016 MD&A
Share Data
As at June 30, 2016, we had 26,722,909 common shares issued and outstanding and 2,078,141 options convertible into
common shares (December 31, 2015 - 26,532,482 common shares and 1,715,118 options). Please refer to Note 8 and
Note 9 of the June 30, 2016 Condensed Consolidated Interim Financial Statements for further detail. On July 14, 2016,
we issued 98,208 shares pursuant to our Dividend Reinvestment Plan (“DRIP”). The details pertaining to our DRIP are
available on our website at www.stuartolson.com. As at August 9, 2016, we had 26,821,117 common shares issued and
outstanding and 2,078,141 options convertible into common shares.
The $80.5 million of 6.0% convertible debentures issued in September 2014 are convertible into 5,689,046 common
shares, based on a conversion price of $14.15 per share.
At June 30, 2016, shareholders’ equity was $214.3 million, compared to $225.0 million at December 31, 2015. This
$10.7 million decrease reflects $6.4 million of dividends declared, a second quarter net loss of $4.3 million and a $1.4
million year-to-date defined benefit plan actuarial loss, net of tax. This was partially offset by $1.1 million related to shares
issued pursuant to the DRIP and $0.3 million related to share-based compensation expense.
DIVIDENDS
Declaration of Common Share Dividend
On August 9, 2016, our Board of Directors declared a common share dividend of $0.12 per share. The dividend is
designated as an eligible dividend under the Income Tax Act (Canada) and is payable October 13, 2016 to shareholders
of record on September 30, 2016. The declaration of this dividend reflects the Board’s confidence in our ability to
generate cash flows adequate to support our growth strategy, while providing a certain amount of income to our
shareholders.
We also maintain a DRIP, details of which are available on our website (www.stuartolson.com). Future dividend
payments may vary depending on a variety of factors and conditions, including overall profitability, debt service
requirements, operating costs and other factors affecting cash flow.
OFF-BALANCE SHEET ARRANGEMENTS
We had no off-balance sheet arrangements in place at June 30, 2016.
RELATED PARTY TRANSACTIONS
For the three and six-month periods ended June 30, 2016, we incurred facility costs of $0.2 million and $0.3 million,
respectively (June 30, 2015 - $0.1 million and $0.2 million, respectively) for the rental of buildings that are partially owned
indirectly by Don Sutherland, the President of Studon. No amounts are included in trade payables as at June 30, 2016
and 2015.

22 | SECOND QUARTER 2016 MD&A
QUARTERLY FINANCIAL INFORMATION
The following table sets out our selected quarterly financial information for the eight most recent quarters:
2016 Quarter
Ended: 2015 Quarter Ended:
2014 Quarter
Ended:(2)
$millions, except per share amounts Jun. 30 Mar. 31 Dec. 31 Sep. 30 Jun. 30 Mar. 31 Dec. 31 Sep. 30
Contract revenue 227.2 243.0 283.1 281.7 303.7 282.9 364.5 350.4
Adjusted EBITDA(1) 7.2 6.4 12.0 15.8 12.9 10.5 13.4 10.8
Net (loss) earnings from continuing operations (3.4) (0.9) 2.1 6.4 1.7 1.0 1.2 2.8
Net (loss) from discontinued operations nil nil nil nil nil nil (0.7) (15.7)
Net (loss) earnings (3.4) (0.9) 2.1 6.4 1.7 1.0 0.5 (12.9)
Net (loss) earnings per common share
Basic from continuing operations (0.13) (0.03) 0.08 0.24 0.06 0.04 0.05 0.11
Basic (loss) earnings per share (0.13) (0.03) 0.08 0.24 0.06 0.04 0.02 (0.52)
Diluted from continuing operations (0.13) (0.03) 0.08 0.18 0.06 0.04 0.05 0.11
Diluted (loss) earnings per share (0.13) (0.03) 0.08 0.18 0.06 0.04 0.02 (0.52)
Note: (1) Adjusted EBITDA is a non-IFRS measure, please refer to the “Non-IFRS Measures” section for the definition. (2) On January 6, 2015, we acquired all of the issued and outstanding shares of Studon. Our reported results include Studon’s results from
the acquisition date.
Fourth quarter 2014 revenue and adjusted EBITDA increased modestly compared to the third quarter of 2014. Improved
Buildings Group performance more than offset the fourth quarter impact of seasonal declines in Industrial Group revenue
and higher costs associated with the Studon acquisition. Fourth quarter results from continuing operations declined
compared to the third quarter of 2014 due to a full quarter of interest on the 2014 convertible debentures and write-
downs on Buildings Group tenant improvements. Net earnings improved significantly quarter-over-quarter as the third
quarter loss on the disposal of Broda did not repeat in the fourth quarter.
Financial results for the first quarter of 2015 declined relative to the fourth quarter of 2014, with our business groups
experiencing seasonal activity declines quarter-over-quarter. Notwithstanding the seasonal activity decline, net earnings
improved in the first quarter of 2015 as a result of a Q4 2014 loss from discontinued operations that did not repeat in the
first quarter of 2015.
Financial results for the second quarter of 2015 increased compared to the first quarter of 2015, principally due to
seasonal increases in revenue and margin for the Industrial Group, margin improvement for the Buildings Group and an
increase in profit associated with intersegment eliminations.
Third quarter 2015 revenue declined compared to the second quarter of 2015 due to lower activity levels for our
Commercial Systems Group and Buildings Group related to project timing and weaker market conditions in Alberta.
Notwithstanding the decline in revenue, adjusted EBITDA and earnings improved quarter-over-quarter as a result of
improved margin earned by each of our groups.
Modest revenue increases for our Industrial Group and Commercial Systems Group in the fourth quarter of 2015 as
compared to the third quarter were partially offset by a reduction in Buildings Group activity. Fourth quarter adjusted
EBITDA and contract income declined primarily as a result of a shift in intercompany eliminations. Profit recorded in Q3
2015 as a result of intercompany projects reversed in the fourth quarter as these projects moved into later stages of
completion.

23 | SECOND QUARTER 2016 MD&A
Revenue decreased in the first quarter of 2016 compared to the fourth quarter of 2015, driven primarily by seasonal
declines in activity levels for our Industrial Group and the completion of a major project for our Buildings Group in
Manitoba that provided significant revenue in Q4 2015. First quarter adjusted EBITDA and contract income results were
negatively affected by the timing of intersegment eliminations, and adjusted EBITDA was further impacted by the
increase in our share price and the associated effect on share-based compensation expense (quarter-over-quarter net
impact of $1.2 million).
Second quarter 2016 results were negatively impacted by the Northern Alberta wildfires which disrupted Industrial Group
operations and by restructuring costs recognized in all of our groups as we aligned our cost structure for the current
economic environment. Notwithstanding these negative impacts, adjusted EBITDA improved as a result of an increase
in Buildings Group activity, a reversal of intersegment eliminations in the first quarter that did not repeat in the second
quarter, and a decrease in share-based compensation expense. The latter reflects the impact of a decrease in our share
price in the second quarter of 2016, compared to share price appreciation in the first quarter of 2016.
For a more detailed discussion and analysis of quarterly results prior to June 30, 2016, please review our 2015 and 2014
Annual and Interim Reports.
CRITICAL ACCOUNTING ESTIMATES
Our financial statements include estimates and assumptions made by management in respect to operating results,
financial condition, contingencies, commitments and related disclosures. Actual results may vary from these estimates.
The following are, in the opinion of management, the more significant estimates that have an impact on our financial
condition and results of operations:
• Convertible debentures;
• Revenue recognition;
• Estimates used to determine costs in excess of billings and contract advances;
• Estimates in impairment of property and equipment, goodwill and intangible assets;
• Estimates related to the useful lives and residual value of property and equipment;
• Income taxes;
• Provisions for warranty work and legal contingencies;
• Assumptions used in share-based payment arrangements;
• Accounts receivable collectability; and
• Measurement of defined benefit pension obligations.
The key assumptions and basis for the estimates that management has made under IFRS and their impact on the
amounts reported in the Audited Consolidated Annual Financial Statements and notes thereto, are contained in the 2015
Annual Report, Management’s Discussion and Analysis.
CHANGES IN ACCOUNTING POLICIES
Future Changes in Accounting Standards
We have reviewed new and revised accounting pronouncements that have been issued, but are not yet effective. See
Note 4 of the December 31, 2015 Audited Consolidated Annual Financial Statements for further information. We are still
evaluating the potential impact of future accounting standard changes on our financial reporting.

24 | SECOND QUARTER 2016 MD&A
FINANCIAL INSTRUMENTS
Financial instruments consist of recorded amounts of receivables and other like amounts that will result in future cash
receipts, as well as accounts payable, borrowings and any other amounts that will result in future cash outlays. The fair
value of our short-term financial assets and liabilities approximates their respective carrying amounts on the Statement
of Financial Position because of the short-term maturity of those instruments. The fair value of our interest-bearing
financial liabilities, including capital leases, financed contracts and the Revolver, also approximates their respective
carrying amounts due to the floating-rate nature of the debt.
The financial instruments we use expose us to credit, interest rate and liquidity risks. Our Board of Directors has overall
responsibility for the establishment and oversight of our risk management framework and reviews corporate policies on
an ongoing basis. We do not actively use financial derivatives, nor do we hold or use any derivative instruments for
trading or speculative purposes.
We are exposed to credit risk through accounts receivable. This risk is minimized by the number of customers in diverse
industries and geographical centres. We further mitigate this risk by performing an assessment of our customers as part
of our work procurement process, including an evaluation of financial capacity.
Allowances are provided for potential losses as at the Statement of Financial Position date. Accounts receivable are
considered for impairment on a case-by-case basis when they are past due or when objective evidence is received that
a customer will default. We take into consideration the customer’s payment history, credit worthiness and the current
economic environment in which the customer operates to assess impairment.
We establish a specific bad debt provision when we consider that the expected recovery will be less than the actual
account receivable. The provision for doubtful accounts has been included in administrative costs in the June 30, 2016
Condensed Consolidated Statements of (Loss) Earnings and Comprehensive (Loss) Earnings, and is net of any
recoveries that were provided for in a prior period. Allowance for doubtful accounts as at June 30, 2016 was $1.3 million
(December 31, 2015 - $2.6 million).
In determining the quality of trade receivables, we consider any change in credit quality of customers from the date credit
was initially granted up to the end of the reporting period. As at June 30, 2016, we had $13.7 million of trade receivables
(December 31, 2015 - $27.4 million) which were greater than 90 days past due, with $12.4 million not provided for as at
June 30, 2016 (December 31, 2015 - $24.9 million). Management is not concerned about the credit quality and
collectability of these accounts as the concentration of credit risk is limited due to its large and unrelated customer base.
The improvement from year-end 2015 is primarily the result of the resolution and collection in the first quarter of a number
of significant balances that were outstanding at December 31, 2015. Trade receivables are included in trade and other
receivables on the Condensed Consolidated Statements of Financial Position.
Financial risk is the risk to our earnings that arises from fluctuations in interest rates and the degree of volatility of these
rates. We do not use derivative instruments to reduce our exposure to this risk. At June 30, 2016, the increase or
decrease in annual net earnings for each 100 basis point change in interest rates on floating rate debt would have been
approximately $0.2 million (December 31, 2015 - $0.3 million) related to financial assets and $0.4 million (December 31,
2015 - $0.4 million) related to financial liabilities.
Liquidity risk is the risk that we will encounter difficulties in meeting our financial obligations. We manage this risk through
cash and debt management. We invest our cash with the objective of maintaining safety of principal and providing
adequate liquidity to meet all current payment obligations. We invest cash and cash equivalents with counterparties that
are of high credit quality as assessed by reputable rating agencies. Given these high credit ratings, we do not expect
any counterparties to fail to meet their obligations. In managing liquidity risk, we have access to committed short and
long-term debt facilities as well as equity markets, the availability of which is dependent on market conditions.
25 | SECOND QUARTER 2016 MD&A
Under our risk management policy, derivative financial instruments are used only for risk management purposes and not
for generating trading profits.
Please refer to Note 11 of the June 30, 2016 Condensed Consolidated Interim Financial Statements for further detail.
Disclosure Controls & Procedures
Disclosure controls and procedures are designed to provide reasonable assurance that all relevant information is
gathered and reported to senior management, including our Chief Executive Officer (“CEO”) and Chief Financial Officer
(“CFO”), on a timely basis, so that appropriate decisions can be made regarding public disclosure. The CEO and CFO
together are responsible for establishing and maintaining our disclosure controls and procedures. They are assisted in
this responsibility by the Disclosure Committee, which is comprised of members of our senior management team.
An evaluation of the effectiveness of the design of our disclosure controls and procedures was carried out under the
supervision of our management, including our CEO and CFO, with oversight by the Board of Directors and Audit
Committee, as of June 30, 2016. Based on this evaluation, our CEO and CFO have concluded that the design of our
disclosure controls and procedures as defined in NI 52-109, Certification of Disclosure in Issuers’ Annual and Interim
Filings was effective as at June 30, 2016.
Internal Controls over Financial Reporting
Internal controls over financial reporting are designed to provide reasonable assurance regarding the reliability of
financial reporting and the preparation of financial statements for external purposes in accordance with IFRS. Absolute
assurance cannot be provided that all misstatements have been detected because of inherent limitations in all control
systems. Management is responsible for establishing and maintaining adequate internal controls appropriate to the
nature and size of the business, and to provide reasonable assurance regarding the reliability of our financial reporting.
Under the oversight of the Board of Directors and our Audit Committee, our management, including our CEO and CFO,
evaluated the design of our internal controls over financial reporting using the control framework issued by the Committee
of Sponsoring Organizations of the Treadway Commission on Internal Control – Integrated Framework (2013). The
evaluation included documentation review, enquiries, testing and other procedures considered by management to be
appropriate in the circumstances. As at June 30, 2016, our CEO and CFO have concluded that the design of the internal
controls over financial reporting as defined in NI 52-109, Certification of Disclosure in Issuers’ Annual and Interim Filings
was effective.
Material Changes to Internal Controls over Financial Reporting
There were no changes to our internal controls over financial reporting and the environment in which they operated
during the period beginning on January 1, 2016 and ending on June 30, 2016 that have materially affected or are
reasonably likely to materially affect our internal controls over financial reporting.
NON-IFRS MEASURES
Throughout this MD&A certain measures are used that, while common in the construction industry, are not recognized
measures under IFRS. The measures used are “contract income margin percentage”, “work-in-hand”, “backlog”, “active
backlog”, “book-to-bill ratio”, “working capital”, “adjusted EBITDA”, “adjusted EBITDA margin”, “EBT”, “adjusted free cash
flow”, “adjusted free cash flow per share”, “Indebtedness”, “Indebtedness to Capitalization” and “Net Long-Term
Indebtedness to adjusted EBITDA”. These measures are used by our management to assist in making operating
decisions and assessing performance. They are presented in this MD&A to assist readers to assess the performance of
Stuart Olson and our business groups. While we calculate these measures consistently from period to period, they likely
will not be directly comparable to similar measures used by other companies because they do not have standardized
meanings prescribed by IFRS. Please review the discussion of these measures below.

26 | SECOND QUARTER 2016 MD&A
Contract Income Margin
Contract income margin is the percentage derived by dividing contract income by contract revenue. Contract income is
calculated by deducting all associated direct and indirect costs from contract revenue in the period.
Work-In-Hand
Work-in-hand is the unexecuted portion of work that has been contractually awarded to us for construction. It includes
an estimate of the revenue to be generated from MRO contracts during the shorter of (a) 12 months, or (b) the remaining
life of the contract.
Backlog and Active Backlog
Backlog means the total value of work, including work-in-hand, that has not yet been completed that (a) is assessed by
us as having high certainty of being performed by us or our subsidiaries by either the existence of a contract or work
order specifying job scope, value and timing, or (b) has been awarded to us or our subsidiaries, as evidenced by an
executed binding or non-binding letter of intent or agreement, describing the general job scope, value and timing of such
work, and with the finalization of a formal contract respecting such work currently assessed by us as being reasonably
assured.
Active backlog is the portion of backlog that is not work-in-hand (has not been contractually awarded to us). We provide
no assurance that clients will not choose to defer or cancel their projects in the future.
$millions Jun. 30, 2016 Dec. 31, 2015
Work-in-hand 929.3 897.2
Active backlog 1,166.8 1,063.7
Consolidated backlog 2,096.1 1,960.9
Book-to-Bill Ratio
Book-to-bill ratio means the ratio of new projects added to backlog and increases in the scope of existing projects (book)
to revenue (bill), for continuing operations for a specified period of time (excluding the impact of backlog additions from
acquisitions and reductions for divestitures). A book-to-bill ratio of above 1 implies that backlog additions were more than
revenue for the specified time period, while a ratio below 1 implies that revenue exceeded backlog additions for the
period.
Working Capital
Working capital is current assets less current liabilities. The calculation of working capital is provided in the table below:
$millions Jun. 30, 2016 Dec. 31, 2015
Current assets 313.2 319.8
Current liabilities (254.9) (255.4)
Working capital 58.3 64.4
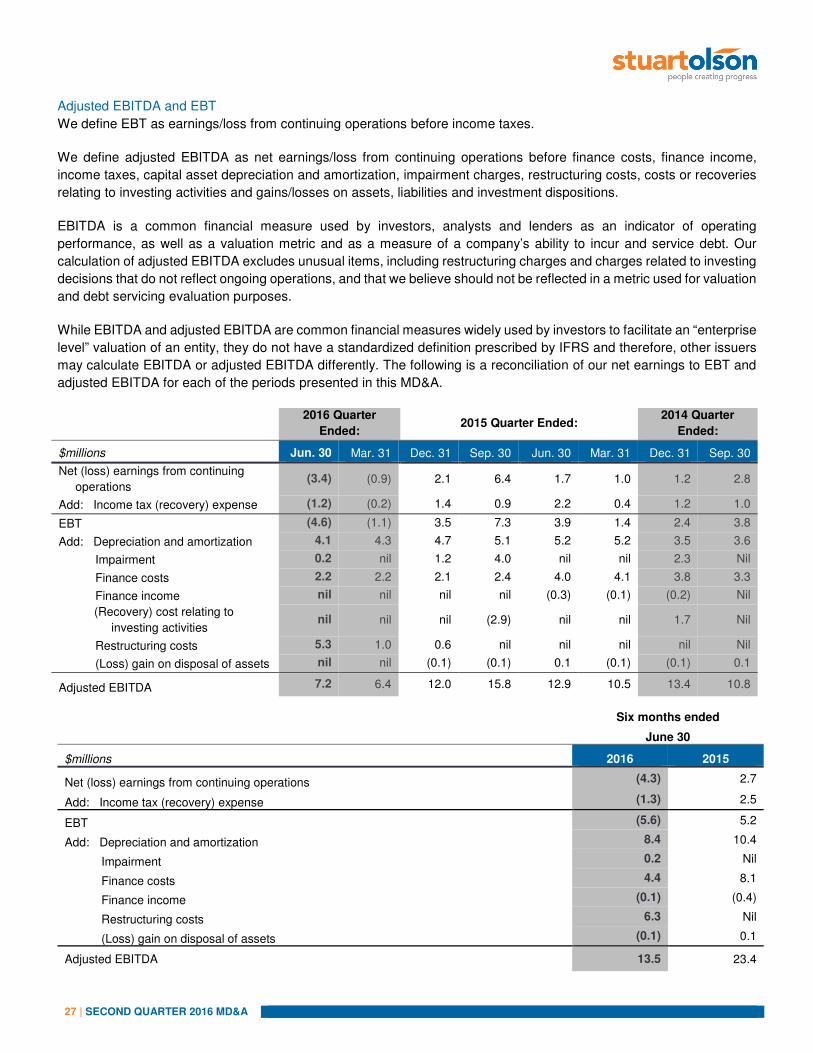
27 | SECOND QUARTER 2016 MD&A
Adjusted EBITDA and EBT
We define EBT as earnings/loss from continuing operations before income taxes.
We define adjusted EBITDA as net earnings/loss from continuing operations before finance costs, finance income,
income taxes, capital asset depreciation and amortization, impairment charges, restructuring costs, costs or recoveries
relating to investing activities and gains/losses on assets, liabilities and investment dispositions.
EBITDA is a common financial measure used by investors, analysts and lenders as an indicator of operating
performance, as well as a valuation metric and as a measure of a company’s ability to incur and service debt. Our
calculation of adjusted EBITDA excludes unusual items, including restructuring charges and charges related to investing
decisions that do not reflect ongoing operations, and that we believe should not be reflected in a metric used for valuation
and debt servicing evaluation purposes.
While EBITDA and adjusted EBITDA are common financial measures widely used by investors to facilitate an “enterprise
level” valuation of an entity, they do not have a standardized definition prescribed by IFRS and therefore, other issuers
may calculate EBITDA or adjusted EBITDA differently. The following is a reconciliation of our net earnings to EBT and
adjusted EBITDA for each of the periods presented in this MD&A.
2016 Quarter
Ended: 2015 Quarter Ended:
2014 Quarter
Ended:
$millions Jun. 30 Mar. 31 Dec. 31 Sep. 30 Jun. 30 Mar. 31 Dec. 31 Sep. 30
Net (loss) earnings from continuing
operations (3.4) (0.9) 2.1 6.4 1.7 1.0 1.2 2.8
Add: Income tax (recovery) expense (1.2) (0.2) 1.4 0.9 2.2 0.4 1.2 1.0
EBT (4.6) (1.1) 3.5 7.3 3.9 1.4 2.4 3.8
Add: Depreciation and amortization 4.1 4.3 4.7 5.1 5.2 5.2 3.5 3.6
Impairment 0.2 nil 1.2 4.0 nil nil 2.3 Nil
Finance costs 2.2 2.2 2.1 2.4 4.0 4.1 3.8 3.3
Finance income nil nil nil nil (0.3) (0.1) (0.2) Nil
(Recovery) cost relating to
investing activities nil nil nil (2.9) nil nil 1.7 Nil
Restructuring costs 5.3 1.0 0.6 nil nil nil nil Nil
(Loss) gain on disposal of assets nil nil (0.1) (0.1) 0.1 (0.1) (0.1) 0.1
Adjusted EBITDA 7.2 6.4 12.0 15.8 12.9 10.5 13.4 10.8
Six months ended
June 30
$millions 2016 2015
Net (loss) earnings from continuing operations (4.3) 2.7
Add: Income tax (recovery) expense (1.3) 2.5
EBT (5.6) 5.2
Add: Depreciation and amortization 8.4 10.4
Impairment 0.2 Nil
Finance costs 4.4 8.1
Finance income (0.1) (0.4)
Restructuring costs 6.3 Nil
(Loss) gain on disposal of assets (0.1) 0.1
Adjusted EBITDA 13.5 23.4
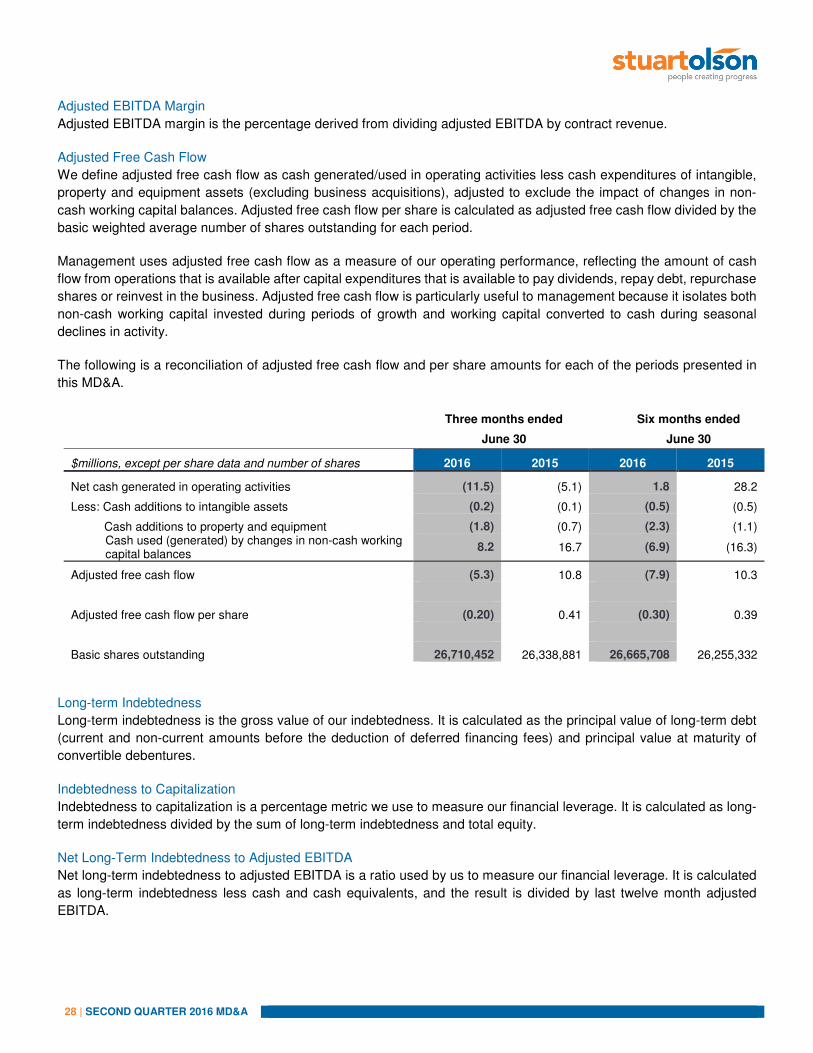
28 | SECOND QUARTER 2016 MD&A
Adjusted EBITDA Margin
Adjusted EBITDA margin is the percentage derived from dividing adjusted EBITDA by contract revenue.
Adjusted Free Cash Flow
We define adjusted free cash flow as cash generated/used in operating activities less cash expenditures of intangible,
property and equipment assets (excluding business acquisitions), adjusted to exclude the impact of changes in non-
cash working capital balances. Adjusted free cash flow per share is calculated as adjusted free cash flow divided by the
basic weighted average number of shares outstanding for each period.
Management uses adjusted free cash flow as a measure of our operating performance, reflecting the amount of cash
flow from operations that is available after capital expenditures that is available to pay dividends, repay debt, repurchase
shares or reinvest in the business. Adjusted free cash flow is particularly useful to management because it isolates both
non-cash working capital invested during periods of growth and working capital converted to cash during seasonal
declines in activity.
The following is a reconciliation of adjusted free cash flow and per share amounts for each of the periods presented in
this MD&A.
Three months ended Six months ended
June 30 June 30
$millions, except per share data and number of shares 2016 2015 2016 2015
Net cash generated in operating activities (11.5) (5.1) 1.8 28.2
Less: Cash additions to intangible assets (0.2) (0.1) (0.5) (0.5)
Cash additions to property and equipment (1.8) (0.7) (2.3) (1.1) Cash used (generated) by changes in non-cash working capital balances
8.2 16.7 (6.9) (16.3)
Adjusted free cash flow (5.3) 10.8 (7.9) 10.3
Adjusted free cash flow per share (0.20) 0.41 (0.30) 0.39
Basic shares outstanding 26,710,452 26,338,881 26,665,708 26,255,332
Long-term Indebtedness
Long-term indebtedness is the gross value of our indebtedness. It is calculated as the principal value of long-term debt
(current and non-current amounts before the deduction of deferred financing fees) and principal value at maturity of
convertible debentures.
Indebtedness to Capitalization
Indebtedness to capitalization is a percentage metric we use to measure our financial leverage. It is calculated as long-
term indebtedness divided by the sum of long-term indebtedness and total equity.
Net Long-Term Indebtedness to Adjusted EBITDA
Net long-term indebtedness to adjusted EBITDA is a ratio used by us to measure our financial leverage. It is calculated
as long-term indebtedness less cash and cash equivalents, and the result is divided by last twelve month adjusted
EBITDA.

29 | SECOND QUARTER 2016 MD&A
FORWARD-LOOKING INFORMATION
Certain information contained in this MD&A may constitute forward-looking information. All statements, other than
statements of historical fact, may be forward-looking information. This information relates to future events or our future
performance and include financial outlook or future-oriented financial information. Any financial outlook or future oriented
financial information in the MD&A has been approved by management of Stuart Olson. Such financial outlook or future
oriented financial information is provided for the purpose of providing information about management’s current
expectations and plans relating to the future. Forward-looking information is often, but not always, identified by the use
of words such as “seek”, “anticipate”, “plan”, “continue”, “estimate”, “expect”, “may", "will”, “project”, “predict”, “propose”,
“potential”, “targeting”, “intend”, “could”, “might”, “should”, “believe” and similar expressions. This information involves
known and unknown risks, uncertainties and other factors that may cause actual results or events to differ materially
from those anticipated in such forward-looking information. No assurance can be given that the information will prove to
be correct and such information should not be unduly relied upon by investors as actual results may vary significantly.
This information speaks only as of the date of this MD&A and is expressly qualified, in its entirety, by this cautionary
statement.
In particular, this MD&A contains forward-looking information, pertaining to the following:
• Our capital expenditure program for the remainder of 2016;
• Our objective to manage our capital resources so as to ensure that we have sufficient liquidity to pursue growth
objectives, while maintaining a prudent amount of financial leverage;
• Our belief that we have sufficient capital resources and liquidity, and ability to generate ongoing cash flows to
meet commitments, support operations, finance capital expenditures, support growth strategies and fund
declared dividends;
• Our outlook on the business generally and by business group, including, without limitation, those statements in
the section entitled “Outlook” relating to backlog execution, project mix and timing, earnings visibility, decreased
overall revenues in 2016 compared to 2015, decreases in overall adjusted EBITDA and adjusted EBITDA
margins for 2016, increases in Buildings Group adjusted EBITDA and adjusted EBITDA margins for 2016, new
contract awards and industrial MRO work;
• The Board’s confidence in our ability to generate sufficient operating cash flows to support management’s
business plans, including its growth strategy, while providing a certain amount of income to shareholders;
• Our estimate of the value of the five-year MSA to provide MRO services to a longstanding oil sands customer;
• Our plans to match our cost structure to our activity levels in the second half of 2016, and our expectation that
actions taken will reduce expenses in future periods;
• Our expectations as to future general economic conditions and the impact those conditions may have on the
company and our businesses including, without limitation, the reaction of oil sands owners to the recent decrease
in oil prices; and
• Our projected use of cash resources.

30 | SECOND QUARTER 2016 MD&A
With respect to forward-looking information listed above and contained in this MD&A, we have made assumptions
regarding, among other things:
• The expected performance of the global and Canadian economies and the effects thereof on our businesses;
• The continuation of challenging market conditions in Alberta due to the “lower-for-longer” oil price
environment;
• An increased percentage of our Industrial Group revenue coming from lower-risk cost-reimbursable MRO
projects;
• The ability of counterparties with whom we invest cash and equivalents to meet their obligations; • The impact of competition on our businesses;
• The global demand for oil and natural gas, its impact on commodity prices and its related effect on capital
investment projects in Western Canada; and
• Government policies.
Our actual results could differ materially from those anticipated in this forward-looking information as a result of the risk
factors set forth below:
• General global economic and business conditions including the effect, if any, of a slowdown in Western Canada
and/or a slowdown in the United States;
• Fluctuations in the price of oil, natural gas and other commodities;
• Weak capital and/or credit markets;
• Fluctuations in currency and interest rates;
• Changes in laws and regulations;
• Limited geographical scope of operations;
• Timing of client’s capital or maintenance projects;
• Dependence on the public sector;
• Competition and pricing pressures;
• Unexpected adjustments and cancellations of projects;
• Action or non-action of customers, suppliers and/or partners;
• Inadequate project execution;
• Unpredictable weather conditions;
• Erroneous or incorrect cost estimates;
• Adverse outcomes from current or pending litigation;
• Interruption of information technology systems; and
• Those other risk factors described in our most recent Annual Information Form.
The forward-looking information contained in this MD&A is made as of the date hereof and we undertake no obligation
to update or revise any forward-looking information, whether as a result of new information, future events or otherwise,
unless required by applicable securities laws.
Additional Information
Additional information regarding Stuart Olson, including our current Annual Information Form and other required
securities filings, is available on our website at www.stuartolson.com and under Stuart Olson’s SEDAR profile at
www.sedar.com.

31 | SECOND QUARTER 2016 CONDENSED CONSOLIDATED INTERIM FINANCIAL STATEMENTS
Condensed Consolidated Interim Financial Statements For the three and six month periods ended June 30, 2016 and 2015
(unaudited)
In accordance with National Instrument 51-102 released by the Canadian Securities Administrators, the Corporation is disclosing that its auditors have not reviewed the unaudited condensed consolidated interim financial statements for
the three and six month periods ended June 30, 2016 and 2015.

32 | SECOND QUARTER 2016 CONDENSED CONSOLIDATED INTERIM FINANCIAL STATEMENTS
STUART OLSON INC.Condensed Consolidated Statements of (Loss) Earnings and Comprehensive (Loss) EarningsFor the three and six month periods ended June 30, 2016 and 2015
(in thousands of Canadian dollars, except share and per share amounts)
(unaudited)
Note 2016 2015 2016 2015
Contract revenue 227,189$ 303,703$ 470,150$ 586,566$
Contract costs 205,569 272,021 425,186 529,954
Contract income 21,620 31,682 44,964 56,612
Other income 339 243 451 468
Finance income 19 298 46 378
Administrative costs (24,352) (24,332) (46,746) (44,089)
Finance costs (2,181) (4,017) (4,353) (8,136)
(Loss) earnings before tax (4,555) 3,874 (5,638) 5,233
Income tax (expense) recovery
Current income tax (4,970) (4,662) (8,976) (7,468)
Deferred income tax 6,080 2,464 10,286 4,887
1,110 (2,198) 1,310 (2,581)
Net (loss) earnings (3,445) 1,676 (4,328) 2,652
Other comprehensive (loss) earnings
Items that will not be reclassified to net (loss) earnings
Defined benefit plan actuarial (loss) gain (1,057) 499 (1,898) 204
Deferred tax recovery (expense) on other comprehensive (loss) earnings 283 (130) 508 (55)
(774) 369 (1,390) 149
Total comprehensive (loss) earnings (4,219)$ 2,045$ (5,718)$ 2,801$
(Loss) earnings per share:
Basic (loss) earnings per share 5 (0.13)$ 0.06$ (0.16)$ 0.10$
Diluted (loss) earnings per share 5 (0.13)$ 0.06$ (0.16)$ 0.10$
Weighted average common shares:
Basic 5 26,710,452 26,338,881 26,665,708 26,255,332
Diluted 5 26,710,452 26,339,609 26,665,708 26,255,698
See accompanying notes to the condensed consolidated financial statements.
Three months endedJune 30,
Six months endedJune 30,

33 | SECOND QUARTER 2016 CONDENSED CONSOLIDATED INTERIM FINANCIAL STATEMENTS
STUART OLSON INC.Condensed Consolidated Statements of Financial PositionAs at June 30, 2016 and December 31, 2015
(in thousands of Canadian dollars)
(unaudited)
June 30, December 31,Note 2016 2015
ASSETSCurrent assets
Cash and cash equivalents 34,055$ 33,667$ Trade and other receivables 235,016 215,937 Inventory 964 1,638 Prepaid expenses 3,018 3,263 Costs in excess of billings 6 38,463 58,988 Income taxes recoverable 1,622 6,264 Current portion of long-term receivable 30 30
313,168 319,787
Restricted cash - 4,172 Service provider deposit 7,845 6,799 Long-term receivable and prepaid expenses 1,909 1,944 Deferred tax asset 24,152 24,085 Property and equipment 20,568 22,281 Goodwill 214,024 214,024 Intangible assets 49,302 53,708
630,968$ 646,800$
LIABILITIESCurrent liabilities
Trade and other payables 169,660$ 178,373$ Contract advances and unearned income 6 72,244 59,698 Current portion of provisions 7 7,082 7,705 Income taxes payable 3,864 7,278 Current portion of long-term debt 2,001 2,369
254,851 255,423
Employee benefits 6,233 4,680 Provisions 7 4,445 5,670 Long-term debt 50,428 46,565 Convertible debentures 73,399 72,529 Deferred tax liability 20,056 30,782 Share-based payments 8(d) 4,645 4,652 Other liabilities 2,653 1,517
416,710 421,818
EQUITYShare capital 9(a) 141,549 140,457 Convertible debentures 4,589 4,589 Share-based payment reserve 8(a) 10,481 10,176 Contributed surplus 12,228 12,228 Retained earnings 45,411 57,532
214,258 224,982 630,968$ 646,800$
See accompanying notes to the condensed consolidated financial statements.

34 | SECOND QUARTER 2016 CONDENSED CONSOLIDATED INTERIM FINANCIAL STATEMENTS
STUART OLSON INC.Condensed Consolidated Statements of Changes in EquityFor the six month periods ended June 30, 2016 and 2015(in thousands of Canadian dollars)(unaudited)
Share-BasedShare Convertible Payment Contributed Retained Total
Note Capital Debentures Reserve Surplus Earnings EquityBalance at December 31, 2015 140,457$ 4,589$ 10,176$ 12,228$ 57,532$ 224,982$ Net loss (4,328) (4,328) Other comprehensive loss: Defined benefit plan actuarial loss, net of tax (1,390) (1,390) Total comprehensive loss (5,718) (5,718)
Transactions recorded directly to equityShare-based compensation expense under stock option plan 8(a) 305 305 Dividends 9(a,b) 1,092 (6,403) (5,311) Balance at June 30, 2016 141,549$ 4,589$ 10,481$ 12,228$ 45,411$ 214,258$
Balance at December 31, 2014 131,724$ 11,689$ 9,341$ 5,128$ 58,739$ 216,621$ Net earnings 2,652 2,652 Other comprehensive loss: Defined benefit plan actuarial loss, net of tax 149 149 Total comprehensive earnings 2,801 2,801
Transactions recorded directly to equityShare-based compensation expense under stock option plan 402 402 Common shares issued related to acquisition 6,631 6,631 Dividends 1,080 (6,312) (5,232) Balance at June 30, 2015 139,435$ 11,689$ 9,743$ 5,128$ 55,228$ 221,223$ See accompanying notes to the condensed consolidated financial statements.

35 | SECOND QUARTER 2016 CONDENSED CONSOLIDATED INTERIM FINANCIAL STATEMENTS
STUART OLSON INC.Condensed Consolidated Statements of Cash FlowFor the six month periods ended June 30, 2016 and 2015
(in thousands of Canadian dollars)
(unaudited)
June 30, June 30,
Note 2016 2015
OPERATING ACTIVITIES
Net (loss) earnings (4,328)$ 2,652$
Gain on disposal of assets (22) (3)
Depreciation and amortization 8,413 10,388 Impairment loss on property and equipment 177 - Share-based compensation expense 8(e) 2,202 1,701
Defined benefit pension plan expense 630 647
Finance costs 4,353 8,136
Income tax (recovery) expense (1,310) 2,581
Change in long-term prepaid expenses 35 (900)
Change in provisions (1,848) 1,088
Change in other long-term liabilities 1,136 -
Change in non-cash working capital balances 10 6,868 16,243
Cash generated in operating activities 16,306 42,533
Payment of share-based payment liability (2,596) (993)
Contributions to defined benefit pension plan (975) (1,247)
Interest paid (3,226) (5,537)
Income taxes paid (7,747) (6,577)
Net cash generated in operating activities 1,762 28,179
INVESTING ACTIVITIES
Acquisition of Studon - (62,335)
Proceeds on disposal of assets 388 613
Additions to intangible assets (482) (483)
Additions to property and equipment (2,341) (1,142)
Net cash used in investing activities (2,435) (63,347)
FINANCING ACTIVITIES
Change in service provider deposit (1,046) (605)
Proceeds of long-term debt 204,000 70,000
Repayment of long-term debt (200,777) (12,045) Repayment of 2010 convertible debentures - (86,250) Transaction fees on convertible debentures - (4)
Dividend paid 9(b) (5,288) (5,076)
Net cash used in financing activities (3,111) (33,980)
Decrease in cash and cash equivalents during the period (3,784) (69,148) Cash and cash equivalents, beginning of the period 37,839 104,113 Cash and cash equivalents, end of the period 34,055$ 34,965$
See accompanying notes to the condensed consolidated financial statements.

Notes to the Condensed Consolidated Financial Statements For the three and six month periods ended June 30, 2016 and 2015 (in thousands of Canadian dollars, except share and per share amounts) (unaudited)
36 | SECOND QUARTER 2016 CONDENSED CONSOLIDATED INTERIM FINANCIAL STATEMENTS
1. REPORTING ENTITY
Stuart Olson Inc. was incorporated on August 31, 1981 under the Companies Act of Alberta and was continued under the Business Corporations Act (Alberta) on July 30, 1985. The principal activities of Stuart Olson Inc. and its subsidiaries (collectively, the Corporation) are to provide general contracting and electrical building systems contracting in the institutional and commercial construction markets, as well as electrical, mechanical and specialty trades, such as insulation, cladding and asbestos abatement, in the industrial construction and services market. The Corporation provides its services to a wide array of clients in the public, private and industrial sectors within Canada.
The Corporation’s head office and its principal address is #600, 4820 Richard Road S.W., Calgary, Alberta, Canada, T3E 6L1. The registered and records office of the Corporation is located at #3700, 400 – 3rd Avenue, S.W., Calgary, Alberta, Canada, T2P 4H2.
2. BASIS OF PRESENTATION AND SUMMARY OF SIGNIFICANT ACCOUNTING POLICIES
(a) Statement of Compliance
These condensed consolidated interim financial statements have been prepared in accordance with IAS 34, Interim Financial Reporting, as issued by the International Accounting Standards Board (IASB).
These unaudited condensed consolidated interim financial statements were approved by the Corporation’s Board of Directors on August 9, 2016.
(b) Summary of Significant Accounting Policies
These condensed consolidated interim financial statements have been prepared using the same accounting policies and methods of computation as the annual audited consolidated financial statements of the Corporation for the period ended December 31, 2015. The disclosure contained in these condensed consolidated interim financial statements does not include all of the requirements in IAS 1, “Presentation of Financial Statements.” Accordingly, these interim financial statements should be read in conjunction with the annual audited consolidated financial statements for the period ended December 31, 2015.

Notes to the Condensed Consolidated Financial Statements For the three and six month periods ended June 30, 2016 and 2015 (in thousands of Canadian dollars, except share and per share amounts) (unaudited)
37 | SECOND QUARTER 2016 CONDENSED CONSOLIDATED INTERIM FINANCIAL STATEMENTS
3. SEGMENTS
The Corporation operates as a construction and maintenance services provider, primarily in Western Canada. The Corporation divides its operations into four reporting segments and reports its results under the categories of: Industrial Group, Buildings Group, Commercial Systems Group and Corporate Group. The accounting policies and practices for each of the segments are the same as those described in Note 3 of the audited annual consolidated financial statements for the period ended December 31, 2015. Segment capital expenditures are the total costs incurred during the period to acquire property and equipment and intangible assets. A significant customer is one that represents 10% or more of contract revenue earned during the period. For the six month period ended June 30, 2016, the Corporation had revenue of $48,990 from one significant customer of the Industrial Group (June 30, 2015 – no significant customers), and revenue of $56,803 from one significant customer of the Buildings Group (June 30, 2015 – $88,853 from one significant customer).
Three month period ended Industrial BuildingsCommercial
Systems Corporate Intersegment
June 30, 2016 Group Group Group Group Eliminations Total
Contract revenue 73,738$ 107,801$ 51,310$ -$ (5,660)$ 227,189$
Adjusted EBITDA (1) (2) 2,403 4,213 2,627 (2,165) 92 7,170
Finance income - (5) 1 (15) - (19)
Finance costs 26 - - 2,155 - 2,181
Depreciation and amortization 1,450 445 383 1,806 55 4,139
Impairment loss on property and equipment - 177 - - - 177
Restructuring costs (3) 857 3,686 700 - - 5,243
Loss (gain) on sale of assets 18 - (14) - - 4
Earnings (loss) before tax 52$ (90)$ 1,557$ (6,111)$ 37$ (4,555)$
Income tax recovery 1,110
Net loss (3,445)$
Goodwill and intangible assets 56,155$ 121,423$ 70,079$ 15,669$ -$ 263,326$
Capital and intangible expenditures 213$ 25$ 1,561$ 278$ -$ 2,077$
Total assets 199,418$ 312,585$ 138,909$ 333,419$ (353,363)$ 630,968$ Total liabilities 50,228$ 193,183$ 51,585$ 145,122$ (23,408)$ 416,710$
Three month period ended Industrial BuildingsCommercial
Systems Corporate IntersegmentJune 30, 2015 Group Group Group Group Eliminations Total
Contract revenue 106,844$ 142,828$ 63,932$ -$ (9,901)$ 303,703$
Adjusted EBITDA (1) (2) 8,490 4,172 4,338 (6,638) 2,508 12,870
Finance income - (222) - (76) - (298)
Finance costs 66 3 - 3,948 - 4,017
Depreciation and amortization 2,567 337 438 1,820 49 5,211
(Gain) loss on sale of assets (54) 130 (10) - - 66
Earnings (loss) before tax 5,911 3,924 3,910 (12,330) 2,459 3,874$
Income tax expense (2,198)
Net earnings 1,676$
Goodwill and intangible assets 63,105$ 123,255$ 73,080$ 17,345$ -$ 276,785$
Capital and intangible expenditures 485$ 16$ 201$ 81$ -$ 783$
Total assets 187,504$ 387,875$ 152,150$ 391,973$ (357,005)$ 762,497$ Total liabilities 64,377$ 266,888$ 68,288$ 167,028$ (25,307)$ 541,274$ (1) While EBITDA and adjusted EBITDA are common financial measures widely used by investors to facilitate an “enterprise level” valuation of an entity, they do not have a standardized definition prescribed by IFRS, and therefore other issuers may calculate EBITDA and adjusted EBITDA differently.(2) During the period ended June 30, 2016, the use of adjusted EBITDA was adopted and certain comparative amounts have been restated. The Corporation defines adjusted EBITDA as net earnings/loss from continuing operations before finance income, finance costs, income taxes, capital asset depreciation and amortization, impairment charges, restructuring costs, costs or recoveries relating to investing activities and gains/losses on assets, liabilities and investment dispositions. (3) Refer to Note 7 for more information on restructuring costs.
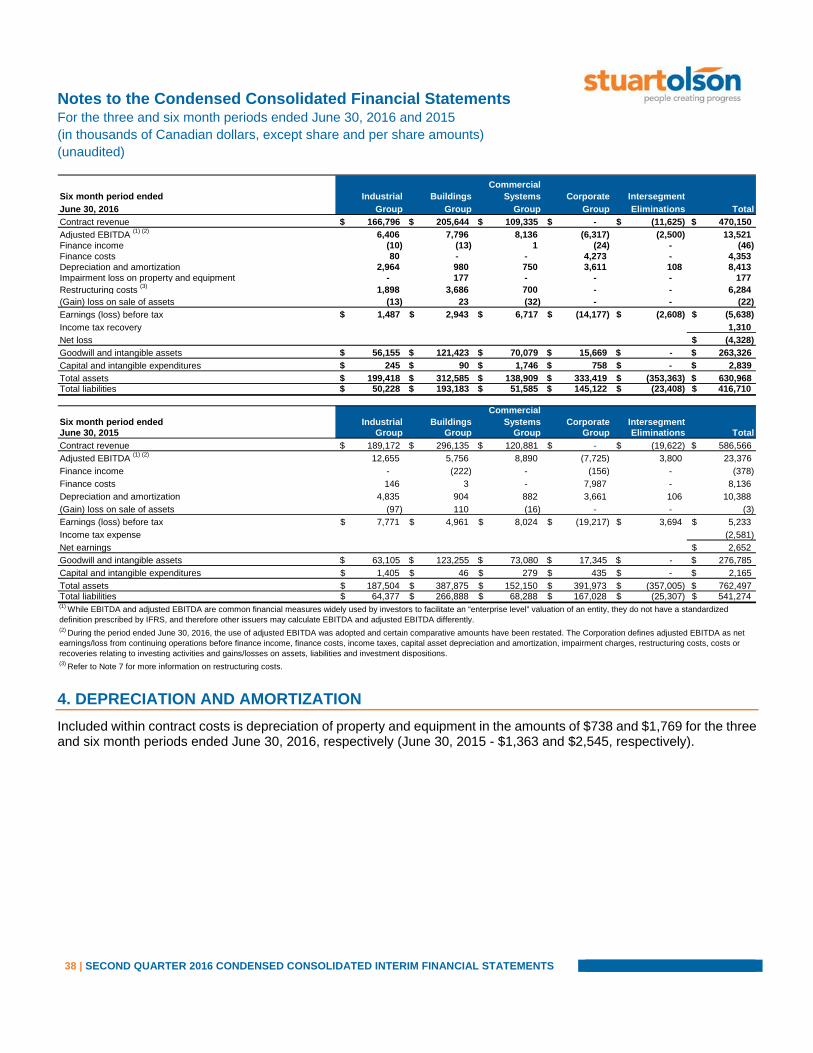
Notes to the Condensed Consolidated Financial Statements For the three and six month periods ended June 30, 2016 and 2015 (in thousands of Canadian dollars, except share and per share amounts) (unaudited)
38 | SECOND QUARTER 2016 CONDENSED CONSOLIDATED INTERIM FINANCIAL STATEMENTS
4. DEPRECIATION AND AMORTIZATION
Included within contract costs is depreciation of property and equipment in the amounts of $738 and $1,769 for the three and six month periods ended June 30, 2016, respectively (June 30, 2015 - $1,363 and $2,545, respectively).
Six month period ended Industrial BuildingsCommercial
Systems Corporate Intersegment
June 30, 2016 Group Group Group Group Eliminations Total
Contract revenue 166,796$ 205,644$ 109,335$ -$ (11,625)$ 470,150$
Adjusted EBITDA (1) (2) 6,406 7,796 8,136 (6,317) (2,500) 13,521 Finance income (10) (13) 1 (24) - (46) Finance costs 80 - - 4,273 - 4,353 Depreciation and amortization 2,964 980 750 3,611 108 8,413 Impairment loss on property and equipment - 177 - - - 177 Restructuring costs (3) 1,898 3,686 700 - - 6,284 (Gain) loss on sale of assets (13) 23 (32) - - (22)
Earnings (loss) before tax 1,487$ 2,943$ 6,717$ (14,177)$ (2,608)$ (5,638)$
Income tax recovery 1,310
Net loss (4,328)$
Goodwill and intangible assets 56,155$ 121,423$ 70,079$ 15,669$ -$ 263,326$
Capital and intangible expenditures 245$ 90$ 1,746$ 758$ -$ 2,839$
Total assets 199,418$ 312,585$ 138,909$ 333,419$ (353,363)$ 630,968$ Total liabilities 50,228$ 193,183$ 51,585$ 145,122$ (23,408)$ 416,710$
Six month period ended Industrial BuildingsCommercial
Systems Corporate IntersegmentJune 30, 2015 Group Group Group Group Eliminations Total
Contract revenue 189,172$ 296,135$ 120,881$ -$ (19,622)$ 586,566$
Adjusted EBITDA (1) (2) 12,655 5,756 8,890 (7,725) 3,800 23,376
Finance income - (222) - (156) - (378)
Finance costs 146 3 - 7,987 - 8,136
Depreciation and amortization 4,835 904 882 3,661 106 10,388
(Gain) loss on sale of assets (97) 110 (16) - - (3)
Earnings (loss) before tax 7,771$ 4,961$ 8,024$ (19,217)$ 3,694$ 5,233$
Income tax expense (2,581)
Net earnings 2,652$
Goodwill and intangible assets 63,105$ 123,255$ 73,080$ 17,345$ -$ 276,785$
Capital and intangible expenditures 1,405$ 46$ 279$ 435$ -$ 2,165$
Total assets 187,504$ 387,875$ 152,150$ 391,973$ (357,005)$ 762,497$ Total liabilities 64,377$ 266,888$ 68,288$ 167,028$ (25,307)$ 541,274$
(3) Refer to Note 7 for more information on restructuring costs.
(1) While EBITDA and adjusted EBITDA are common financial measures widely used by investors to facilitate an “enterprise level” valuation of an entity, they do not have a standardized definition prescribed by IFRS, and therefore other issuers may calculate EBITDA and adjusted EBITDA differently.(2) During the period ended June 30, 2016, the use of adjusted EBITDA was adopted and certain comparative amounts have been restated. The Corporation defines adjusted EBITDA as net earnings/loss from continuing operations before finance income, finance costs, income taxes, capital asset depreciation and amortization, impairment charges, restructuring costs, costs or recoveries relating to investing activities and gains/losses on assets, liabilities and investment dispositions.

Notes to the Condensed Consolidated Financial Statements For the three and six month periods ended June 30, 2016 and 2015 (in thousands of Canadian dollars, except share and per share amounts) (unaudited)
39 | SECOND QUARTER 2016 CONDENSED CONSOLIDATED INTERIM FINANCIAL STATEMENTS
5. EARNINGS PER SHARE
(a) Basic (loss) earnings per share
(b) Diluted (loss) earnings per share
For the three and six month periods ended June 30, 2016, 2,078,141 stock options were excluded and no incremental shares related to convertible debentures were included in the diluted weighted average number of common shares calculation, as the impact of potential common shares are considered anti-dilutive when the Corporation is in a net loss position. As such, the diluted weighted average number of common shares and resulting diluted loss per share are the same amounts as calculated under basic loss per share.
For the three and six month periods ended June 30, 2015, 1,943,090 stock options were excluded and no incremental shares related to convertible debentures were included in the diluted weighted average number of common shares calculation, as their effect would have been anti-dilutive.
2016 2015 2016 2015Net (loss) earnings - basic (3,445)$ 1,676$ (4,328)$ 2,652$
Issued common shares, beginning of the period 26,635,711 26,245,906 26,532,482 25,054,310
Effect of shares issued related to Dividend Reinvestment Plan (DRIP) 74,741 92,975 133,226 128,413
Effect of shares issued related to acquisition - - - 1,072,609 Weighted average number of common shares for the period - basic 26,710,452 26,338,881 26,665,708 26,255,332
Basic (loss) earnings per share (0.13)$ 0.06$ (0.16)$ 0.10$
Three months endedJune 30,
Six months endedJune 30,
2016 2015 2016 2015Net (loss) earnings - diluted (3,445)$ 1,676$ (4,328)$ 2,652$
Weighted average number of common shares - basic 26,710,452 26,338,881 26,665,708 26,255,332
Incremental shares - stock options - 728 - 366 Weighted average number of common shares for the period - diluted 26,710,452 26,339,609 26,665,708 26,255,698
Diluted (loss) earnings per share (0.13)$ 0.06$ (0.16)$ 0.10$
Three months endedJune 30,
Six months endedJune 30,

Notes to the Condensed Consolidated Financial Statements For the three and six month periods ended June 30, 2016 and 2015 (in thousands of Canadian dollars, except share and per share amounts) (unaudited)
40 | SECOND QUARTER 2016 CONDENSED CONSOLIDATED INTERIM FINANCIAL STATEMENTS
6. CONSTRUCTION AND NON-CONSTRUCTION CONTRACTS
Contracts in progress:
Recognized and included on the condensed consolidated statements of financial position:
At June 30, 2016, holdbacks for contract work amounted to $70,442 (December 31, 2015 - $66,472).
7. PROVISIONS
Provisions are recognized when the Corporation has a settlement amount as a result of a past event, it is probable that the Corporation will be required to settle the obligation and a reliable estimate of the obligation can be made. Reversals of provisions are made when new information arises in the period which leads management to conclude that the provisions are not necessary.
June 30, December 31,
2016 2015
Construction costs incurred plus recognized profits less recognized losses to date 2,509,889$ 4,277,440$
Less: progress billings (2,547,834) (4,285,360)
Net over billings on construction contracts (37,945) (7,920)
Non-construction costs incurred plus recognized profits less recognized losses to date 174,447$ 276,184$
Less: progress billings (170,283) (268,974)
Net under billings on non-construction contracts 4,164 7,210 Total net contract position (33,781)$ (710)$
June 30, December 31,2016 2015
Costs in excess of billings - Construction contracts 32,699$ 51,049$ Costs in excess of billings - Non-construction contracts 5,764 7,939 Total costs in excess of billings 38,463 58,988
Contract advances and unearned income - Construction contracts (70,644)$ (58,969)$ Contract advances and unearned income - Non-construction contracts (1,600) (729) Total contract advances and unearned income (72,244) (59,698) Total net contract position (33,781)$ (710)$
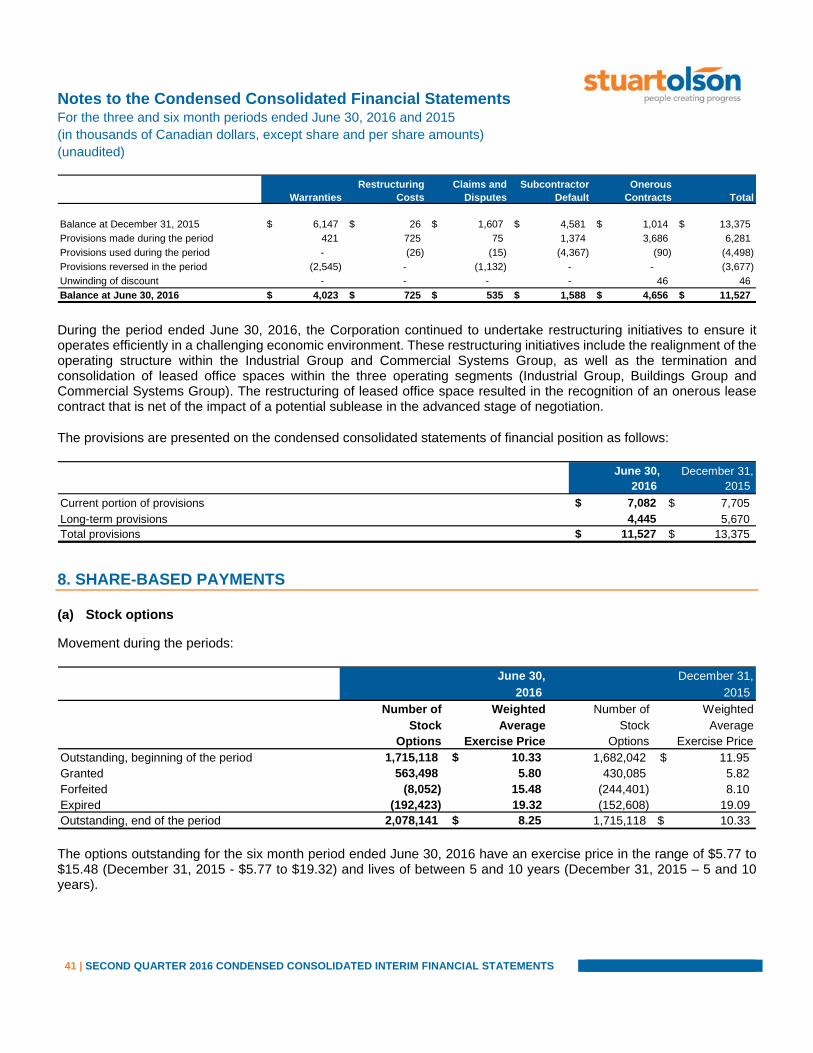
Notes to the Condensed Consolidated Financial Statements For the three and six month periods ended June 30, 2016 and 2015 (in thousands of Canadian dollars, except share and per share amounts) (unaudited)
41 | SECOND QUARTER 2016 CONDENSED CONSOLIDATED INTERIM FINANCIAL STATEMENTS
During the period ended June 30, 2016, the Corporation continued to undertake restructuring initiatives to ensure it operates efficiently in a challenging economic environment. These restructuring initiatives include the realignment of the operating structure within the Industrial Group and Commercial Systems Group, as well as the termination and consolidation of leased office spaces within the three operating segments (Industrial Group, Buildings Group and Commercial Systems Group). The restructuring of leased office space resulted in the recognition of an onerous lease contract that is net of the impact of a potential sublease in the advanced stage of negotiation.
The provisions are presented on the condensed consolidated statements of financial position as follows:
8. SHARE-BASED PAYMENTS
(a) Stock options
Movement during the periods:
The options outstanding for the six month period ended June 30, 2016 have an exercise price in the range of $5.77 to $15.48 (December 31, 2015 - $5.77 to $19.32) and lives of between 5 and 10 years (December 31, 2015 – 5 and 10 years).
WarrantiesRestructuring
CostsClaims and
DisputesSubcontractor
DefaultOnerous
Contracts Total
Balance at December 31, 2015 6,147$ 26$ 1,607$ 4,581$ 1,014$ 13,375$
Provisions made during the period 421 725 75 1,374 3,686 6,281
Provisions used during the period - (26) (15) (4,367) (90) (4,498)
Provisions reversed in the period (2,545) - (1,132) - - (3,677)
Unwinding of discount - - - - 46 46
Balance at June 30, 2016 4,023$ 725$ 535$ 1,588$ 4,656$ 11,527$
June 30, December 31,2016 2015
Current portion of provisions 7,082$ 7,705$
Long-term provisions 4,445 5,670 Total provisions 11,527$ 13,375$
June 30, December 31,2016 2015
Number of Weighted Number of WeightedStock Average Stock Average
Options Exercise Price Options Exercise PriceOutstanding, beginning of the period 1,715,118 10.33$ 1,682,042 11.95$ Granted 563,498 5.80 430,085 5.82 Forfeited (8,052) 15.48 (244,401) 8.10 Expired (192,423) 19.32 (152,608) 19.09 Outstanding, end of the period 2,078,141 8.25$ 1,715,118 10.33$
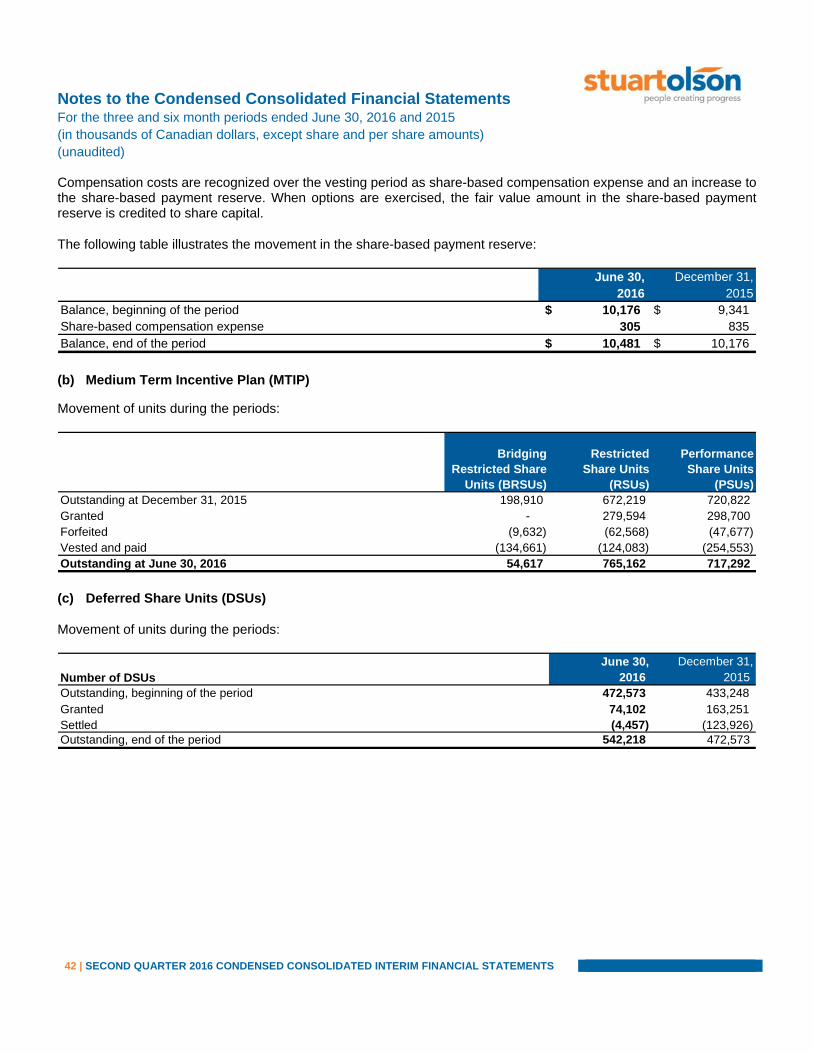
Notes to the Condensed Consolidated Financial Statements For the three and six month periods ended June 30, 2016 and 2015 (in thousands of Canadian dollars, except share and per share amounts) (unaudited)
42 | SECOND QUARTER 2016 CONDENSED CONSOLIDATED INTERIM FINANCIAL STATEMENTS
Compensation costs are recognized over the vesting period as share-based compensation expense and an increase to the share-based payment reserve. When options are exercised, the fair value amount in the share-based payment reserve is credited to share capital.
The following table illustrates the movement in the share-based payment reserve:
(b) Medium Term Incentive Plan (MTIP)
Movement of units during the periods:
(c) Deferred Share Units (DSUs)
Movement of units during the periods:
June 30, December 31,2016 2015
Balance, beginning of the period 10,176$ 9,341$ Share-based compensation expense 305 835 Balance, end of the period 10,481$ 10,176$
Bridging Restricted Share
Units (BRSUs)
Restricted Share Units
(RSUs)
Performance Share Units
(PSUs) Outstanding at December 31, 2015 198,910 672,219 720,822 Granted - 279,594 298,700 Forfeited (9,632) (62,568) (47,677) Vested and paid (134,661) (124,083) (254,553) Outstanding at June 30, 2016 54,617 765,162 717,292
June 30, December 31,Number of DSUs 2016 2015Outstanding, beginning of the period 472,573 433,248 Granted 74,102 163,251 Settled (4,457) (123,926) Outstanding, end of the period 542,218 472,573

Notes to the Condensed Consolidated Financial Statements For the three and six month periods ended June 30, 2016 and 2015 (in thousands of Canadian dollars, except share and per share amounts) (unaudited)
43 | SECOND QUARTER 2016 CONDENSED CONSOLIDATED INTERIM FINANCIAL STATEMENTS
(d) Share-based payment liability
Included in trade and other payables is the current portion of the MTIPs to be paid out within the next 12 months. The long-term portion of MTIPs and DSUs of $4,645 at June 30, 2016 (December 31, 2015 – $4,652) is classified as share-based payments on the condensed consolidated statements of financial position. The total intrinsic value reflects all of the outstanding DSUs and vested MTIPs as at June 30, 2016.
(e) Share-based compensation expense
9. SHARE CAPITAL
(a) Common shares and preferred shares
The Corporation’s common shares have no par value and the authorized share capital is comprised of an unlimited number of common shares and an unlimited number of preferred shares issuable in series with rights set by the Directors.
On January 6, 2015, the Corporation issued 1,103,081 common shares at a share price of $6.01 as part of the Studon acquisition.
June 30, December 31,2016 2015
Carrying amount of liabilities for cash-settled arrangementsCurrent portion 1,431$ 2,070$ Long-term portion 4,645 4,652
Total carrying amount 6,076$ 6,722$
Total intrinsic value of liability for vested benefits 3,337$ 2,812$
2016 2015 2016 2015Share-based compensation expense on stock options 156$ 218$ 305$ 402$ Effects of changes in fair value and accretion of MTIP grants 34 1,723 1,400 1,139 Effects of changes in fair value and grants for DSUs (273) 909 497 160
(83)$ 2,850$ 2,202$ 1,701$
Three months endedJune 30,
Six months endedJune 30,
June 30, December 31,2016 2015
Shares Share Capital Shares Share CapitalCommon SharesIssued, beginning of the period 26,532,482 140,457$ 25,054,310 131,724$ DRIP 190,427 1,092 375,091 2,102 Issued during the period - - 1,103,081 6,631 Issued, end of the period 26,722,909 141,549$ 26,532,482 140,457$

Notes to the Condensed Consolidated Financial Statements For the three and six month periods ended June 30, 2016 and 2015 (in thousands of Canadian dollars, except share and per share amounts) (unaudited)
44 | SECOND QUARTER 2016 CONDENSED CONSOLIDATED INTERIM FINANCIAL STATEMENTS
(b) Common shares and dividends
As at June 30, 2016, trade and other payables included $3,207 (December 31, 2015 - $3,184) related to the dividend payable on July 14, 2016, of which $563 (December 31, 2015 - $537) is to be reinvested in common shares under the DRIP and the remainder paid in cash.
10. CHANGE IN NON-CASH WORKING CAPITAL BALANCES RELATING TO OPERATIONS
11. FINANCIAL INSTRUMENTS
(a) Carrying values
June 30, December 31,2016 2015
Per Share Total Per Share TotalDividend payable, beginning of the period 0.12$ 3,184$ 0.12$ 3,007$ Total dividends declared during the period 0.24 6,403 0.48 12,668 Total dividends paid during the period (1) (0.24) (6,380) (0.48) (12,491) Dividend payable, end of the period 0.12$ 3,207$ 0.12$ 3,184$ (1) Includes DRIP non-cash payments totaling $1,092 (December 31, 2015 - $2,102) which are recorded through share capital.
2016 2015Trade and other receivables (19,079)$ 17,556$
Inventory 674 224
Prepaid expenses 245 (279)
Costs in excess of billings 20,525 21,393
Trade and other payables (8,043) (33,541)
Contract advances and unearned income 12,546 10,890
6,868$ 16,243$
Six months endedJune 30,
June 30, December 31,2016 2015
Financial assets:Cash and cash equivalents, including restricted cash 34,055$ 37,839$ Trade and other receivables 235,016 215,937 Service provider deposit 7,845 6,799 Long-term receivable, including current portion 305 355
Financial liabilities:Trade and other payables 169,660$ 178,373$ Long-term debt, including current portion 52,429 48,934 Convertible debentures - debt component 73,399 72,529

Notes to the Condensed Consolidated Financial Statements For the three and six month periods ended June 30, 2016 and 2015 (in thousands of Canadian dollars, except share and per share amounts) (unaudited)
45 | SECOND QUARTER 2016 CONDENSED CONSOLIDATED INTERIM FINANCIAL STATEMENTS
(b) Financial risk management
(i) Credit risk
The Corporation invests its cash with the objective of maintaining safety of principal and providing adequate liquidity to meet all current payment obligations. The Corporation invests its cash and cash equivalents with counterparties that it believes are of high credit quality as assessed by reputable rating agencies. Given these high credit ratings, the Corporation does not expect any counterparties holding these cash equivalents to fail to meet their obligations.
The Corporation assesses trade and other receivables for impairment on a case-by-case basis when they are past due or when objective evidence is received that a customer will default. The Corporation takes into consideration the customer’s payment history, credit worthiness and the current economic environment in which the customer operates to assess impairment.
Prior to accepting new customers, the Corporation assesses the customer’s credit quality and establishes the customer’s credit limit. The Corporation accounts for specific bad debt provisions when management considers that the expected recovery is less than the actual amount of the accounts receivable.
The provision for doubtful accounts has been included in administrative costs on the condensed consolidated statements of (loss) earnings and is net of any recoveries that were provided for in a prior period.
The following table represents the movement in the allowance for doubtful accounts:
Trade receivables shown on the condensed consolidated statements of financial position include the following amounts that are current and past due at the end of the reporting period. The Corporation does not hold any collateral over these balances. The terms and conditions established with individual customers determine whether or not the receivable is past due.
June 30, December 31,2016 2015
Balance, beginning of the period 2,558$ 2,140$ Impairment losses recognized on receivables 211 1,005 Amounts written off during the period as uncollectible (71) (587) Amounts recovered during the period (1,419) - Balance, end of the period 1,279$ 2,558$
June 30, December 31,2016 2015
Current 119,836$ 67,647$ 1-60 days past due 25,098 48,810 61-90 days past due 2,476 4,224 More than 90 days past due 13,702 27,448
161,112$ 148,129$
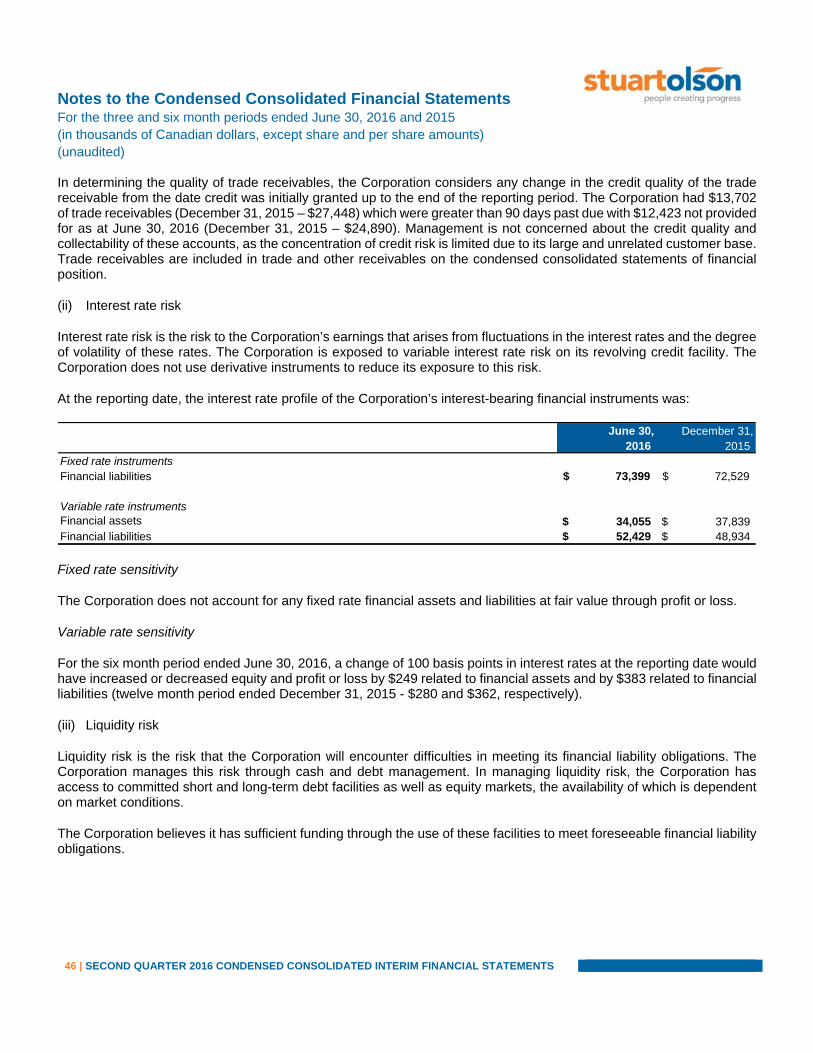
Notes to the Condensed Consolidated Financial Statements For the three and six month periods ended June 30, 2016 and 2015 (in thousands of Canadian dollars, except share and per share amounts) (unaudited)
46 | SECOND QUARTER 2016 CONDENSED CONSOLIDATED INTERIM FINANCIAL STATEMENTS
In determining the quality of trade receivables, the Corporation considers any change in the credit quality of the trade receivable from the date credit was initially granted up to the end of the reporting period. The Corporation had $13,702 of trade receivables (December 31, 2015 – $27,448) which were greater than 90 days past due with $12,423 not provided for as at June 30, 2016 (December 31, 2015 – $24,890). Management is not concerned about the credit quality and collectability of these accounts, as the concentration of credit risk is limited due to its large and unrelated customer base. Trade receivables are included in trade and other receivables on the condensed consolidated statements of financial position.
(ii) Interest rate risk
Interest rate risk is the risk to the Corporation’s earnings that arises from fluctuations in the interest rates and the degree of volatility of these rates. The Corporation is exposed to variable interest rate risk on its revolving credit facility. The Corporation does not use derivative instruments to reduce its exposure to this risk.
At the reporting date, the interest rate profile of the Corporation’s interest-bearing financial instruments was:
Fixed rate sensitivity
The Corporation does not account for any fixed rate financial assets and liabilities at fair value through profit or loss.
Variable rate sensitivity
For the six month period ended June 30, 2016, a change of 100 basis points in interest rates at the reporting date would have increased or decreased equity and profit or loss by $249 related to financial assets and by $383 related to financial liabilities (twelve month period ended December 31, 2015 - $280 and $362, respectively).
(iii) Liquidity risk
Liquidity risk is the risk that the Corporation will encounter difficulties in meeting its financial liability obligations. The Corporation manages this risk through cash and debt management. In managing liquidity risk, the Corporation has access to committed short and long-term debt facilities as well as equity markets, the availability of which is dependent on market conditions.
The Corporation believes it has sufficient funding through the use of these facilities to meet foreseeable financial liability obligations.
June 30, December 31,2016 2015
Fixed rate instrumentsFinancial liabilities 73,399$ 72,529$
Variable rate instrumentsFinancial assets 34,055$ 37,839$ Financial liabilities 52,429$ 48,934$

Notes to the Condensed Consolidated Financial Statements For the three and six month periods ended June 30, 2016 and 2015 (in thousands of Canadian dollars, except share and per share amounts) (unaudited)
47 | SECOND QUARTER 2016 CONDENSED CONSOLIDATED INTERIM FINANCIAL STATEMENTS
The following are the contractual obligations, including interest payments as at June 30, 2016, in respect of the financial obligations of the Corporation. Interest payments on the revolving credit facility have not been included in the table below since they are subject to variability based upon outstanding balances at various points throughout the period.
12. CAPITAL MANAGEMENT
The Corporation’s objectives in managing capital are to ensure sufficient liquidity to pursue growth objectives and fund the payment of dividends, while maintaining a prudent amount of financial leverage.
The Corporation’s capital is comprised of equity and long-term indebtedness. The Corporation’s primary uses of capital are to finance operations, execute upon its growth strategies and to fund capital expenditure programs.
The Corporation intends to maintain a flexible capital structure consistent with the objectives stated above and to respond to changes in economic conditions and the risk characteristics of underlying assets. In order to maintain or adjust its capital structure, the Corporation may issue new shares, raise debt or refinance existing debt with different characteristics.
The primary non-IFRS measures used by the Corporation to monitor its financial leverage are its ratios of long-term indebtedness to capitalization and net long-term indebtedness to adjusted EBITDA. Adjusted EBITDA is described in further detail in Note 3.
Over the long-term, the Corporation strives to maintain a target long-term indebtedness to capitalization percentage in the range of 20% to 40%, calculated as follows:
Carrying amount
Contractual cash flows
Not later than 1 year
Later than 1 year and less than 3
years
Later than 3 years and less
than 5 yearsLater than 5
yearsTrade and other payables 169,660$ 169,660$ 169,660$ - $ - $ - $
Provisions, including current portion 11,527 14,568 7,355 2,024 1,429 3,760
Convertible debentures (debt portion) 73,399 97,405 4,830 9,660 82,915 -
Long-term debt, including current portion 52,429 54,577 2,081 248 52,248 -
Operating lease commitments - 58,775 8,284 13,783 13,782 22,926
307,015$ 394,985$ 192,210$ 25,715$ 150,374$ 26,686$
Long-term indebtedness:
Long-term debt, principal amount (1) 54,476$ 51,237$
Convertible debentures, principal amount (2) 80,500 80,500
Total long-term indebtedness 134,976 131,737
Total equity 214,258 224,982
Total capitalization 349,234$ 356,719$
Indebtedness to capitalization percentage 39% 37%
December 31, 2015
June 30, 2016
(1) Principal amount of current and non-current long-term debt before the deduction of deferred financing fees. (2) Includes the maturity value of the convertible debentures issued in 2014.

Notes to the Condensed Consolidated Financial Statements For the three and six month periods ended June 30, 2016 and 2015 (in thousands of Canadian dollars, except share and per share amounts) (unaudited)
48 | SECOND QUARTER 2016 CONDENSED CONSOLIDATED INTERIM FINANCIAL STATEMENTS
The Corporation targets a net long-term indebtedness to adjusted EBITDA ratio of 2.0 to 3.0 over a three to five-year planning horizon. At June 30, 2016, the net long-term indebtedness to adjusted EBITDA was 2.4 (June 30, 2015 – 2.5), calculated on a last twelve month basis as follows:
The Corporation monitors its capital requirements through a rolling forecast of operating results and the related financial position. In addition, the Corporation establishes and reviews operating and capital budgets and cash flow forecasts in order to manage overall capital with respect to financial covenants. The Corporation’s revolving credit facility is subject to the covenants described in Note 32 of the Corporation’s annual audited consolidated financial statements for the period ended December 31, 2015. The covenants are measured each quarter on March 31, June 30, September 30 and December 31. The Corporation was in full compliance with its covenants at June 30, 2016 and December 31, 2015.
13. RELATED PARTY TRANSACTIONS
Balances and transactions between the Corporation and its subsidiaries, which are related parties, have been eliminated on consolidation and are not disclosed in this note. Details of transactions between the Corporation and other related parties are disclosed below.
The Corporation incurred facility costs during the three and six month periods ended June 30, 2016 of $174 and $290, respectively (June 30, 2015 - $112 and $224, respectively) for the rental of buildings that are partially owned indirectly by Don Sutherland, the President of Studon. No amounts are included in trade payables as at June 30, 2016 and 2015.
June 30, June 30,2016 2015
Total long-term indebtedness (1) 134,976$ 152,541$
Less: Cash on hand (2) (34,055) (34,965) Net long-term indebtedness 100,921$ 117,576$ Net earnings 4,215$ 6,677$ Add:
Finance income (182) (637) Finance costs 8,855 15,245 Depreciation and amortization 18,329 17,534 Income tax expense 955 4,754 Impairment loss on property and equipment 1,347 2,294 Impairment loss on intangible assets 4,000 - (Recovery) cost relating to investing activities (2,935) 1,680 Restructuring costs 6,915 - (Gain) loss on sale of assets (168) 74
Adjusted EBITDA (3) 41,331$ 47,621$
Net long-term indebtedness to adjusted EBITDA ratio 2.4 2.5 (1) As per the calculation in the indebtedness to capitalization percentage. (2) Cash on hand includes restricted cash. (3) While EBITDA and adjusted EBITDA are common financial measures widely used by investors to facilitate an “enterprise level” valuation of an entity, they do not have a standardized definition prescribed by IFRS, and therefore other issuers may calculate EBITDA and adjusted EBITDA differently.

Notes to the Condensed Consolidated Financial Statements For the three and six month periods ended June 30, 2016 and 2015 (in thousands of Canadian dollars, except share and per share amounts) (unaudited)
49 | SECOND QUARTER 2016 CONDENSED CONSOLIDATED INTERIM FINANCIAL STATEMENTS
14. CONTINGENCIES, COMMITMENTS AND GUARANTEES
The Corporation has made various donations in support of local communities. Over the next three years the Corporation has committed to pay $308 (June 30, 2015 - $500), of which $101 (June 30, 2015 - $500) is to be paid in the upcoming 12 month period.
The Corporation has provided several letters of credit in the amount of $3,628 in connection with various projects and joint arrangements (December 31, 2015 - $3,690), of which $nil are financial letters of credit (December 31, 2015 - $nil).
15. EVENTS AFTER THE REPORTING PERIOD
On July 13, 2016, the Corporation negotiated improved terms and conditions and a one year extension to its revolving credit facility (Revolver). The Revolver now consists of a $150,000 (previously $155,000) credit facility syndicated by six lenders from the existing facility and a $25,000 (previously $20,000) operating facility provided by one of the co-lead lenders. The combined Revolver maintains the Corporation’s maximum available borrowing capacity of $175,000. The maturity date of the Revolver has been extended to July 16, 2021.
On August 9, 2016, the Corporation’s Board of Directors declared a common share dividend of $0.12 per share. The dividend is designated as an eligible dividend under the Income Tax Act (Canada) and is payable October 13, 2016 to shareholders of record on September 30, 2016.


Corporate & Shareholder Information
Officers
David LeMay, MBA President and Chief Executive Officer
Daryl Sands, B.Comm., CA Executive Vice President, Finance and Chief Financial Officer
Arthur Atkinson, PQS Chief Operating Officer Buildings Group
Joette Decore, BSc., MBA Executive Vice President, Strategy and Corporate Development
Bob Myles, P.Eng. Chief Operating Officer Industrial Group
Bill Pohl, B Mgmt., CA Vice President, Finance
Directors
Albrecht W.A. Bellstedt, B.A., J.D., Q.C. Chair
Richard T. Ballantyne, P. Eng. (1) (4)
Chad Danard (1) (2)
Rod Graham, CFA, MBA (1) (4)
Wendy L. Hanrahan, CA (2) (3)
David LeMay, MBA Carmen R. Loberg (1) (3)
Ian M. Reid, B.Comm. (2) (3) (4)
(1) Member of the Audit Committee (2) Member of the Human Resources &
Compensation Committee (3) Member of the Corporate Governance &
Nominating Committee (4) Member of the Health, Safety &
Environment Committee
Executive Offices
600, 4820 Richard Road SW
Calgary, Alberta T3E 6L1
Phone: (403) 685-7777
Fax: (403) 685-7770
Email: [email protected]
Website: www.stuartolson.com
Auditors Deloitte LLP Calgary, Alberta
Principal Bank
The Toronto-Dominion Bank
Bonding and Insurance
Aon Reed Stenhouse Inc.
Federal Insurance Company
Liberty Mutual Insurance Company
Registrars and Transfer Agents
Inquiries regarding change of address, registered holdings, transfers, duplicate mailings and lost certificates should be directed to:
Common Shares
CST Trust Company
600 The Dome Tower 333 – 7th Avenue SW Calgary, Alberta T2P 2Z1
Phone: (403) 776-3900 Fax: (403) 776-3916
Email: [email protected]
Website: www.canstockta.com
Answerline: 1-800-387-0825
Convertible Debentures
Valiant Trust Company
Suite 310, 606 – 4th Street SW
Calgary, Alberta T2P 1T1
Phone: (403) 233-2801
Fax: (403) 233-2857
Email: [email protected]
Website: www.valianttrust.com
Toll-free: 1-866-313-1872

_________________________________
600, 4820 Richard Road SW
Calgary, AB T3E 6L1 Phone: (403) 685-7777
Fax: (403) 685-7770 www.stuartolson.com
_________________________________