Embed Size (px)
Citation preview

GROWTHEMPOWERING

Dear Fortis Shareholder,
The year remains very active as we continue to build on our track record ofperformance and execution, delivering strong results across all meaningfulfinancial and operational measures. Our financial performance is on track withnet earnings attributable to common equity shareholders for thesecond quarter of $107 million, or $0.38 per common share, compared to$244 million, or $0.88 per common share, for the second quarter of 2015. On ayear to date basis, earnings were $269 million, or $0.95 per common share,compared to $442 million, or $1.59 per common share, for 2015. The mostsignificant difference in quarterly and year to date earnings compared to 2015related to the gains on sale of assets recognized in the second quarter of 2015.
On an adjusted basis, net earnings attributable to common equity shareholders for the second quarter were$131 million, or $0.46 per common share, an increase of $8 million, or $0.02 per common share, over the secondquarter of 2015. On a year to date basis, adjusted earnings were $321 million, or $1.13 per common share, anincrease of $19 million, or $0.04 per common share, over 2015.
Strong second quarter earnings and cash flow; capital expenditure plan on track
Our diversified portfolio of utilities continues to deliver strong results.
Factors that resulted in growth in adjusted earnings for the second quarter included strong performance at most ofthe Corporation’s regulated utilities; contribution of $4 million from the Aitken Creek gas storage facility inBritish Columbia (“Aitken Creek”), which was acquired in early April 2016; the strength of the US dollar relative tothe Canadian dollar (approximately 45% of Fortis’ assets are denominated in US dollars. On an annual basis, earningsper common share are affected by approximately $0.01 for each $0.01 change in the US dollar relative to theCanadian dollar); and the timing of quarterly earnings at FortisBC Electric compared to the second quarter of 2015.Earnings growth was tempered by lower earnings at FortisAlberta, due to higher operating expenses and loweraverage energy consumption, and the sale of commercial real estate and hotel assets in 2015.
Cash flow from operating activities was $931 million for the first half of 2016, comparable with the first half of 2015.
Capital expenditures for the first half of 2016 were $859 million and the Corporation’s consolidated capitalexpenditure forecast of $1.9 billion for 2016 is on track. Caribbean Utilities completed its 39.7 megawatt generationexpansion project in the second quarter of 2016, on schedule and below budget, for a total cost of US$79 million.
A transformative acquisition
In February 2016, Fortis announced the US$11.3 billion acquisition of ITC Holdings Corp. (“ITC”), the largestindependent electric transmission company in the United States.
We expect the acquisition of ITC to further strengthen and diversify our business, as well as accelerate our growth.In the second quarter, we achieved a number of significant milestones related to closing of the acquisition.
In April 2016, Fortis announced that it reached a definitive agreement with an affiliate of GIC Private Limited,Singapore’s sovereign wealth fund, to acquire a 19.9% equity interest in ITC for aggregate consideration ofUS$1.228 billion in cash upon closing of the acquisition. This completes a significant component of the ITC acquisitionfinancing plan.
In May 2016 and June 2016, respectively, Fortis and ITC received shareholder approvals to proceed with theacquisition. The transaction review by the Committee on Foreign Investment in the United States was completed inJuly 2016. The closing of the acquisition remains subject to certain regulatory, state and federal approvals including,among others, those of the United States Federal Energy Regulatory Commission (“FERC”) and the United StatesFederal Trade Commission/Department of Justice under the Hart Scott Rodino Antitrust Improvements Act, and thesatisfaction of other customary closing conditions. The FERC and all of the state regulatory applications associatedwith the transaction were filed in the second quarter of 2016. The closing of the acquisition is expected to occur inlate 2016.
Execution of growth strategy
On April 1, 2016, Fortis completed the acquisition of Aitken Creek for approximately $349 million (US$266 million),plus working gas inventory. Aitken Creek is the only underground gas storage facility in British Columbia and has atotal working gas capacity of 77 billion cubic feet. The facility is an integral part of western Canada’s natural gastransmission network.
Construction continues on the Tilbury liquefied natural gas (“LNG”) facility expansion (“Tilbury 1A”) inBritish Columbia, the Corporation’s largest ongoing capital project, at an estimated cost of $440 million.Approximately $368 million has been invested in Tilbury 1A to the end of the second quarter of 2016 and the facilityis expected to be in service in the first quarter of 2017.
The Corporation continues to pursue additional LNG infrastructure investment opportunities in British Columbia,including FortisBC Energy’s potential pipeline expansion to the Woodfibre LNG export facility. Woodfibre LNG hasobtained an export license from the National Energy Board and received various environmental assessmentapprovals. FortisBC Energy also received environmental assessment approval from the Squamish First Nation duringthe second quarter of 2016. The potential pipeline expansion has an estimated total project cost of $600 million.A final investment decision by Woodfibre LNG is targeted for late 2016.
Regulatory proceedings
In addition to the ongoing work to secure regulatory approval for the acquisition of ITC, Fortis is actively engagedwith all of its existing regulators and is focused on maintaining constructive regulatory relationships and outcomesacross its utilities.
Themost significant regulatory proceeding underway remains Tucson Electric Power Company’s (“TEP”) general rateapplication. TEP has requested new retail rates to be effective January 1, 2017, using the year ended June 30, 2015as a historical test year. Since its last approved rate order in 2013, which used a 2011 historical test year, TEP’s totalrate base has increased by approximately US$0.6 billion and the common equity component of capital structure hasincreased from 43.5% to approximately 50%.
In the second quarter, Newfoundland Power received a decision on its general rate application, which resulted in adecrease in the allowed rate of return on common shareholder’s equity to 8.50% from 8.80%, effectiveJanuary 1, 2016. UNS Electric is awaiting the outcome of its general rate application and the Corporation’s utilitiesin British Columbia and Alberta are undergoing generic cost of capital proceedings initiated by therespective regulators.

Outlook
Fortis expects to close the acquisition of ITC by the end of 2016. The acquisition is expected to be accretive toearnings per common share in the first full year following closing, excluding one time acquisition related expenses.The acquisition represents a singular opportunity for Fortis to significantly diversify its business in terms of regulatoryjurisdictions, business risk profile and regional economic mix.
Over the five year period through 2020, excluding ITC, the Corporation’s capital program is expected to be over$9 billion. This investment in energy infrastructure is expected to increase rate base tomore than $20 billion in 2020.Fortis expects long term sustainable growth in rate base, resulting from investment in its existing utility operationsand strategic acquisitions, to support continuing growth in earnings and dividends.
Fortis continues to target 6% average annual dividend growth through 2020. This dividend guidance takes intoaccount many factors, including the expectation of reasonable outcomes for regulatory proceedings at theCorporation’s utilities, the successful execution of the five year capital expenditure program, and management’scontinued confidence in the strength of the Corporation’s diversified portfolio of utilities and record of operationalexcellence. The acquisition of ITC supports this dividend guidance.
Our business continues to grow. In 2017, our financial results will benefit from the expected outcome of theTEP general rate case, the impact of ITC and continued growth of our underlying business. Over the long term, weare well positioned to enhance value for shareholders through the execution of our capital plan, the balance andstrength of our diversified portfolio of businesses, as well as growth opportunities within our franchise regions.
Barry V. PerryPresident and Chief Executive OfficerFortis Inc.

Interim Management Discussion and Analysis 1 June 30, 2016
Interim Management Discussion and AnalysisFor the three and six months ended June 30, 2016
Dated July 29, 2016
TABLE OF CONTENTS
Forward-Looking Information ................................... 1 Liquidity and Capital Resources ..................................... 18Corporate Overview ................................................. 2 Summary of Consolidated Cash Flows ......................... 18Significant Items...................................................... 3 Contractual Obligations............................................... 20Financial Highlights .................................................. 5 Capital Structure ........................................................ 21Segmented Results of Operations ............................. 8 Credit Ratings ............................................................ 21Regulated Electric & Gas Utilities - United States Capital Expenditure Program ...................................... 22
UNS Energy........................................................... 8 Additional Investment Opportunities ........................... 23Central Hudson...................................................... 9 Cash Flow Requirements............................................. 23
Regulated Gas Utility - Canadian Credit Facilities........................................................... 24FortisBC Energy..................................................... 10 Financial Instruments ................................................... 25
Regulated Electric Utilities - Canadian Off-Balance Sheet Arrangements................................... 26FortisAlberta.......................................................... 10 Business Risk Management ........................................... 26FortisBC Electric .................................................... 11 Changes in Accounting Policies...................................... 27Eastern Canadian Electric Utilities .......................... 11 Future Accounting Pronouncements............................... 27
Regulated Electric Utilities - Caribbean...................... 12 Critical Accounting Estimates ........................................ 29Non-Regulated - Energy Infrastructure ..................... 13 Related-Party Transactions............................................ 29Non-Regulated - Non-Utility ..................................... 14 Summary of Quarterly Results ...................................... 30Corporate and Other ................................................ 14 Outlook ........................................................................ 31Material Regulatory Decisions and Applications ......... 15 Outstanding Share Data................................................ 32Consolidated Financial Position ................................. 17 Interim Consolidated Financial Statements (Unaudited) . F-1
FORWARD-LOOKING INFORMATION
The following Fortis Inc. (“Fortis” or the “Corporation”) Management Discussion and Analysis (“MD&A”) has been prepared in accordance with National Instrument 51-102 - Continuous Disclosure Obligations. The MD&A should be read in conjunction with the interim unaudited consolidated financial statements and notes thereto for the three and six months ended June 30, 2016 and the MD&A and audited consolidated financial statements for the year ended December 31, 2015 included in the Corporation’s 2015 Annual Report. Financial information contained in the MD&A has been prepared in accordance with accounting principles generally accepted in the United States (“US GAAP”) and is presented in Canadian dollars unless otherwise specified.
Fortis includes forward-looking information in the MD&A within the meaning of applicable securities laws, including the Private Securities Litigation Reform Act of 1995. Forward-looking statements included in this MD&A reflect expectations of Fortis management regarding future growth, results of operations, performance and business prospects and opportunities. Wherever possible, words such as “anticipates”, “believes”, “budgets”, “could”, “estimates”, “expects”, “forecasts”, “intends”, “may”, “might”, “plans”, “projects”, “schedule”, “should”, “target”, “will”, “would” and the negative of these terms and other similar terminology or expressions have been used to identify the forward-looking statements, which include without limitation: statements related to the acquisition of ITC Holdings Corp. (“ITC”), the expected timing and conditions precedent to the closing of the acquisition of ITC, regulatory approvals, governmental approvals and other customary closing conditions; the expectation that Fortis will borrow funds to satisfy its obligation to pay the cash portion of the purchase price; the assumption of ITC debt and expected maintenance of investment-grade credit ratings; the impact of the acquisition on the Corporation’s midyear rate base, credit rating and estimated enterprise value; the expectation that the acquisition of ITC will be accretive to earnings per common share in the first full year following closing, excluding one-time acquisition-related expenses, and that the acquisition will support the average annual dividend growth target of Fortis; the expectation that the Corporation will have its common shares listed on the New York Stock Exchange; targeted annual dividend growth through2020; the expected timing of filing of regulatory applications and receipt and outcome of regulatory decisions; the expectation that midyear rate base will increase from 2016 to 2020; the Corporation’s forecast gross consolidated capital expenditures for 2016 and total capital spending over the five-year period from 2016 through 2020; the nature, timing and expected costs of certain capital projects including, without limitation, expansion of the Tilbury liquefied natural gas (“LNG”) facility, including Tilbury 1A, the potential pipeline expansion to the Woodfibre LNG site, and additional opportunities including electric transmission, LNG and renewable-related infrastructure and generation; the expectation that the Corporation’s significant capital expenditure program will support continuing growth in earnings and dividends; the expectation that cash required to complete subsidiary capital expenditure programs will besourced from a combination of cash from operations, borrowings under credit facilities, equity injections from Fortis and long-term debt offerings; the expectation that maintaining the targeted capital structure of the Corporation’s regulated operating subsidiaries will not have an impact on its ability to pay dividends in the foreseeable future; the expectation that borrowing under the Corporation’scommitted credit facility may be required from time to time to support the servicing of debt and the payment of dividends; theexpectation that the Corporation’s subsidiaries will be able to source the cash required to fund their 2016 capital expenditure programs, operating and interest costs, and dividend payments; the expected consolidated fixed-term debt maturities and repayments over the next five years; the intention of management to refinance long-term committed credit facilities with long-term permanent financing; the expectation that long-term debt will not be settled prior to maturity; the expectation that the Corporation and its subsidiaries will continue to have reasonable access to capital in the near to long terms; the expectation that the combination of available credit facilities

Interim Management Discussion and Analysis 2 June 30, 2016
and relatively low annual debt maturities and repayments will provide the Corporation and its subsidiaries with flexibility in the timing of access to capital markets; the expectation that the Corporation and its subsidiaries will remain compliant with debt covenants throughout 2016; the intent of management to hedge future exchange rate fluctuations and monitor its foreign currency exposure; the expectation of FortisAlberta to recognize capital tracker revenue in 2016 and that adjustments to capital tracker revenue will be considered in the 2017 Annual Rates Application; the settlement of the Springerville Unit 1 litigation and the timing and conditions precedent to the closing of the settlement, including regulatory approval and satisfaction of customary closing conditions; the expectation that any liability from current legal proceedings will not have a material adverse effect on the Corporation’s consolidated financial position and results of operations; and the expectation that the adoption of future accounting pronouncements will not have a material impact on the Corporation’s consolidated financial statements.
Certain material factors or assumptions have been applied in drawing the conclusions contained in the forward-looking statements, including, without limitation: the receipt of applicable regulatory approvals and requested rate orders, no material adverse regulatory decisions being received, and the expectation of regulatory stability; no material capital project and financing cost overrun related to any of the Corporation’s capital projects; the realization of additional opportunities including natural gas related infrastructure and generation; the Board of Directors exercising its discretion to declare dividends, taking into account the business performance and financial conditions of the Corporation; no significant variability in interest rates; no significant operational disruptions or environmental liability due to a catastrophic event or environmental upset caused by severe weather, other acts of nature or other major events; the continued ability to maintain the electricity and gas systems to ensure their continued performance; no severe and prolonged downturn in economic conditions; no significant decline in capital spending; sufficient liquidity and capital resources; the continuation of regulator-approved mechanisms to flow through the cost of natural gas and energy supply costs in customer rates; the ability to hedge exposures to fluctuations in foreign exchange rates, natural gas prices and electricity prices; no significant counterparty defaults; the continued competitiveness of natural gas pricing when compared with electricity and other alternative sources of energy; the continued availability of natural gas, fuel, coal and electricity supply; continuation and regulatory approval of power supply and capacity purchase contracts; the ability to fund defined benefit pension plans, earn the assumed long-term rates of return on the related assets and recover net pension costs in customer rates; no significant changes in government energy plans, environmental laws and regulations that may materially negatively affect the operations and cash flows of the Corporation and its subsidiaries; no material change in public policies and directions by governments that could materially negatively affect the Corporation and its subsidiaries; maintenance of adequate insurance coverage; the ability to obtain and maintain licences and permits; retention of existing service areas; the continuedtax-deferred treatment of earnings from the Corporation’s Caribbean operations; continued maintenance of information technology infrastructure; continued favourable relations with First Nations; favourable labour relations; that the Corporation can reasonably assess the merit of and potential liability attributable to ongoing legal proceedings; and sufficient human resources to deliver service and execute the capital program.
Forward-looking statements involve significant risks, uncertainties and assumptions. Fortis cautions readers that a number of factors could cause actual results, performance or achievements to differ materially from the results discussed or implied in the forward-looking statements. These factors should be considered carefully and undue reliance should not be placed on the forward-looking statements. Risk factors which could cause results or events to differ from current expectations are detailed under the heading “Business Risk Management” in this MD&A and in continuous disclosure materials filed from time to time with Canadian securities regulatory authorities and the Securities and Exchange Commission. Key risk factors for 2016 include, but are not limited to: uncertainty regarding thecompletion of the acquisition of ITC, including but not limited to, the receipt of regulatory and other governmental approvals, the availability of financing sources at the desired time or at all, on cost-efficient or commercially reasonable terms and the satisfaction or waiver of certain other conditions to closing; uncertainty related to the realization of some or all of the expected benefits of the acquisition of ITC; uncertainty regarding the outcome of regulatory proceedings of the Corporation’s utilities; uncertainty of the impact a continuation of a low interest rate environment may have on the allowed rate of return on common shareholders’ equity at the Corporation’s regulated utilities; the impact of fluctuations in foreign exchange rates; and risk associated with the impact of less favorable economic conditions on the Corporation’s results of operations.
All forward-looking information in the MD&A is qualified in its entirety by the above cautionary statements and, except as required by law, Fortis disclaims any intention or obligation to update or revise any forward-looking statements, whether as a result of newinformation, future events or otherwise.
CORPORATE OVERVIEW
Fortis is a leader in the North American electric and gas utility business, with total assets of approximately $29 billion and fiscal 2015 revenue of $6.7 billion. The Corporation’s asset mix is approximately 94% regulated (69% electric, 25% gas), with the remaining 6% comprised of non-regulated energy infrastructure. The Corporation’s regulated utilities serve more than 3 million customers across Canada, the United States and the Caribbean.
Year-to-date June 30, 2016, the Corporation’s electricity distribution systems met a combined peak demand of 9,433 megawatts (“MW”) and its gas distribution system met a peak day demand of 1,335 terajoules. For additional information on the Corporation’s business segments, refer to Note 1 to the Corporation’s interim unaudited consolidated financial statements for the three and six months ended June 30, 2016 and to the “Corporate Overview” section of the 2015 Annual MD&A.
The Corporation’s main business, utility operations, is highly regulated and the earnings of the Corporation’s regulated utilities are determined under cost of service (“COS”) regulation and, in certain jurisdictions, performance-based rate-setting (“PBR”) mechanisms. Generally, under COS regulation the respective regulatory authority sets customer electricity and/or gas rates to permit a reasonable opportunity for the utility to recover, on a timely basis, estimated costs of providing service to customers, including a fair rate of return on a regulatory deemed or targeted capital structure applied to an approved

Interim Management Discussion and Analysis 3 June 30, 2016
regulatory asset value (“rate base”). The ability of a regulated utility to recover prudently incurred costs of providing service and earn the regulator-approved rate of return on common shareholders’ equity (“ROE”) and/or rate of return on rate base assets (“ROA”) depends on the utility achieving the forecasts established in the rate-setting processes. If a historical test year is used to set customer rates, there may be regulatory lag between when costs are incurred and when they are reflected in customer rates. When PBR mechanisms are utilized in determining annual revenue requirements and resulting customer rates, a formula is generally applied that incorporates inflation and assumed productivity improvements. The use of PBR mechanisms should allow a utility a reasonable opportunity to recover prudently incurred costs and earn its allowed ROE or ROA.
Earnings of regulated utilities may be impacted by: (i) changes in the regulator-approved allowed ROE and/or ROA and common equity component of capital structure; (ii) changes in rate base; (iii) changes in energy sales or gas delivery volumes; (iv) changes in the number and composition of customers; (v) variances between actual expenses incurred and forecast expenses used to determine revenue requirements and set customer rates; (vi) regulatory lag in the case of a historical test year; and (vii) timing differences within an annual financial reporting period between when actual expenses are incurred and when they are recovered from customers in rates. When future test years are used to establish revenue requirements and set base customer rates, these rates are not adjusted as a result of the actual COS being different from that which is estimated, other than for certain prescribed costs that are eligible to be deferred on the balance sheet. In addition, the Corporation’s regulated utilities, where applicable, are permitted by their respective regulatory authority to flow through to customers, without markup, the cost of natural gas, fuel and/or purchased power through base customer rates and/or the use of rate stabilization and other mechanisms.
SIGNIFICANT ITEMS
Pending Acquisition of ITC Holdings Corp.: On February 9, 2016, Fortis and ITC Holdings Corp. (“ITC”) (NYSE:ITC) entered into an agreement and plan of merger pursuant to which Fortis will acquire ITC in a transaction (the “Acquisition”) valued at approximately US$11.3 billion, based on the closing price for Fortis common shares and the foreign exchange rate on February 8, 2016. Under the terms of the transaction, ITC shareholders will receive US$22.57 in cash and 0.7520 of a Fortis common share per ITC share, representing total consideration of approximately US$6.9 billion, and Fortis will assume approximately US$4.4 billion of ITC consolidated indebtedness.
ITC is the largest independent electric transmission company in the United States. ITC owns and operates high-voltage transmission facilities in Michigan, Iowa, Minnesota, Illinois, Missouri, Kansas and Oklahoma, serving a combined peak load exceeding 26,000 MW along approximately 15,700 circuit miles of transmission line. In addition, ITC is a public utility limited to transmission ownership in Wisconsin. ITC’s tariff rates are regulated by the United States Federal Energy Regulatory Commission (“FERC”), which has been one of the most consistently supportive utility regulators in North America providing reasonable returns and equity ratios. Rates are set using a forward-looking rate-setting mechanism with an annual true-up, which provides timely cost recovery and reduces regulatory lag.
In May 2016 and June 2016, both Fortis and ITC received shareholder approvals to proceed with the Acquisition. The transaction review by the Committee on Foreign Investment in the United States was completed in July 2016. The closing of the Acquisition remains subject to certain regulatory, state and federal approvals including, among others, those of FERC and the United States Federal Trade Commission/Department of Justice under the Hart-Scott-Rodino Antitrust Improvements Act, and the satisfaction of other customary closing conditions. The FERC and all of the state regulatory applications associated with the transaction were filed in the second quarter of 2016. The closing of the Acquisition is expected to occur in late 2016.
The pending Acquisition is expected to be accretive to earnings per common share in the first full year following closing, excluding one-time acquisition-related expenses. The Acquisition represents a singular opportunity for Fortis to significantly diversify its business in terms of regulatory jurisdictions, business risk profile and regional economic mix. On a pro forma basis, 2016 forecast midyear rate base of Fortis is expected to increase by approximately $7.5 billion to approximately $25 billion, as a result of the Acquisition. Following the Acquisition, Fortis will be one of the top 15 North American public utilities ranked by enterprise value.
Interim Management Discussion and Analysis 4 June 30, 2016
The financing of the Acquisition has been structured to allow Fortis to maintain investment-grade credit ratings and maintain the Corporation’s existing capital structure. Financing of the cash portion of the Acquisition purchase price will be achieved primarily through the issuance of approximately US$2 billion of Fortis debt and the sale of 19.9% of ITC to a minority investor. In April 2016 Fortis announced that it reached a definitive agreement with an affiliate of GIC Private Limited (“GIC”), Singapore’s sovereign wealth fund, to acquire a 19.9% equity interest in ITC for aggregate consideration of US$1.228 billion in cash upon closing of the Acquisition. This completes a significant component of the ITC Acquisition financing plan.
In July 2016 Fortis entered into forward-starting deal-contingent interest rate swap contracts with notional amounts totalling US$1.25 billion. These derivatives have been designated as a hedge of a portion of the cash flow risk associated with the expected issuance of long-term debt to finance a portion of the cash purchase price of the Acquisition. For further details on these contracts, refer to the “Financial Instruments” section of this MD&A.
In February 2016 the Corporation obtained a total of US$3.7 billion in commitments for non-revolving term credit facilities as bridge financing for the pending Acquisition of ITC. For further details on these Acquisition credit facilities, refer to the “Credit Facilities” section of this MD&A.
Upon completion of the Acquisition, ITC will become a subsidiary of Fortis and approximately 27% of the common shares of Fortis will be held by ITC shareholders. In connection with the Acquisition, Fortis has become a U.S. Securities and Exchange Commission (“SEC”) registrant and intends to list its common shares on the New York Stock Exchange. Fortis will continue to have its shares listed on the Toronto Stock Exchange. In May 2016 the SEC granted effectiveness of the Corporation’s registration statement on Form F-4, which included a proxy statement of ITC and a prospectus of Fortis. This final registration statement is available at www.sec.gov and under Fortis’ issuer profile at www.sedar.com.
Acquisition of Aitken Creek Gas Storage FacilityOn April 1, 2016, Fortis acquired Aitken Creek Gas Storage ULC (“ACGS”) from Chevron Canada Properties Ltd. for approximately $349 million (US$266 million), plus working gas inventory. The net cash purchase price was primarily financed through US dollar-denominated borrowings under the Corporation’s committed revolving credit facility.
ACGS owns 93.8% of the Aitken Creek gas storage site (“Aitken Creek”), with the remaining share owned by BP Canada Energy Company. Aitken Creek is the only underground natural gas storage facility in British Columbia and has a total working gas capacity of 77 billion cubic feet. The facility is an integral part of western Canada’s natural gas transmission network. ACGS also owns 100% of the North Aitken Creek gas storage site which offers future expansion potential. The financial results of ACGS have been included in the Corporation’s consolidated results from the date of acquisition and are included in the Non-Regulated – Energy Infrastructure reporting segment.
Interim Management Discussion and Analysis 5 June 30, 2016
FINANCIAL HIGHLIGHTS
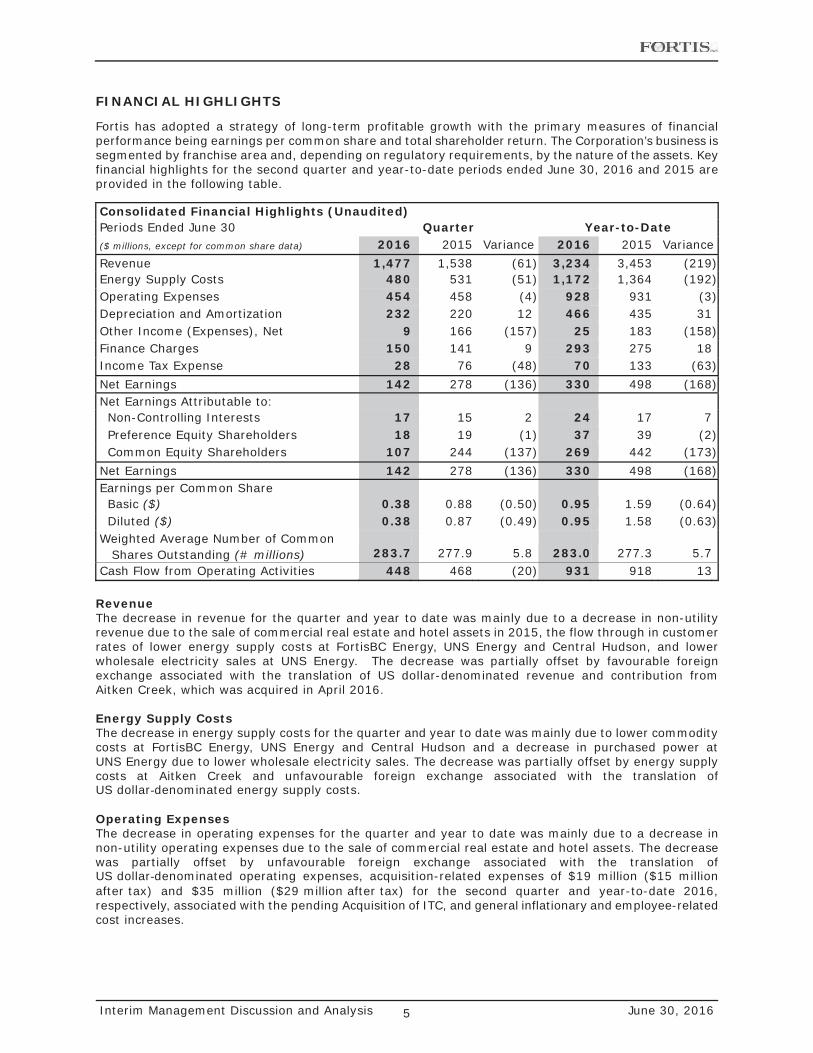
Fortis has adopted a strategy of long-term profitable growth with the primary measures of financial performance being earnings per common share and total shareholder return. The Corporation’s business is segmented by franchise area and, depending on regulatory requirements, by the nature of the assets. Key financial highlights for the second quarter and year-to-date periods ended June 30, 2016 and 2015 are provided in the following table.
Consolidated Financial Highlights (Unaudited)Periods Ended June 30 Quarter Year-to-Date($ millions, except for common share data) 2016 2015 Variance 2016 2015 VarianceRevenue 1,477 1,538 (61) 3,234 3,453 (219)Energy Supply Costs 480 531 (51) 1,172 1,364 (192)Operating Expenses 454 458 (4) 928 931 (3)Depreciation and Amortization 232 220 12 466 435 31Other Income (Expenses), Net 9 166 (157) 25 183 (158)Finance Charges 150 141 9 293 275 18Income Tax Expense 28 76 (48) 70 133 (63)Net Earnings 142 278 (136) 330 498 (168)Net Earnings Attributable to:Non-Controlling Interests 17 15 2 24 17 7Preference Equity Shareholders 18 19 (1) 37 39 (2)Common Equity Shareholders 107 244 (137) 269 442 (173)
Net Earnings 142 278 (136) 330 498 (168)Earnings per Common ShareBasic ($) 0.38 0.88 (0.50) 0.95 1.59 (0.64)Diluted ($) 0.38 0.87 (0.49) 0.95 1.58 (0.63)
Weighted Average Number of Common Shares Outstanding (# millions) 283.7 277.9 5.8 283.0 277.3 5.7
Cash Flow from Operating Activities 448 468 (20) 931 918 13
RevenueThe decrease in revenue for the quarter and year to date was mainly due to a decrease in non-utility revenue due to the sale of commercial real estate and hotel assets in 2015, the flow through in customer rates of lower energy supply costs at FortisBC Energy, UNS Energy and Central Hudson, and lower wholesale electricity sales at UNS Energy. The decrease was partially offset by favourable foreign exchange associated with the translation of US dollar-denominated revenue and contribution from Aitken Creek, which was acquired in April 2016.
Energy Supply CostsThe decrease in energy supply costs for the quarter and year to date was mainly due to lower commodity costs at FortisBC Energy, UNS Energy and Central Hudson and a decrease in purchased power at UNS Energy due to lower wholesale electricity sales. The decrease was partially offset by energy supply costs at Aitken Creek and unfavourable foreign exchange associated with the translation of US dollar-denominated energy supply costs.
Operating ExpensesThe decrease in operating expenses for the quarter and year to date was mainly due to a decrease in non-utility operating expenses due to the sale of commercial real estate and hotel assets. The decrease was partially offset by unfavourable foreign exchange associated with the translation of US dollar-denominated operating expenses, acquisition-related expenses of $19 million ($15 million after tax) and $35 million ($29 million after tax) for the second quarter and year-to-date 2016, respectively, associated with the pending Acquisition of ITC, and general inflationary and employee-related cost increases.

Interim Management Discussion and Analysis 6 June 30, 2016
Depreciation and AmortizationThe increase in depreciation for the quarter and year to date was primarily due to unfavourable foreign exchange associated with the translation of US dollar-denominated depreciation and continued investment in energy infrastructure at the Corporation’s regulated utilities. The increase was partially offset by lower non-utility depreciation due to the sale of commercial real estate and hotel assets.
Other Income (Expenses), NetThe decrease in other income, net of expenses, for the quarter and year to date was primarily due to a net gain of approximately $111 million ($96 million after tax), net of expenses, related to the sale of commercial real estate and hotel assets and a gain of approximately $51 million ($27 million after tax), net of expenses and foreign exchange impacts, on the sale of generation assets, both recognized in the second quarter of 2015.
Finance ChargesThe increase in finance charges for the quarter and year to date was primarily due to acquisition-related fees associated with the Corporation’s Acquisition credit facilities, which totalled approximately $10 million ($7 million after tax) and $14 million ($10 million after tax) for the second quarter and year-to-date 2016, respectively. The impact of unfavourable foreign exchange associated with the translation of US dollar-denominated interest expense also contributed to the increase.
Income Tax ExpenseThe decrease in income tax expense for the quarter and year to date was primarily due to lower earnings before income taxes, primarily due to the net gains on the sale of commercial real estate and hotel assets and generation assets recognized in the second quarter of 2015.
Net Earnings Attributable to Common Equity Shareholders and Basic Earnings Per Common Share
Fortis supplements the use of US GAAP financial measures with non-US GAAP financial measures, including adjusted net earnings attributable to common equity shareholders and adjusted basic earnings per common share. The Corporation refers to these measures as non-US GAAP financial measures since they are not required by, or presented in accordance with, US GAAP.
The Corporation defines: (i) adjusted net earnings attributable to common equity shareholders as net earnings attributable to common equity shareholders plus or minus items that management believes help investors better evaluate results of operations; and (ii) adjusted basic earnings per common share as adjusted net earnings attributable to common equity shareholders divided by the weighted average number of common shares outstanding. The most directly comparable US GAAP measures to adjusted net earnings attributable to common equity shareholders and adjusted basic earnings per common share are net earnings attributable to common equity shareholders and basic earnings per common share.
The following table provides a reconciliation of the non-US GAAP financial measures and each of the adjusting items are discussed in the segmented results of operations for the respective reporting segments. The adjusting items do not have a standardized meaning as prescribed under US GAAP and are not considered US GAAP measures. Therefore, these adjusting items may not be comparable with similar measures presented by other companies.

Interim Management Discussion and Analysis 7 June 30, 2016
Non-US GAAP Reconciliation (Unaudited)Periods Ended June 30 Quarter Year-to-Date($ millions, except for common share data) 2016 2015 Variance 2016 2015 VarianceNet Earnings Attributable to Common
Equity Shareholders 107 244 (137) 269 442 (173)Adjusting Items:UNS Energy - FERC ordered transmission
refunds — — — 11 — 11FortisAlberta -
Capital tracker revenue adjustment for 2013 and 2014 — 1 (1) — (9) 9
Non-Regulated - Energy Infrastructure -Gain on sale of generation assets — (27) 27 — (27) 27Unrealized loss on mark-to-market of
derivatives 2 — 2 2 — 2Non-Utility -
Net gain on sale of commercial real estate and hotel assets — (96) 96 — (96) 96
Corporate and Other -Acquisition-related expenses and fees 22 — 22 39 — 39Foreign exchange loss (gain) — 1 (1) — (8) 8
Adjusted Net Earnings Attributable to Common Equity Shareholders 131 123 8 321 302 19
Adjusted Basic Earnings Per Common Share ($) 0.46 0.44 0.02 1.13 1.09 0.04
Weighted Average Number of Common Shares Outstanding (# millions) 283.7 277.9 5.8 283.0 277.3 5.7
The increase in adjusted net earnings attributable to common equity shareholders for the quarter was mainly due to: (i) strong performance at most of the Corporation’s regulated utilities; (ii) contribution of $4 million from Aitken Creek, which was acquired in early April 2016; (iii) favourable foreign exchange associated with US dollar-denominated earnings; and (iv) the timing of quarterly earnings at FortisBC Electric compared to the second quarter of 2015. The increase was partially offset by lower earnings at FortisAlberta, due to higher operating expenses and lower average energy consumption, and the sale of commercial real estate and hotel assets in 2015.
The increase in adjusted net earnings attributable to common equity shareholders year to date was mainly due to: (i) strong performance at most of the Corporation’s regulated utilities, including a higher allowance for funds used during construction (“AFUDC”) at FortisBC Energy and equity income of $2 million from Belize Electricity Limited (“Belize Electricity”); (ii) favourable foreign exchange associated with US dollar-denominated earnings; and (iii) contribution of $4 million from Aitken Creek and higher earnings at the Waneta Expansion, which commenced production in early April 2015. The increase was partially offset by: (i) the timing of quarterly earnings at FortisBC Electric compared to the same period in 2015;(ii) lower earnings at FortisAlberta, due to higher operating expenses and lower average energy consumption; (iii) the sale of commercial real estate and hotel assets in 2015; and (iv) higher Corporate and Other expenses.
Adjusted earnings per common share for the quarter and year to date were $0.02 and $0.04 higher, respectively, compared to the same periods in 2015. The impact of the above-noted items on adjusted net earnings attributable to common equity shareholders were partially offset by an increase in the weighted average number of common shares outstanding.

Interim Management Discussion and Analysis 8 June 30, 2016
SEGMENTED RESULTS OF OPERATIONS
Segmented Net Earnings Attributable to Common Equity Shareholders (Unaudited)Periods Ended June 30 Quarter Year-to-Date($ millions) 2016 2015 Variance 2016 2015 VarianceRegulated Gas & Electric Utilities
- United StatesUNS Energy 56 52 4 68 72 (4)Central Hudson 12 10 2 36 32 4
68 62 6 104 104 —Regulated Gas Utility - Canadian
FortisBC Energy 8 7 1 100 95 5Regulated Electric Utilities -
CanadianFortisAlberta 30 31 (1) 61 72 (11)FortisBC Electric 15 11 4 30 34 (4)Eastern Canadian 16 15 1 34 34 —
61 57 4 125 140 (15)Regulated Electric Utilities - Caribbean 11 9 2 21 14 7Non-Regulated - Energy Infrastructure 19 45 (26) 30 48 (18)Non-Regulated - Non-Utility — 104 (104) — 102 (102)Corporate and Other (60) (40) (20) (111) (61) (50)Net Earnings Attributable to
Common Equity Shareholders 107 244 (137) 269 442 (173)
The following is a discussion of the financial results of the Corporation’s reporting segments. Refer to the “Material Regulatory Decisions and Applications” section of this MD&A for a further discussion pertaining to the Corporation’s regulated utilities.
REGULATED ELECTRIC & GAS UTILITIES - UNITED STATES
UNS ENERGY (1)
Financial Highlights (Unaudited) Quarter Year-to-DatePeriods Ended June 30 2016 2015 Variance 2016 2015 VarianceAverage US:CAD Exchange Rate (2) 1.29 1.23 0.06 1.33 1.24 0.09Electricity Sales (gigawatt hours (“GWh”)) 3,608 3,981 (373) 6,652 7,378 (726)Gas Volumes (petajoules (“PJ”)) 3 2 1 8 7 1Revenue ($ millions) 490 494 (4) 930 929 1Earnings ($ millions) 56 52 4 68 72 (4)
(1) Primarily includes Tucson Electric Power Company (“TEP”), UNS Electric, Inc. (“UNS Electric”) and UNS Gas, Inc. (“UNS Gas”)
(2) The reporting currency of UNS Energy is the US dollar.
Electricity Sales & Gas VolumesThe decrease in electricity sales for the quarter and year to date was primarily due to lower short-term wholesale and mining retail sales, as a result of less favourable commodity prices compared to the same periods in 2015. The majority of short-term wholesale sales is flowed through to customers and has no impact on earnings. The decrease in electricity sales for the quarter and year to date was partially offset by higher residential retail electricity sales, mainly due to warmer temperatures in the second quarter, which increased air conditioning load, and cooler temperatures in the first quarter, which increased electric heating load.
Gas volumes for the quarter and year to date were comparable with the same periods in 2015.

Interim Management Discussion and Analysis 9 June 30, 2016
RevenueThe decrease in revenue for the quarter was mainly due to lower short-term wholesale electricity sales and the flow through to customers of lower purchased power and fuel supply costs. The decrease was partially offset by approximately $18 million of favourable foreign exchange associated with the translation of US dollar-denominated revenue, an increase in lost fixed-cost recovery revenue and higher residential retail electricity sales.
The increase in revenue year to date was due to approximately $59 million of favourable foreign exchange associated with the translation of US dollar-denominated revenue, an increase in lost fixed-cost recovery revenue and higher residential retail electricity sales. The increase was partially offset by $18 million (US$13 million), or $11 million (US$8 million) after tax, in FERC ordered transmission refunds associated with late-filed transmission service agreements, lower short-term wholesale electricity sales and the flow through to customers of lower purchased power and fuel supply costs. For details on the FERC order, refer to the “Material Regulatory Decisions and Applications” section of this MD&A.
EarningsThe increase in earnings for the quarter was primarily due to approximately $3 million of favourable foreign exchange associated with the translation of US dollar-denominated earnings, lower deferred income tax expense, higher lost fixed-cost recovery revenue and higher residential retail electricity sales. The increase was partially offset by higher operating expenses.
The decrease in earnings year to date was primarily due to $11 million (US$8 million) in FERC ordered transmission refunds, as discussed above, and higher operating expenses. The decrease was partially offset by approximately $5 million of favourable foreign exchange associated with the translation of US dollar-denominated earnings, higher lost fixed-cost recovery revenue, higher residential retail electricity sales, and lower deferred income tax expense.
CENTRAL HUDSON
Financial Highlights (Unaudited) Quarter Year-to-DatePeriods Ended June 30 2016 2015 Variance 2016 2015 VarianceAverage US:CAD Exchange Rate (1) 1.29 1.23 0.06 1.33 1.24 0.09Electricity Sales (GWh) 1,149 1,217 (68) 2,404 2,632 (228)Gas Volumes (PJ) 4 5 (1) 13 15 (2)Revenue ($ millions) 185 193 (8) 434 485 (51)Earnings ($ millions) 12 10 2 36 32 4
(1) The reporting currency of Central Hudson is the US dollar.
Electricity Sales & Gas VolumesThe decrease in electricity sales and gas volumes for the quarter and year to date was primarily due to warmer temperatures.
Changes in electricity sales and gas volumes at Central Hudson are subject to regulatory revenue decoupling mechanisms and, as a result, do not have a material impact on revenue and earnings.
RevenueThe decrease in revenue for the quarter and year to date was mainly due to the recovery from customers of lower commodity costs, which were mainly due to lower wholesale prices, and the impact of energy-efficiency incentives earned during the first half of 2015 upon achieving energy saving targets established by the regulator. The decrease was partially offset by approximately $5 million and $16 million of favourable foreign exchange for the quarter and year to date, respectively, associated with the translation of US dollar-denominated revenue and an increase in base electricity rates effective July 1, 2015.
EarningsThe increase in earnings for the quarter and year to date was primarily due to approximately $1 million and $3 million, respectively, of favourable foreign exchange associated with the translation of US dollar-denominated earnings and an increase in base electricity rates effective July 1, 2015, partially offset by the impact of energy-efficiency incentives earned during the first half of 2015, as discussed above.

Interim Management Discussion and Analysis 10 June 30, 2016
REGULATED GAS UTILITY - CANADIAN
FORTISBC ENERGY
Financial Highlights (Unaudited) Quarter Year-to-DatePeriods Ended June 30 2016 2015 Variance 2016 2015 VarianceGas Volumes (PJ) 34 36 (2) 102 98 4Revenue ($ millions) 201 228 (27) 607 716 (109)Earnings ($ millions) 8 7 1 100 95 5
Gas VolumesThe decrease in gas volumes for the quarter was primarily due to lower average consumption as a result of warmer temperatures. The increase in gas volumes year to date was due to higher average consumption during the first quarter as a result of colder temperatures.
RevenueThe decrease in revenue for the quarter and year to date was primarily due to a lower commodity cost of natural gas charged to customers, partially offset by an increase in customer delivery rates effective January 1, 2016. Lower gas volumes had an unfavourable impact on revenue for the quarter, while higher gas volumes increased revenue year to date. The timing of regulatory flow-through deferral amounts also had a favourable impact on revenue year to date.
EarningsThe increase in earnings for the quarter and year to date was primarily due to higher AFUDC, partially offset by higher operating expenses. Also contributing to the increase in earnings year to date was the timing of regulatory flow-through deferral amounts.
FortisBC Energy earns approximately the same margin regardless of whether a customer contracts for the purchase and delivery of natural gas or only for the delivery of natural gas. As a result of the operation of regulatory deferral mechanisms, changes in consumption levels and the cost of natural gas do not materially affect earnings.
REGULATED ELECTRIC UTILITIES - CANADIAN
FORTISALBERTA
Financial Highlights (Unaudited) Quarter Year-to-DatePeriods Ended June 30 2016 2015 Variance 2016 2015 VarianceEnergy Deliveries (GWh) 3,799 4,026 (227) 8,355 8,693 (338)Revenue ($ millions) 144 136 8 286 282 4Earnings ($ millions) 30 31 (1) 61 72 (11)
Energy DeliveriesThe decrease in energy deliveries for the quarter and year to date was primarily due to lower average consumption by oil and gas customers as a result of low commodity prices for oil and gas. The decrease was partially offset by higher energy deliveries to residential customers due to customer growth.
RevenueThe increase in revenue for the quarter was due to an increase in customer rates effective January 1, 2016 based on a combined inflation and productivity factor of 0.9%, growth in the number of residential customers and higher revenue related to flow-through costs to customers.
The increase in revenue year to date was due to the same factors discussed above for the quarter, partially offset by the impact of a $9 million positive capital tracker revenue adjustment recognized in the first quarter of 2015 that related to 2013 and 2014.
Interim Management Discussion and Analysis 11 June 30, 2016
EarningsThe decrease in earnings for the quarter and year to date was due to higher operating expenses and lower average energy consumption. The decrease in earnings year to date was primarily due to the $9 million positive capital tracker revenue adjustment recognized in the first quarter of 2015, as discussed above.
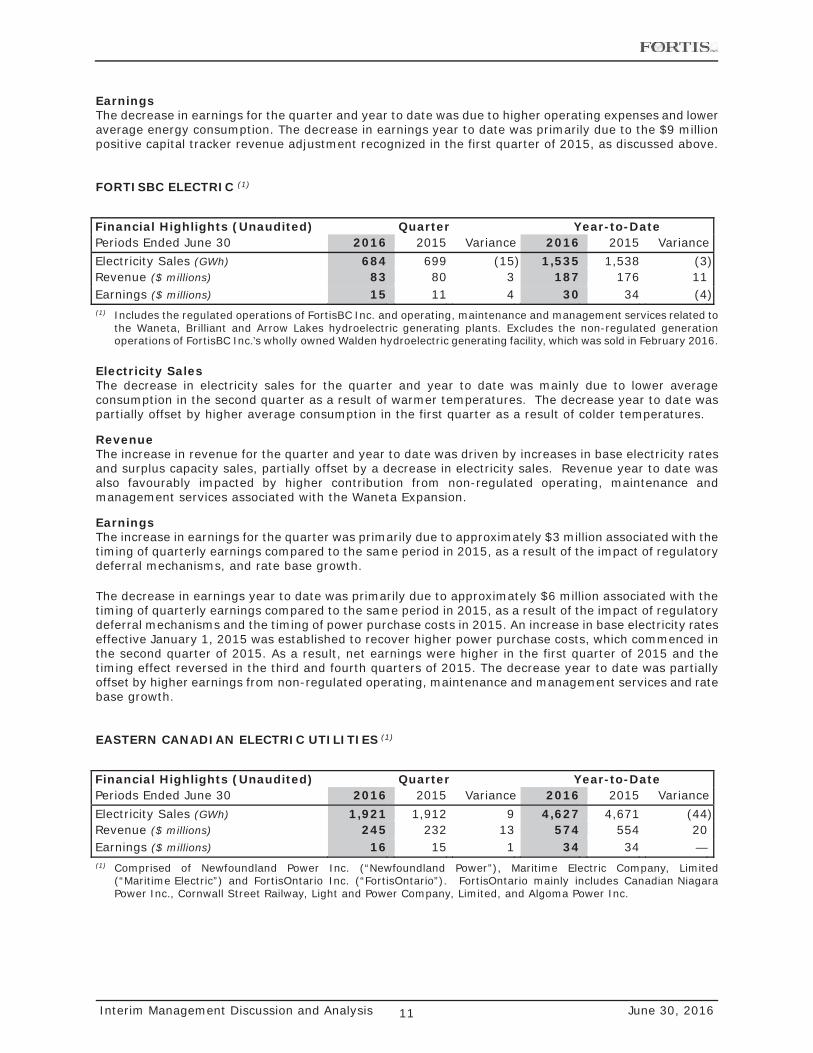
FORTISBC ELECTRIC (1)
Financial Highlights (Unaudited) Quarter Year-to-DatePeriods Ended June 30 2016 2015 Variance 2016 2015 VarianceElectricity Sales (GWh) 684 699 (15) 1,535 1,538 (3)Revenue ($ millions) 83 80 3 187 176 11Earnings ($ millions) 15 11 4 30 34 (4)(1) Includes the regulated operations of FortisBC Inc. and operating, maintenance and management services related to
the Waneta, Brilliant and Arrow Lakes hydroelectric generating plants. Excludes the non-regulated generation operations of FortisBC Inc.’s wholly owned Walden hydroelectric generating facility, which was sold in February 2016.
Electricity SalesThe decrease in electricity sales for the quarter and year to date was mainly due to lower average consumption in the second quarter as a result of warmer temperatures. The decrease year to date was partially offset by higher average consumption in the first quarter as a result of colder temperatures.
RevenueThe increase in revenue for the quarter and year to date was driven by increases in base electricity rates and surplus capacity sales, partially offset by a decrease in electricity sales. Revenue year to date was also favourably impacted by higher contribution from non-regulated operating, maintenance and management services associated with the Waneta Expansion.
EarningsThe increase in earnings for the quarter was primarily due to approximately $3 million associated with the timing of quarterly earnings compared to the same period in 2015, as a result of the impact of regulatory deferral mechanisms, and rate base growth.
The decrease in earnings year to date was primarily due to approximately $6 million associated with the timing of quarterly earnings compared to the same period in 2015, as a result of the impact of regulatory deferral mechanisms and the timing of power purchase costs in 2015. An increase in base electricity rates effective January 1, 2015 was established to recover higher power purchase costs, which commenced in the second quarter of 2015. As a result, net earnings were higher in the first quarter of 2015 and the timing effect reversed in the third and fourth quarters of 2015. The decrease year to date was partially offset by higher earnings from non-regulated operating, maintenance and management services and rate base growth.
EASTERN CANADIAN ELECTRIC UTILITIES (1)
Financial Highlights (Unaudited) Quarter Year-to-DatePeriods Ended June 30 2016 2015 Variance 2016 2015 VarianceElectricity Sales (GWh) 1,921 1,912 9 4,627 4,671 (44)Revenue ($ millions) 245 232 13 574 554 20Earnings ($ millions) 16 15 1 34 34 —(1) Comprised of Newfoundland Power Inc. (“Newfoundland Power”), Maritime Electric Company, Limited
(“Maritime Electric”) and FortisOntario Inc. (“FortisOntario”). FortisOntario mainly includes Canadian Niagara Power Inc., Cornwall Street Railway, Light and Power Company, Limited, and Algoma Power Inc.

Interim Management Discussion and Analysis 12 June 30, 2016
Electricity SalesThe increase in electricity sales for the quarter was primarily due to customer growth in Newfoundland, partially offset by lower average consumption in Newfoundland and Ontario.
The decrease in electricity sales year to date was primarily due to lower average consumption by residential customers in all regions, mainly due to warmer temperatures. The decrease was partially offset by customer growth in Newfoundland.
RevenueThe increase in revenue for the quarter and year to date was mainly due to the flow through in customer electricity rates of higher energy supply costs at Newfoundland Power and FortisOntario. Higher electricity sales had a favourable impact on revenue for the quarter, while lower electricity sales decreased revenue year to date.
EarningsEarnings for the quarter and year to date were comparable with the same periods in 2015. The impact of a decrease in the allowed ROE at Newfoundland Power effective January 1, 2016 was largely offset by the impact of approximately $1 million in business development costs in Ontario in the second quarter of 2015.
REGULATED ELECTRIC UTILITIES - CARIBBEAN (1)
Financial Highlights (Unaudited) Quarter Year-to-DatePeriods Ended June 30 2016 2015 Variance 2016 2015 VarianceAverage US:CAD Exchange Rate (2) 1.29 1.23 0.06 1.33 1.24 0.09Electricity Sales (GWh) 215 202 13 405 382 23Revenue ($ millions) 71 74 (3) 146 152 (6)Earnings ($ millions) 11 9 2 21 14 7(1) Comprised of Caribbean Utilities Company, Ltd. (“Caribbean Utilities”) on Grand Cayman, Cayman Islands, in which
Fortis holds an approximate 60% controlling interest, and two wholly owned utilities in the Turks and Caicos Islands, FortisTCI Limited and Turks and Caicos Utilities Limited (collectively “Fortis Turks and Caicos”). Also includes the Corporation’s 33% equity investment in Belize Electricity.
(2) The reporting currency of Caribbean Utilities and Fortis Turks and Caicos is the US dollar.
Electricity SalesThe increase in electricity sales for the quarter and year to date was primarily due to overall warmer temperatures, which increased air conditioning load, and growth in the number of customers as a result of increased economic activity.
RevenueThe decrease in revenue for the quarter and year to date was mainly due to the flow through in customer electricity rates of lower fuel costs at Caribbean Utilities. The decrease was partially offset by approximately $3 million and $8 million of favourable foreign exchange for the quarter and year to date, respectively, associated with the translation of US dollar-denominated revenue, and electricity sales growth.
EarningsThe increase in earnings for the quarter and year to date was primarily due to approximately $1 million and $3 million, respectively, of favourable foreign exchange associated with the translation of US dollar-denominated earnings, electricity sales growth and an increase in capitalized interest at Caribbean Utilities. Equity income from Belize Electricity also had a favourable impact on earnings year to date. The increase in earnings for the quarter and year to date was partially offset by higher depreciation.

Interim Management Discussion and Analysis 13 June 30, 2016
NON-REGULATED – ENERGY INFRASTRUCTURE (1)
Financial Highlights (Unaudited) Quarter Year-to-DatePeriods Ended June 30 2016 2015 Variance 2016 2015 VarianceEnergy Sales (GWh) 516 492 24 605 552 53Revenue ($ millions) 67 41 26 95 48 47Earnings ($ millions) 19 45 (26) 30 48 (18)(1) Primarily comprised of long-term contracted generation assets in British Columbia and Belize, with a combined
generating capacity of 391 MW, and the Aitken Creek natural gas storage facility in British Columbia, with a total working gas capacity of 77 billion cubic feet. Aitken Creek was acquired by Fortis on April 1, 2016 and the financial results are included in this segment from the date of acquisition. For further information, refer to the “Significant Items” section of this MD&A and Note 15 to the interim unaudited consolidated financial statements. In February 2016 the Corporation sold its 16-MW Walden hydroelectric generating facility.
Energy SalesThe increase in energy sales for the quarter was primarily due to the Waneta Expansion, as a result of a planned outage in the second quarter of 2015. The increase was partially offset by lower energy sales due to the sale of generation assets in 2015 and February 2016, and decreased production in Belize due to lower rainfall.
The increase in energy sales year to date was driven by the Waneta Expansion, which commenced production in early April 2015, and increased production in Belize due to higher rainfall in the first quarter of 2016. The increase was partially offset by lower energy sales due to the sale of generation assets in 2015 and February 2016.
RevenueThe increase in revenue for the quarter was driven by the acquisition of Aitken Creek in early April 2016, which recognized revenue of $26 million for the second quarter of 2016, and increased production at the Waneta Expansion. The increase was partially offset by decreased production in Belize and the sale of generation assets.
The increase in revenue year to date was driven by the acquisition of Aitken Creek, as discussed above for the quarter, and the Waneta Expansion, which commenced production in early April 2015. The impacts of increased production in Belize and approximately $1 million of favourable foreign exchange associated with the translation of US dollar-denominated revenue were partially offset by lower revenue due to the sale of generation assets.
EarningsThe decrease in earnings for the quarter and year to date was primarily due to the recognition of an after-tax gain of approximately $27 million (US$22 million), net of expenses and foreign exchange impacts, on the sale of generation assets in the second quarter of 2015. Excluding the gain, earnings for the quarter and year to date increased by $1 million and $9 million, respectively. The variance explanations below exclude the impact of the gain.
The increase in earnings for the quarter was primarily due to contribution of $2 million from Aitken Creek, net of an after-tax $2 million unrealized loss on the mark-to-market of derivatives, and increasedproduction at the Waneta Expansion. The increase was partially offset by decreased production in Belize and the sale of generation assets.
The increase in earnings year to date was primarily due to the Waneta Expansion, which commenced production in early April 2015, and contribution from Aitken Creek, as discussed above for the quarter. The impacts of increased production in Belize and approximately $1 million of favourable foreign exchange associated with the translation of US dollar-denominated earnings were partially offset by lower earnings due to the sale of generation assets.

Interim Management Discussion and Analysis 14 June 30, 2016
NON-REGULATED - NON-UTILITY (1)
Financial Highlights (Unaudited)Periods Ended June 30 Quarter Year-to-Date($ millions) 2016 2015 Variance 2016 2015 VarianceRevenue — 65 (65) — 118 (118)Earnings — 104 (104) — 102 (102)(1) Comprised of Fortis Properties, which completed the sale of its commercial real estate and hotel assets in June 2015
and October 2015, respectively.
RevenueThe decrease in revenue for the quarter and year to date was due to the sale of commercial real estate and hotel assets in 2015.
EarningsThe decrease in earnings for the quarter and year to date was due to the sale of commercial real estate and hotel assets in 2015. In the second quarter of 2015, an after-tax net gain of approximately $96 million was recognized related to the sale of commercial real estate and hotel assets.
CORPORATE AND OTHER (1)
Financial Highlights (Unaudited)Periods Ended June 30 Quarter Year-to-Date($ millions) 2016 2015 Variance 2016 2015 VarianceRevenue 3 7 (4) 5 14 (9)Operating Expenses 28 12 16 53 17 36Depreciation and Amortization 1 1 — 2 1 1Other Income (Expenses), Net 1 (1) 2 4 8 (4)Finance Charges 34 24 10 62 45 17Income Tax Recovery (17) (10) (7) (34) (19) (15)
(42) (21) (21) (74) (22) (52)Preference Share Dividends 18 19 (1) 37 39 (2)Net Corporate and Other Expenses (60) (40) (20) (111) (61) (50)(1) Includes Fortis net Corporate expenses; non-regulated holding company expenses of FortisBC Holdings Inc. (“FHI”),
CH Energy Group, Inc. and UNS Energy Corporation; and the financial results of FHI’s wholly owned subsidiary FortisBC Alternative Energy Services Inc.
Net Corporate and Other expenses were impacted by the following items:
(i) Acquisition-related expenses of $29 million ($22 million after tax) and $49 million ($39 million after tax) for the second quarter and year-to-date 2016, respectively, associated with the pending Acquisition of ITC. Acquisition-related expenses included: investment banking, legal, consulting and other fees totalling approximately $19 million ($15 million after tax) and $35 million ($29 million after tax) for the second quarter and year-to-date 2016, respectively, that were included in operating expenses; and fees associated with the Corporation’s Acquisition credit facilities totalling approximately $10 million ($7 million after tax) and $14 million ($10 million after tax) for the second quarter and year-to-date 2016, respectively, that were included in finance charges; and
(ii) A foreign exchange loss of $1 million in the second quarter of 2015 and a foreign exchange gain of $8 million year-to-date 2015 associated with the Corporation’s previous US dollar-denominated long-term other asset that represented the book value of its expropriated investment in Belize Electricity.
Interim Management Discussion and Analysis 15 June 30, 2016
Excluding the above-noted items, net Corporate and Other expenses were $38 million for the quarter compared to $39 million for the same period in 2015. A decrease in revenue due to lower related-party interest income, mainly due to the sale of commercial real estate and hotel assets in 2015, was largely offset by lower operating expenses. The decrease in operating expenses was mainly due to a $3 million ($2 million after tax) corporate donation in the second quarter of 2015.
Excluding the above-noted items, net Corporate and Other expenses were $72 million year to date compared to $69 million for the same period in 2015. The increase was primarily due to: (i) lower revenue, as discussed above for the quarter; (ii) higher finance charges, due to the impact of no longer capitalizing interest upon the completion of the Waneta Expansion in April 2015 and the impact of unfavourable foreign exchange associated with the translation of US dollar-denominated interest expense, partially offset by lower interest on the Corporation’s credit facilities; and (iii) an increase in operating expenses, mainly due to higher share-based compensation expenses, largely as a result of share price appreciation, and other general inflationary increases, partially offset by a corporate donation in the second quarter of 2015, as discussed above for the quarter. The increase was partially offset by other income associated with the release of provisions on the wind-up of a partnership and a higher income tax recovery.
MATERIAL REGULATORY DECISIONS AND APPLICATIONS
The nature of regulation associated with each of the Corporation’s regulated electric and gas utilities is generally consistent with that disclosed in the 2015 Annual MD&A. The following summarizes the significant ongoing regulatory proceedings and significant decisions and applications for the Corporation’s regulated utilities in the first half of 2016.
UNS EnergyGeneral Rate ApplicationsIn November 2015 TEP, UNS Energy’s largest utility, filed a general rate application (“GRA”) with the Arizona Corporation Commission (“ACC”) requesting new retail rates to be effective January 1, 2017, using the year ended June 30, 2015 as a historical test year. The key provisions of the rate request included: (i) a base retail rate increase of US$110 million, or 12.0%, compared with adjusted test year revenue; (ii) a 7.34% return on original cost rate base of US$2.1 billion; (iii) a common equity component of capital structure of approximately 50%; (iv) a cost of equity of 10.35% and an average cost of debt of 4.32%; and (v) rate design changes that would reduce the reliance on volumetric sales to recover fixed costs, and a new net metering tariff that would ensure that customers who install distributed generation pay an equitable price for their electric service. Since its last approved rate order in 2013, which used a 2011 historical test year, TEP’s total rate base has increased by approximately US$0.6 billion and the common equity component of capital structure has increased from 43.5% to approximately 50%. Following the review of intervener direct testimony, TEP filed rebuttal testimony in July 2016. In rebuttal testimony, TEP revised its rate request to reflect a US$101 million increase in base retail rates, proposed a 7.16% return on original cost rate base, proposed a cost of equity of 10.00%, and a recovery of operating expenses on the third-party owners’ portion of Springerville Unit 1 through base rates. A decision on TEP’s application is expected in the fourth quarter of 2016.
In May 2015 UNS Electric filed a GRA requesting new retail rates to be effective May 1, 2016, using 2014 as a historical test year. The nature of UNS Electric’s GRA was similar to that of TEP. In July 2016 the presiding Administrative Law Judge (“ALJ”) issued a Recommended Opinion and Order that will be considered by the ACC. The key provisions of the order included approval of a US$15 million non-fuel base rate increase and an allowed ROE of 9.50%. A decision by the ACC is expected in the third quarter of 2016.
FERC OrderIn 2015 TEP reported to FERC that it had not filed on a timely basis certain FERC jurisdictional agreements and, at that time, TEP made necessary compliance filings, including the filing of several TEP transmission service agreements entered into between 2003 and 2015 that contained certain deviations from TEP’s standard form of service agreement. In April 2016 FERC issued an order relating to the late-filed transmission service agreements, which directed TEP to issue time value refunds to the relevant counterparties to the agreements in an amount up to $18 million (US$13 million), or $11 million (US$8 million) after tax. TEP accrued this amount in the first quarter of 2016. As specified in the order, TEP reviewed its calculations of the ordered refunds and determined the refund amount to be US$3 million, which was paid to the relevant counterparties in June 2016. TEP filed a refund report with

Interim Management Discussion and Analysis 16 June 30, 2016
FERC in July 2016. The amount of refunds paid is subject to final approval by FERC and may be modified if FERC does not accept TEP’s refund report.
In June 2016, to preserve its rights, TEP petitioned the District of Columbia Circuit Court of Appeals to review the refund order. In July 2016 TEP filed an unopposed motion to hold the appeal in abeyance, which the Court has since granted. The results of the compliance filings are still being reviewed by FERC and, as a result, FERC could also impose civil penalties on TEP.
FortisAlbertaCapital Tracker ApplicationsIn February 2016 the Alberta Utilities Commission (“AUC”) issued its decision related to FortisAlberta’s 2014 True-Up and 2016-2017 Capital Tracker Applications, resulting in a capital tracker revenue adjustment of less than $1 million in the first quarter of 2016. Capital tracker revenue related to 2015 is subject to change and FortisAlberta filed a 2015 True-Up Application in June 2016, with a decision expected in the first quarter of 2017.
FortisAlberta expects to recognize capital tracker revenue of $65 million for 2016, down $7 million from the amount previously requested in the 2016-2017 Capital Tracker Application to reflect actual capital expenditures and associated financing costs compared to forecast. In April 2016 FortisAlberta filed its Compliance Filing related to the February 2016 capital tracker decision and a decision is expected in the second half of 2016.
FortisAlberta expects that the adjustments to capital tracker revenue, as discussed above, will be considered in the 2017 Annual Rates Application, to be filed in September 2016, and reflected in customer rates effective January 1, 2017.
Utility Asset Disposition MattersIn November 2015 the utilities in Alberta filed an application with the Supreme Court of Canada (the “Supreme Court”) seeking leave to appeal the Court of Appeal of Alberta’s September 2015 decision, which implied that the shareholder is responsible for the cost of stranded assets. In April 2016 the Supreme Court dismissed the leave to appeal application. This decision has no immediate impact on FortisAlberta’s financial position; however, it exposes the Company to the risk that unrecovered costs associated with utility assets deemed by the AUC to have been subject to an extraordinary retirement will not be recoverable from customers.
Next Generation PBR ProceedingIn May 2015 the AUC initiated a generic proceeding to establish parameters for the next term of PBR, being the five-year period from 2018 to 2022. The AUC is assessing three main issues: (i) rebasing and the going-in rates for the next PBR term; (ii) the productivity factor; and (iii) the ongoing treatment of capital. In March 2016 FortisAlberta, along with other Alberta utilities, submitted common expert evidence to the AUC on the design of the next PBR term. At that time, FortisAlberta also submitted Company-specific evidence for the implementation of the next PBR term. A hearing was held in July 2016 with a decision expected by the end of 2016.
Eastern Canadian Electric UtilitiesIn June 2016 the Newfoundland and Labrador Board of Commissioners of Public Utilities issued an order on Newfoundland Power’s 2016/2017 GRA, with new customer rates effective July 1, 2016. The order, which established the cost of capital for rate-making purposes for 2016 through 2018, resulted in a decrease in the allowed ROE to 8.50% from 8.80%, effective January 1, 2016, on a 45% common equity component of capital structure. Newfoundland Power is required to file its next GRA for 2019 on or before June 1, 2018.
In October 2015 Maritime Electric filed a GRA with the Island Regulatory and Appeals Commission (“IRAC”) to set customer rates effective March 1, 2016, on expiry of the Prince Edward Island Energy Accord. In January 2016 Maritime Electric and the Government of Prince Edward Island entered into a 2016 General Rate Agreement covering the three-year period from March 1, 2016 through February 28, 2019. In February 2016 IRAC issued an order effective March 1, 2016 that reflected the terms of the Agreement. The order provides for an allowed ROE capped at 9.35% on an average common equity component of capital structure of approximately 40% for 2016 through 2018.

Interim Management Discussion and Analysis 17 June 30, 2016
Significant Regulatory Proceedings
The following table summarizes significant ongoing regulatory proceedings, including filing dates and expected timing of decisions for the Corporation’s regulated utilities.
Regulated Utility Application/Proceeding Filing Date Expected DecisionTEP GRA for 2017 November 2015 Fourth quarter of 2016UNS Electric GRA for 2016 May 2015 Third quarter of 2016Central Hudson Reforming the Energy Vision Not applicable To be determinedFortisBC Energy 2016 Cost of Capital Application October 2015 Third quarter of 2016FortisAlberta 2016/2017 GCOC Proceeding Not applicable Second half of 2016
Next Generation PBR Proceeding Not applicable Fourth quarter of 2016
CONSOLIDATED FINANCIAL POSITION
The following table outlines the significant changes in the consolidated balance sheets between June 30, 2016 and December 31, 2015.
Significant Changes in the Consolidated Balance Sheets (Unaudited) betweenJune 30, 2016 and December 31, 2015
Balance Sheet Account
Increase/(Decrease)($ millions) Explanation
Accounts receivable and other current assets
(130) The decrease was primarily due to the impact of a seasonal decrease in sales at FortisBC Energy, FortisBC Electric, Newfoundland Power and Central Hudson. The decrease was partially offset by higher transmission rate riders at FortisAlberta.
Utility capital assets 177 The increase was mainly due to utility capital expenditures and the acquisition of Aitken Creek, partially offset by the impact of foreign exchange on the translation of US dollar-denominated utility capital assets and depreciation.
Goodwill (155) The decrease was primarily due to the impact of foreign exchange on the translation of US dollar-denominated goodwill.
Short-term borrowings (277) The decrease was mainly due to the repayment of short-term borrowings at FortisBC Energy using net proceeds from the issuance of long-term debt.
Accounts payable and other current liabilities
(252) The decrease was primarily due to timing of the declaration of the Corporation’s common share dividends, a reduction in capital accruals at FortisBC Energy, and lower amounts owing for energy supply costs at FortisBC Energy, FortisBC Electric, Newfoundland Power and Central Hudson associated with the seasonality of operations.
Long-term debt (including current portion)
391 The increase was primarily due to higher borrowings under committed credit facilities at the Corporation, mainly to finance the acquisition of Aitken Creek, and at the regulated utilities, largely in support of energy infrastructure investment, and the issuance of long-term debt at FortisBC Energy. The increase was partially offset by the impact of foreign exchange on the translation of US dollar-denominated debt and regularly scheduled debt repayments.

Interim Management Discussion and Analysis 18 June 30, 2016
LIQUIDITY AND CAPITAL RESOURCES
The table below outlines the Corporation’s sources and uses of cash for the three and six months ended June 30, 2016, as compared to the same periods in 2015, followed by a discussion of the nature of the variances in cash flows.
Summary of Consolidated Cash Flows (Unaudited)Periods Ended June 30 Quarter Year-to-Date($ millions) 2016 2015 Variance 2016 2015 VarianceCash, Beginning of Period 232 299 (67) 242 230 12Cash Provided by (Used in):Operating Activities 448 468 (20) 931 918 13Investing Activities (762) (135) (627) (1,175) (688) (487)Financing Activities 380 166 214 314 322 (8)Effect of Exchange Rate Changes on
Cash and Cash Equivalents (2) (2) — (16) 17 (33)Change in Cash Associated with
Assets Held for Sale — 1 (1) — (2) 2Cash, End of Period 296 797 (501) 296 797 (501)
Operating Activities: Cash flow from operating activities for the quarter and year to date were comparable with the same periods in 2015. Higher cash earnings were largely offset by changes in working capital and long-term regulatory deferrals.
Investing Activities: Cash used in investing activities was $627 million higher for the quarter and $487 million higher year to date compared to the same periods in 2015. The increase was primarily due to proceeds received from the sale of commercial real estate assets and generation assets in the second quarter of 2015 of approximately $430 million and $77 million (US$63 million), respectively, and the acquisition of Aitken Creek in April 2016 for a net cash purchase price of $318 million. The increase for the quarter and year to date was partially offset by lower capital spending at UNS Energy, FortisBC Energy and FortisAlberta. The decrease in capital spending at UNS Energy was mainly due to the purchase of additional ownership interests in the Springerville Unit 1 generating facility and previously leased coal-handling assets in the first and second quarters of 2015, respectively. The decrease in capital spending at FortisBC Energy was mainly due to lower capital expenditures related to the Tilbury liquefied natural gas (“LNG”) facility expansion (“Tilbury 1A”). At FortisAlberta, the decrease was mainly due to lower Alberta Electric System Operator (“AESO”) contributions and lower capital expenditures for customer growth.
Financing Activities: Cash provided by financing activities was $214 million higher quarter over quarter. The increase was primarily due to higher proceeds from the issuance of long-term debt, higher net borrowings under committed credit facilities, partially offset by higher repayments of short-term borrowings at FortisBC Energy.
Cash provided by financing activities was $8 million lower year to date compared to the same period in 2015. The decrease was primarily due to lower proceeds from the issuance of long-term debt and higher repayments of short-term borrowings at FortisBC Energy, partially offset by higher net borrowings under committed credit facilities and lower repayments of long-term debt and capital lease and finance obligations.

Interim Management Discussion and Analysis 19 June 30, 2016
Proceeds from long-term debt, net of issue costs, repayments of long-term debt and capital lease and finance obligations, and net borrowings (repayments) under committed credit facilities for the quarter and year to date compared to the same periods last year are summarized in the following tables.
Proceeds from Long-Term Debt, Net of Issue Costs (Unaudited)Periods Ended June 30 Quarter Year-to-Date($ millions) 2016 2015 Variance 2016 2015 VarianceUNS Energy (1) — 61 (61) — 431 (431)Central Hudson (2) 29 — 29 29 25 4FortisBC Energy (3) 298 150 148 298 150 148Fortis Turks and Caicos (4) 29 — 29 29 12 17Total 356 211 145 356 618 (262)(1) In February 2015 TEP issued 10-year US$300 million 3.05% senior unsecured notes. Net proceeds were used to
repay long-term debt and credit facility borrowings and to finance capital expenditures. In April 2015 UNS Electric issued 30-year US$50 million 3.95% unsecured notes. The net proceeds were primarily used for general corporate purposes.
(2) In June 2016 Central Hudson issued 4-year US$24 million 2.16% unsecured notes. The net proceeds were used to finance capital expenditures and for general corporate purposes. In March 2015 Central Hudson issued 10-year US$20 million 2.98% unsecured notes. The net proceeds were used to finance capital expenditures and for general corporate purposes.
(3) In April 2016 FortisBC Energy issued $300 million of unsecured debentures in a dual tranche of 10-year $150 million unsecured debentures at 2.58% and 30-year $150 million unsecured debentures at 3.67%. The net proceeds were used to repay short-term borrowings and to finance capital expenditures. In April 2015 FortisBC Energy issued 30-year $150 million 3.38% unsecured debentures. The net proceeds were used to repay short-term borrowings and for general corporate purposes.
(4) In May 2016 Fortis Turks and Caicos issued 15-year US$23 million 5.14% unsecured notes. The net proceeds will be used to finance capital expenditures. In January 2015 Fortis Turks and Caicos issued 15-year US$10 million 4.75% unsecured notes. The net proceeds were used to finance capital expenditures and for general corporate purposes.
Repayments of Long-Term Debt and Capital Lease and Finance Obligations (Unaudited)Periods Ended June 30 Quarter Year-to-Date($ millions) 2016 2015 Variance 2016 2015 VarianceUNS Energy (6) (5) (1) (19) (173) 154Central Hudson (10) — (10) (10) — (10)FortisBC Energy (7) (12) 5 (9) (14) 5FortisBC Electric — — — (25) — (25)Newfoundland Power (30) — (30) (30) — (30)Caribbean Utilities (14) (13) (1) (14) (13) (1)Fortis Turks and Caicos (2) — (2) (2) — (2)Other — (36) 36 — (36) 36Total (69) (66) (3) (109) (236) 127
Net Borrowings (Repayments) Under Committed Credit Facilities (Unaudited)Periods Ended June 30 Quarter Year-to-Date($ millions) 2016 2015 Variance 2016 2015 VarianceUNS Energy 22 (35) 57 68 (122) 190FortisAlberta 45 36 9 62 82 (20)Newfoundland Power 24 8 16 46 27 19Corporate (1) 330 272 58 337 275 62Total 421 281 140 513 262 251(1) Borrowings under the Corporation’s committed credit facility in the second quarter of 2016 were primarily used to
finance the acquisition of Aitken Creek.

Interim Management Discussion and Analysis 20 June 30, 2016
Borrowings under credit facilities by the utilities are primarily in support of their respective capital expenditure programs and/or for working capital requirements. Repayments are primarily financed through the issuance of long-term debt, cash from operations and/or equity injections from Fortis. From time to time, proceeds from preference share, common share and long-term debt offerings are used to repay borrowings under the Corporation’s committed credit facility.
Common share dividends paid in the second quarter of 2016 were $70 million, net of $36 million of dividends reinvested, compared to $55 million, net of $40 million of dividends reinvested, paid in the second quarter of 2015. Common share dividends paid year-to-date 2016 were $147 million, net of $65 million in dividends reinvested, compared to $115 million, net of $74 million of dividends reinvested, paid year-to-date 2015. The dividend paid per common share for each of the first and second quarters of 2016 was $0.375 compared to $0.34 for each of the first and second quarters of 2015. The weighted average number of common shares outstanding for the second quarter and year-to-date 2016 was 283.7 million and 283.0 million, respectively, compared to 277.9 million and 277.3 million for the same periods in 2015.
CONTRACTUAL OBLIGATIONS
The Corporation’s consolidated contractual obligations with external third parties in each of the next five years and for periods thereafter as at June 30, 2016, are outlined in the following table. A detailed description of the nature of the obligations is provided in the 2015 Annual MD&A and below, where applicable.
Contractual Obligations (Unaudited)Due
within1 year
Due inyear 2
Due inyear 3
Due inyear 4
Due inyear 5
Dueafter
5 years
As at June 30, 2016($ millions) TotalLong-term debt 11,630 415 76 426 68 595 10,050Interest obligations on long-term debt 9,182 518 505 499 488 477 6,695Capital lease and finance obligations 2,426 72 65 92 77 61 2,059Renewable power purchase obligations (1) 1,509 90 90 90 90 89 1,060Power purchase obligations 1,376 296 219 135 62 34 630Gas purchase contract obligations 1,359 351 279 207 152 121 249Long-term contracts - UNS Energy (2) 1,155 176 165 147 131 99 437Capital cost 478 19 19 19 19 15 387Purchase of Springerville Unit 1 and common facilities (3) 247 110 49 — — 88 —Operating lease obligations 165 11 11 10 9 6 118Renewable energy credit purchase agreements 146 12 12 12 12 12 86Defined benefit pension funding contributions 121 39 11 9 9 9 44Waneta Partnership promissory note 72 — — — 72 — —Joint-use asset and shared service agreements 54 3 3 3 3 3 39Other 82 22 15 21 — — 24Total 30,002 2,134 1,519 1,670 1,192 1,609 21,878(1) UNS Energy is party to renewable power purchase agreements totalling approximately US$1,168 million as at
June 30, 2016, which require UNS Energy to purchase 100% of the output of certain renewable energy generation facilities that have achieved commercial operation. In March 2016 one of the facilities achieved commercial operation, increasing estimated future payments of renewable power purchase contracts by US$58 million as at June 30, 2016.
(2) In January 2016 the ownership of the San Juan generating station was restructured and a new coal supply agreement came into effect under which TEP’s minimum purchase obligations are US$137 million as at June 30, 2016.
(3) In February 2016 TEP entered into a settlement agreement with third-party owners of Springerville Unit 1 to purchase the third-party owners’ 50.5% undivided interest in Springerville Unit 1 for US$85 million. The purchase is expected to close in the third quarter of 2016. For a discussion of the nature of the Springerville Unit 1 litigation, refer to the “Critical Accounting Estimates” section of this MD&A.
Other contractual obligations, which are not reflected in the above table, did not materially change from those disclosed in the 2015 Annual MD&A.

Interim Management Discussion and Analysis 21 June 30, 2016
For a discussion of the nature and amount of the Corporation’s consolidated capital expenditure program not included in the preceding Contractual Obligations table, refer to the “Capital Expenditure Program” section of this MD&A.
CAPITAL STRUCTURE
The Corporation’s principal businesses of regulated electric and gas utilities require ongoing access to capital to enable the utilities to fund maintenance and expansion of infrastructure. Fortis raises debt at the subsidiary level to ensure regulatory transparency, tax efficiency and financing flexibility. Fortis generally finances a significant portion of acquisitions at the corporate level with proceeds from common share, preference share and long-term debt offerings. To help ensure access to capital, the Corporation targets a consolidated long-term capital structure containing approximately 35% common equity, 65% debt and preferred equity, as well as investment-grade credit ratings. Each of the Corporation’s regulated utilities maintains its own capital structure in line with the deemed capital structure reflected in each of the utility’s customer rates.
The consolidated capital structure of Fortis is presented in the following table.
Capital Structure (Unaudited) As atJune 30, 2016 December 31, 2015
($ millions) (%) ($ millions) (%)
Total debt and capital lease and finance obligations (net of cash) (1) 12,054 55.0 12,022 54.9
Preference shares 1,820 8.3 1,820 8.3Common shareholders’ equity 8,031 36.7 8,060 36.8Total (2) 21,905 100.0 21,902 100.0(1) Includes long-term debt, capital lease and finance obligations, including current portion, and short-term borrowings,
net of cash. Excludes deferred financing costs.(2) Excludes amounts related to non-controlling interests
Excluding capital lease and finance obligations, the Corporation’s capital structure as at June 30, 2016 was 54.0% debt, 8.5% preference shares and 37.5% common shareholders’ equity (December 31, 2015 -53.8% debt, 8.5% preference shares and 37.7% common shareholders’ equity).
CREDIT RATINGS
The Corporation’s credit ratings are as follows:
Standard & Poor’s (“S&P”) A- / Negative (long-term corporate credit rating)BBB+ / Negative (unsecured debt credit rating)
DBRS A (low) / Under Review – Negative Implications (unsecured debt credit rating)
The above-noted credit ratings reflect the Corporation’s low business-risk profile and diversity of its operations, the stand-alone nature and financial separation of each of the regulated subsidiaries of Fortis, and management’s commitment to maintaining reasonable levels of debt at the holding company level. In February 2016, after the announcement by Fortis that it had entered into an agreement to acquire ITC, S&P affirmed the Corporation’s long-term corporate credit rating at A-, revised its unsecured debt credit rating to BBB+ from A-, and revised its outlook on the Corporation to negative from stable. Similarly, in February 2016 DBRS placed the Corporation’s unsecured debt credit rating under review with negative implications.
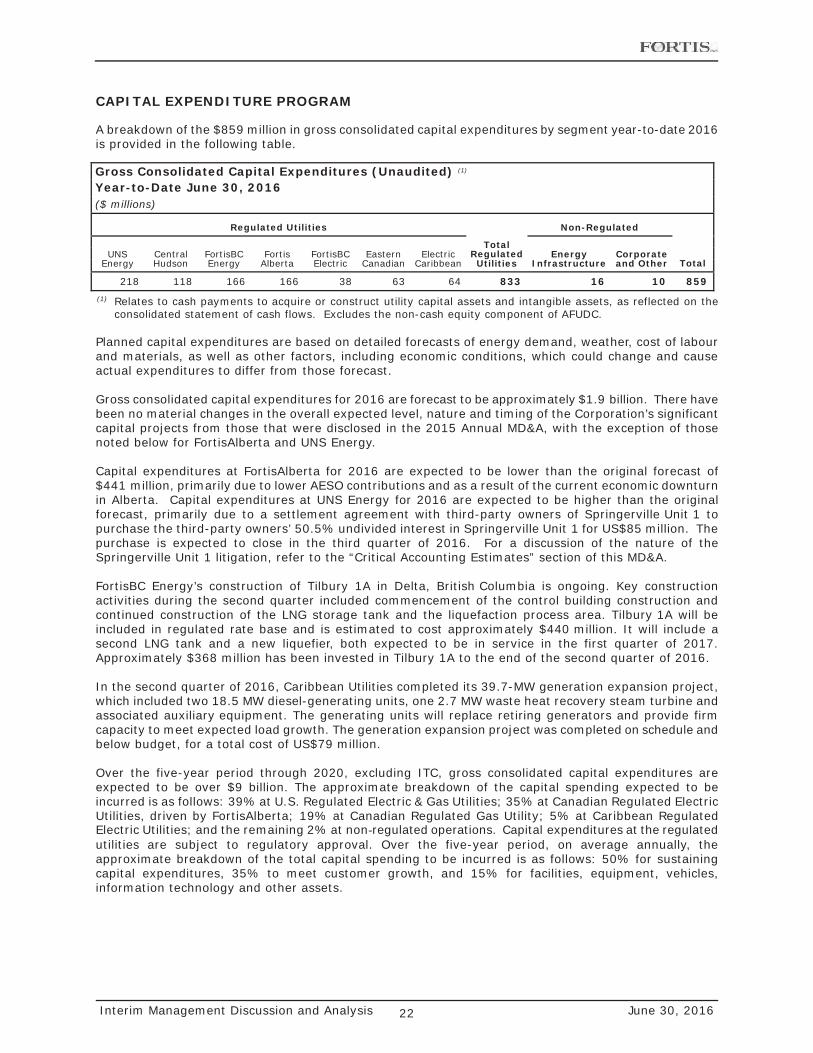
Interim Management Discussion and Analysis 22 June 30, 2016
CAPITAL EXPENDITURE PROGRAM
A breakdown of the $859 million in gross consolidated capital expenditures by segment year-to-date 2016is provided in the following table.
Gross Consolidated Capital Expenditures (Unaudited) (1)
Year-to-Date June 30, 2016($ millions)
Regulated Utilities Non-Regulated
UNS Energy
Central Hudson
FortisBC Energy
Fortis Alberta
FortisBC Electric
Eastern Canadian
Electric Caribbean
Total Regulated Utilities
Energy Infrastructure
Corporate and Other Total
218 118 166 166 38 63 64 833 16 10 859(1) Relates to cash payments to acquire or construct utility capital assets and intangible assets, as reflected on the
consolidated statement of cash flows. Excludes the non-cash equity component of AFUDC.
Planned capital expenditures are based on detailed forecasts of energy demand, weather, cost of labour and materials, as well as other factors, including economic conditions, which could change and cause actual expenditures to differ from those forecast.
Gross consolidated capital expenditures for 2016 are forecast to be approximately $1.9 billion. There have been no material changes in the overall expected level, nature and timing of the Corporation’s significant capital projects from those that were disclosed in the 2015 Annual MD&A, with the exception of those noted below for FortisAlberta and UNS Energy.
Capital expenditures at FortisAlberta for 2016 are expected to be lower than the original forecast of $441 million, primarily due to lower AESO contributions and as a result of the current economic downturn in Alberta. Capital expenditures at UNS Energy for 2016 are expected to be higher than the original forecast, primarily due to a settlement agreement with third-party owners of Springerville Unit 1 to purchase the third-party owners’ 50.5% undivided interest in Springerville Unit 1 for US$85 million. The purchase is expected to close in the third quarter of 2016. For a discussion of the nature of the Springerville Unit 1 litigation, refer to the “Critical Accounting Estimates” section of this MD&A.
FortisBC Energy’s construction of Tilbury 1A in Delta, British Columbia is ongoing. Key construction activities during the second quarter included commencement of the control building construction and continued construction of the LNG storage tank and the liquefaction process area. Tilbury 1A will be included in regulated rate base and is estimated to cost approximately $440 million. It will include a second LNG tank and a new liquefier, both expected to be in service in the first quarter of 2017. Approximately $368 million has been invested in Tilbury 1A to the end of the second quarter of 2016.
In the second quarter of 2016, Caribbean Utilities completed its 39.7-MW generation expansion project, which included two 18.5 MW diesel-generating units, one 2.7 MW waste heat recovery steam turbine and associated auxiliary equipment. The generating units will replace retiring generators and provide firm capacity to meet expected load growth. The generation expansion project was completed on schedule and below budget, for a total cost of US$79 million.
Over the five-year period through 2020, excluding ITC, gross consolidated capital expenditures are expected to be over $9 billion. The approximate breakdown of the capital spending expected to beincurred is as follows: 39% at U.S. Regulated Electric & Gas Utilities; 35% at Canadian Regulated Electric Utilities, driven by FortisAlberta; 19% at Canadian Regulated Gas Utility; 5% at Caribbean Regulated Electric Utilities; and the remaining 2% at non-regulated operations. Capital expenditures at the regulated utilities are subject to regulatory approval. Over the five-year period, on average annually, the approximate breakdown of the total capital spending to be incurred is as follows: 50% for sustaining capital expenditures, 35% to meet customer growth, and 15% for facilities, equipment, vehicles, information technology and other assets.

Interim Management Discussion and Analysis 23 June 30, 2016
ADDITIONAL INVESTMENT OPPORTUNITIES
In addition to the Corporation’s base consolidated capital expenditure forecast, management is pursuing additional investment opportunities within existing service territories. These additional investment opportunities, as discussed below, are not included in the Corporation’s base capital expenditure forecast and also exclude the pending Acquisition of ITC.
The Corporation continues to pursue additional LNG infrastructure investment opportunities in British Columbia, including a pipeline expansion to the proposed Woodfibre LNG site near Squamish, British Columbia and a further expansion of Tilbury. In December 2014 FortisBC Energy received an Order in Council from the Government of British Columbia effectively exempting these projects from further regulatory approval by the British Columbia Utilities Commission.
FortisBC Energy’s potential pipeline expansion is conditional on Woodfibre LNG proceeding with its LNG export facility. Woodfibre LNG has obtained an export license from the National Energy Board and received environmental assessment approvals from the Squamish First Nation, the British Columbia Environmental Assessment Office, and the Canadian Environmental Assessment Agency. FortisBC Energy also received environmental assessment approval from the Squamish First Nation during the second quarter of 2016. The potential pipeline expansion has an estimated total project cost of $600 million. A final investment decision by Woodfibre LNG is targeted for late 2016.
In July 2016, following the dissolution of a proposed merger between Hawaiian Electric Company, Inc. (“Hawaiian Electric”) and NextEra Energy Resources, the 20-year agreement between Fortis Hawaii Energy Inc., a wholly owned subsidiary of Fortis, and Hawaiian Electric to export LNG to Hawaii was terminated. The Corporation’s Tilbury LNG facility is uniquely positioned to meet customer demand for clean-burning natural gas. The site is scalable and can accommodate additional storage and liquefaction equipment, and is relatively close to international shipping lanes. Fortis is in discussions with a number of other potential export customers.
The Corporation also has other significant opportunities that have not yet been included in the Corporation’s capital expenditure forecast including, but not limited to, the New York Transco, LLC to address electric transmission constraints in New York; renewable energy alternatives at UNS Energy; the Wataynikaneyap transmission line to connect remote First Nations communities at FortisOntario; further gas infrastructure opportunities at FortisBC Energy; and potential further consolidation of Rural Electrification Associations at FortisAlberta.
CASH FLOW REQUIREMENTS
At the subsidiary level, it is expected that operating expenses and interest costs will generally be paid out of subsidiary operating cash flows, with varying levels of residual cash flows available for subsidiary capital expenditures and/or dividend payments to Fortis. Borrowings under credit facilities may be required from time to time to support seasonal working capital requirements. Cash required to complete subsidiary capital expenditure programs is also expected to be financed from a combination of borrowings under credit facilities, equity injections from Fortis and long-term debt offerings.
The Corporation’s ability to service its debt obligations and pay dividends on its common shares and preference shares is dependent on the financial results of the operating subsidiaries and the related cash payments from these subsidiaries. The Corporation’s regulated subsidiaries may be subject to restrictions that may limit their ability to distribute cash to Fortis. These include restrictions by certain regulators limiting the amount of annual dividends and restrictions by certain lenders limiting the amount of debt to total capitalization at the subsidiaries. In addition, there are practical limitations on using the net assets of each of the Corporation’s regulated operating subsidiaries to pay dividends based on management’s intent to maintain the regulator-approved capital structures for each of its regulated operating subsidiaries. The Corporation does not expect that maintaining the targeted capital structures of its regulated operating subsidiaries will have an impact on its ability to pay dividends in the foreseeable future.

Interim Management Discussion and Analysis 24 June 30, 2016
Cash required of Fortis to support subsidiary capital expenditure programs and finance acquisitions is expected to be derived from a combination of borrowings under the Corporation’s committed corporate credit facility and proceeds from the issuance of common shares, preference shares and long-term debt. Depending on the timing of cash payments from the subsidiaries, borrowings under the Corporation’s committed corporate credit facility may be required from time to time to support the servicing of debt and payment of dividends. The subsidiaries expect to be able to source the cash required to fund their 2016 capital expenditure programs. For a discussion of the Corporation’s cash flow requirements associated with the pending Acquisition of ITC, refer to the “Significant Items” section of this MD&A.
In April 2015 FortisBC Energy filed a short-form base shelf prospectus to establish a Medium-Term Note Debenture Program, under which the Company may issue debentures in an aggregate principal amount of up to $1 billion during the 25-month life of the shelf prospectus. In April 2016 FortisBC Energy issued $300 million of unsecured debentures in a dual tranche of 10-year $150 million unsecured debentures at 2.58% and 30-year $150 million unsecured debentures at 3.67% under the base shelf prospectus. The net proceeds were used to repay short-term borrowings and to finance capital expenditures.
As at June 30, 2016, management expects consolidated fixed-term debt maturities and repayments to average approximately $260 million annually over the next five years. The combination of available credit facilities and relatively low annual debt maturities and repayments provides the Corporation and its subsidiaries with flexibility in the timing of access to capital markets.
Fortis and its subsidiaries were compliant with debt covenants as at June 30, 2016 and are expected to remain compliant throughout 2016.
CREDIT FACILITIES
As at June 30, 2016, the Corporation and its subsidiaries had consolidated credit facilities of approximately $3.5 billion, of which approximately $2.1 billion was unused, including $265 million unused under the Corporation’s committed credit facility. The credit facilities are syndicated mostly with the seven largest Canadian banks, as well as large banks in the United States, with no one bank holding more than 20% of these facilities. Approximately $3.3 billion of the total credit facilities are committed facilities with maturities ranging from 2019 through 2021.
The following table outlines the credit facilities of the Corporation and its subsidiaries.
Credit Facilities (Unaudited) As atRegulated Corporate June 30, December 31,
($ millions) Utilities and Other 2016 2015Total credit facilities (1) 2,162 1,343 3,505 3,565Credit facilities utilized:
Short-term borrowings (229) (5) (234) (511)Long-term debt (2) (179) (845) (1,024) (551)Letters of credit outstanding (83) (36) (119) (104)
Credit facilities unused 1,671 457 2,128 2,399(1) Total credit facilities exclude a $300 million option to increase the Corporation’s committed corporate credit facility,
as discussed below. (2) As at June 30, 2016, credit facility borrowings classified as long-term debt included $179 million in current
installments of long-term debt on the consolidated balance sheet (December 31, 2015 - $71 million).
As at June 30, 2016 and December 31, 2015, certain borrowings under the Corporation’s and subsidiaries’ credit facilities were classified as long-term debt. These borrowings are under long-term committed credit facilities and it is management’s intention to refinance these borrowings with long-term permanent financing during future periods. The significant changes in credit facilities from that disclosed in theCorporation’s 2015 Annual MD&A are as follows.
In April 2016 FortisBC Electric amended its $150 million unsecured committed revolving credit facility to now mature in May 2019.
In April 2016 FHI amended its unsecured committed revolving credit facility resulting in an increase in the facility to $50 million and an extension of the maturity date to April 2019.

Interim Management Discussion and Analysis 25 June 30, 2016
In April 2016 the Corporation amended its $1 billion unsecured committed revolving credit facility, resulting in an extension of the maturity date to July 2021. The Corporation has the option to increase the facility to $1.3 billion from $1 billion. As at June 30, 2016, the Corporation has not yet exercised this option.
In June 2016 FortisOntario amended its $30 million unsecured committed revolving credit facility to now mature in June 2019.
In July 2016 FortisBC Energy amended its $700 million unsecured committed revolving credit facility to now mature in August 2021.
In July 2016 FortisAlberta amended its $250 million unsecured committed revolving credit facility to now mature in August 2021.
In July 2016 Newfoundland Power amended its $100 million unsecured committed revolving credit facility to now mature in August 2021.
In connection with the pending Acquisition of ITC, in February 2016 the Corporation obtained commitments of US$2.0 billion from Goldman Sachs Bank USA to bridge the long-term debt financing (“Debt Bridge Facility”) and US$1.7 billion from The Bank of Nova Scotia to primarily bridge the sale of the minority investment in ITC (“Equity Bridge Facilities”). These non-revolving term senior unsecured credit facilities are repayable in full on the first anniversary of their advance. Goldman Sachs Bank USA has syndicated 60% of the Debt Bridge Facility to three other financial institutions, each of which have agreed to provide 20% of such facility. The Bank of Nova Scotia may syndicate a portion of the Equity Bridge Facilities. The credit facilities table does not include the US$3.7 billion Acquisition credit facilities.
FINANCIAL INSTRUMENTS
The carrying values of the Corporation’s consolidated financial instruments approximate their fair values, reflecting the short-term maturity, normal trade credit terms and/or nature of these instruments, except as follows:
Financial Instruments (Unaudited) As atJune 30, 2016 December 31, 2015
Carrying Estimated Carrying Estimated($ millions) Value Fair Value Value Fair ValueWaneta Partnership promissory note 57 61 56 59Long-term debt, including current portion 11,630 12,682 11,240 12,614
The fair value of long-term debt is calculated using quoted market prices when available. When quoted market prices are not available, as is the case with the Waneta Partnership promissory note and certain long-term debt, the fair value is determined by either: (i) discounting the future cash flows of the specific debt instrument at an estimated yield to maturity equivalent to benchmark government bonds or treasury bills with similar terms to maturity, plus a credit risk premium equal to that of issuers of similar credit quality; or (ii) obtaining from third parties indicative prices for the same or similarly rated issues of debt of the same remaining maturities. Since the Corporation does not intend to settle the long-term debt or promissory note prior to maturity, the excess of the estimated fair value above the carrying value does not represent an actual liability.
Derivative Instruments
The Corporation generally limits the use of derivative instruments to those that qualify as accounting, economic or cash flow hedges, or those that are approved for regulatory recovery. The Corporation records all derivative instruments at fair value, with certain exceptions including those derivatives that qualify for the normal purchase and normal sale exception. The fair value of derivative instruments are estimates of the amounts that the Corporation would receive or have to pay to terminate the outstanding contracts as at the balance sheet dates. The Corporation’s derivatives primarily include energy contracts

Interim Management Discussion and Analysis 26 June 30, 2016
that are subject to regulatory deferral, as permitted by the regulators, as well as certain limited energy contracts that are not subject to regulatory deferral and cash flow hedges.
For details of the Corporation’s derivative instruments as at June 30, 2016, refer to Note 16 to the Corporation’s interim unaudited consolidated financial statements. There were no material changes in the nature and amount of the Corporations’ derivative instruments during the three and six months ended June 30, 2016 from those disclosed in the 2015 Annual MD&A, except as follows.
Aitken Creek holds gas swap contracts to manage its exposure to changes in natural gas prices, to capture natural gas price spreads, and to manage the financial risk posed by physical transactions. The fair value of the gas swap contracts was calculated using forward pricing provided by third parties. The unrealized gains and losses on these derivative instruments are recorded in earnings. As at June 30, 2016, unrealized losses totalled $3 million ($2 million after tax).
In July 2016 the Corporation entered into forward-starting deal-contingent interest rate swap contracts with notional amounts totalling US$1.25 billion. These derivatives have been designated as a hedge of a portion of the cash flow risk associated with the expected issuance of approximately US$2 billion of long-term debt to finance a portion of the cash purchase price of the Acquisition of ITC. Any unrealized gains and losses will be recorded in other comprehensive income, with the exception of any hedge ineffectiveness, which will be recorded in earnings. The net gain or loss realized upon settlement of the interest rate swaps will be amortized into earnings over the terms of the associated long-term debt.
OFF-BALANCE SHEET ARRANGEMENTS
With the exception of letters of credit outstanding of $119 million as at June 30, 2016 (December 31, 2015 - $104 million), the Corporation had no off-balance sheet arrangements that are reasonably likely to materially affect liquidity or the availability of, or requirements for, capital resources.
BUSINESS RISK MANAGEMENT
Year-to-date 2016, the business risks of the Corporation were generally consistent with those disclosed in the Corporation’s 2015 Annual MD&A, including certain risks, as disclosed below, and an update to those risks, where applicable.
Regulatory Risk: For further information, refer to the “Material Regulatory Decisions and Applications” section of this MD&A.
Completion of the Acquisition of ITC: In April 2016 Fortis reached a definitive agreement with GIC to acquire a 19.9% equity interest in ITC upon closing of the Acquisition. As a result, the risk of not having a minority investor has been mitigated. The closing of the Acquisition of ITC, however, is not conditional upon having a minority investor.
In May 2016 and June 2016, both Fortis and ITC received shareholder approvals to proceed with the Acquisition and, as such, the risk of the Acquisition not being approved by the respective shareholders has been eliminated.
Capital Resources and Liquidity Risk - Credit Ratings: Year-to-date 2016 the following changes occurred to the debt credit ratings of the Corporation’s utilities: (i) in February 2016, after the announcement by Fortis that it had entered into an agreement to acquire ITC, S&P revised its outlook on TEP, Central Hudson, FortisAlberta, Maritime Electric and Caribbean Utilities to negative from stable; (ii) in March 2016 S&P affirmed Maritime Electric’s secured debt credit rating at ‘A’ and revised its outlook to stable from negative; and (iii) in June 2016 S&P downgraded Central Hudson’s senior unsecured debt rating to ‘A-’ from ‘A’ and revised its outlook to stable from negative.
Defined Benefit Pension and Other Post-Employment Benefit Plan Assets: As at June 30, 2016, the fair value of the Corporation’s consolidated defined benefit pension and other post-employment benefit plan assets was $2,670 million, comparable with $2,647 million as at December 31, 2015.
Interim Management Discussion and Analysis 27 June 30, 2016
CHANGES IN ACCOUNTING POLICIES
The interim consolidated financial statements have been prepared following the same accounting policies and methods as those used to prepare the Corporation’s 2015 annual audited consolidated financial statements, except as described below.
Simplifying Income Statement Presentation by Eliminating the Concept of Extraordinary ItemsEffective January 1, 2016, the Corporation adopted Accounting Standards Update (“ASU”) No. 2015-01, Simplifying Income Statement Presentation by Eliminating the Concept of Extraordinary Items. The amendments in this update are part of the Financial Accounting Standards Board’s (“FASB”) initiative to reduce complexity in accounting standards by eliminating the concept of extraordinary items. The above-noted ASU was applied prospectively and did not impact the Corporation’s interim unaudited consolidated financial statements for the three and six months ended June 30, 2016.
Amendments to the Consolidation AnalysisEffective January 1, 2016, the Corporation adopted ASU No. 2015-02, Amendments to the Consolidation Analysis. The amendments in this update change the analysis that a reporting entity must perform to determine whether it should consolidate certain types of legal entities. Specifically, the amendments note the following regarding limited partnerships: (i) modify the evaluation of whether limited partnerships and similar legal entities are variable interest entities or voting interest entities; and (ii) eliminate the presumption that a general partner should consolidate a limited partnership. The amendments did not materially impact the Corporation’s interim unaudited consolidated financial statements. The amendments did, however, change the Corporation’s 51% controlling ownership interest in the Waneta Expansion Limited Partnership from a voting interest entity to a variable interest entity, resulting in additional disclosure in Note 17 to the Corporation’s interim unaudited consolidated financial statements.
Simplifying the Accounting for Measurement-Period AdjustmentsEffective January 1, 2016, the Corporation adopted ASU No. 2015-16, Simplifying the Accounting for Measurement-Period Adjustments. The amendments in this update require that in a business combination, an acquirer recognize adjustments to provisional amounts that are identified during the measurement period in the reporting period in which the adjustment amounts are determined. Under previous guidance, these adjustments were required to be accounted for retrospectively. ASU No. 2015-16 was applied prospectively and did not have an impact on the Corporation’s interim unaudited consolidated financial statements for the three and six months ended June 30, 2016.
FUTURE ACCOUNTING PRONOUNCEMENTS
The Corporation considers the applicability and impact of all ASUs issued by FASB. The following updates have been issued by FASB, but have not yet been adopted by Fortis. Any ASUs not included below were assessed and determined to be either not applicable to the Corporation or are not expected to have a material impact on the consolidated financial statements.
Revenue from Contracts with CustomersASU No. 2014-09 was issued in May 2014 and the amendments in this update create Accounting Standards Codification (“ASC”) Topic 606, Revenue from Contracts with Customers, and supersede the revenue recognition requirements in ASC Topic 605, Revenue Recognition, including most industry-specific revenue recognition guidance throughout the codification. This standard completes a joint effort by FASB and the International Accounting Standards Board to improve financial reporting by creating common revenue recognition guidance for US GAAP and International Financial Reporting Standards that clarifies the principles for recognizing revenue and that can be applied consistently across various transactions, industries and capital markets. This standard was originally effective for annual and interim periods beginning after December 15, 2016 and is to be applied on a full retrospective or modified retrospective basis. ASU No. 2015-14 was issued in August 2015 and the amendments in this update defer the effective date of ASU No. 2014-09 by one year to annual and interim periods beginning after December 15, 2017. Early adoption is permitted as of the original effective date.
ASU No. 2016-08, Principal versus Agent Considerations, was issued in March 2016, ASU 2016-10, Identifying Performance Obligations and Licensing, was issued in April 2016 and ASU No. 2016-12, Narrow-Scope Improvements and Practical Expedients, was issued in May 2016. The above-noted ASUs clarify implementation guidance in ASC Topic 606. The effective date and transition requirements of these updates are the same as ASU No. 2014-09.
Interim Management Discussion and Analysis 28 June 30, 2016
The majority of the Corporation’s revenue is generated from energy sales to customers based on published tariff rates, as approved by the respective regulators, and is expected to be in the scope of ASU No. 2014-09. Fortis has not yet selected a transition method and is assessing the impact that the adoption of this standard, and all related ASUs, will have on its consolidated financial statements and related disclosures. The Corporation plans to have this assessment substantially complete by the end of 2016.
Recognition and Measurement of Financial Assets and Financial LiabilitiesASU No. 2016-01, Recognition and Measurement of Financial Assets and Financial Liabilities, was issued in January 2016 and the amendments in this update address certain aspects of recognition, measurement, presentation and disclosure of financial instruments. Most notably, the amendments require the following: (i) equity investments in unconsolidated entities (other than those accounted for using the equity method of accounting) to be measured at fair value through earnings; however, entities will be able to elect to record equity investments without readily determinable fair values at cost, less impairment, and plus or minus subsequent adjustments for observable price changes; and (ii) financial assets and financial liabilities to be presented separately in the notes to the consolidated financial statements, grouped by measurement category and form of financial asset. This update is effective for annual and interim periods beginning after December 15, 2017. Fortis is assessing the impact that the adoption of this update will have on its consolidated financial statements and related disclosures.
LeasesASU No. 2016-02 was issued in February 2016 and the amendments in this update create ASC Topic 842,Leases, and supersede lease requirements in ASC Topic 840, Leases. The main provision of ASC Topic 842is the recognition of lease assets and lease liabilities on the balance sheet by lessees for those leases that were previously classified as operating leases. For operating leases, a lessee is required to do the following: (i) recognize a right-of-use asset and a lease liability, initially measured at the present value of the lease payments, on the balance sheet; (ii) recognize a single lease cost, calculated so that the cost of the lease is allocated over the lease term on a generally straight-line basis; and (iii) classify all cash payments within operating activities in the statement of cash flows. These amendments also require qualitative disclosures along with specific quantitative disclosures. This update is effective for annual and interim periods beginning after December 15, 2018 and is to be applied using a modified retrospective approach with practical expedient options. Early adoption is permitted. Fortis is assessing the impact that the adoption of this update will have on its consolidated financial statements and related disclosures.
Improvements to Employee Share-Based Payment AccountingASU No. 2016-09, Improvements to Employee Share-Based Payment Accounting, was issued in March 2016 as part of FASB’s simplification initiative. The areas for simplification in this update involve several aspects of accounting for share-based payment transactions, including income tax consequences, classification of awards as either equity or liabilities, and classification on the statement of cash flows. This update is effective for annual and interim periods beginning after December 15, 2016. Early adoption is permitted, however, an entity that elects early adoption must adopt all the amendments in the same period. Fortis is assessing the impact that the adoption of this update will have on its consolidated financial statements and related disclosures.
Measurement of Credit Losses on Financial InstrumentsASU No. 2016-13, Measurement of Credit Losses on Financial Instruments, was issued in June 2016 and the amendments in this update require entities to use an expected credit loss methodology and toconsider a broader range of reasonable and supportable information to inform credit loss estimates. This update is effective for annual and interim periods beginning after December 15, 2019 and is to be applied on a modified retrospective basis. Early adoption is permitted for annual and interim periods beginning after December 15, 2018. Fortis is assessing the impact that the adoption of this update will have on its consolidated financial statements and related disclosures.

Interim Management Discussion and Analysis 29 June 30, 2016
CRITICAL ACCOUNTING ESTIMATES
The preparation of the Corporation’s interim unaudited consolidated financial statements in accordance with US GAAP requires management to make estimates and judgments that affect the reported amounts of assets and liabilities and the disclosure of contingent assets and liabilities at the date of the consolidated financial statements, and the reported amounts of revenue and expenses during the reporting periods. Estimates and judgments are based on historical experience, current conditions and various other assumptions believed to be reasonable under the circumstances. Additionally, certain estimates and judgments are necessary since the regulatory environments in which the Corporation’s regulated utilities operate often require amounts to be recognized at estimated values until these amounts are finalized pursuant to regulatory decisions or other regulatory proceedings. Due to changes in facts and circumstances, and the inherent uncertainty involved in making estimates, actual results may differ significantly from current estimates. Estimates and judgments are reviewed periodically and, as adjustments become necessary, are recognized in earnings in the period in which they become known. In the event that a regulatory decision is received after the balance sheet date but before the consolidated financial statements are issued, the facts and circumstances are reviewed to determine whether or not it is a recognized subsequent event.
Interim financial statements may also employ a greater use of estimates than the annual financial statements. There were no material changes in the nature of the Corporation’s critical accounting estimates during the six months ended June 30, 2016 from those disclosed in the 2015 Annual MD&A.
Contingencies: The Corporation and its subsidiaries are subject to various legal proceedings and claims associated with the ordinary course of business operations. Management believes that the amount of liability, if any, from these actions would not have a material adverse effect on the Corporation’s consolidated financial position, results of operations or cash flows. There were no material changes in the Corporation’s contingencies from those disclosed in the 2015 Annual MD&A, with the exception of the Springerville Unit 1 litigation, as described below. For complete details of legal proceedings affecting the Corporation, refer to Note 20 to the Corporation’s interim unaudited consolidated financial statements.
UNS EnergySpringerville Unit 1In February 2016 TEP entered into an agreement with the third-party owners for the settlement and release of asserted claims and the purchase and sale of beneficial interests in Springerville Unit 1 (the “Agreement”). The Agreement provides that TEP will purchase the third-party owners’ 50.5% undivided interest in Springerville Unit 1 for US$85 million and the third-party owners will pay TEP US$13 million for operating costs related to Springerville Unit 1 incurred on behalf of the third-party owners. Upon completion of the purchase, all outstanding disputes, pending litigation and arbitration proceedings between TEP and the third-party owners will be dismissed with prejudice.
The purchase of the third-party owners’ undivided interest in Springerville Unit 1 is subject to, among other things, FERC approval and satisfaction of other customary closing conditions. TEP expects the purchase to close in the third quarter of 2016. However, there is no assurance that the settlement will be finalized or that the litigation will not continue. Therefore, at this time TEP cannot predict the outcome of the claims relating to Springerville Unit 1, and, due to the general and non-specific scope and nature of the claims, TEP cannot determine estimates of the range of loss, if any, at this time and, accordingly no amount has been accrued in the consolidated financial statements. Should the litigation matters continue, TEP intends to continue vigorously defending itself against the claims asserted by the third-party owners and to vigorously pursue the claims it has asserted against the owner trustees and co-trustees.
RELATED-PARTY TRANSACTIONS
Related-party transactions are in the normal course of operations and are measured at the exchange amount, which is the amount of consideration established and agreed to by the related parties. There were no material changes in the nature of the Corporation’s related-party transactions during the three and six months ended June 30, 2016 from those disclosed in the 2015 Annual MD&A.

Interim Management Discussion and Analysis 30 June 30, 2016
Significant related-party transactions were as follows: (i) power purchased by FortisBC Electric from the Waneta Expansion, which totalled approximately $3 million and $18 million for the three and six months ended June 30, 2016, respectively; (ii) the Waneta Expansion paid FortisBC Electric for management services associated with the generating facility, which totalled approximately $2 million and $5 million for the three and six months ended June 30, 2016, respectively; and (iii) gas storage capacity leased by FortisBC Energy from Aitken Creek, from the date of acquisition, which totalled $5 million.
From time to time, the Corporation provides short-term financing to certain of its subsidiaries to support capital expenditure programs, acquisitions and seasonal working capital requirements, bearing interest at rates that approximate the Corporation’s cost of short-term borrowing. In addition, the Corporation provided long-term financing to certain of its subsidiaries, bearing interest at rates that approximate the Corporation’s cost of long-term debt. As at June 30, 2016, there were no inter-segment loans outstanding (December 31, 2015 - $48 million) and total interest charged in the first half of 2016 was less than $1 million.
SUMMARY OF QUARTERLY RESULTS
The following table sets forth unaudited quarterly information for each of the eight quarters ended September 30, 2014 through June 30, 2016. The quarterly information has been obtained from the Corporation’s interim unaudited consolidated financial statements. These financial results are not necessarily indicative of results for any future period and should not be relied upon to predict future performance.
Summary of Quarterly Results Net Earnings(Unaudited) Attributable to
Common EquityRevenue Shareholders Earnings per Common Share
Quarter Ended ($ millions) ($ millions) Basic ($) Diluted ($)June 30, 2016 1,477 107 0.38 0.38March 31, 2016 1,757 162 0.57 0.57December 31, 2015 1,708 135 0.48 0.48September 30, 2015 1,566 151 0.54 0.54June 30, 2015 1,538 244 0.88 0.87March 31, 2015 1,915 198 0.72 0.71December 31, 2014 1,693 113 0.44 0.43September 30, 2014 1,197 14 0.06 0.06
The summary of the past eight quarters reflects the Corporation’s continued organic growth, growth from acquisitions and associated acquisition-related expenses, the impact of the sale of non-regulated assets, as well as the seasonality associated with its businesses. Interim results will fluctuate due to the seasonal nature of electricity and gas demand and water flows, as well as the timing and recognition of regulatory decisions. Revenue is also affected by the cost of fuel and purchased power and the cost of natural gas, which are flowed through to customers without markup. Given the diversified nature of the Corporation’s subsidiaries, seasonality may vary. Most of the annual earnings of the gas utilities are realized in the first and fourth quarters. Earnings for UNS Energy and Central Hudson’s electric utilities are generally highest in the second and third quarters due to the use of air conditioning and other cooling equipment.
June 2016/June 2015: Net earnings attributable to common equity shareholders were $107 million, or $0.38 per common share, for the second quarter of 2016 compared to earnings of $244 million, or $0.88 per common share, for the second quarter of 2015. A discussion of the quarter over quarter variance in financial results is provided in the “Financial Highlights” section of this MD&A.

Interim Management Discussion and Analysis 31 June 30, 2016
March 2016/March 2015: Net earnings attributable to common equity shareholders were $162 million, or $0.57 per common share, for the first quarter of 2016 compared to earnings of $198 million, or $0.72 per common share, for the first quarter of 2015. The decrease in earnings was primarily due to: $17 million in acquisition-related expenses and $11 million (US$8 million) in FERC ordered transmission refunds recognized in the first quarter of 2016, and a positive capital tracker revenue adjustment of $10 million and a foreign exchange gain of $9 million recognized in the first quarter of 2015. Excluding these items, the $11 million increase in net earnings was mainly due to: (i) contribution of $4 million from the Waneta Expansion, which came online in early April 2015, and increased production in Belize due to higher rainfall; (ii) favourable foreign exchange associated with US dollar-denominated earnings; (iii) a higher AFUDC at FortisBC Energy; and (iv) strong performance from the utilities in the Caribbean. The increase was partially offset by the timing of quarterly earnings at FortisBC Electric compared to the first quarter of 2015, and higher Corporate and Other expenses.
December 2015/December 2014: Net earnings attributable to common equity shareholders were $135 million, or $0.48 per common share, for the fourth quarter of 2015 compared to earnings of $113 million, or $0.44 per common share, for the fourth quarter of 2014. The increase in earnings was primarily due to: (i) favourable foreign exchange impacts; (ii) an increase in base electricity rates at Central Hudson effective July 1, 2015, combined with the impact of storm restoration and other non-recurring expenses recognized in the fourth quarter of 2014; (iii) earnings contribution of approximately $6 million from the Waneta Expansion; (iv) rate base growth associated with capital expenditures and growth in the number of customers at FortisAlberta; and (v) a higher AFUDC at FortisBC Energy, partially offset by higher operating expenses. The timing of regulatory deferral mechanisms had a favourable impact on FortisBC Energy’s earnings for the fourth quarter of 2015 and an unfavourable impact on FortisBC Electric. The increase in earnings was partially offset by lower earnings contribution due to the sale of commercial real estate and hotel assets and higher Corporate and Other expenses. Corporate and Other expenses included $7 million in acquisition-related expenses in the fourth quarter of 2015 and in the fourth quarter of 2014 included $4 million in interest expense associated with the convertible debentures and a $3 million foreign exchange gain. Excluding these items, the increase in Corporate and Other expenses was mainly due to a lower income tax recovery and lower related-partyinterest income.
September 2015/September 2014: Net earnings attributable to common equity shareholders were $151 million, or $0.54 per common share, for the third quarter of 2015 compared to earnings of $14 million, or $0.06 per common share, for the third quarter of 2014. Earnings for the third quarter of 2015 were favourably impacted by a $5 million gain on the sale of non-regulated generation assets in Ontario and a $5 million positive adjustment associated with the sale of hotel assets, and were reduced by a $9 million loss on the settlement of expropriation matters related to the Corporation’s investment in Belize Electricity. Earnings for the third quarter of 2014 were reduced by a total of $58 million due to acquisition-related expenses associated with UNS Energy. Excluding these items, the increase in earnings was driven by contribution of $97 million at UNS Energy compared to $37 million for the third quarter of 2014. Earnings contribution of $5 million from the Waneta Expansion also contributed to the increase. Performance was also driven by the Corporation’s other regulated utilities, including rate base growth associated with capital expenditures and customer growth at FortisAlberta; improved performance at Central Hudson; and favourable foreign exchange associated with US dollar-denominated earnings. Earnings at FortisBC Energy and FortisBC Electric were unfavourably impacted by the timing of regulatory deferral mechanisms; however, FortisBC Energy’s earnings were favourably impacted by lower operating expenses and higher AFUDC. The increase was partially offset by higher preference share dividends and finance charges in the Corporate and Other segment, largely associated with the acquisition of UNS Energy.
OUTLOOK
Fortis expects to close the Acquisition of ITC by the end of 2016. The Acquisition is expected to be accretive to earnings per common share in the first full year following closing, excluding one-time acquisition-related expenses. The Acquisition represents a singular opportunity for Fortis to significantly diversify its business in terms of regulatory jurisdictions, business risk profile and regional economic mix.

Interim Management Discussion and Analysis 32 June 30, 2016
Over the five-year period through 2020, excluding ITC, the Corporation’s capital program is expected to be over $9 billion. This investment in energy infrastructure is expected to increase rate base to more than $20 billion in 2020. Fortis expects long-term sustainable growth in rate base, resulting from investment in its existing utility operations and strategic acquisitions, to support continuing growth in earnings and dividends.
Fortis continues to target 6% average annual dividend growth through 2020. This dividend guidance takes into account many factors, including the expectation of reasonable outcomes for regulatory proceedings at the Corporation’s utilities, the successful execution of the five-year capital expenditure program, and management’s continued confidence in the strength of the Corporation’s diversified portfolio of utilities and record of operational excellence. The Acquisition of ITC supports this dividend guidance.
The Corporation’s business continues to grow in 2016 and results in 2017 will benefit from the expected outcome of the TEP general rate case, the impact of ITC and continued growth of the underlying business. Over the long term, Fortis is well positioned to enhance value for shareholders through the execution of its capital plan, the balance and strength of its diversified portfolio of businesses, as well as growth opportunities within its franchise regions.
OUTSTANDING SHARE DATA
As at July 28, 2016, the Corporation had issued and outstanding approximately 284.5 million common shares; 8.0 million First Preference Shares, Series E; 5.0 million First Preference Shares, Series F; 9.2 million First Preference Shares, Series G; 7.0 million First Preference Shares, Series H; 3.0 million First Preference Shares, Series I; 8.0 million First Preference Shares, Series J; 10.0 million First Preference Shares, Series K; and 24.0 million First Preference Shares, Series M. Only the common shares of the Corporation have voting rights. The Corporation’s First Preference Shares do not have voting rights unless and until Fortis fails to pay eight quarterly dividends, whether or not consecutive and whether or not such dividends have been declared.
The number of common shares of Fortis that would be issued if all outstanding stock options and First Preference Shares, Series E were converted as at July 28, 2016 is as follows.
Conversion of Securities into Common Shares (Unaudited)As at July 28, 2016 Number of
Common SharesSecurity (millions)
Stock Options 4.2First Preference Shares, Series E 4.9Total 9.1
Additional information, including the Fortis 2015 Annual Information Form, Management Information Circular and Annual Report, is available on SEDAR at www.sedar.com and on the Corporation’s website at www.fortisinc.com.
F-1
FORTIS INC.
Interim Consolidated Financial StatementsFor the three and six months ended June 30, 2016 and 2015 (Unaudited)
Prepared in accordance with accounting principles generally accepted in the United States

F-2
Fortis Inc.Consolidated Balance Sheets (Unaudited)
As at(in millions of Canadian dollars)
June 30, 2016
December 31, 2015
ASSETS
Current assetsCash and cash equivalents $ 296 $ 242Accounts receivable and other current assets 834 964Prepaid expenses 71 68Inventories 292 337Regulatory assets (Note 5) 201 246
1,694 1,857Other assets 336 352Regulatory assets (Note 5) 2,264 2,286Utility capital assets 19,772 19,595Intangible assets 539 541Goodwill 4,018 4,173
$ 28,623 $ 28,804
LIABILITIES AND SHAREHOLDERS’ EQUITY
Current liabilitiesShort-term borrowings (Note 18) $ 234 $ 511Accounts payable and other current liabilities 1,167 1,419Regulatory liabilities (Note 5) 304 298Current installments of long-term debt (Note 6) 415 384Current installments of capital lease and finance obligations 27 26
2,147 2,638Other liabilities 1,123 1,152Regulatory liabilities (Note 5) 1,296 1,340Deferred income taxes 2,128 2,050Long-term debt (Note 6) 11,144 10,784Capital lease and finance obligations 459 487
18,297 18,451Shareholders’ equityCommon Shares (1) (Note 7) 5,962 5,867Preference shares 1,820 1,820Additional paid-in capital 12 14Accumulated other comprehensive income 506 791Retained earnings 1,551 1,388Total Fortis Inc. shareholders’ equity 9,851 9,880Non-controlling interests 475 473
10,326 10,353$ 28,623 $ 28,804
(1) No par value. Unlimited authorized shares; 284.2 million and 281.6 million issued and outstanding as at June 30, 2016 and December 31, 2015, respectively
Commitments and Contingencies (Note 19 and Note 20, respectively)See accompanying Notes to Interim Consolidated Financial Statements

F-3
Fortis Inc.Consolidated Statements of Earnings (Unaudited)
For the periods ended June 30(in millions of Canadian dollars, except per share amounts)
Quarter Ended Six Months Ended2016 2015 2016 2015
Revenue $ 1,477 $ 1,538 $ 3,234 $ 3,453
ExpensesEnergy supply costs 480 531 1,172 1,364Operating 454 458 928 931Depreciation and amortization 232 220 466 435
1,166 1,209 2,566 2,730Operating income 311 329 668 723Other income (expenses), net (Note 10) 9 166 25 183Finance charges (Note 11) 150 141 293 275Earnings before income taxes 170 354 400 631Income tax expense (Note 12) 28 76 70 133Net earnings $ 142 $ 278 $ 330 $ 498
Net earnings attributable to:Non-controlling interests $ 17 $ 15 $ 24 $ 17Preference equity shareholders 18 19 37 39Common equity shareholders 107 244 269 442
$ 142 $ 278 $ 330 $ 498Earnings per common share (Note 13)
Basic $ 0.38 $ 0.88 $ 0.95 $ 1.59Diluted $ 0.38 $ 0.87 $ 0.95 $ 1.58
See accompanying Notes to Interim Consolidated Financial Statements
Fortis Inc.Consolidated Statements of Comprehensive Income (Unaudited)
For the periods ended June 30(in millions of Canadian dollars)
Quarter Ended Six Months Ended2016 2015 2016 2015
Net earnings $ 142 $ 278 $ 330 $ 498Other comprehensive (loss) incomeUnrealized foreign currency translation (losses) gains,
net of hedging activities and tax (18) (49) (287) 249Reclassification to earnings of foreign currency
translation loss on disposal of investment in foreign operations, net of tax — 2 — 2
Unrealized (losses) gains on available-for-sale investment, net of tax (1) (2) 2 (2)
Unrealized employee future benefits gains, net of tax — 1 — —(19) (48) (285) 249
Comprehensive income $ 123 $ 230 $ 45 $ 747Comprehensive income attributable to:
Non-controlling interests $ 17 $ 15 $ 24 $ 17Preference equity shareholders 18 19 37 39Common equity shareholders 88 196 (16) 691
$ 123 $ 230 $ 45 $ 747See accompanying Notes to Interim Consolidated Financial Statements

F-4
Fortis Inc.Consolidated Statements of Cash Flows (Unaudited)
For the periods ended June 30(in millions of Canadian dollars)
Quarter Ended Six Months Ended2016 2015 2016 2015
Operating activitiesNet earnings $ 142 $ 278 $ 330 $ 498Adjustments to reconcile net earnings to net cashprovided by operating activities:Depreciation - capital assets 207 198 416 391Amortization - intangible assets 17 16 35 32Amortization - other 8 6 15 12Deferred income tax expense 28 48 30 39Accrued employee future benefits 9 11 22 14Equity component of allowance for funds used during
construction (Note 10) (6) (5) (13) (9)Gain on sale of non-utility capital assets (Note 10) — (133) — (133)Gain on sale of non-regulated generation assets (Note 10) — (57) — (57)Other 33 32 54 28
Change in long-term regulatory assets and liabilities (34) (28) (32) (76)Change in non-cash operating working capital (Note 14) 44 102 74 179
448 468 931 918Investing activitiesChange in other assets and other liabilities (18) (41) (26) (56)Capital expenditures - utility capital assets (408) (578) (817) (1,108)Capital expenditures - non-utility capital assets — (5) — (9)Capital expenditures - intangible assets (25) (34) (42) (54)Purchase of assets held for sale — (27) — (27)Contributions in aid of construction 7 13 18 28Proceeds on sale of assets (Note 10) — 537 10 538Business acquisition, net of cash acquired (Note 15) (318) — (318) —
(762) (135) (1,175) (688)Financing activitiesChange in short-term borrowings (243) (201) (275) (201)Proceeds from long-term debt, net of issue costs 356 211 356 618Repayments of long-term debt and capital lease and finance
obligations (69) (66) (109) (236)Net advances under committed credit facilities 421 281 513 262Advances from non-controlling interests 1 14 1 19Issue of common shares, net of costs and dividends
reinvested 8 3 27 20DividendsCommon shares, net of dividends reinvested (70) (55) (147) (115)Preference shares (18) (19) (37) (39)Subsidiary dividends paid to non-controlling interests (6) (2) (15) (6)
380 166 314 322Effect of exchange rate changes on cash and cash equivalents (2) (2) (16) 17Change in cash and cash equivalents 64 497 54 569Change in cash associated with assets held for sale — 1 — (2)Cash and cash equivalents, beginning of period 232 299 242 230Cash and cash equivalents, end of period $ 296 $ 797 $ 296 $ 797Supplementary Information to Consolidated Statements of Cash Flows (Note 14)See accompanying Notes to Interim Consolidated Financial Statements

F-5
Fort
is I
nc.
Con
soli
dat
ed S
tate
men
ts o
f C
han
ges
in E
qu
ity
(Un
aud
ited
)Fo
r th
e p
erio
ds
end
ed J
un
e 3
0(i
n m
illio
ns o
f Can
adia
n do
llars
)
Com
mon
S
har
esP
refe
ren
ce
Sh
ares
Ad
dit
ion
al
Pai
d-i
n
Cap
ital
Acc
um
ula
ted
O
ther
C
omp
reh
ensi
ve
Inco
me
(Los
s)R
etai
ned
Ea
rnin
gs
Non
-C
ontr
olli
ng
In
tere
sts
Tota
l Eq
uit
y(N
ote
7)A
s at
Jan
uar
y 1
, 2
01
6$
5,8
67
$1
,82
0$
14
$7
91
$1
,38
8$
47
3$
10
,35
3N
et e
arni
ngs
——
——
30
62
43
30
Oth
er c
ompr
ehen
sive
loss
——
—(2
85
)—
—(2
85
)Com
mon
sha
re is
sues
95
—(3
)—
——
92
Sto
ck-b
ased
com
pens
atio
n—
—1
——
—1
Adv
ance
s fr
om n
on-c
ontr
ollin
g in
tere
sts
——
——
—1
1Fo
reig
n cu
rren
cy t
rans
latio
n im
pact
s—
——
——
(8)
(8)
Sub
sidi
ary
divi
dend
s pa
id t
o no
n-co
ntro
lling
inte
rest
s—
——
——
(15
)(1
5)
Div
iden
ds d
ecla
red
on c
omm
on s
hare
s ($
0.37
5 pe
r sh
are)
——
——
(10
6)
—(1
06
)D
ivid
ends
dec
lare
d on
pre
fere
nce
shar
es—
——
—(3
7)
—(3
7)
As
at J
un
e 3
0,
20
16
$5
,96
2$
1,8
20
$1
2$
50
6$
1,5
51
$4
75
$1
0,3
26
As
at J
anu
ary
1,
20
15
$5,
667
$1,
820
$15
$12
9$
1,06
0$
421
$9,
112
Net
ear
ning
s—
——
—48
117
498
Oth
er c
ompr
ehen
sive
inco
me
——
—24
9—
—24
9Com
mon
sha
re is
sues
95—
(2)
——
—93
Sto
ck-b
ased
com
pens
atio
n—
—1
——
—1
Adv
ance
s fr
om n
on-c
ontr
ollin
g in
tere
sts
——
——
—19
19Fo
reig
n cu
rren
cy t
rans
latio
n im
pact
s—
——
——
99
Sub
sidi
ary
divi
dend
s pa
id t
o no
n-co
ntro
lling
inte
rest
s—
——
——
(6)
(6)
Div
iden
ds d
ecla
red
on c
omm
on s
hare
s ($
0.68
per
sha
re)
——
——
(189
)—
(189
)D
ivid
ends
dec
lare
d on
pre
fere
nce
shar
es—
——
—(3
9)—
(39)
As
at J
un
e 3
0,
20
15
$5,
762
$1,
820
$14
$37
8$
1,31
3$
460
$9,
747
See
acc
ompa
nyin
g N
otes
to
Inte
rim
Con
solid
ated
Fin
anci
al S
tate
men
ts

FORTIS INC.NOTES TO INTERIM CONSOLIDATED FINANCIAL STATEMENTS
For the three and six months ended June 30, 2016 and 2015 (unless otherwise stated)(Unaudited)
F-6
1. DESCRIPTION OF BUSINESS
NATURE OF OPERATIONS
Fortis Inc. (“Fortis” or the “Corporation”) is principally an international electric and gas utility holding company. Fortis segments its utility operations by franchise area and, depending on regulatory requirements, by the nature of the assets. Fortis also holds investments in non-regulated energy infrastructure, which is treated as a separate segment. The Corporation’s reporting segments allow senior management to evaluate the operational performance and assess the overall contribution of each segment to the long-term objectives of Fortis. Each entity within the reporting segments operates with substantial autonomy, assumes profit and loss responsibility and is accountable for its own resource allocation.
The following outlines each of the Corporation’s reportable segments and is consistent with the basis of segmentation as disclosed in the Corporation’s 2015 annual audited consolidated financial statements.
REGULATED UTILITIES
The Corporation’s interests in regulated electric and gas utilities are as follows:
a. Regulated Electric & Gas Utilities - United States: Comprised of UNS Energy, which primarily includes Tucson Electric Power Company (“TEP”), UNS Electric, Inc. (“UNS Electric”) and UNS Gas, Inc. (“UNS Gas”), and Central Hudson Gas & Electric Corporation (“Central Hudson”).
b. Regulated Gas Utility - Canadian: Primarily includes FortisBC Energy Inc. (“FortisBC Energy”).
c. Regulated Electric Utilities - Canadian: Comprised of FortisAlberta Inc. (“FortisAlberta”), FortisBC Inc. (“FortisBC Electric”), and Eastern Canadian Electric Utilities. Eastern Canadian Electric Utilities is comprised of Newfoundland Power Inc. (“Newfoundland Power”), Maritime Electric Company, Limited (“Maritime Electric”) and FortisOntario Inc. (“FortisOntario”). FortisOntario mainly includes Canadian Niagara Power Inc., Cornwall Street Railway, Light and Power Company, Limited and Algoma Power Inc.
d. Regulated Electric Utilities - Caribbean: Comprised of Caribbean Utilities Company, Ltd. (“Caribbean Utilities”), in which Fortis holds an approximate 60% controlling interest, two wholly owned utilities in the Turks and Caicos Islands, FortisTCI Limited and Turks and Caicos Utilities Limited (collectively “Fortis Turks and Caicos”), and also includes the Corporation’s 33% equity investment in Belize Electricity Limited (“Belize Electricity”).
NON-REGULATED – ENERGY INFRASTRUCTURE
Non-Regulated - Energy Infrastructure is primarily comprised of long-term contracted generation assets in British Columbia and Belize, and the Aitken Creek natural gas storage facility (“Aitken Creek”) in British Columbia. Aitken Creek was acquired by Fortis on April 1, 2016 and the financial results are included in this segment from the date of acquisition (Note 15). In February 2016 the Corporation sold its Walden hydroelectric generating facility in British Columbia for gross proceeds of approximately $9 million.
NON-REGULATED - NON-UTILITY
The Non-Utility segment previously included Fortis Properties Corporation (“Fortis Properties”).Fortis Properties completed the sale of its commercial real estate and hotel assets in June 2015 and October 2015, respectively.

FORTIS INC.NOTES TO INTERIM CONSOLIDATED FINANCIAL STATEMENTS
For the three and six months ended June 30, 2016 and 2015 (unless otherwise stated)(Unaudited)
F-7
CORPORATE AND OTHER
The Corporate and Other segment captures expense and revenue items not specifically related to any reportable segment and those business operations that are below the required threshold for reporting as separate segments.
The Corporate and Other segment includes net corporate expenses of Fortis and non-regulated holding company expenses of FortisBC Holdings Inc. (“FHI”), CH Energy Group, Inc. and UNS Energy Corporation. Also included in the Corporate and Other segment are the financial results of FortisBC Alternative Energy Services Inc. (“FAES”). FAES is a wholly owned subsidiary of FHI that provides alternative energy solutions, including thermal-energy and geo-exchange systems.
PENDING ACQUISITION
ITC Holdings Corp.
On February 9, 2016, Fortis and ITC Holdings Corp. (“ITC”) (NYSE:ITC) entered into an agreement and plan of merger pursuant to which Fortis will acquire ITC in a transaction (the “Acquisition”) valued at approximately US$11.3 billion, based on the closing price for Fortis common shares and the foreign exchange rate on February 8, 2016. Under the terms of the transaction, ITC shareholders will receive US$22.57 in cash and 0.7520 of a Fortis common share per ITC share, representing total consideration of approximately US$6.9 billion, and Fortis will assume approximately US$4.4 billion of ITC consolidated indebtedness.
ITC is the largest independent electric transmission company in the United States. ITC owns and operates high-voltage transmission facilities in Michigan, Iowa, Minnesota, Illinois, Missouri, Kansas and Oklahoma, serving a combined peak load exceeding 26,000 megawatts along approximately 15,700 circuit miles of transmission line. In addition, ITC is a public utility limited to transmission ownership in Wisconsin. ITC’s tariff rates are regulated by the United States Federal Energy Regulatory Commission (“FERC”), which has been one of the most consistently supportive utility regulators in North America providing reasonable returns and equity ratios. Rates are set using a forward-looking rate-setting mechanism with an annual true-up, which provides timely cost recovery and reduces regulatory lag.
In May 2016 and June 2016, both Fortis and ITC received shareholder approvals to proceed with the Acquisition. The transaction review by the Committee on Foreign Investment in the United States was completed in July 2016. The closing of the Acquisition remains subject to certain regulatory, state and federal approvals including, among others, those of FERC and the United States Federal Trade Commission/Department of Justice under the Hart-Scott-Rodino Antitrust Improvements Act, and the satisfaction of other customary closing conditions. The FERC and all of the state regulatory applications associated with the transaction were filed in the second quarter of 2016. The closing of the Acquisition is expected to occur in late 2016.
In April 2016 Fortis announced that it reached a definitive agreement with an affiliate of GIC Private Limited, Singapore’s sovereign wealth fund, to acquire a 19.9% equity interest in ITC for aggregate consideration of US$1.228 billion in cash upon closing of the Acquisition.
2. SUMMARY OF SIGNIFICANT ACCOUNTING POLICIES
These interim consolidated financial statements have been prepared in accordance with accounting principles generally accepted in the United States (“US GAAP”) for interim financial statements. As a result, these interim consolidated financial statements do not include all of the information and disclosures required in the annual consolidated financial statements and should be read in conjunction with the Corporation’s 2015 annual audited consolidated financial statements. In management’s opinion, the interim consolidated financial statements include all adjustments that are of a recurring nature and necessary to present fairly the consolidated financial position of the Corporation.

FORTIS INC.NOTES TO INTERIM CONSOLIDATED FINANCIAL STATEMENTS
For the three and six months ended June 30, 2016 and 2015 (unless otherwise stated)(Unaudited)
F-8
Interim results will fluctuate due to the seasonal nature of electricity and gas demand and water flows, as well as the timing and recognition of regulatory decisions. Given the diversified group of companies, seasonality may vary. Most of the annual earnings of the gas utilities are realized in the first and fourth quarters. Earnings for UNS Energy and Central Hudson’s electric utilities are generally highest in the second and third quarters due to the use of air conditioning and other cooling equipment.
The preparation of the consolidated financial statements in accordance with US GAAP requires management to make estimates and judgments that affect the reported amounts of assets and liabilities and the disclosure of contingent assets and liabilities at the date of the consolidated financial statements, and the reported amounts of revenue and expenses during the reporting periods. Estimates and judgments are based on historical experience, current conditions and various other assumptions believed to be reasonable under the circumstances.
Additionally, certain estimates and judgments are necessary since the regulatory environments in which the Corporation’s regulated utilities operate often require amounts to be recognized at estimated values until these amounts are finalized pursuant to regulatory decisions or other regulatory proceedings. Due to changes in facts and circumstances, and the inherent uncertainty involved in making estimates, actual results may differ significantly from current estimates. Estimates and judgments are reviewed periodically and, as adjustments become necessary, are recognized in earnings in the period in which they become known. In the event that a regulatory decision is received after the balance sheet date but before the consolidated financial statements are issued, the facts and circumstances are reviewed to determine whether or not it is a recognized subsequent event.
Interim financial statements may also employ a greater use of estimates than the annual financial statements. There were no material changes in the nature of the Corporation’s critical accounting estimates during the three and six months ended June 30, 2016.
An evaluation of subsequent events through July 28, 2016, the date these interim consolidated financial statements were approved by the Audit Committee of the Board of Directors, was completed to determine whether circumstances warranted recognition and disclosure of events or transactions in the interim consolidated financial statements as at June 30, 2016.
All amounts are presented in Canadian dollars unless otherwise stated.
These interim consolidated financial statements are comprised of the accounts of Fortis and its wholly owned subsidiaries and controlling ownership interests. All significant intercompany balances and transactions have been eliminated on consolidation.
These interim consolidated financial statements have been prepared following the same accounting policies and methods as those used to prepare the Corporation’s 2015 annual audited consolidated financial statements, except as described below.
New Accounting Policies
Simplifying Income Statement Presentation by Eliminating the Concept of Extraordinary Items Effective January 1, 2016, the Corporation adopted Accounting Standards Update (“ASU”) No. 2015-01, Simplifying Income Statement Presentation by Eliminating the Concept of Extraordinary Items. The amendments in this update are part of the Financial Accounting Standards Board’s (“FASB”) initiative to reduce complexity in accounting standards by eliminating the concept of extraordinary items. The above-noted ASU was applied prospectively and did not impact the Corporation’s interim unaudited consolidated financial statements for the three and six months ended June 30, 2016.

FORTIS INC.NOTES TO INTERIM CONSOLIDATED FINANCIAL STATEMENTS
For the three and six months ended June 30, 2016 and 2015 (unless otherwise stated)(Unaudited)
F-9
Amendments to the Consolidation Analysis Effective January 1, 2016, the Corporation adopted ASU No. 2015-02, Amendments to the Consolidation Analysis. The amendments in this update change the analysis that a reporting entity must perform to determine whether it should consolidate certain types of legal entities. Specifically, the amendments note the following regarding limited partnerships: (i) modify the evaluation of whether limited partnerships and similar legal entities are variable interest entities or voting interest entities; and (ii) eliminate the presumption that a general partner should consolidate a limited partnership. The amendments did not materially impact the Corporation’s interim unaudited consolidated financial statements. The amendments did, however, change the Corporation’s 51% controlling ownership interest in the Waneta Expansion Limited Partnership (“Waneta Partnership”) from a voting interest entity to a variable interest entity, resulting in additional disclosure (Note 17).
Simplifying the Accounting for Measurement-Period Adjustments Effective January 1, 2016, the Corporation adopted ASU No. 2015-16, Simplifying the Accounting for Measurement-Period Adjustments. The amendments in this update require that in a business combination, an acquirer recognize adjustments to provisional amounts that are identified during the measurement period in the reporting period in which the adjustment amounts are determined. Under previous guidance, these adjustments were required to be accounted for retrospectively. ASU No. 2015-16 was applied prospectively and did not have an impact on the Corporation’s interim unaudited consolidated financial statements for the three and six months ended June 30, 2016.
3. FUTURE ACCOUNTING PRONOUNCEMENTS
The Corporation considers the applicability and impact of all ASUs issued by FASB. The following updates have been issued by FASB, but have not yet been adopted by Fortis. Any ASUs not included below were assessed and determined to be either not applicable to the Corporation or are not expected to have a material impact on the consolidated financial statements.
Revenue from Contracts with Customers ASU No. 2014-09 was issued in May 2014 and the amendments in this update create Accounting Standards Codification (“ASC”) Topic 606, Revenue from Contracts with Customers, and supersede the revenue recognition requirements in ASC Topic 605, Revenue Recognition, including most industry-specific revenue recognition guidance throughout the codification. This standard completes a joint effort by FASB and the International Accounting Standards Board to improve financial reporting by creating common revenue recognition guidance for US GAAP and International Financial Reporting Standards that clarifies the principles for recognizing revenue and that can be applied consistently across various transactions, industries and capital markets. This standard was originally effective for annual and interim periods beginning after December 15, 2016 and is to be applied on a full retrospective or modified retrospective basis. ASU No. 2015-14 was issued in August 2015 and the amendments in this update defer the effective date of ASU No. 2014-09 by one year to annual and interim periods beginning after December 15, 2017. Early adoption is permitted as of the original effective date.
ASU No. 2016-08, Principal versus Agent Considerations, was issued in March 2016, ASU 2016-10, Identifying Performance Obligations and Licensing, was issued in April 2016 and ASU No. 2016-12, Narrow-Scope Improvements and Practical Expedients, was issued in May 2016. The above-noted ASUs clarify implementation guidance in ASC Topic 606. The effective date and transition requirements of these updates are the same as ASU No. 2014-09.
The majority of the Corporation’s revenue is generated from energy sales to customers based on published tariff rates, as approved by the respective regulators, and is expected to be in the scope of ASU No. 2014-09. Fortis has not yet selected a transition method and is assessing the impact that the adoption of this standard, and all related ASUs, will have on its consolidated financial statements and related disclosures. The Corporation plans to have this assessment substantially complete by the end of 2016.
FORTIS INC.NOTES TO INTERIM CONSOLIDATED FINANCIAL STATEMENTS
For the three and six months ended June 30, 2016 and 2015 (unless otherwise stated)(Unaudited)
F-10
Recognition and Measurement of Financial Assets and Financial Liabilities ASU No. 2016-01, Recognition and Measurement of Financial Assets and Financial Liabilities, was issued in January 2016 and the amendments in this update address certain aspects of recognition, measurement, presentation and disclosure of financial instruments. Most notably, the amendments require the following: (i) equity investments in unconsolidated entities (other than those accounted for using the equity method of accounting) to be measured at fair value through earnings; however, entities will be able to elect to record equity investments without readily determinable fair values at cost, less impairment, and plus or minus subsequent adjustments for observable price changes; and (ii) financial assets and financial liabilities to be presented separately in the notes to the consolidated financial statements, grouped by measurement category and form of financial asset. This update is effective for annual and interim periods beginning after December 15, 2017. Fortis is assessing the impact that the adoption of this update will have on its consolidated financial statements and related disclosures.
Leases ASU No. 2016-02 was issued in February 2016 and the amendments in this update create ASC Topic 842,Leases, and supersede lease requirements in ASC Topic 840, Leases. The main provision of ASC Topic 842is the recognition of lease assets and lease liabilities on the balance sheet by lessees for those leases that were previously classified as operating leases. For operating leases, a lessee is required to do the following: (i) recognize a right-of-use asset and a lease liability, initially measured at the present value of the lease payments, on the balance sheet; (ii) recognize a single lease cost, calculated so that the cost of the lease is allocated over the lease term on a generally straight-line basis; and (iii) classify all cash payments within operating activities in the statement of cash flows. These amendments also require qualitative disclosures along with specific quantitative disclosures. This update is effective for annual and interim periods beginning after December 15, 2018 and is to be applied using a modified retrospective approach with practical expedient options. Early adoption is permitted. Fortis is assessing the impact that the adoption of this update will have on its consolidated financial statements and related disclosures.
Improvements to Employee Share-Based Payment Accounting ASU No. 2016-09, Improvements to Employee Share-Based Payment Accounting, was issued in March 2016 as part of FASB’s simplification initiative. The areas for simplification in this update involve several aspects of accounting for share-based payment transactions, including income tax consequences, classification of awards as either equity or liabilities, and classification on the statement of cash flows. This update is effective for annual and interim periods beginning after December 15, 2016. Early adoption is permitted, however, an entity that elects early adoption must adopt all the amendments in the same period. Fortis is assessing the impact that the adoption of this update will have on its consolidated financial statements and related disclosures.
Measurement of Credit Losses on Financial Instruments ASU No. 2016-13, Measurement of Credit Losses on Financial Instruments, was issued in June 2016 and the amendments in this update require entities to use an expected credit loss methodology and to consider a broader range of reasonable and supportable information to inform credit loss estimates. This update is effective for annual and interim periods beginning after December 15, 2019 and is to be applied on a modified retrospective basis. Early adoption is permitted for annual and interim periods beginning after December 15, 2018. Fortis is assessing the impact that the adoption of this update will have on its consolidated financial statements and related disclosures.

FOR
TIS
IN
C.
NO
TES
TO
IN
TER
IM C
ON
SO
LID
ATE
D F
INA
NC
IAL
STA
TEM
ENTS
For
the
thre
e m
onth
s en
ded
June
30,
201
6 an
d 20
15 (
unle
ss o
ther
wis
e st
ated
)(U
naud
ited
)
F-11
4.
SEG
MEN
TED
IN
FOR
MA
TIO
NIn
form
atio
n by
rep
orta
ble
segm
ent
is a
s fo
llow
s:
REG
ULA
TED
NO
N-R
EGU
LATE
DU
nit
ed S
tate
sC
anad
aQ
uar
ter
Ende
dEl
ectr
ic &
Gas
Gas
Elec
tric
Inte
r-se
gmen
tel
imin
atio
ns
Jun
e 3
0,
20
16
UN
SEn
ergy
Cen
tral
Hud
son
Fort
isBC
Ener
gyFo
rtis
Alb
erta
Fort
isBC
Elec
tric
East
ern
Can
adia
nC
arib
bean
Elec
tric
Ener
gyIn
fras
tru
ctu
reN
on-
Uti
lity
Cor
por
ate
and
Oth
er($
mill
ions
)To
tal
Tota
lTo
tal
Rev
enue
490
185
67
520
114
483
245
67
37
16
7—
3(1
2)
1,4
77
Ener
gy s
uppl
y co
sts
176
522
28
41—
2115
42
16
29
16
——
(9)
48
0O
pera
ting
expe
nses
146
892
35
6948
2134
17
21
29
—2
8(2
)4
54
Dep
reci
atio
n an
d am
ortiz
atio
n65
158
050
4414
231
31
13
7—
1—
23
2O
pera
ting
inco
me
103
291
32
4152
2734
15
41
73
5—
(26
)(1
)3
11
Oth
er in
com
e (e
xpen
ses)
, ne
t2
13
4—
—1
51
(1)
—1
—9
Fina
nce
char
ges
2510
35
3322
914
78
31
—3
4(1
)1
50
Inco
me
tax
expe
nse
(rec
over
y)24
83
24
—3
51
2—
1—
(17
)—
28
Net
ear
ning
s (l
oss)
5612
68
830
1516
69
15
32
—(4
2)
—1
42
Non
-con
trol
ling
inte
rest
s—
——
——
——
—4
13
——
—1
7Pr
efer
ence
sha
re d
ivid
ends
——
——
——
——
——
—1
8—
18
Net
ear
ning
s (l
oss)
att
ribu
tabl
e to
co
mm
on e
quity
shar
ehol
ders
5612
68
830
1516
69
11
19
—(6
0)
—1
07
Goo
dwill
1,78
458
22
,36
691
322
723
567
1,4
42
18
32
7—
——
4,0
18
Iden
tifia
ble
asse
ts6,
562
2,43
08
,99
25,
063
3,71
71,
874
2,24
71
2,9
01
1,0
66
1,4
73
—2
34
(61
)2
4,6
05
Tota
l ass
ets
8,34
63,
012
11
,35
85,
976
3,94
42,
109
2,31
41
4,3
43
1,2
49
1,5
00
—2
34
(61
)2
8,6
23
Gro
ss c
apital
exp
endi
ture
s98
601
58
7987
1935
22
04
25
—8
—4
33
Qu
arte
r En
ded
Jun
e 3
0,
20
15
($ m
illio
ns)
Rev
enue
494
193
68
722
813
680
232
67
67
44
16
57
(12
)1
,53
8En
ergy
sup
ply
cost
s19
664
26
073
—21
143
23
73
61
——
(3)
53
1O
pera
ting
expe
nses
137
902
27
6643
2234
16
51
15
41
12
(3)
45
8D
epre
ciat
ion
and
amor
tizat
ion
5714
71
4842
1521
12
61
16
51
—2
20
Ope
ratin
g in
com
e10
425
12
941
5122
341
48
16
29
19
(6)
(6)
32
9O
ther
inco
me
(exp
ense
s),
net
12
32
——
—2
—5
21
11
(1)
(1)
16
6Fi
nanc
e ch
arge
s25
103
534
209
147
74
17
24
(7)
14
1In
com
e ta
x ex
pens
e (r
ecov
ery)
287
35
1—
25
8—
24
19
(10
)—
76
Net
ear
ning
s (l
oss)
5210
62
831
1115
65
12
56
10
4(2
1)
—2
78
Non
-con
trol
ling
inte
rest
s—
——
1—
——
13
11
——
—1
5Pr
efer
ence
sha
re d
ivid
ends
——
——
——
——
——
—1
9—
19
Net
ear
ning
s (l
oss)
att
ribu
tabl
e to
co
mm
on e
quity
shar
ehol
ders
5210
62
731
1115
64
94
51
04
(40
)—
24
4G
oodw
ill1,
725
564
2,2
89
913
227
235
671
,44
21
77
——
——
3,9
08
Iden
tifia
ble
asse
ts6,
276
2,26
08
,53
64,
882
3,40
71,
825
2,17
21
2,2
86
1,0
24
1,0
30
78
16
01
(47
8)
23
,78
0To
tal a
sset
s8,
001
2,82
41
0,8
25
5,79
53,
634
2,06
02,
239
13
,72
81
,20
11
,03
07
81
60
1(4
78
)2
7,6
88
Gro
ss c
apital
exp
endi
ture
s25
634
29
012
110
128
382
88
23
85
3—
61
7
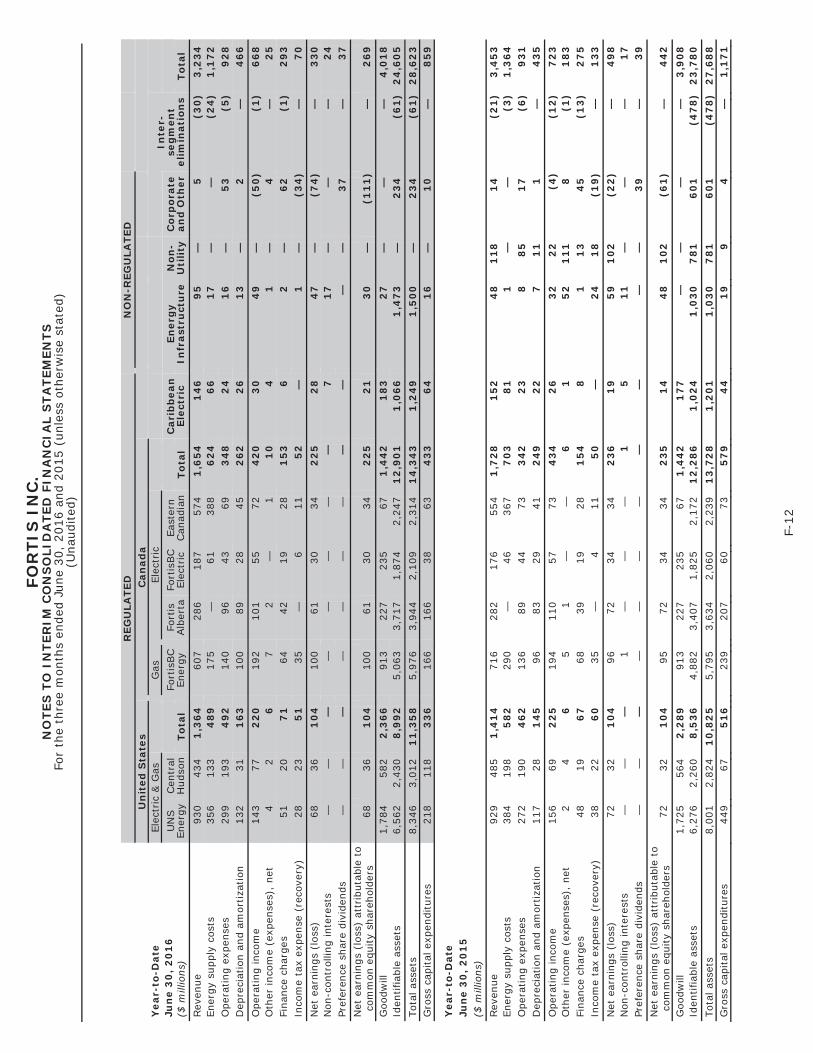
FOR
TIS
IN
C.
NO
TES
TO
IN
TER
IM C
ON
SO
LID
ATE
D F
INA
NC
IAL
STA
TEM
ENTS
For
the
thre
e m
onth
s en
ded
June
30,
201
6 an
d 20
15 (
unle
ss o
ther
wis
e st
ated
)(U
naud
ited
)
F-12
REG
ULA
TED
NO
N-R
EGU
LATE
DU
nit
ed S
tate
sC
anad
aY
ear-
to-D
ate
Elec
tric
& G
asG
asEl
ectr
icIn
ter-
segm
ent
elim
inat
ion
sJu
ne
30
, 2
01
6U
NS
Ener
gyCen
tral
Hud
son
Fort
isBC
Ener
gyFo
rtis
Alb
erta
Fort
isBC
Elec
tric
East
ern
Can
adia
nC
arib
bean
Elec
tric
Ener
gyIn
fras
tru
ctu
reN
on-
Uti
lity
Cor
por
ate
and
Oth
er($
mill
ions
)To
tal
Tota
lTo
tal
Rev
enue
930
434
1,3
64
607
286
187
574
1,6
54
14
69
5—
5(3
0)
3,2
34
Ener
gy s
uppl
y co
sts
356
133
48
917
5—
6138
86
24
66
17
——
(24
)1
,17
2O
pera
ting
expe
nses
299
193
49
214
096
4369
34
82
41
6—
53
(5)
92
8D
epre
ciat
ion
and
amor
tizat
ion
132
311
63
100
8928
452
62
26
13
—2
—4
66
Ope
ratin
g in
com
e14
377
22
019
210
155
724
20
30
49
—(5
0)
(1)
66
8O
ther
inco
me
(exp
ense
s),
net
42
67
2—
11
04
1—
4—
25
Fina
nce
char
ges
5120
71
6442
1928
15
36
2—
62
(1)
29
3In
com
e ta
x ex
pens
e (r
ecov
ery)
2823
51
35—
611
52
—1
—(3
4)
—7
0N
et e
arni
ngs
(los
s)68
361
04
100
6130
342
25
28
47
—(7
4)
—3
30
Non
-con
trol
ling
inte
rest
s—
——
——
——
—7
17
——
—2
4Pr
efer
ence
sha
re d
ivid
ends
——
——
——
——
——
—3
7—
37
Net
ear
ning
s (l
oss)
att
ribu
tabl
e to
co
mm
on e
quity
shar
ehol
ders
6836
10
410
061
3034
22
52
13
0—
(11
1)
—2
69
Goo
dwill
1,78
458
22
,36
691
322
723
567
1,4
42
18
32
7—
——
4,0
18
Iden
tifia
ble
asse
ts6,
562
2,43
08
,99
25,
063
3,71
71,
874
2,24
71
2,9
01
1,0
66
1,4
73
—2
34
(61
)2
4,6
05
Tota
l ass
ets
8,34
63,
012
11
,35
85,
976
3,94
42,
109
2,31
41
4,3
43
1,2
49
1,5
00
—2
34
(61
)2
8,6
23
Gro
ss c
apital
exp
endi
ture
s21
811
83
36
166
166
3863
43
36
41
6—
10
—8
59
Yea
r-to
-Dat
eJu
ne
30
, 2
01
5($
mill
ions
)Rev
enue
929
485
1,4
14
716
282
176
554
1,7
28
15
24
81
18
14
(21
)3
,45
3En
ergy
sup
ply
cost
s38
419
85
82
290
—46
367
70
38
11
——
(3)
1,3
64
Ope
ratin
g ex
pens
es27
219
04
62
136
8944
733
42
23
88
51
7(6
)9
31
Dep
reci
atio
n an
d am
ortiz
atio
n11
728
14
596
8329
412
49
22
71
11
—4
35
Ope
ratin
g in
com
e15
669
22
519
411
057
734
34
26
32
22
(4)
(12
)7
23
Oth
er in
com
e (e
xpen
ses)
, ne
t2
46
51
——
61
52
11
18
(1)
18
3Fi
nanc
e ch
arge
s48
196
768
3919
281
54
81
13
45
(13
)2
75
Inco
me
tax
expe
nse
(rec
over
y)38
226
035
—4
115
0—
24
18
(19
)—
13
3N
et e
arni
ngs
(los
s)72
321
04
9672
3434
23
61
95
91
02
(22
)—
49
8N
on-c
ontr
ollin
g in
tere
sts
——
—1
——
—1
51
1—
——
17
Pref
eren
ce s
hare
div
iden
ds—
——
——
——
——
——
39
—3
9N
et e
arni
ngs
(los
s) a
ttribu
tabl
e to
co
mm
on e
quity
shar
ehol
ders
7232
10
495
7234
342
35
14
48
10
2(6
1)
—4
42
Goo
dwill
1,72
556
42
,28
991
322
723
567
1,4
42
17
7—
——
—3
,90
8Id
entif
iabl
e as
sets
6,27
62,
260
8,5
36
4,88
23,
407
1,82
52,
172
12
,28
61
,02
41
,03
07
81
60
1(4
78
)2
3,7
80
Tota
l ass
ets
8,00
12,
824
10
,82
55,
795
3,63
42,
060
2,23
91
3,7
28
1,2
01
1,0
30
78
16
01
(47
8)
27
,68
8G
ross
cap
ital
exp
endi
ture
s44
967
51
623
920
760
735
79
44
19
94
—1
,17
1

FORTIS INC.NOTES TO INTERIM CONSOLIDATED FINANCIAL STATEMENTS
For the three and six months ended June 30, 2016 and 2015 (unless otherwise stated)(Unaudited)
F-13
Related party transactions are in the normal course of operations and are measured at the exchange amount, which is the amount of consideration established and agreed to by the related parties. The significant related party inter-segment transactions for the three and six months ended June 30, 2016 and 2015 were as follows:
Significant Related Party Inter-Segment Transactions Quarter Ended Year-to-DateJune 30 June 30
($ millions) 2016 2015 2016 2015Sales from Non-Regulated Energy Infrastructure to Regulated
Electric Utilities - Canadian 9 3 24 3Revenue from Regulated Electric Utilities - Canadian to
Non-Regulated Energy Infrastructure 2 — 5 —Sales from Regulated Electric Utilities - Canadian to
Non-Utility — 1 — 3Inter-segment finance charges on lending from:
Corporate to Non-Utility — 6 — 12
The significant related party inter-segment asset balances were as follows:As at June 30
($ millions) 2016 2015Inter-segment lending from:
Non-Regulated Energy Infrastructure to Eastern Canadian Electric Utilities 20 20Corporate to Non-Utility — 449
Other inter-segment assets 41 9Total inter-segment eliminations 61 478

FORTIS INC.NOTES TO INTERIM CONSOLIDATED FINANCIAL STATEMENTS
For the three and six months ended June 30, 2016 and 2015 (unless otherwise stated)(Unaudited)
F-14
5. REGULATORY ASSETS AND LIABILITIES
A summary of the Corporation’s regulatory assets and liabilities is provided below. For a detailed description of the nature of the Corporation’s regulatory assets and liabilities, refer to Note 8 to the Corporation’s 2015 annual audited consolidated financial statements.
As atJune 30, December 31,
($ millions) 2016 2015Regulatory assetsDeferred income taxes 963 936Employee future benefits 574 627Deferred energy management costs 154 145Manufactured gas plant (“MGP”) site remediation deferral (Note 20) 108 121Rate stabilization accounts 102 119Deferred lease costs 94 90Deferred operating overhead costs 72 66Natural gas for transportation incentives 40 25Final mine reclamation and retiree health care costs (Note 20) 39 39Deferred net losses on disposal of utility capital assets
and intangible assets 30 33Property tax deferrals 28 30Springerville Unit 1 unamortized leasehold improvements 25 30Derivative instruments (Note 16) 15 74Other regulatory assets 221 197Total regulatory assets 2,465 2,532Less: current portion (201) (246)Long-term regulatory assets 2,264 2,286
As atJune 30, December 31,
($ millions) 2016 2015Regulatory liabilitiesNon-asset retirement obligation removal cost provision 1,055 1,060Rate stabilization accounts 175 212Electric and gas moderator account 76 88Renewable energy surcharge 43 47Employee future benefits 37 44Energy efficiency liability 35 20Customer and community benefits obligation 25 32Other regulatory liabilities 154 135Total regulatory liabilities 1,600 1,638Less: current portion (304) (298)Long-term regulatory liabilities 1,296 1,340

FORTIS INC.NOTES TO INTERIM CONSOLIDATED FINANCIAL STATEMENTS
For the three and six months ended June 30, 2016 and 2015 (unless otherwise stated)(Unaudited)
F-15
6. LONG-TERM DEBT
As atJune 30, December 31,
($ millions) 2016 2015Long-term debt 10,606 10,689Long-term classification of credit facility borrowings (Note 18) 1,024 551Total long-term debt (Note 16) 11,630 11,240Less: Deferred financing costs (71) (72)Less: Current installments of long-term debt (415) (384)
11,144 10,784
In April 2016 FortisBC Energy issued $300 million of unsecured debentures in a dual tranche of 10-year $150 million unsecured debentures at 2.58% and 30-year $150 million unsecured debentures at 3.67%. The net proceeds were used to repay short-term borrowings and to finance capital expenditures.
In May 2016 Fortis Turks and Caicos issued 15-year US$23 million 5.14% unsecured notes. The net proceeds will be used to finance capital expenditures.
In June 2016 Central Hudson issued 4-year US$24 million 2.16% unsecured notes. The net proceeds were used to finance capital expenditures and for general corporate purposes.
7. COMMON SHARES
Common shares issued during the period were as follows:
Quarter Ended Year-to-DateJune 30, 2016 June 30, 2016
Number of Number ofShares Amount Shares Amount
(in thousands) ($ millions) (in thousands) ($ millions)Balance, beginning of period 283,050 5,917 281,562 5,867Dividend Reinvestment Plan 912 37 1,691 66Consumer Share Purchase Plan 8 1 15 1Employee Share Purchase Plan 80 3 221 8Stock Option Plans 136 4 696 20Conversion of convertible
debentures 1 — 2 —Balance, end of period 284,187 5,962 284,187 5,962
8. STOCK-BASED COMPENSATION PLANS
Stock Options
In February 2016 the Corporation granted 788,188 options to purchase common shares under its 2012 Stock Option Plan (“2012 Plan”) at the five-day volume weighted average trading price immediately preceding the date of grant of $37.30. The options granted under the 2012 Plan are exercisable for a period not to exceed ten years from the date of grant, expire no later than three years after the termination, death or retirement of the optionee and vest evenly over a four-year period on each anniversary of the date of grant. Directors are not eligible to receive grants of options under the 2012 Plan.

FORTIS INC.NOTES TO INTERIM CONSOLIDATED FINANCIAL STATEMENTS
For the three and six months ended June 30, 2016 and 2015 (unless otherwise stated)(Unaudited)
F-16
The fair value of each option granted was $2.41 per option. The fair value was estimated at the date of grant using the Black-Scholes fair value option-pricing model and the following assumptions:
Dividend yield (%) 3.9Expected volatility (%) 16.4Risk-free interest rate (%) 0.7Weighted average expected life (years) 5.5
Directors’ Deferred Share Unit Plan
In January 2016, 8,085 Deferred Share Units (“DSUs”) were granted to the Corporation’s Board of Directors, representing the first quarter equity component of the Directors’ annual compensation and, where opted, their first quarter component of annual retainers in lieu of cash. Each DSU represents a unit with an underlying value equivalent to the value of one common share of the Corporation and is entitled to accrue notional common share dividends equivalent to those declared by the Corporation’s Board of Directors. The DSUs are fully vested at the date of grant.
In April 2016, 6,537 DSUs were granted to the Corporation’s Board of Directors, representing the second quarter equity component of the Directors’ annual compensation and, where opted, their second quarter component of annual retainers in lieu of cash.
Performance Share Unit Plans
Year-to-date 2016, the Corporation granted 351,737 Performance Share Units (“PSUs”) under the 2015 PSU Plan to senior management of the Corporation and its subsidiaries. The Corporation’s PSU Plans represent a component of long-term compensation awarded to senior management of the Corporation and its subsidiaries. Each PSU represents a unit with an underlying value equivalent to the value of one common share of the Corporation and is subject to a three-year vesting and performance period, at which time a cash payment may be made. Each PSU is entitled to accrue notional common share dividends equivalent to those declared by the Corporation’s Board of Directors. As at June 30, 2016, the estimated payout percentages for the grants under the 2013 and 2015 PSU Plans ranged from 87% to 112%.
In the second quarter of 2016, 145,736 PSUs were paid out to senior management of the Corporation and its subsidiaries at $37.72 per PSU, for a total of approximately $5 million. The payout was made in respect of the PSUs granted in 2013 at a payout percentage of 96% based on the Corporation’s performance over the three-year period, as determined by the Human Resources Committee of the Board of Directors.
Restricted Share Unit Plans
Year-to-date 2016, the Corporation granted 70,393 Restricted Share Units (“RSUs”) under the 2015 RSU Plan to senior management of the Corporation and its subsidiaries. The Corporation’s RSU Plan represents a component of long-term compensation awarded to senior management of the Corporation and its subsidiaries. Each RSU represents a unit with an underlying value equivalent to the value of one common share of the Corporation and is subject to a three-year vesting period, at which time a cash payment may be made. Each RSU is entitled to accrue notional common share dividends equivalent to those declared by the Corporation’s Board of Directors.
For the three and six months ended June 30, 2016, stock-based compensation expense of approximately $6 million and $15 million, respectively was recognized ($4 million and $8 million for the three and six months ended June 30, 2015, respectively).

FORTIS INC.NOTES TO INTERIM CONSOLIDATED FINANCIAL STATEMENTS
For the three and six months ended June 30, 2016 and 2015 (unless otherwise stated)(Unaudited)
F-17
9. EMPLOYEE FUTURE BENEFITS
The Corporation and its subsidiaries each maintain one or a combination of defined benefit pension plans and defined contribution pension plans, including group Registered Retirement Savings Plans and group 401(k) plans, for employees. The Corporation and certain subsidiaries also offer other post-employment benefit (“OPEB”) plans for qualifying employees. The net benefit cost of providing the defined benefit pension and OPEB plans is detailed in the following tables.
Quarter Ended June 30Defined BenefitPension Plans OPEB Plans
($ millions) 2016 2015 2016 2015Components of net benefit cost:Service costs 16 17 3 5Interest costs 28 27 5 5Expected return on plan assets (35) (35) (3) (2)Amortization of actuarial losses 11 14 1 1Amortization of past service costs (credits) 1 1 (3) (3)Regulatory adjustments 1 (1) 3 1Net benefit cost 22 23 6 7
Year-to-Date June 30Defined BenefitPension Plans OPEB Plans
($ millions) 2016 2015 2016 2015Components of net benefit cost:Service costs 32 34 7 9Interest costs 55 54 11 11Expected return on plan assets (71) (69) (6) (5)Amortization of actuarial losses 23 28 1 2Amortization of past service costs (credits) 1 1 (6) (6)Regulatory adjustments 3 (1) 5 3Net benefit cost 43 47 12 14
For the three and six months ended June 30, 2016, the Corporation expensed $7 million and $15 million,respectively ($6 million and $14 million for the three and six months ended June 30, 2015), related to defined contribution pension plans.
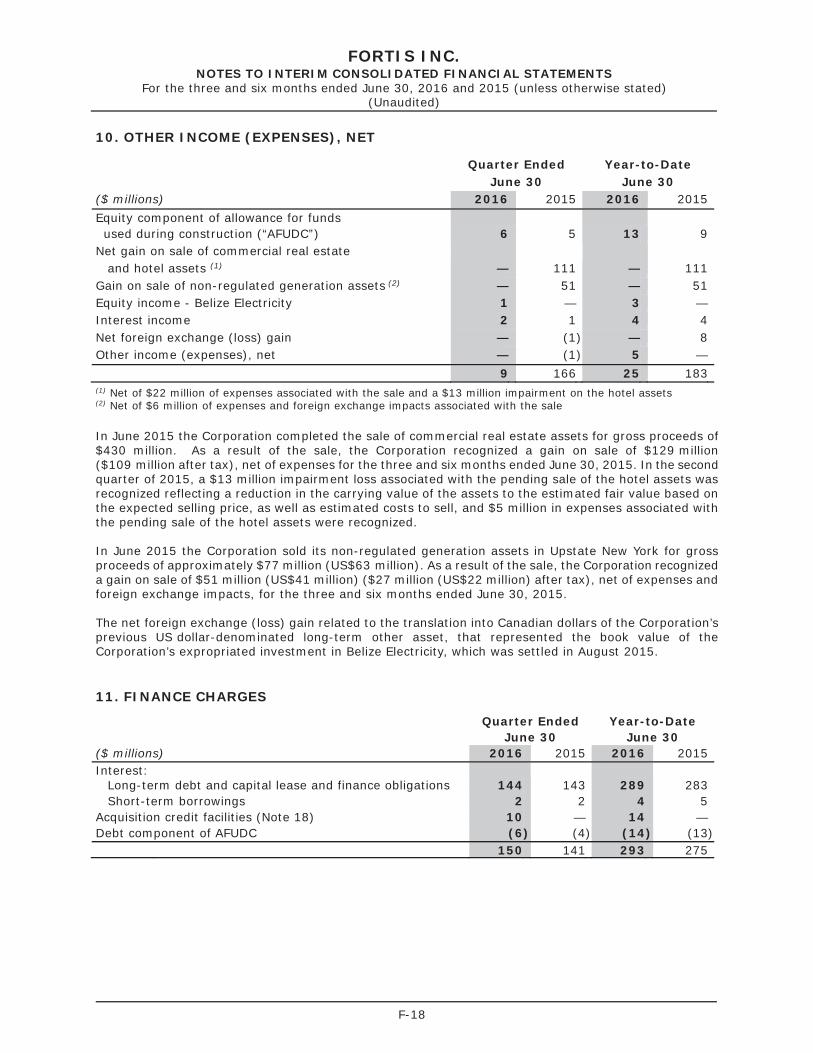
FORTIS INC.NOTES TO INTERIM CONSOLIDATED FINANCIAL STATEMENTS
For the three and six months ended June 30, 2016 and 2015 (unless otherwise stated)(Unaudited)
F-18
10. OTHER INCOME (EXPENSES), NET
Quarter Ended Year-to-DateJune 30 June 30
($ millions) 2016 2015 2016 2015Equity component of allowance for fundsused during construction (“AFUDC”) 6 5 13 9
Net gain on sale of commercial real estateand hotel assets (1) — 111 — 111
Gain on sale of non-regulated generation assets (2) — 51 — 51Equity income - Belize Electricity 1 — 3 —Interest income 2 1 4 4Net foreign exchange (loss) gain — (1) — 8Other income (expenses), net — (1) 5 —
9 166 25 183(1) Net of $22 million of expenses associated with the sale and a $13 million impairment on the hotel assets(2) Net of $6 million of expenses and foreign exchange impacts associated with the sale
In June 2015 the Corporation completed the sale of commercial real estate assets for gross proceeds of $430 million. As a result of the sale, the Corporation recognized a gain on sale of $129 million ($109 million after tax), net of expenses for the three and six months ended June 30, 2015. In the second quarter of 2015, a $13 million impairment loss associated with the pending sale of the hotel assets was recognized reflecting a reduction in the carrying value of the assets to the estimated fair value based on the expected selling price, as well as estimated costs to sell, and $5 million in expenses associated with the pending sale of the hotel assets were recognized.
In June 2015 the Corporation sold its non-regulated generation assets in Upstate New York for gross proceeds of approximately $77 million (US$63 million). As a result of the sale, the Corporation recognized a gain on sale of $51 million (US$41 million) ($27 million (US$22 million) after tax), net of expenses and foreign exchange impacts, for the three and six months ended June 30, 2015.
The net foreign exchange (loss) gain related to the translation into Canadian dollars of the Corporation’s previous US dollar-denominated long-term other asset, that represented the book value of the Corporation’s expropriated investment in Belize Electricity, which was settled in August 2015.
11. FINANCE CHARGES
Quarter Ended Year-to-DateJune 30 June 30
($ millions) 2016 2015 2016 2015Interest:
Long-term debt and capital lease and finance obligations 144 143 289 283Short-term borrowings 2 2 4 5
Acquisition credit facilities (Note 18) 10 — 14 —Debt component of AFUDC (6) (4) (14) (13)
150 141 293 275

FORTIS INC.NOTES TO INTERIM CONSOLIDATED FINANCIAL STATEMENTS
For the three and six months ended June 30, 2016 and 2015 (unless otherwise stated)(Unaudited)
F-19
12. INCOME TAXES
Income taxes differ from the amount that would be expected to be generated by applying the enacted combined Canadian federal statutory and provincial income tax rate to earnings before income taxes. The following is a reconciliation of consolidated statutory income taxes to consolidated effective income taxes.
Quarter Ended Year-to-DateJune 30 June 30
($ millions, except as noted) 2016 2015 2016 2015Combined Canadian federal and provincial statutory
income tax rate 28.0% 29.0% 28.0% 29.0%
Statutory income tax rate applied to earnings before income taxes 48 103 112 183
Difference between Canadian statutory rate and rates applicable to foreign subsidiaries (5) 2 (13) (1)
Difference between Canadian provincial statutory rates applicable to subsidiaries in different Canadian jurisdictions (1) (3) (3) (8)
Items capitalized for accounting purposes but expensed for income tax purposes (6) (5) (19) (20)
Difference between gain on sale of assets foraccounting and amounts calculated for tax purposes — (13) — (13)
Other (8) (8) (7) (8)Income tax expense 28 76 70 133Effective income tax rate 16.5% 21.5% 17.5% 21.1%
13. EARNINGS PER COMMON SHARE
The Corporation calculates earnings per common share (“EPS”) on the weighted average number of common shares outstanding. Diluted EPS is calculated using the treasury stock method for options and the “if-converted” method for convertible securities.
EPS was as follows:
Quarter Ended June 302016 2015
Net Earnings Weighted Net Earnings Weightedto Common Average to Common Average
Shareholders Shares Shareholders Shares($ millions) (# millions) EPS ($ millions) (# millions) EPS
Basic EPS (1) 107 283.7 $ 0.38 244 277.9 $ 0.88Effect of potential dilutive
securities:Stock Options — 0.6 — 0.9Preference Shares 3 5.6 3 5.4
110 289.9 247 284.2Deduct anti-dilutive impacts:
Preference Shares (3) (5.6) — —Diluted EPS 107 284.3 $ 0.38 247 284.2 $ 0.87(1) The Corporation’s Directors DSUs are considered participating securities as they participate in dividend equivalents
and these securities are fully vested at the time of grant. The impact of the DSUs have been included in the weighted average number of shares outstanding for purposes of calculating EPS.

FORTIS INC.NOTES TO INTERIM CONSOLIDATED FINANCIAL STATEMENTS
For the three and six months ended June 30, 2016 and 2015 (unless otherwise stated)(Unaudited)
F-20
Year-to-Date Ended June 302016 2015
Net Earnings Weighted Net Earnings Weightedto Common Average to Common Average
Shareholders Shares Shareholders Shares($ millions) (# millions) EPS ($ millions) (# millions) EPS
Basic EPS (1) 269 283.0 $ 0.95 442 277.3 $ 1.59Effect of potential dilutive
securities:Stock Options — 0.6 — 0.9Preference Shares 5 5.6 5 5.4
Diluted EPS 274 289.2 $ 0.95 447 283.6 $ 1.58(1) The Corporation’s Directors DSUs are considered participating securities as they participate in dividend equivalents
and these securities are fully vested at the time of grant. The impact of the DSUs have been included in the weighted average number of shares outstanding for purposes of calculating EPS.
14. SUPPLEMENTAL INFORMATION TO CONSOLIDATED STATEMENTS OF CASH FLOWS
Quarter Ended Year-to-DateJune 30 June 30
($ millions) 2016 2015 2016 2015Change in non-cash operating working capital:Accounts receivable and other current assets 21 117 84 93Prepaid expenses 10 12 (7) 10Inventories (6) (18) 45 42Regulatory assets - current portion (7) (7) — 32Accounts payable and other current liabilities 5 8 (64) (2)Regulatory liabilities - current portion 21 (10) 16 4
44 102 74 179
Non-cash investing and financing activities:Additions to utility capital assets and intangible assets included
in current liabilities and long-term other liabilities 131 184 131 184Contributions in aid of construction included in current assets 8 4 8 4Transfer of deposit on business acquisition (Note 15) 38 — 38 —Common share dividends reinvested 36 40 65 74Exercise of stock options into common shares 1 — 3 2
FORTIS INC.NOTES TO INTERIM CONSOLIDATED FINANCIAL STATEMENTS
For the three and six months ended June 30, 2016 and 2015 (unless otherwise stated)(Unaudited)
F-21
15. BUSINESS ACQUISITION
AITKEN CREEK
On April 1, 2016, Fortis acquired Aitken Creek Gas Storage ULC (“ACGS”) from Chevron Canada Properties Ltd. for approximately $349 million (US$266 million), plus working gas inventory. The net cash purchase price was primarily financed through US dollar-denominated borrowings under the Corporation’s committed revolving credit facility.
ACGS owns 93.8% of Aitken Creek, with the remaining share owned by BP Canada Energy Company. Aitken Creek is the only underground natural gas storage facility in British Columbia and has a total working gas capacity of 77 billion cubic feet. The facility is an integral part of western Canada’s natural gas transmission network. ACGS also owns 100% of the North Aitken Creek gas storage site which offers future expansion potential.
Revenue at Aitken Creek is primarily generated from long-term lease storage, park and loan activities, and storage optimization activities and is generally recognized on an accrual basis over the term of the related contracts. Optimization revenue results from the purchase of natural gas and its forward sale through financial and physical trading contracts, to manage commodity price risk associated with buying and selling natural gas in future periods. The Corporation records the unrealized gains and losses on the changes in the fair value of the derivative instruments through net earnings.
The preliminary allocation of purchase consideration to the assets and liabilities acquired as at April 1, 2016, based on their fair values, resulted in the recognition of approximately $27 million in goodwill, which is associated with deferred income tax liabilities. The acquisition has been accounted for using the acquisition method, whereby financial results of the business acquired have been proportionately consolidated in the financial statements of Fortis commencing on April 1, 2016, and are included in the Non-Regulated - Energy Infrastructure reporting segment.
16. FAIR VALUE MEASUREMENTS AND FINANCIAL INSTRUMENTS
Fair value is the price at which a market participant could sell an asset or transfer a liability to an unrelated party. A fair value measurement is required to reflect the assumptions that market participants would use in pricing an asset or liability based on the best available information. These assumptions include the risks inherent in a particular valuation technique, such as a pricing model, and the risks inherent in the inputs to the model. A fair value hierarchy exists that prioritizes the inputs used to measure fair value.
The three levels of the fair value hierarchy are defined as follows:
Level 1: Fair value determined using unadjusted quoted prices in active markets;Level 2: Fair value determined using pricing inputs that are observable; andLevel 3: Fair value determined using unobservable inputs only when relevant observable inputs are not
available.
The fair values of the Corporation’s financial instruments, including derivatives, reflect point-in-time estimates based on current and relevant market information about the instruments as at the balance sheet dates. The estimates cannot be determined with precision as they involve uncertainties and matters of judgment and, therefore, may not be relevant in predicting the Corporation’s future consolidated earnings or cash flows.

FORTIS INC.NOTES TO INTERIM CONSOLIDATED FINANCIAL STATEMENTS
For the three and six months ended June 30, 2016 and 2015 (unless otherwise stated)(Unaudited)
F-22
The following table presents, by level within the fair value hierarchy, the Corporation’s assets and liabilities accounted for at fair value on a recurring basis. These assets and liabilities are classified based on the lowest level of input that is significant to the fair value measurement and there were no transfers between the levels in the periods presented. For derivative instruments, the Corporation has elected gross presentation for its derivative contracts under master netting agreements and collateral positions.
As atFair value June 30, December 31,
($ millions) hierarchy 2016 2015AssetsEnergy contracts subject to regulatory deferral (1) (2) (3) Levels 1/2/3 22 7Energy contracts not subject to regulatory deferral (1) (2) (4) Levels 2/3 7 2Available-for-sale investment (5) Level 1 36 33Assets held for sale (6) Level 2 — 9Other investments (7) Level 1 11 12Total gross assets 76 63Less: Counterparty netting not offset on the balance sheet (8) (14) (6)Total net assets 62 57LiabilitiesEnergy contracts subject to regulatory deferral (1) (2) (9) Levels 1/2/3 30 78Energy contracts not subject to regulatory deferral (1) Level 2 5 —Interest rate swaps - cash flow hedges (10) Level 2 4 5Total gross liabilities 39 83Less: Counterparty netting not offset on the balance sheet (8) (14) (6)Total net liabilities 25 77(1) The fair value of the Corporation’s energy contracts is recorded in accounts receivable and other current assets,
long-term other assets, accounts payable and other current liabilities and long-term other liabilities. Unrealized gains and losses arising from changes in fair value of these contracts are deferred as a regulatory asset or liability for recovery from, or refund to, customers in future rates as permitted by the regulators, with the exception of long-term wholesale trading contracts and certain gas swap contracts.
(2) Changes in one or more of the unobservable inputs could have a significant impact on the fair value measurement depending on the magnitude and direction of the change for each input. The impacts of changes in fair value are subject to regulatory recovery, with the exception of long-term wholesale trading contracts and certain gas swap contracts.
(3) As at June 30, 2016, includes $1 million - level 1, $16 million - level 2 and $5 million - level 3 (December 31, 2015 - $2 million - level 2 and $5 million - level 3)
(4) As at June 30, 2016, includes $2 million - level 2 and $5 million - level 3 (December 31, 2015 - $2 million - level 3)(5) The available-for-sale investment is recorded in long-term other assets and unrealized gains and losses arising
from changes in fair value are recorded in other comprehensive income until they become realized and are reclassified to earnings.
(6) As at December 31, 2015, assets held for sale were associated with the Walden hydroelectric generating facility and were included in accounts receivable and other current assets on the consolidated balance sheet.
(7) Included in long-term other assets on the consolidated balance sheet(8) Certain energy contracts are subject to legally enforceable master netting arrangements to mitigate credit risk and
netted by counterparty where the intent and legal right to offset exists.(9) As at June 30, 2016, includes $21 million - level 2 and $9 million - level 3 (December 31, 2015 - $1 million –
level 1, $52 million - level 2 and $25 million - level 3)(10) The fair value of the Corporation’s interest rate swaps is recorded in accounts payable and other current liabilities
and long-term other liabilities. Unrealized gains and losses arising from changes in fair value are recorded in other comprehensive income until they become realized and are reclassified to earnings.

FORTIS INC.NOTES TO INTERIM CONSOLIDATED FINANCIAL STATEMENTS
For the three and six months ended June 30, 2016 and 2015 (unless otherwise stated)(Unaudited)
F-23
Derivative Instruments
The Corporation generally limits the use of derivative instruments to those that qualify as accounting, economic or cash flow hedges, or those that are approved for regulatory recovery. The Corporation records all derivative instruments at fair value, with certain exceptions including those derivatives that qualify for the normal purchase and normal sale exception. The fair value of derivative instruments are estimates of the amounts that the Corporation would receive or have to pay to terminate the outstanding contracts as at the balance sheet dates.
Energy Contracts Subject to Regulatory DeferralUNS Energy holds electricity power purchase contracts and gas swap and option contracts to reduce its exposure to energy price risk associated with purchased power and gas requirements. UNS Energy primarily applies the market approach for fair value measurements using independent third-party information, where possible. When published prices are not available, adjustments are applied based on historical price curve relationships, transmission costs and line losses. The fair value of gas option contracts is estimated using a Black-Scholes option-pricing model, which includes inputs such as implied volatility, interest rates, and forward price curves. UNS Energy also considers the impact of counterparty credit risk using current and historical default and recovery rates, as well as its own credit risk using credit default swap data.
Central Hudson holds electricity swap contracts and gas swap and option contracts to minimize commodityprice volatility for electricity and natural gas purchases by fixing the effective purchase price for the defined commodities. The fair value of the electricity swap contracts and gas swap and option contracts was calculated using forward pricing provided by independent third parties.
FortisBC Energy holds gas supply contract premiums to fix the effective purchase price of natural gas, as the majority of the natural gas supply contracts have floating, rather than fixed, prices. The fair value of the natural gas derivatives was calculated using the present value of cash flows based on market prices and forward curves for the cost of natural gas.
As at June 30, 2016, these energy contract derivatives were not designated as hedges; however, any unrealized gains or losses associated with changes in the fair value of the derivatives are deferred as a regulatory asset or liability for recovery from, or refund to, customers in future rates, as permitted by the regulators. These unrealized losses and gains would otherwise be recorded in earnings. As at June 30, 2016, unrealized losses of $15 million (December 31, 2015 - $74 million) were recognized in regulatory assets and unrealized gains of $7 million were recognized in regulatory liabilities (December 31, 2015 - $3 million) (Note 5).
Energy Contracts Not Subject to Regulatory DeferralUNS Energy holds long-term wholesale trading contracts that qualify as derivative instruments. The unrealized gains and losses on these derivative instruments are recorded in earnings, as they do not qualify for regulatory deferral. Ten percent of any realized gains on these contracts are shared with customers through UNS Energy’s rate stabilization accounts.
Aitken Creek holds gas swap contracts to manage its exposure to changes in natural gas prices, to capture natural gas price spreads, and to manage the financial risk posed by physical transactions. The fair value of the gas swap contracts was calculated using forward pricing provided by third parties. The unrealized gains and losses on these derivative instruments are recorded in earnings. As at June 30, 2016, unrealized losses totalled $3 million ($2 million after tax).
Cash Flow HedgesUNS Energy holds an interest rate swap, expiring in 2020, to mitigate its exposure to volatility in variable interest rates on lease debt. The after-tax unrealized gains and losses on cash flow hedges are recorded in other comprehensive income and reclassified to earnings as they become realized. The loss expected to be reclassified to earnings within the next 12 months is estimated to be approximately $1 million. For the three and six months ended June 30, 2016, realized losses from cash flow hedges of approximately $1 million was recognized (less than $1 million for the three and six months ended June 30, 2015).

FORTIS INC.NOTES TO INTERIM CONSOLIDATED FINANCIAL STATEMENTS
For the three and six months ended June 30, 2016 and 2015 (unless otherwise stated)(Unaudited)
F-24
Central Hudson holds interest rate cap contracts expiring in 2017 and 2019 on bonds with a total principal amount of US$64 million. Variations in the interest costs of the bonds, including any gains or losses associated with the interest rate cap contracts, are deferred as a regulatory asset or liability for recovery from, or refund to, customers in future rates, as permitted by the regulator and do not impact earnings.
In July 2016 the Corporation entered into forward-starting deal-contingent interest rate swap contracts with notional amounts totalling US$1.25 billion. These derivatives have been designated as a hedge of a portion of the cash flow risk associated with the expected issuance of approximately US$2 billion of long-term debt to finance a portion of the cash purchase price of the Acquisition of ITC. Any unrealized gains and losses will be recorded in other comprehensive income, with the exception of any hedge ineffectiveness, which will be recorded in earnings. The net gain or loss realized upon settlement of the interest rate swaps will be amortized into earnings over the terms of the associated long-term debt.
Cash flows associated with the settlement of all derivative instruments are included in operating activities on the Corporation’s consolidated statement of cash flows.
Volume of Derivative Activity
As at June 30, 2016, the following notional volumes related to electricity and natural gas derivatives that are expected to be settled are outlined below.
Maturity Contracts There-Volume (year) (#) 2016 2017 2018 2019 2020 afterEnergy contracts subject to regulatory
deferral:Electricity swap contracts (gigawatt hours
(“GWh”)) 2019 8 546 730 438 219 — —
Electricity power purchase contracts (GWh) 2017 19 791 145 — — — —Gas swap and option contracts (petajoules
(“PJ”)) 2019 125 18 15 7 1 — —
Gas supply contract premiums (PJ) 2024 94 50 49 44 26 22 63Energy contracts not subject to
regulatory deferral:Long-term wholesale trading contracts (GWh) 2017 14 1,713 1,688 — — — —Gas swap contracts (PJ) 2017 479 4 6 — — — —
Financial Instruments Not Carried At Fair Value
The following table discloses the estimated fair value measurements of the Corporation’s financial instruments not carried at fair value. The fair values were measured using Level 2 pricing inputs, except as noted. The carrying values of the Corporation’s consolidated financial instruments approximate their fair values, reflecting the short-term maturity, normal trade credit terms and/or nature of these instruments, except as follows:
As atJune 30, 2016 December 31, 2015
(Liability) Carrying Estimated Carrying Estimated($ millions) Value Fair Value Value Fair ValueLong-term debt, including current portion (Note 6) (1) (11,630) (12,682) (11,240) (12,614)Waneta Partnership promissory note (2) (57) (61) (56) (59)(1) The Corporation’s $200 million unsecured debentures due 2039 and consolidated borrowings under credit facilities
classified as long-term debt of $1,024 million (December 31, 2015 - $551 million) are valued using Level 1 inputs. All other long-term debt is valued using Level 2 inputs.
(2) Included in long-term other liabilities on the consolidated balance sheet (Note 17).

FORTIS INC.NOTES TO INTERIM CONSOLIDATED FINANCIAL STATEMENTS
For the three and six months ended June 30, 2016 and 2015 (unless otherwise stated)(Unaudited)
F-25
The fair value of long-term debt is calculated using quoted market prices when available. When quoted market prices are not available, as is the case with the Waneta Partnership promissory note and certain long-term debt, the fair value is determined by either: (i) discounting the future cash flows of the specific debt instrument at an estimated yield to maturity equivalent to benchmark government bonds or treasury bills with similar terms to maturity, plus a credit risk premium equal to that of issuers of similar credit quality; or (ii) obtaining from third parties indicative prices for the same or similarly rated issues of debt of the same remaining maturities. Since the Corporation does not intend to settle the long-term debt or promissory note prior to maturity, the excess of the estimated fair value above the carrying value does not represent an actual liability.
17. VARIABLE INTEREST ENTITY
On adoption of ASU No. 2015-02, Amendments to the Consolidation Analysis, effective January 1, 2016, Fortis was required to reassess its limited partnerships under the voting interest model. As a result, the Corporation’s ownership interest in the Waneta Partnership is considered to be a variable interest entity (“VIE”) based on an assessment of the rights of the limited partners and the general partner. It was determined under the VIE model that the Corporation is the primary beneficiary of the Waneta Partnership and should, therefore, continue to consolidate its investment. As the primary beneficiary, the Corporation has the power to direct the activities of the partnership and the obligation to absorb losses or the right to receive benefits that could potentially be significant to the partnership, as discussed below.
The purpose of the Waneta Partnership was to construct, own and operate the Waneta Expansion hydroelectric generating facility dam (“Waneta Expansion”) on the Pend d’Oreille River south of Trail, British Columbia, which was completed in April 2015. The Corporation has a 51% controlling ownership interest in the Waneta Partnership, with Columbia Power Corporation and Columbia Basin Trust (“CPC/CBT”) holding the remaining 49% interest. The general partner, which is owned by the Corporation and CPC/CBT in the same proportion as the Waneta Partnership, has a 0.01% interest in the Waneta Partnership. Each partner pays its proportionate share of the costs and is entitled to a proportionate share of the net revenue and expenses. The construction of the Waneta Expansion was jointly financed and managed by the Corporation and CPC/CBT. The Waneta Expansion is operated and maintained by a wholly owned subsidiary of the Corporation and output is sold to BC Hydro and FortisBC Electric under 40-year contracts.
The following details the Waneta Partnership assets, liabilities, revenue, expenses, and cash flow, included in the Corporation’s interim unaudited consolidated financial statements.
As atJune 30, December 31,
($ millions) 2016 2015ASSETSCash and cash equivalents 29 23Accounts receivable and other current assets 20 14Utility capital assets 703 708Intangible assets 29 30
781 775LIABILITIESAccounts payable and current liabilities (6) (18)Other liabilities (Note 16) (75) (74)
(81) (92)Net assets before non-controlling interests 700 683

FORTIS INC.NOTES TO INTERIM CONSOLIDATED FINANCIAL STATEMENTS
For the three and six months ended June 30, 2016 and 2015 (unless otherwise stated)(Unaudited)
F-26
Quarter Ended Year-to-DateJune 30 June 30
($ millions) 2016 2015 2016 2015Revenue 34 31 53 31Expenses
Operating 2 3 7 3Depreciation and amortization 4 4 9 4Finance charges 1 1 2 1
7 8 18 8Net earnings 27 23 35 23
Cash used in investing activities at the Waneta Partnership for the three and six months ended June 30, 2016 included capital expenditures of $5 million and $16 million, respectively ($7 million and $14 million for the three and six months ended June 30, 2015, respectively). Cash from financing activities included dividends paid by the Waneta Partnership to non-controlling interests of $3 million and $9 million for the three and six months ended June 30, 2016, respectively, (advances from non-controlling interests of $4 million and $9 million for the three and six months ended June 30, 2015, respectively).
18. FINANCIAL RISK MANAGEMENT
The Corporation is primarily exposed to credit risk, liquidity risk and market risk as a result of holding financial instruments in the normal course of business.
Credit risk Risk that a counterparty to a financial instrument might fail to meet its obligations under the terms of the financial instrument.
Liquidity risk Risk that an entity will encounter difficulty in raising funds to meet commitments associated with financial instruments.
Market risk Risk that the fair value or future cash flows of a financial instrument will fluctuate due to changes in market prices. The Corporation is exposed to foreign exchange risk, interest rate risk and commodity price risk.
Credit Risk
For cash equivalents, trade and other accounts receivable, and long-term other receivables, the Corporation’s credit risk is generally limited to the carrying value on the consolidated balance sheet. The Corporation generally has a large and diversified customer base, which minimizes the concentration of credit risk. The Corporation and its subsidiaries have various policies to minimize credit risk, which include requiring customer deposits, prepayments and/or credit checks for certain customers and performing disconnections and/or using third-party collection agencies for overdue accounts.
FortisAlberta has a concentration of credit risk as a result of its distribution service billings being to a relatively small group of retailers. As at June 30, 2016, FortisAlberta’s gross credit risk exposure was approximately $120 million, representing the projected value of retailer billings over a 37-day period. The Company has reduced its exposure to $1 million by obtaining from the retailers either a cash deposit, bond, letter of credit, an investment-grade credit rating from a major rating agency, or a financial guarantee from an entity with an investment-grade credit rating.
UNS Energy, Central Hudson, FortisBC Energy and Aitken Creek may be exposed to credit risk in the event of non-performance by counterparties to derivative instruments. The Companies use netting arrangements to reduce credit risk and net settle payments with counterparties where net settlement provisions exist. They also limit credit risk by primarily dealing with counterparties that have investment-grade credit ratings. At UNS Energy, contractual arrangements also contain certain provisions requiring counterparties to derivative instruments to post collateral under certain circumstances.

FORTIS INC.NOTES TO INTERIM CONSOLIDATED FINANCIAL STATEMENTS
For the three and six months ended June 30, 2016 and 2015 (unless otherwise stated)(Unaudited)
F-27
Liquidity Risk
The Corporation’s consolidated financial position could be adversely affected if it, or one of its subsidiaries, fails to arrange sufficient and cost-effective financing to fund, among other things, capital expenditures, acquisitions and the repayment of maturing debt. The ability to arrange sufficient and cost-effective financing is subject to numerous factors, including the consolidated results of operations and financial position of the Corporation and its subsidiaries, conditions in capital and bank credit markets, ratings assigned by rating agencies and general economic conditions.
To help mitigate liquidity risk, the Corporation and its regulated utilities have secured committed credit facilities to support short-term financing of capital expenditures and seasonal working capital requirements.
The Corporation’s committed credit facility is used for interim financing of acquisitions and for general corporate purposes. Depending on the timing of cash payments from subsidiaries, borrowings under the Corporation’s committed credit facility may be required from time to time to support the servicing of debt and payment of dividends. As at June 30, 2016, over the next five years, average annual consolidated fixed-term debt maturities and repayments are expected to be approximately $260 million. The combination of available credit facilities and relatively low annual debt maturities and repayments provides the Corporation and its subsidiaries with flexibility in the timing of access to capital markets.
As at June 30, 2016, the Corporation and its subsidiaries had consolidated credit facilities of approximately $3.5 billion, of which approximately $2.1 billion was unused, including $265 million unused under the Corporation’s committed credit facility. The credit facilities are syndicated mostly with the seven largest Canadian banks, as well as large banks in the United States, with no one bank holding more than 20% of these facilities. Approximately $3.3 billion of the total credit facilities are committed facilities with maturities ranging from 2019 through 2021.
The following summary outlines the credit facilities of the Corporation and its subsidiaries.
As atRegulated Corporate June 30, December 31,
($ millions) Utilities and Other 2016 2015Total credit facilities (1) 2,162 1,343 3,505 3,565Credit facilities utilized:
Short-term borrowings (2) (229) (5) (234) (511)Long-term debt (Note 6) (3) (179) (845) (1,024) (551)
Letters of credit outstanding (83) (36) (119) (104)Credit facilities unused 1,671 457 2,128 2,399(1) Total credit facilities exclude a $300 million option to increase the Corporation’s committed corporate credit facility,
as discussed below. (2) The weighted average interest rate on short-term borrowings was approximately 1.6% as at June 30, 2016
(December 31, 2015 - 1.0%).(3) As at June 30, 2016, credit facility borrowings classified as long-term debt included $179 million in current
installments of long-term debt on the consolidated balance sheet (December 31, 2015 - $71 million). The weightedaverage interest rate on credit facility borrowings classified as long-term debt was approximately 1.7% as at June 30, 2016 (December 31, 2015 - 1.5%).
As at June 30, 2016 and December 31, 2015, certain borrowings under the Corporation’s and subsidiaries’ credit facilities were classified as long-term debt. These borrowings are under long-term committed credit facilities and it is management’s intention to refinance these borrowings with long-term permanent financing during future periods. The significant changes in credit facilities from that disclosed in the Corporation’s 2015 annual audited consolidated financial statements are as follows.
In April 2016 FortisBC Electric amended its $150 million unsecured committed revolving credit facility to now mature in May 2019.
In April 2016 FHI amended its unsecured committed revolving credit facility resulting in an increase in the facility to $50 million and an extension of the maturity date to April 2019.

FORTIS INC.NOTES TO INTERIM CONSOLIDATED FINANCIAL STATEMENTS
For the three and six months ended June 30, 2016 and 2015 (unless otherwise stated)(Unaudited)
F-28
In April 2016 the Corporation amended its $1 billion unsecured committed revolving credit facility, resulting in an extension of the maturity date to July 2021. The Corporation has the option to increase the facility to $1.3 billion from $1 billion. As at June 30, 2016, the Corporation has not yet exercised this option.
In June 2016 FortisOntario amended its $30 million unsecured committed revolving credit facility to now mature in June 2019.
In July 2016 FortisBC Energy amended its $700 million unsecured committed revolving credit facility to now mature in August 2021.
In July 2016 FortisAlberta amended its $250 million unsecured committed revolving credit facility to now mature in August 2021.
In July 2016 Newfoundland Power amended its $100 million unsecured committed revolving credit facility to now mature in August 2021.
In connection with the pending Acquisition of ITC, in February 2016 the Corporation obtained commitments of US$2.0 billion from Goldman Sachs Bank USA to bridge the long-term debt financing (“Debt Bridge Facility”) and US$1.7 billion from The Bank of Nova Scotia to primarily bridge the sale of the minority investment in ITC (“Equity Bridge Facilities”) (Note 11). These non-revolving term senior unsecured credit facilities are repayable in full on the first anniversary of their advance. Goldman Sachs Bank USA has syndicated 60% of the Debt Bridge Facility to three other financial institutions, each of which have agreed to provide 20% of such facility. The Bank of Nova Scotia may syndicate a portion of the Equity Bridge Facilities. The credit facilities table does not include the US$3.7 billion Acquisition credit facilities.
The Corporation and its currently rated utilities target investment-grade credit ratings to maintain capital market access at reasonable interest rates. As at June 30, 2016, the Corporation’s credit ratings were as follows:
Standard & Poor’s (“S&P”) A- / Negative (long-term corporate credit rating)BBB+ / Negative (unsecured debt credit rating)
DBRS A (low) / Under Review - Negative Implications (unsecured debt credit rating)
The above-noted credit ratings reflect the Corporation’s low business-risk profile and diversity of its operations, the stand-alone nature and financial separation of each of the regulated subsidiaries of Fortis,and management’s commitment to maintaining reasonable levels of debt at the holding company level. In February 2016, after the announcement by Fortis that it had entered into an agreement to acquire ITC, S&P affirmed the Corporation’s long-term corporate credit rating at A-, revised its unsecured debt credit rating to BBB+ from A-, and revised its outlook on the Corporation to negative from stable. Similarly, in February 2016 DBRS placed the Corporation’s unsecured debt credit rating under review with negative implications.
Market Risk
Foreign Exchange RiskThe Corporation’s earnings from, and net investments in, foreign subsidiaries are exposed to fluctuations in the US dollar-to-Canadian dollar exchange rate. The Corporation has decreased the above-noted exposure through the use of US dollar-denominated borrowings at the corporate level. The foreign exchange gain or loss on the translation of US dollar-denominated interest expense partially offsets the foreign exchange gain or loss on the translation of the Corporation’s foreign subsidiaries’ earnings, which are denominated in US dollars. The reporting currency of UNS Energy, Central Hudson, Caribbean Utilities, Fortis Turks and Caicos and Belize Electric Company Limited is the US dollar.

FORTIS INC.NOTES TO INTERIM CONSOLIDATED FINANCIAL STATEMENTS
For the three and six months ended June 30, 2016 and 2015 (unless otherwise stated)(Unaudited)
F-29
As at June 30, 2016, the Corporation’s corporately issued US$1,793 million (December 31, 2015- -US$1,535 million) long-term debt had been designated as an effective hedge of a portion of the Corporation’s foreign net investments. As at June 30, 2016, the Corporation had approximately US$2,925 million (December 31, 2015 - US$3,137 million) in foreign net investments remaining to be hedged. Foreign currency exchange rate fluctuations associated with the translation of the Corporation’s corporately issued US dollar-denominated borrowings designated as effective hedges are recorded on the consolidated balance sheet in accumulated other comprehensive income and serve to help offset unrealized foreign currency exchange gains and losses on the net investments in foreign subsidiaries, which gains and losses are also recorded on the consolidated balance sheet in accumulated other comprehensive income.
On an annual basis, it is estimated that a 5 cent, or 5%, increase or decrease in the US dollar relative to the Canadian dollar exchange rate of US$1.00=CAD$1.29 as at June 30, 2016 would increase or decrease earnings per common share of Fortis by approximately 4 cents, excluding the pending Acquisition of ITC. Management will continue to hedge future exchange rate fluctuations related to the Corporation’s foreign net investments and US dollar-denominated earnings streams, where possible, through future US dollar-denominated borrowings, and will continue to monitor the Corporation’s exposure to foreign currency fluctuations on a regular basis.
Interest Rate RiskThe Corporation and most of its subsidiaries are exposed to interest rate risk associated with borrowings under variable-rate credit facilities, variable-rate long-term debt and the refinancing of long-term debt. The Corporation and its subsidiaries may enter into interest rate swap agreements to help reduce this risk (Note 16).
Commodity Price RiskUNS Energy is exposed to commodity price risk associated with changes in the market price of gas, purchased power and coal. Central Hudson is exposed to commodity price risk associated with changes in the market price of electricity and natural gas. FortisBC Energy is exposed to commodity price risk associated with changes in the market price of natural gas. The risks have been reduced by entering into derivative contracts that effectively fix the price of natural gas, power and electricity purchases. Aitken Creek is exposed to commodity price risk associated with changes in the market price of gas and enters into derivative contracts to manage the financial risk posed by physical transactions. These derivative instruments are recorded on the consolidated balance sheet at fair value and any change in the fair value is deferred as a regulatory asset or liability, as permitted by the regulators, for recovery from, or refund to, customers in future rates, except at Aitken Creek where the changes in fair value are recorded in earnings (Note 16).
19. COMMITMENTS
There were no material changes in the nature and amount of the Corporation’s commitments from the commitments disclosed in the Corporation’s 2015 annual audited consolidated financial statements, except as follows.
UNS Energy is party to renewable power purchase agreements totalling approximately US$1,168 million as at June 30, 2016, which require UNS Energy to purchase 100% of the output of certain renewable energy generation facilities that have achieved commercial operation. In March 2016 one of the facilities achieved commercial operation, increasing estimated future payments of renewable power purchase contracts by US$58 million as at June 30, 2016.
In January 2016 the ownership of the San Juan generating station was restructured and a new coal supply agreement came into effect under which TEP’s minimum purchase obligations are US$137 million as at June 30, 2016.
In February 2016 TEP entered into a settlement agreement with third-party owners of Springerville Unit 1 to purchase the third-party owners’ 50.5% undivided interest in Springerville Unit 1 for US$85 million. The purchase is expected to close in the third quarter of 2016 (Note 20).

FORTIS INC.NOTES TO INTERIM CONSOLIDATED FINANCIAL STATEMENTS
For the three and six months ended June 30, 2016 and 2015 (unless otherwise stated)(Unaudited)
F-30
20. CONTINGENCIES
The Corporation and its subsidiaries are subject to various legal proceedings and claims associated with the ordinary course of business operations. Management believes that the amount of liability, if any, from these actions would not have a material adverse effect on the Corporation’s consolidated financial position, results of operations or cash flows.
The following describes the nature of the Corporation’s contingencies.
UNS EnergySpringerville Unit 1In February 2016 TEP entered into an agreement with the third-party owners for the settlement andrelease of asserted claims and the purchase and sale of beneficial interests in Springerville Unit 1 (the “Agreement”). The Agreement provides that TEP will purchase the third-party owners’ 50.5% undivided interest in Springerville Unit 1 for US$85 million and the third-party owners will pay TEP US$13 million for operating costs related to Springerville Unit 1 incurred on behalf of the third-party owners. Upon completion of the purchase, all outstanding disputes, pending litigation and arbitration proceedings between TEP and the third-party owners will be dismissed with prejudice.
The purchase of the third-party owners’ undivided interest in Springerville Unit 1 is subject to, among other things, FERC approval and satisfaction of other customary closing conditions. TEP expects the purchase to close in the third quarter of 2016. However, there is no assurance that the settlement will be finalized or that the litigation will not continue. Therefore, at this time TEP cannot predict the outcome of the claims relating to Springerville Unit 1, and, due to the general and non-specific scope and nature of the claims, TEP cannot determine estimates of the range of loss, if any, at this time and, accordingly no amount has been accrued in the consolidated financial statements. Should the litigation matters continue, TEP intends to continue vigorously defending itself against the claims asserted by the third-party owners and to vigorously pursue the claims it has asserted against the owner trustees and co-trustees.
The following is the history of the outstanding disputes and pending litigation and arbitration proceedings between TEP and the third-party owners.
In November 2014 the Springerville Unit 1 third-party owners filed a complaint (“FERC Action”) against TEP with FERC, alleging that TEP had not agreed to wheel power and energy for the third-party owners in the manner specified in the existing Springerville Unit 1 facility support agreement between TEP and the third-party owners and for the cost specified by the third-party owners’. The third-party owners requested an order from FERC requiring such wheeling of the third-party owners energy from their Springerville Unit 1 interests beginning in January 2015 for the price specified by the third-party owners. In February 2015 FERC issued an order denying the third-party owners’ complaint. In March 2015 the third-party owners filed a request for rehearing in the FERC Action, which FERC denied in October 2015. In December 2015 the third-party owners appealed FERC’s order denying the third-party owners’ complaint to the U.S. Court of Appeals for the Ninth Circuit. In December 2015 TEP filed an unopposed motion to intervene in the Ninth Circuit appeal.
In December 2014 the third-party owners filed a complaint (“New York Action”) against TEP in the Supreme Court of the State of New York, New York County. In response to motions filed by TEP to dismiss various counts and compel arbitration of certain of the matters alleged and the court’s subsequent ruling on the motions, the third-party owners have amended the complaint three times, dropping certain of the allegations and raising others in the New York Action and in the arbitration proceeding described below. As amended, the New York Action alleges, among other things, that TEP failed to properly operate, maintain and make capital investments in Springerville Unit 1 during the term of the leases; and that TEP breached the lease transaction documents by refusing to pay certain of the third-party owners’ claimed expenses. The third amended complaint seeks US$71 million in liquidated damages and direct and consequential damages in an amount to be determined at trial. The third-party owners have also agreed to stay their claim that TEP has not agreed to wheel power and energy as required pending the outcome of the FERC Action. In November 2015 the third-party owners filed a motion for summary judgment on their claim that TEP failed to pay certain of the third-party owners’ claimed expenses.

FORTIS INC.NOTES TO INTERIM CONSOLIDATED FINANCIAL STATEMENTS
For the three and six months ended June 30, 2016 and 2015 (unless otherwise stated)(Unaudited)
F-31
In December 2014 and January 2015, Wilmington Trust Company, as owner trustees and lessors under the leases of the third-party owners, sent notices to TEP that alleged that TEP had defaulted under the third-party owners’ leases. The notices demanded that TEP pay liquidated damages totalling approximately US$71 million. In letters to the owner trustees, TEP denied the allegations in the notices.
In April 2015 TEP filed a demand for arbitration with the American Arbitration Association (“AAA”) seeking an award of the owner trustees and co-trustees’ share of unreimbursed expenses and capital expenditures for Springerville Unit 1. In June 2015 the third-party owners filed a separate demand for arbitration with the AAA alleging, among other things, that TEP has failed to properly operate, maintain and make capital investments in Springerville Unit 1 since the leases have expired. The third-party owners’ arbitration demand seeks declaratory judgments, damages in an amount to be determined by the arbitration panel and the third-party owners’ fees and expenses. TEP and the third-party owners have since agreed to consolidate their arbitration demands into one proceeding. In August 2015 the third-party owners filed an amended arbitration demand adding claims that TEP has converted the third-party owners’ water rights and certain emission reduction payments and that TEP is improperly dispatching the third-party owners’ unscheduled Springerville Unit 1 power and capacity.
In October 2015 the arbitration panel granted TEP’s motion for interim relief, ordering the owner trustees and co-trustees to pay TEP their pro-rata share of unreimbursed expenses and capital expenditures for Springerville Unit 1 during the pendency of the arbitration. The arbitration panel also denied the third-party owners’ motion for interim relief, which had requested that TEP be enjoined from dispatching the third-party owners’ unscheduled Springerville Unit 1 power and capacity. TEP has been scheduling the third-party owners’ entitlement share of power from Springerville Unit 1, as permitted under the Springerville Unit 1 facility support agreement, since June 2015.
In November 2015 TEP filed a petition to confirm the interim arbitration order in the Supreme Court of the State of New York naming owner trustee and co-trustee as respondents. The petition seeks an order from the court confirming the interim arbitration order under the Federal Arbitration Act. In December 2015 the owner trustees filed an answer to the petition and a cross-motion to vacate the interim arbitration order.
As at June 30, 2016, TEP billed the third-party owners approximately US$35 million for their pro-rata share of Springerville Unit 1 expenses and US$7 million for their pro-rata share of capital expenditures, none of which had been paid as of July 28, 2016.
Mine Reclamation CostsTEP pays ongoing reclamation costs related to coal mines that supply generating stations in which the Company has an ownership interest but does not operate. TEP is liable for a portion of final reclamation costs upon closure of the mines servicing the San Juan, Four Corners and Navajo generating stations. TEP’s share of reclamation costs at all three mines is expected to be US$42 million upon expiration of the coal supply agreements, which expire between 2019 and 2031. The mine reclamation liability recorded as at June 30, 2016 was US$24 million (December 31, 2015 - US$25 million) and represents the present value of the estimated future liability.
Amounts recorded for final reclamation are subject to various assumptions, such as estimations of reclamation costs, the dates when final reclamation will occur, and the expected inflation rate. As these assumptions change, TEP will prospectively adjust the expense amounts for final reclamation over the remaining coal supply agreements’ terms.
TEP is permitted to fully recover these costs from retail customers and, accordingly, these costs are deferred as a regulatory asset (Note 5).
Central HudsonSite Investigation and Remediation ProgramCentral Hudson and its predecessors owned and operated MGPs to serve their customers’ heating and lighting needs. These plants manufactured gas from coal and oil beginning in the mid to late 1800s, with all sites ceasing operations by the 1950s. This process produced certain by-products that may pose risks to human health and the environment.

FORTIS INC.NOTES TO INTERIM CONSOLIDATED FINANCIAL STATEMENTS
For the three and six months ended June 30, 2016 and 2015 (unless otherwise stated)(Unaudited)
F-32
The New York State Department of Environmental Conservation (“DEC”), which regulates the timing and extent of remediation of MGP sites in New York State, has notified Central Hudson that it believes the Company or its predecessors at one time owned and/or operated MGPs at seven sites in Central Hudson’s franchise territory. The DEC has further requested that the Company investigate and, if necessary, remediate these sites under a Consent Order, Voluntary Clean-up Agreement or Brownfield Clean-up Agreement. Central Hudson accrues for remediation costs based on the amounts that can be reasonably estimated. As at June 30, 2016, an obligation of US$88 million (December 31, 2015 - US$92 million) was recognized in respect of site investigation and remediation and, based upon cost model analysis completed in 2014, it is estimated, with a 90% confidence level, that total costs to remediate these sites over the next 30 years will not exceed US$169 million.
Central Hudson has notified its insurers and intends to seek reimbursement from insurers for remediation, where coverage exists. Further, as authorized by the PSC, Central Hudson is currently permitted to defer, for future recovery from customers, differences between actual costs for MGP site investigation and remediation and the associated rate allowances, with carrying charges to be accrued on the deferred balances at the authorized pre-tax rate of return. In the three-year rate order issued by the PSC in June 2015, Central Hudson’s authorization to defer all site investigation and remediation costs was reaffirmed and extended through June 2018 (Note 5).
Asbestos LitigationPrior to and after its acquisition by Fortis, various asbestos lawsuits have been brought against Central Hudson. While a total of 3,355 asbestos cases have been raised, 1,172 remained pending as at June 30, 2016. Of the cases no longer pending against Central Hudson, 2,027 have been dismissed or discontinued without payment by the Company, and Central Hudson has settled the remaining 156 cases. The Company is presently unable to assess the validity of the outstanding asbestos lawsuits; however, based on information known to Central Hudson at this time, including the Company’s experience in the settlement and/or dismissal of asbestos cases, Central Hudson believes that the costs which may be incurred in connection with the remaining lawsuits will not have a material effect on its financial position, results of operations or cash flows and, accordingly, no amount has been accrued in the consolidated financial statements.
FortisBC ElectricThe Government of British Columbia filed a claim in the British Columbia Supreme Court in June 2012 claiming on its behalf, and on behalf of approximately 17 homeowners, damages suffered as a result of a landslide caused by a dam failure in Oliver, British Columbia in 2010. The Government of British Columbia alleges in its claim that the dam failure was caused by the defendants’, which include FortisBC Electric, useof a road on top of the dam. The Government of British Columbia estimates its damages and the damages of the homeowners, on whose behalf it is claiming, to be approximately $15 million. While FortisBC Electric has notified its insurers, it has been advised by the Government of British Columbia that a response to the claim is not required at this time. The outcome cannot be reasonably determined and estimated at this time and, accordingly, no amount has been accrued in the consolidated financial statements.
FHIIn April 2013 FHI and Fortis were named as defendants in an action in the B.C. Supreme Court by the Coldwater Indian Band (“Band”). The claim is in regard to interests in a pipeline right of way on reserve lands. The pipeline on the right of way was transferred by FHI (then Terasen Inc.) to Kinder Morgan Inc. in April 2007. The Band seeks orders cancelling the right of way and claims damages for wrongful interference with the Band’s use and enjoyment of reserve lands. The outcome cannot be reasonably determined and estimated at this time and, accordingly, no amount has been accrued in the consolidated financial statements.
21. COMPARATIVE FIGURES
Certain comparative figures have been reclassified to comply with current period presentation. Acquisition-related expenses were previously included in other income, net of expenses, on the consolidated statement of earnings and have been reclassified to operating expenses.

Expected Dividend* and Earnings Release Dates
Earnings Release Dates July 29, 2016 November 4, 2016 February 16, 2017 May 2, 2017
Dividend Record Dates August 19, 2016 November 18, 2016 February 16, 2017 May 18, 2017
Dividend Payment Dates September 1, 2016 December 1, 2016 March 1, 2017 June 1, 2017
* The setting of dividend record dates and the declaration and payment of dividends are subject to the Board of Directors’ approval.
Registrar and Transfer Agent Computershare Trust Company of Canada 8th Floor, 100 University Avenue Toronto, ON M5J 2Y1 T: 514-982-7555 or 1-866-586-7638 F: 416-263-9394 or 1-888-453-0330 W: www.investorcentre.com/fortisinc
Share Listings The Common Shares; First Preference Shares, Series E; First Preference Shares, Series F; First Preference Shares, Series G; First Preference Shares, Series H; First Preference Shares, Series I; First Preference Shares, Series J; First Preference Shares, Series K; and First Preference Shares, Series M of Fortis are traded on the Toronto Stock Exchange under the symbols FTS, FTS.PR.E, FTS.PR.F, FTS.PR.G, FTS.PR.H, FTS.PR.I, FTS.PR.J, FTS.PR.K and FTS.PR.M, respectively.
Fortis Common Shares ($) Quarter Ended June 30
2016 2015
High 43.91 39.90
Low 38.52 34.45
Close 43.67 35.08

Fortis Place | Suite 1100, 5 Springdale Street | PO Box 8837 | St. John’s, NL Canada A1B 3T2T: 709.737.2800 | F: 709.737.5307 | www.fortisinc.com | TSX:FTS