Embed Size (px)
Citation preview
Q2 2016 Financial presentation
Arne Møgster – CEO
Britt Kathrine Drivenes – CFO
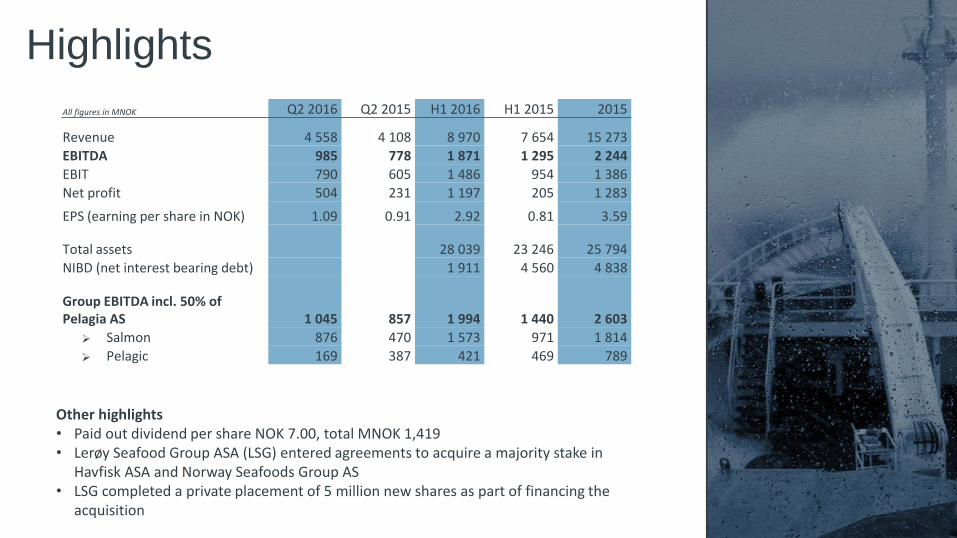
Other highlights • Paid out dividend per share NOK 7.00, total MNOK 1,419 • Lerøy Seafood Group ASA (LSG) entered agreements to acquire a majority stake in
Havfisk ASA and Norway Seafoods Group AS • LSG completed a private placement of 5 million new shares as part of financing the
acquisition
Highlights
All figures in MNOK Q2 2016 Q2 2015 H1 2016 H1 2015 2015
Revenue 4 558 4 108 8 970 7 654 15 273
EBITDA 985 778 1 871 1 295 2 244
EBIT 790 605 1 486 954 1 386
Net profit 504 231 1 197 205 1 283
EPS (earning per share in NOK) 1.09 0.91 2.92 0.81 3.59
Total assets 28 039 23 246 25 794
NIBD (net interest bearing debt) 1 911 4 560 4 838
Group EBITDA incl. 50% of Pelagia AS 1 045 857 1 994 1 440 2 603
Salmon 876 470 1 573 971 1 814
Pelagic 169 387 421 469 789
www.auss.no Austevoll Seafood ASA 3
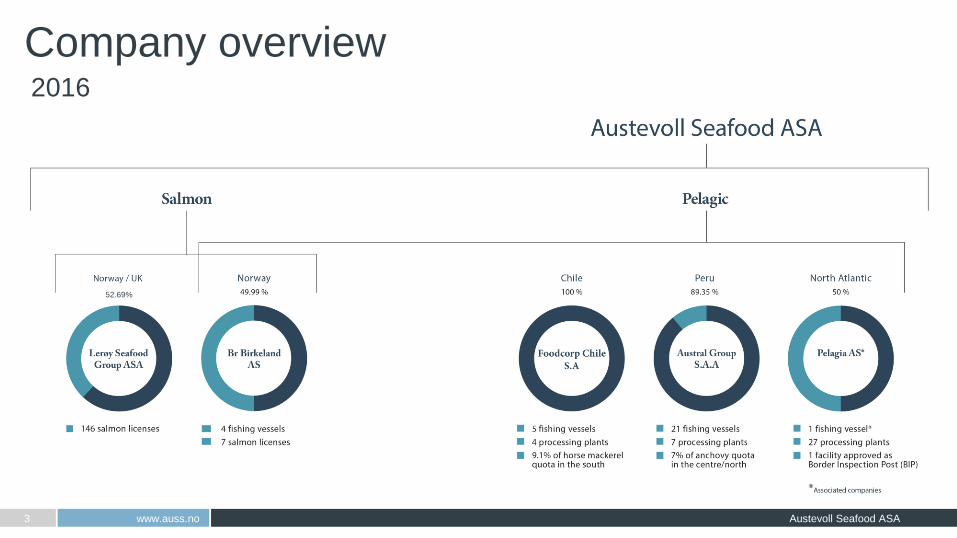
2016
Company overview
52.69%
www.auss.no Austevoll Seafood ASA 4
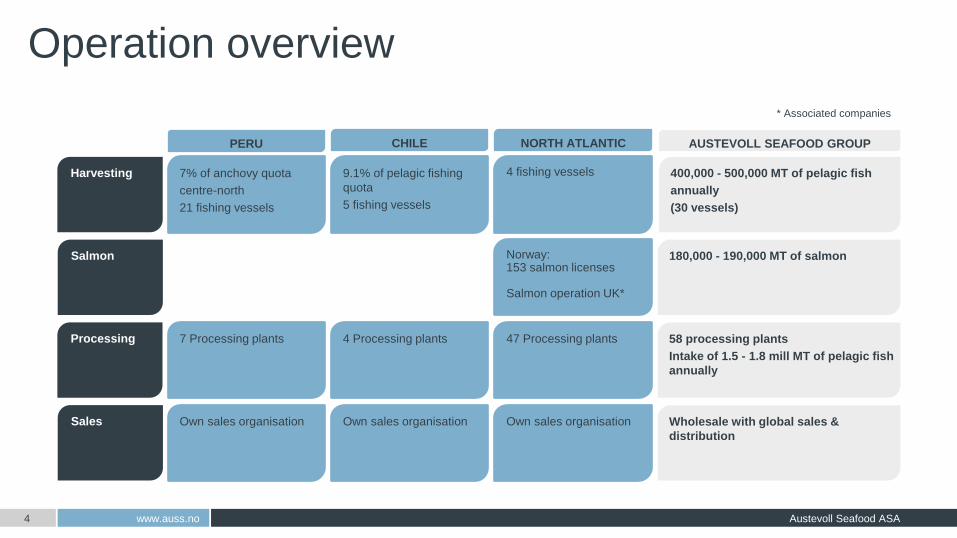
Operation overview
Harvesting 400,000 - 500,000 MT of pelagic fish
annually
(30 vessels)
AUSTEVOLL SEAFOOD GROUP
Salmon 180,000 - 190,000 MT of salmon
Processing 58 processing plants
Intake of 1.5 - 1.8 mill MT of pelagic fish
annually
Sales Wholesale with global sales &
distribution
PERU
7% of anchovy quota
centre-north
21 fishing vessels
7 Processing plants
Own sales organisation
CHILE
9.1% of pelagic fishing
quota
5 fishing vessels
4 Processing plants
Own sales organisation
NORTH ATLANTIC
4 fishing vessels
Norway: 153 salmon licenses
Salmon operation UK*
47 Processing plants
Own sales organisation
* Associated companies
Pelagic Austral Group S.A.A
Foodcorp Chile S.A
Pelagia AS (associated)

www.auss.no Austevoll Seafood ASA 6
Austral Group S.A.A
• Centre/ North
o Anchovy quota 1st season 2016 set at 1.8 million MT
o Late startup and early termination of the anchovy season
resulted in 50% of the national quota being caught
o Austral caught 55% of their quota for the season
o Increase third parties vs. 2015 (1.9% vs. 1.1% share) due to
Coischo plant capacity increase.
o Total yield 26.7% first season 2016 vs. 26% first season 2015
o Production of Super Prime and Prime fishmeal reaching 78% vs.
69% same season last year.
o Production 1st season 2016 to be sold in Q3 2016 principally
• South
o 1st quota (Semester 1) finalised. Austral caught 12,000 MT
(completed 82.4% vs. national average 39.8%)
o 2nd quota 2016 defined: 382,000 MT from 7 July 2016 to 31
December 2016
• Market
o Fishmeal prices firm and increasing due to lower than expected
catch volumes
'000 MT Q2
2016
Q2
2015
H1
2016
H1
2015
2016E
*
2015
Own catch:
Anchoveta 34 185 53 186 224 248
Purchase:
Anchoveta 19 38 38 38 100 62
Total ('000 MT) 53 223 90 224 324 311
*Based on 2,0 million MT in second season, however subject to
final quota announcement
Operation in Peru
www.auss.no Austevoll Seafood ASA 7
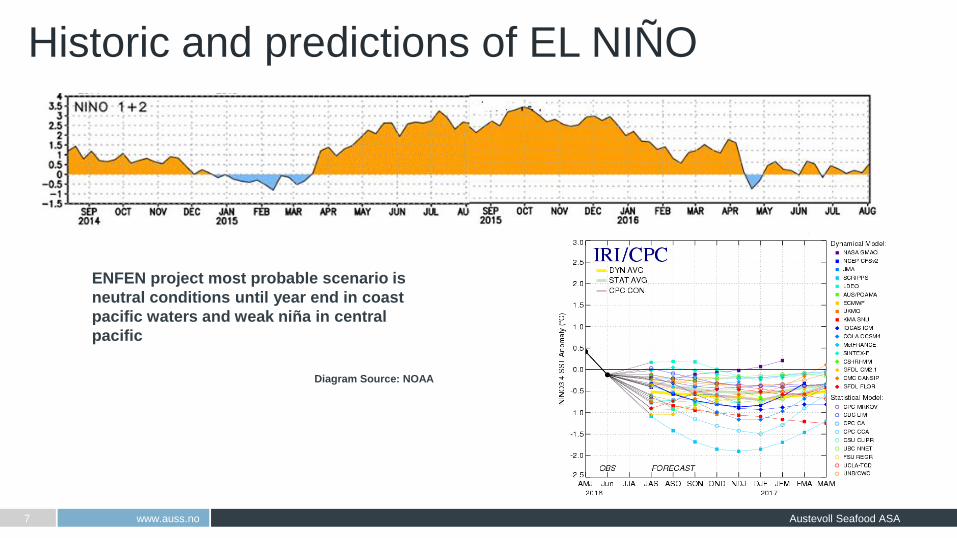
ENFEN project most probable scenario is
neutral conditions until year end in coast
pacific waters and weak niña in central
pacific
Diagram Source: NOAA
Historic and predictions of EL NIÑO
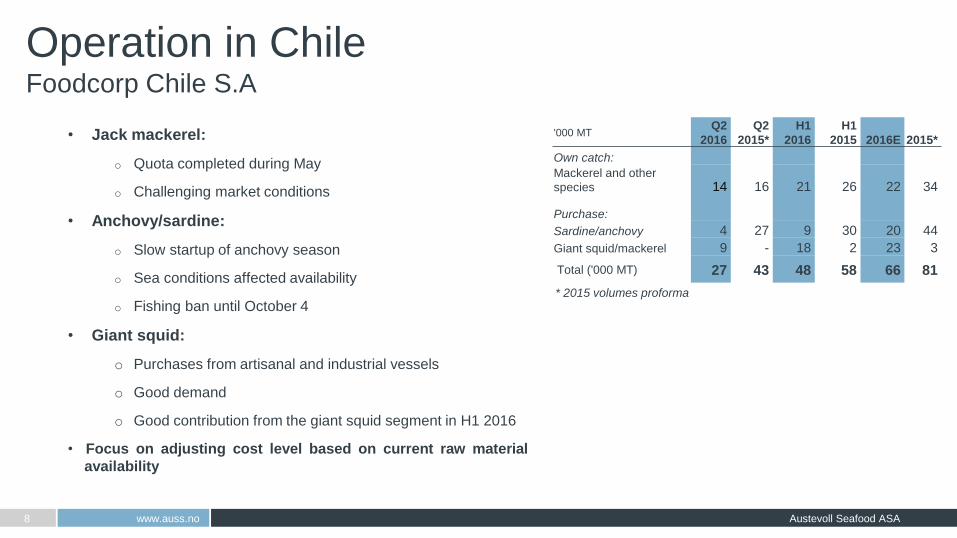
• Jack mackerel:
o Quota completed during May
o Challenging market conditions
• Anchovy/sardine:
o Slow startup of anchovy season
o Sea conditions affected availability
o Fishing ban until October 4
• Giant squid:
o Purchases from artisanal and industrial vessels
o Good demand
o Good contribution from the giant squid segment in H1 2016
• Focus on adjusting cost level based on current raw material
availability
'000 MT Q2
2016
Q2
2015*
H1
2016
H1
2015
2016E
2015*
Own catch:
Mackerel and other
species 14 16 21 26 22 34
Purchase:
Sardine/anchovy 4 27 9 30 20 44
Giant squid/mackerel 9 - 18 2 23 3
Total ('000 MT) 27 43 48 58 66 81
www.auss.no Austevoll Seafood ASA 8
Operation in Chile Foodcorp Chile S.A
* 2015 volumes proforma
www.auss.no Austevoll Seafood ASA 9
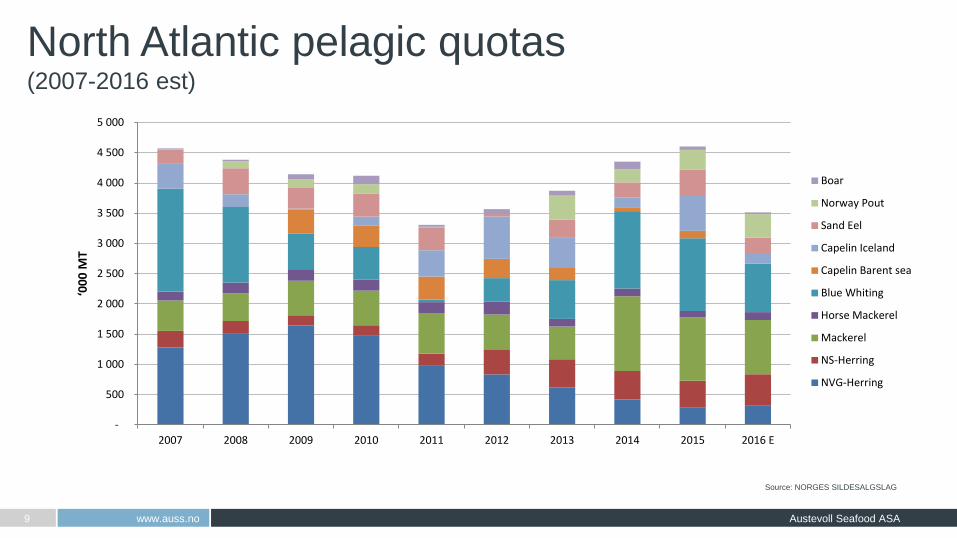
North Atlantic pelagic quotas (2007-2016 est)
Source: NORGES SILDESALGSLAG
-
500
1 000
1 500
2 000
2 500
3 000
3 500
4 000
4 500
5 000
2007 2008 2009 2010 2011 2012 2013 2014 2015 2016 E
‘00
0 M
T
Boar
Norway Pout
Sand Eel
Capelin Iceland
Capelin Barent sea
Blue Whiting
Horse Mackerel
Mackerel
NS-Herring
NVG-Herring
www.auss.no Austevoll Seafood ASA 10
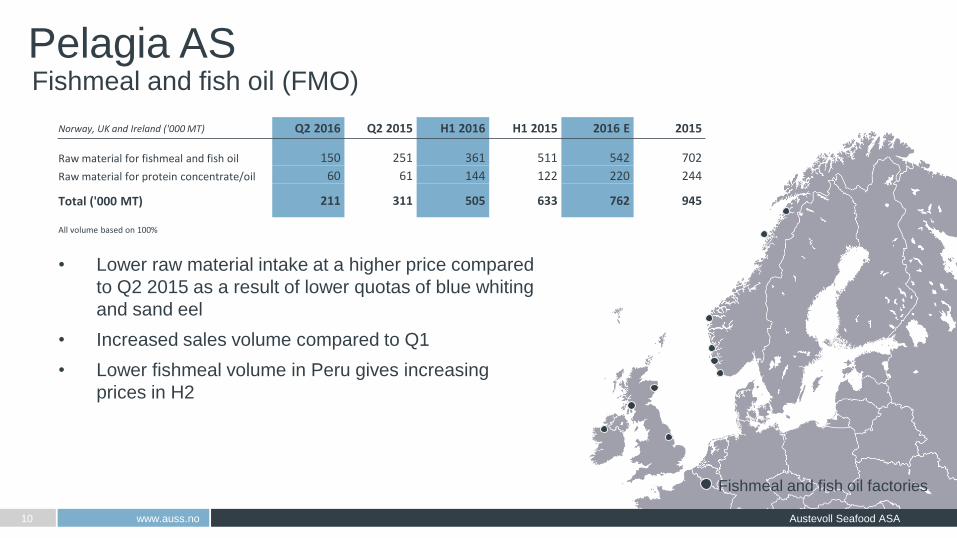
Fishmeal and fish oil (FMO)
Fishmeal and fish oil factories
• Lower raw material intake at a higher price compared
to Q2 2015 as a result of lower quotas of blue whiting
and sand eel
• Increased sales volume compared to Q1
• Lower fishmeal volume in Peru gives increasing
prices in H2
Norway, UK and Ireland ('000 MT) Q2 2016 Q2 2015 H1 2016 H1 2015 2016 E 2015
Raw material for fishmeal and fish oil 150 251 361 511 542 702
Raw material for protein concentrate/oil 60 61 144 122 220 244
Total ('000 MT) 211 311 505 633 762 945
All volume based on 100%
Pelagia AS
www.auss.no Austevoll Seafood ASA 11
Pelagic factories
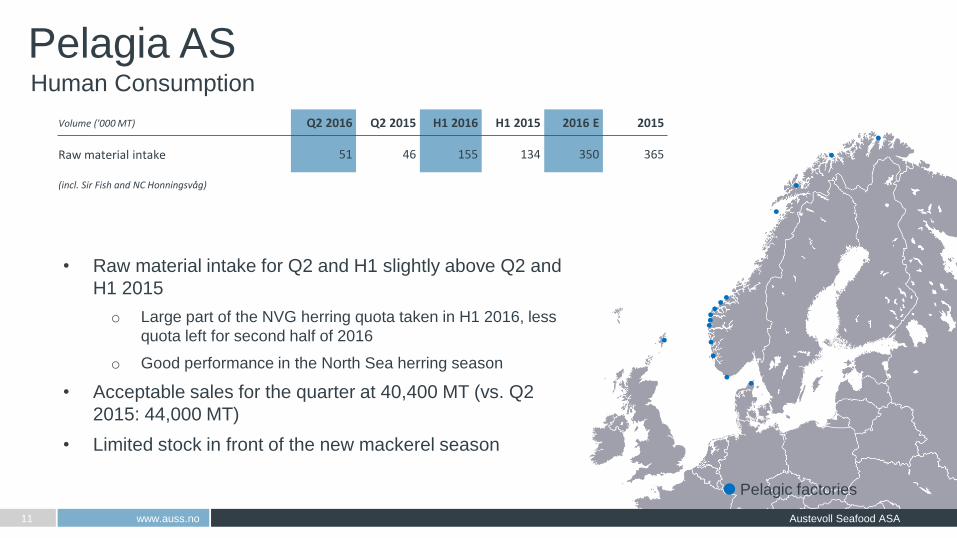
• Raw material intake for Q2 and H1 slightly above Q2 and
H1 2015
o Large part of the NVG herring quota taken in H1 2016, less
quota left for second half of 2016
o Good performance in the North Sea herring season
• Acceptable sales for the quarter at 40,400 MT (vs. Q2
2015: 44,000 MT)
• Limited stock in front of the new mackerel season
Volume ('000 MT) Q2 2016 Q2 2015 H1 2016 H1 2015 2016 E 2015
Raw material intake 51 46 155 134 350 365
(incl. Sir Fish and NC Honningsvåg)
Human Consumption
Pelagia AS
www.auss.no Austevoll Seafood ASA 12
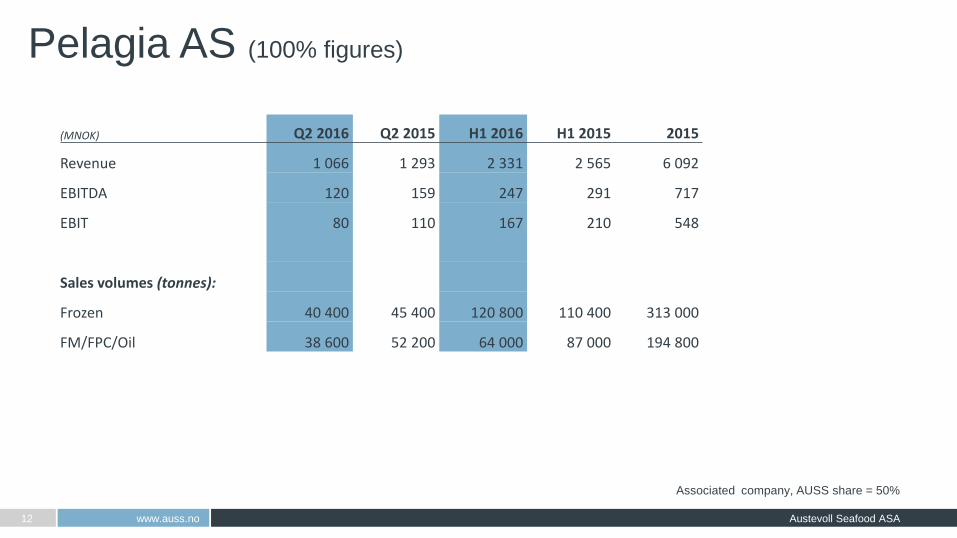
Associated company, AUSS share = 50%
(MNOK) Q2 2016 Q2 2015 H1 2016 H1 2015 2015
Revenue 1 066 1 293 2 331 2 565 6 092
EBITDA 120 159 247 291 717
EBIT 80 110 167 210 548
Sales volumes (tonnes):
Frozen 40 400 45 400 120 800 110 400 313 000
FM/FPC/Oil 38 600 52 200 64 000 87 000 194 800
Pelagia AS (100% figures)
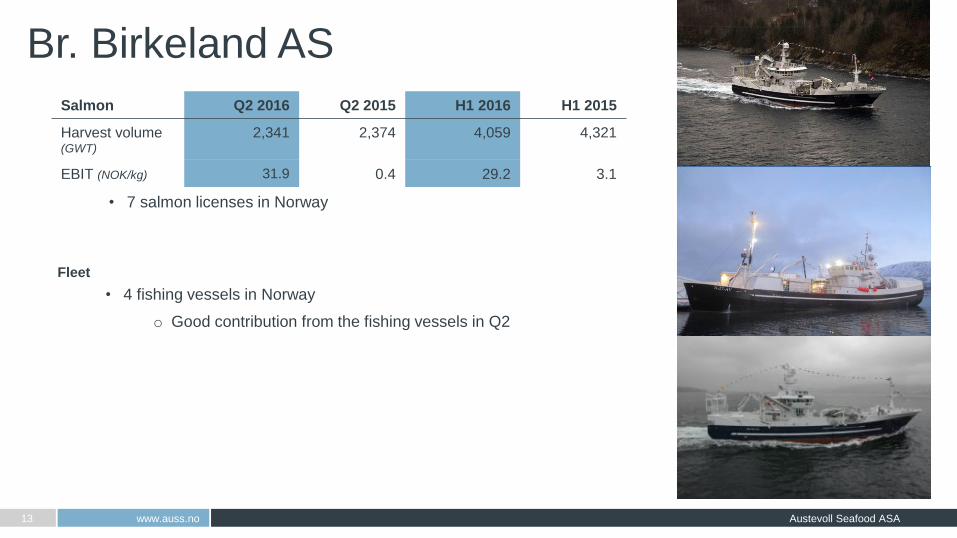
Salmon Q2 2016 Q2 2015 H1 2016 H1 2015
Harvest volume (GWT)
2,341 2,374 4,059 4,321
EBIT (NOK/kg) 31.9 0.4 29.2 3.1
• 7 salmon licenses in Norway
www.auss.no Austevoll Seafood ASA 13
Br. Birkeland AS
Fleet
• 4 fishing vessels in Norway
o Good contribution from the fishing vessels in Q2

Salmon Lerøy Seafood Group ASA
www.auss.no Austevoll Seafood ASA 15
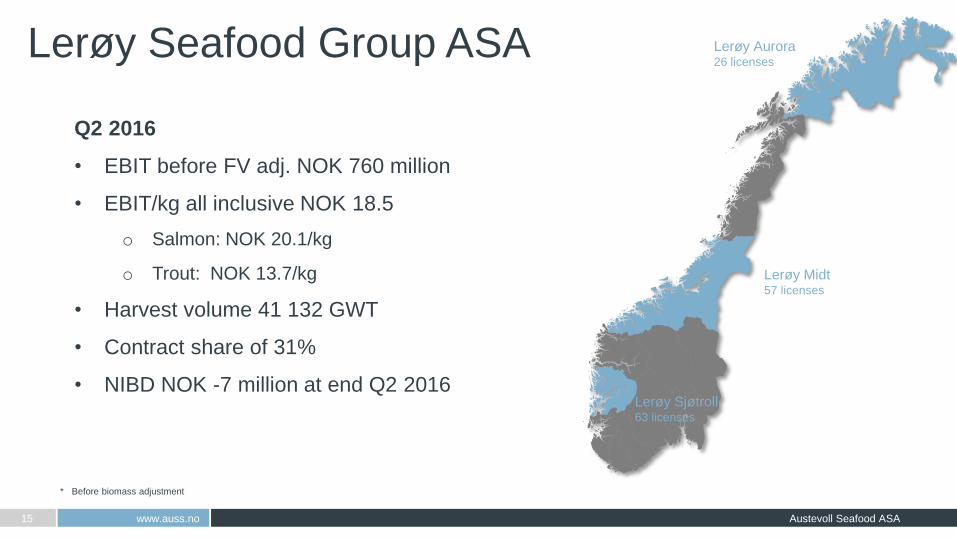
Lerøy Seafood Group ASA Lerøy Aurora 26 licenses
Lerøy Midt 57 licenses
Lerøy Sjøtroll 63 licenses
* Before biomass adjustment
Q2 2016
• EBIT before FV adj. NOK 760 million
• EBIT/kg all inclusive NOK 18.5
o Salmon: NOK 20.1/kg
o Trout: NOK 13.7/kg
• Harvest volume 41 132 GWT
• Contract share of 31%
• NIBD NOK -7 million at end Q2 2016
www.auss.no Austevoll Seafood ASA 16
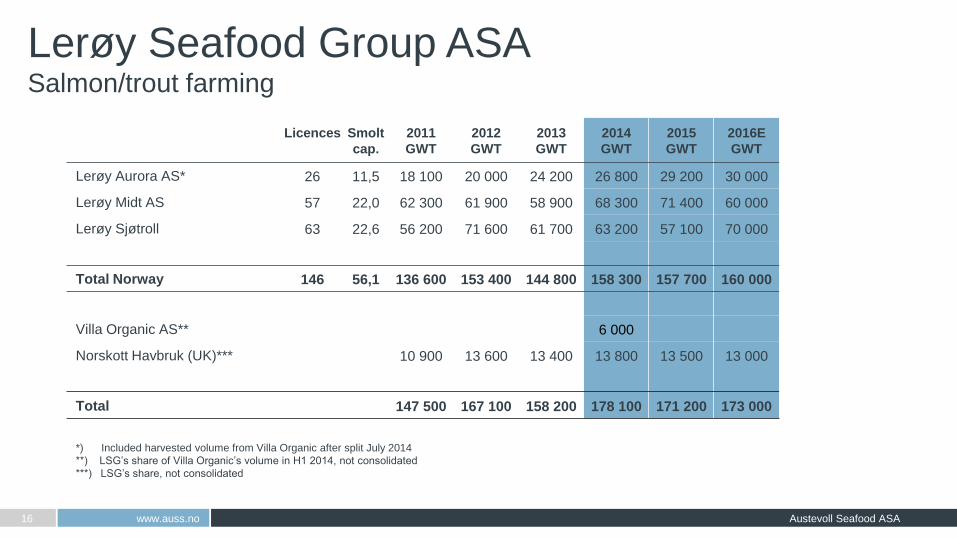
Salmon/trout farming
Lerøy Seafood Group ASA
*) Included harvested volume from Villa Organic after split July 2014
**) LSG’s share of Villa Organic’s volume in H1 2014, not consolidated
***) LSG’s share, not consolidated
Licences
Smolt
cap.
2011
GWT
2012
GWT
2013
GWT
2014
GWT
2015
GWT
2016E
GWT
Lerøy Aurora AS* 26 11,5 18 100 20 000 24 200 26 800 29 200 30 000
Lerøy Midt AS 57 22,0 62 300 61 900 58 900 68 300 71 400 60 000
Lerøy Sjøtroll 63 22,6 56 200 71 600 61 700 63 200 57 100 70 000
Total Norway 146 56,1 136 600 153 400 144 800 158 300 157 700 160 000
Villa Organic AS** 6 000
Norskott Havbruk (UK)*** 10 900 13 600 13 400 13 800 13 500 13 000
Total 147 500 167 100 158 200 178 100 171 200 173 000
www.auss.no Austevoll Seafood ASA 17
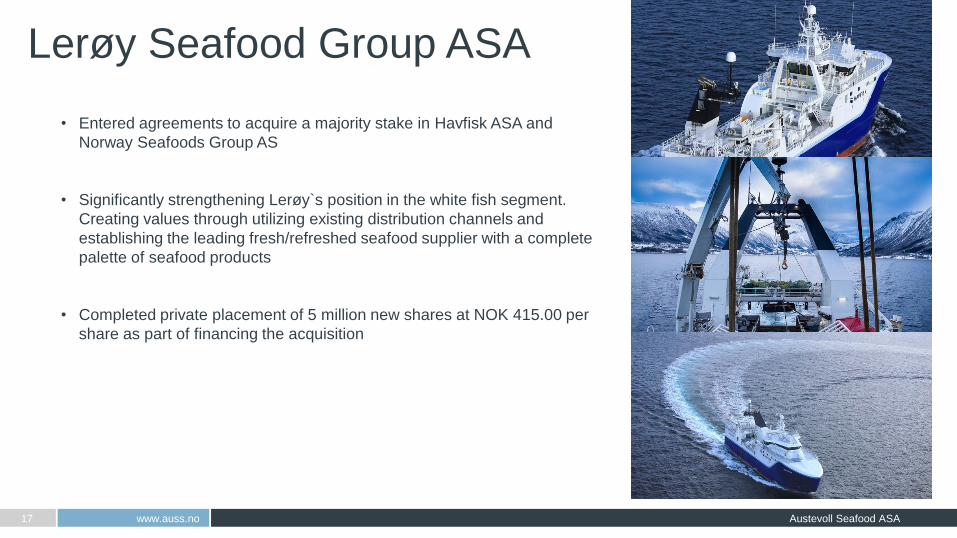
Lerøy Seafood Group ASA
• Entered agreements to acquire a majority stake in Havfisk ASA and
Norway Seafoods Group AS
• Significantly strengthening Lerøy`s position in the white fish segment.
Creating values through utilizing existing distribution channels and
establishing the leading fresh/refreshed seafood supplier with a complete
palette of seafood products
• Completed private placement of 5 million new shares at NOK 415.00 per
share as part of financing the acquisition
Financials Q2 2016
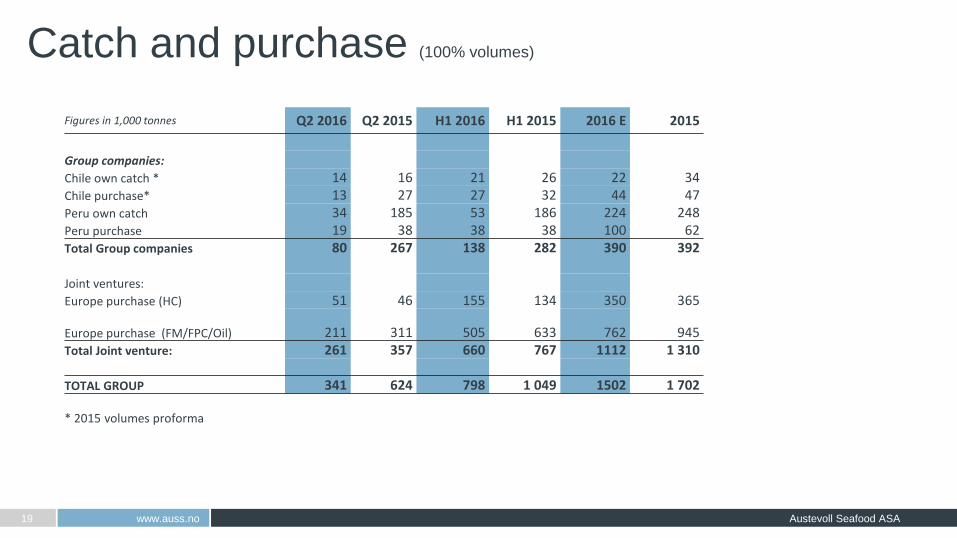
Catch and purchase (100% volumes)
www.auss.no Austevoll Seafood ASA 19
Figures in 1,000 tonnes Q2 2016 Q2 2015 H1 2016 H1 2015 2016 E 2015
Group companies: Chile own catch * 14 16 21 26 22 34 Chile purchase* 13 27 27 32 44 47 Peru own catch 34 185 53 186 224 248 Peru purchase 19 38 38 38 100 62 Total Group companies 80 267 138 282 390 392
Joint ventures: Europe purchase (HC) 51 46 155 134 350 365
Europe purchase (FM/FPC/Oil) 211 311 505 633 762 945 Total Joint venture: 261 357 660 767 1112 1 310
TOTAL GROUP 341 624 798 1 049 1502 1 702
* 2015 volumes proforma

Key financial figures
www.auss.no Austevoll Seafood ASA 20
Q2 2016 Q2 2015
Biomass adj. group company -150 187 225 156
Biomass adj. group associated companies
-1 018 -7 488
(NOK 1,000) Q2 2016 Q2 2015 Δ% Q2 2016 ** Q2 2015 ** Δ%
Revenue 4 558 229 4 107 801 11,0 % 5 091 140 4 754 514 7,1 %
EBITDA 984 919 777 727 26,6 % 1 045 042 857 180 21,9 %
Depreciation/Impairment 195 325 172 611 215 540 197 166
EBIT* 789 594 605 116 30,5 % 829 502 660 014 25,7 %
Income from associates* 70 111 53 212
Net finance -49 408 -72 194
Pre-tax* 810 297 586 134 38,2 %
Net profit 504 159 231 039
EPS (NOK) 1,09 0,91
EPS (NOK)* 1,46 1,44
* Before biomass adjustment
** AUSS incl. proportional 50% of Pelagia AS
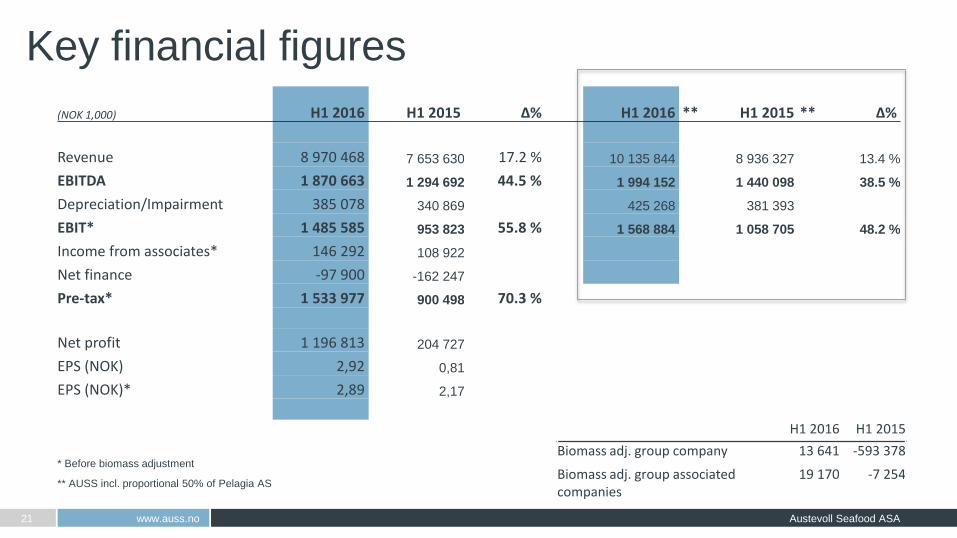
Key financial figures
www.auss.no Austevoll Seafood ASA 21
(NOK 1,000) H1 2016 H1 2015 Δ% H1 2016 ** H1 2015 ** Δ%
Revenue 8 970 468 7 653 630 17.2 % 10 135 844 8 936 327 13.4 %
EBITDA 1 870 663 1 294 692 44.5 % 1 994 152 1 440 098 38.5 %
Depreciation/Impairment 385 078 340 869 425 268 381 393
EBIT* 1 485 585 953 823 55.8 % 1 568 884 1 058 705 48.2 %
Income from associates* 146 292 108 922
Net finance -97 900 -162 247
Pre-tax* 1 533 977 900 498 70.3 %
Net profit 1 196 813 204 727
EPS (NOK) 2,92 0,81
EPS (NOK)* 2,89 2,17
H1 2016 H1 2015
Biomass adj. group company 13 641 -593 378
Biomass adj. group associated companies
19 170 -7 254 * Before biomass adjustment
** AUSS incl. proportional 50% of Pelagia AS
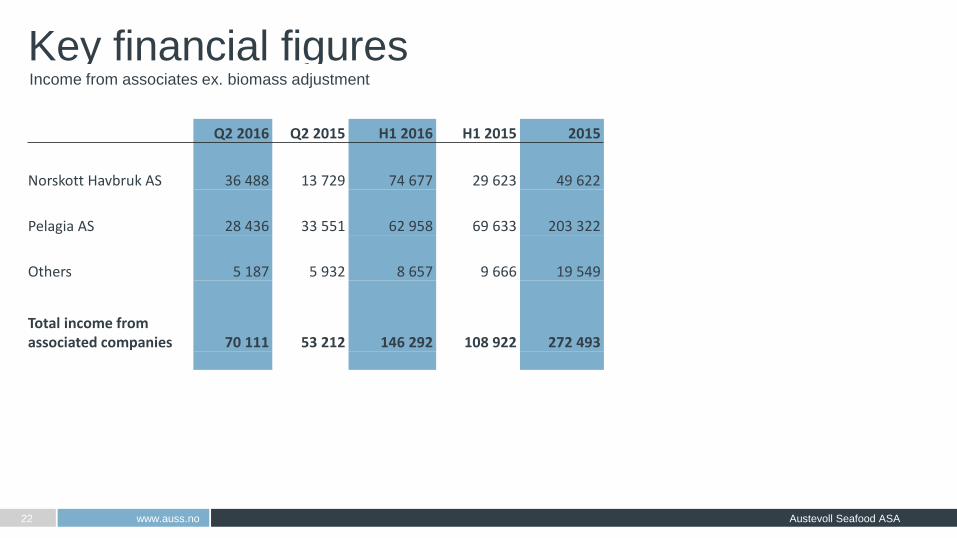
Key financial figures
www.auss.no Austevoll Seafood ASA 22
Income from associates ex. biomass adjustment
Q2 2016 Q2 2015 H1 2016 H1 2015 2015
Norskott Havbruk AS 36 488 13 729 74 677 29 623 49 622
Pelagia AS 28 436 33 551 62 958 69 633 203 322
Others 5 187 5 932 8 657 9 666 19 549
Total income from associated companies 70 111 53 212 146 292 108 922 272 493
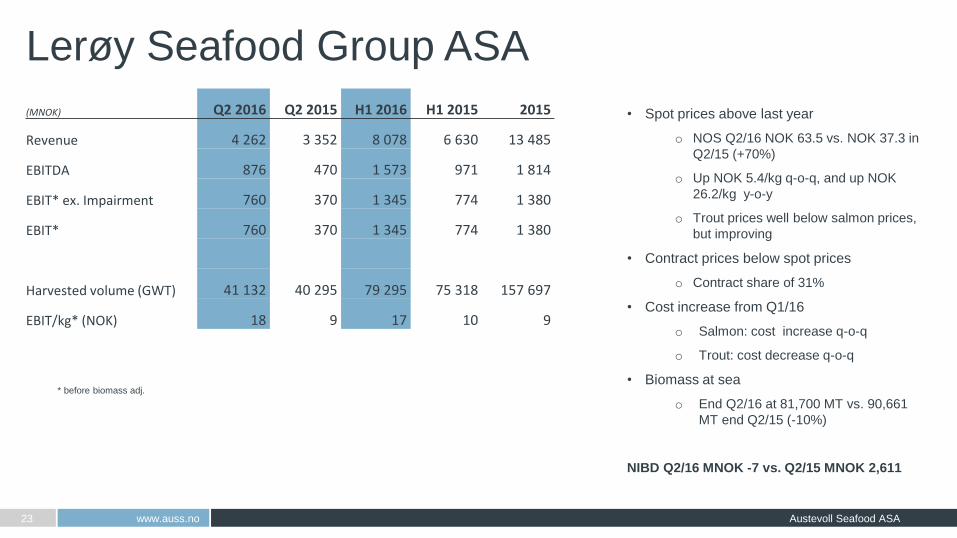
(MNOK) Q2 2016 Q2 2015 H1 2016 H1 2015 2015
Revenue 4 262 3 352 8 078 6 630 13 485
EBITDA 876 470 1 573 971 1 814
EBIT* ex. Impairment 760 370 1 345 774 1 380
EBIT* 760 370 1 345 774 1 380
Harvested volume (GWT) 41 132 40 295 79 295 75 318 157 697
EBIT/kg* (NOK) 18 9 17 10 9
Lerøy Seafood Group ASA
www.auss.no Austevoll Seafood ASA 23
• Spot prices above last year
o NOS Q2/16 NOK 63.5 vs. NOK 37.3 in
Q2/15 (+70%)
o Up NOK 5.4/kg q-o-q, and up NOK
26.2/kg y-o-y
o Trout prices well below salmon prices,
but improving
• Contract prices below spot prices
o Contract share of 31%
• Cost increase from Q1/16
o Salmon: cost increase q-o-q
o Trout: cost decrease q-o-q
• Biomass at sea
o End Q2/16 at 81,700 MT vs. 90,661
MT end Q2/15 (-10%)
NIBD Q2/16 MNOK -7 vs. Q2/15 MNOK 2,611
* before biomass adj.
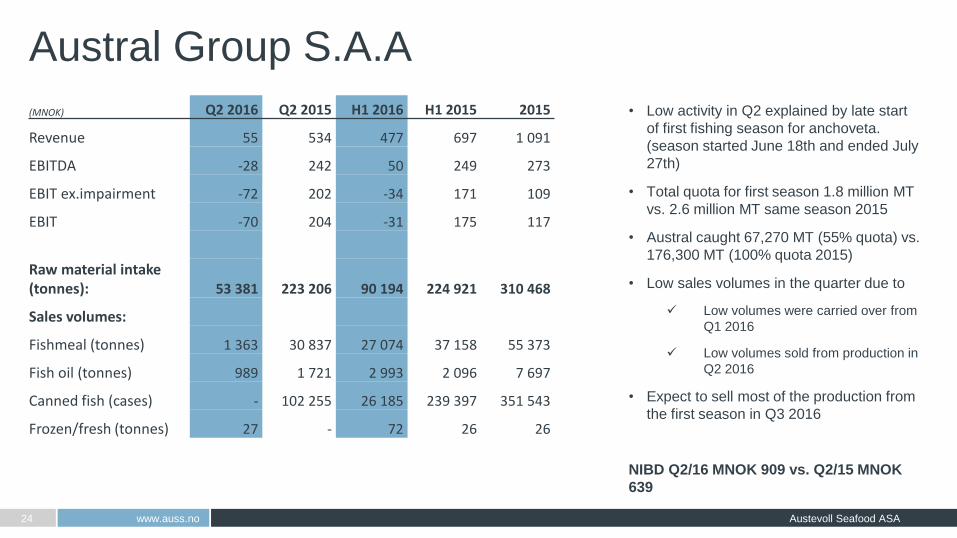
Austral Group S.A.A
www.auss.no Austevoll Seafood ASA 24
• Low activity in Q2 explained by late start
of first fishing season for anchoveta.
(season started June 18th and ended July
27th)
• Total quota for first season 1.8 million MT
vs. 2.6 million MT same season 2015
• Austral caught 67,270 MT (55% quota) vs.
176,300 MT (100% quota 2015)
• Low sales volumes in the quarter due to
Low volumes were carried over from
Q1 2016
Low volumes sold from production in
Q2 2016
• Expect to sell most of the production from
the first season in Q3 2016
NIBD Q2/16 MNOK 909 vs. Q2/15 MNOK
639
(MNOK) Q2 2016 Q2 2015 H1 2016 H1 2015 2015
Revenue 55 534 477 697 1 091
EBITDA -28 242 50 249 273
EBIT ex.impairment -72 202 -34 171 109
EBIT -70 204 -31 175 117
Raw material intake (tonnes): 53 381 223 206 90 194 224 921 310 468
Sales volumes:
Fishmeal (tonnes) 1 363 30 837 27 074 37 158 55 373
Fish oil (tonnes) 989 1 721 2 993 2 096 7 697
Canned fish (cases) - 102 255 26 185 239 397 351 543
Frozen/fresh (tonnes) 27 - 72 26 26
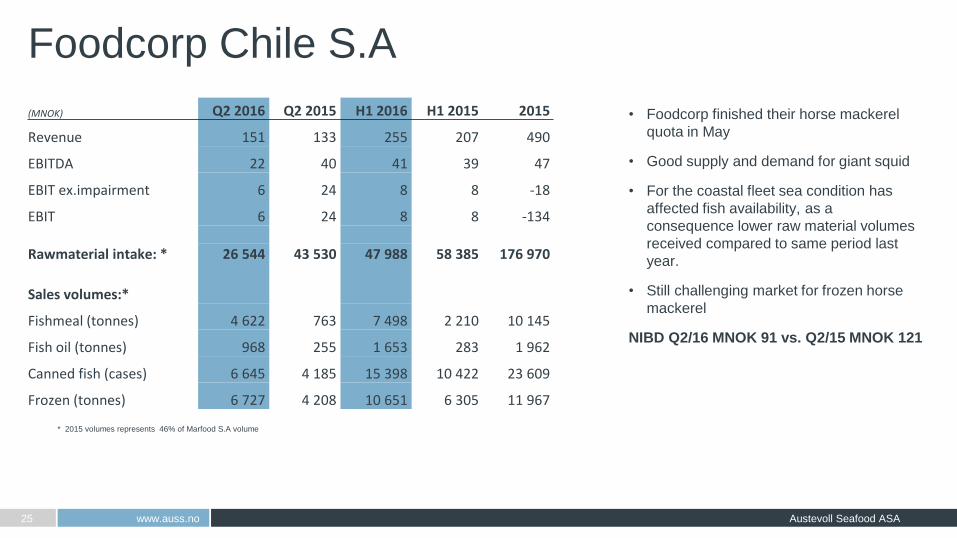
Foodcorp Chile S.A
www.auss.no Austevoll Seafood ASA 25
• Foodcorp finished their horse mackerel
quota in May
• Good supply and demand for giant squid
• For the coastal fleet sea condition has
affected fish availability, as a
consequence lower raw material volumes
received compared to same period last
year.
• Still challenging market for frozen horse
mackerel
NIBD Q2/16 MNOK 91 vs. Q2/15 MNOK 121
* 2015 volumes represents 46% of Marfood S.A volume
(MNOK) Q2 2016 Q2 2015 H1 2016 H1 2015 2015
Revenue 151 133 255 207 490
EBITDA 22 40 41 39 47
EBIT ex.impairment 6 24 8 8 -18
EBIT 6 24 8 8 -134
Rawmaterial intake: * 26 544 43 530 47 988 58 385 176 970
Sales volumes:*
Fishmeal (tonnes) 4 622 763 7 498 2 210 10 145
Fish oil (tonnes) 968 255 1 653 283 1 962
Canned fish (cases) 6 645 4 185 15 398 10 422 23 609
Frozen (tonnes) 6 727 4 208 10 651 6 305 11 967
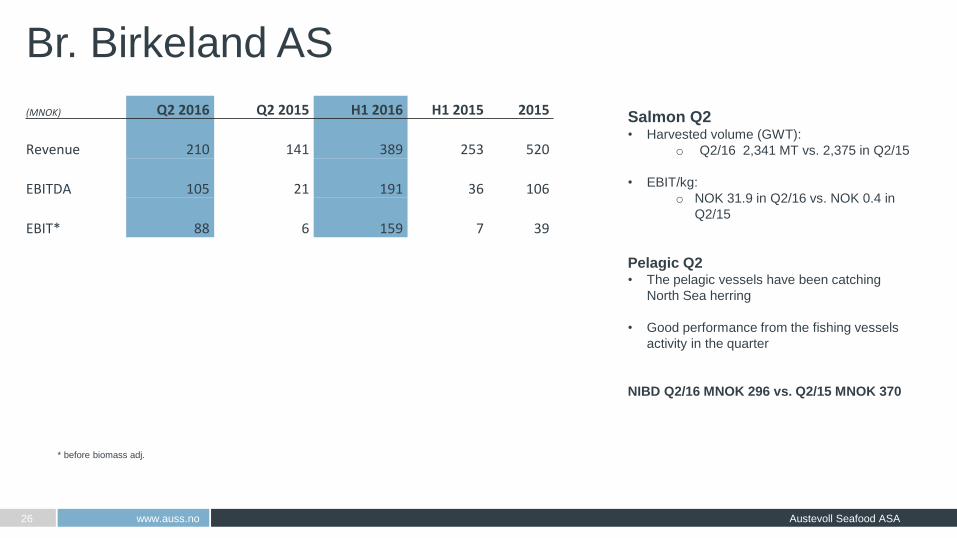
Br. Birkeland AS
www.auss.no Austevoll Seafood ASA 26
Salmon Q2 • Harvested volume (GWT):
o Q2/16 2,341 MT vs. 2,375 in Q2/15
• EBIT/kg:
o NOK 31.9 in Q2/16 vs. NOK 0.4 in
Q2/15
Pelagic Q2 • The pelagic vessels have been catching
North Sea herring
• Good performance from the fishing vessels
activity in the quarter
NIBD Q2/16 MNOK 296 vs. Q2/15 MNOK 370
* before biomass adj.
(MNOK) Q2 2016 Q2 2015 H1 2016 H1 2015 2015
Revenue 210 141 389 253 520
EBITDA 105 21 191 36 106
EBIT* 88 6 159 7 39
www.auss.no Austevoll Seafood ASA 27
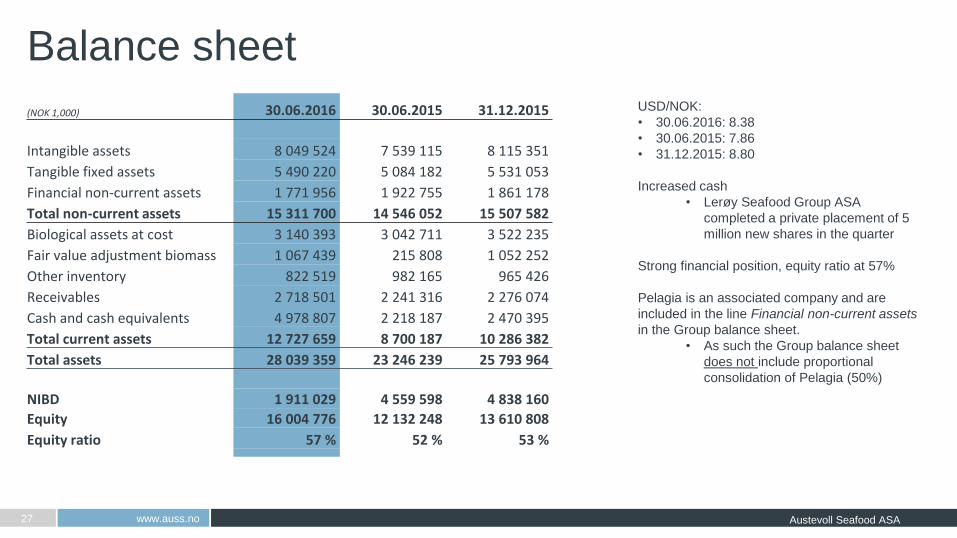
Balance sheet
USD/NOK:
• 30.06.2016: 8.38
• 30.06.2015: 7.86
• 31.12.2015: 8.80
Increased cash
• Lerøy Seafood Group ASA
completed a private placement of 5
million new shares in the quarter
Strong financial position, equity ratio at 57%
Pelagia is an associated company and are
included in the line Financial non-current assets
in the Group balance sheet.
• As such the Group balance sheet
does not include proportional
consolidation of Pelagia (50%)
(NOK 1,000) 30.06.2016 30.06.2015 31.12.2015
Intangible assets 8 049 524 7 539 115 8 115 351
Tangible fixed assets 5 490 220 5 084 182 5 531 053
Financial non-current assets 1 771 956 1 922 755 1 861 178
Total non-current assets 15 311 700 14 546 052 15 507 582
Biological assets at cost 3 140 393 3 042 711 3 522 235
Fair value adjustment biomass 1 067 439 215 808 1 052 252
Other inventory 822 519 982 165 965 426
Receivables 2 718 501 2 241 316 2 276 074
Cash and cash equivalents 4 978 807 2 218 187 2 470 395
Total current assets 12 727 659 8 700 187 10 286 382
Total assets 28 039 359 23 246 239 25 793 964
NIBD 1 911 029 4 559 598 4 838 160
Equity 16 004 776 12 132 248 13 610 808
Equity ratio 57 % 52 % 53 %
Cash flow
www.auss.no Austevoll Seafood ASA 28
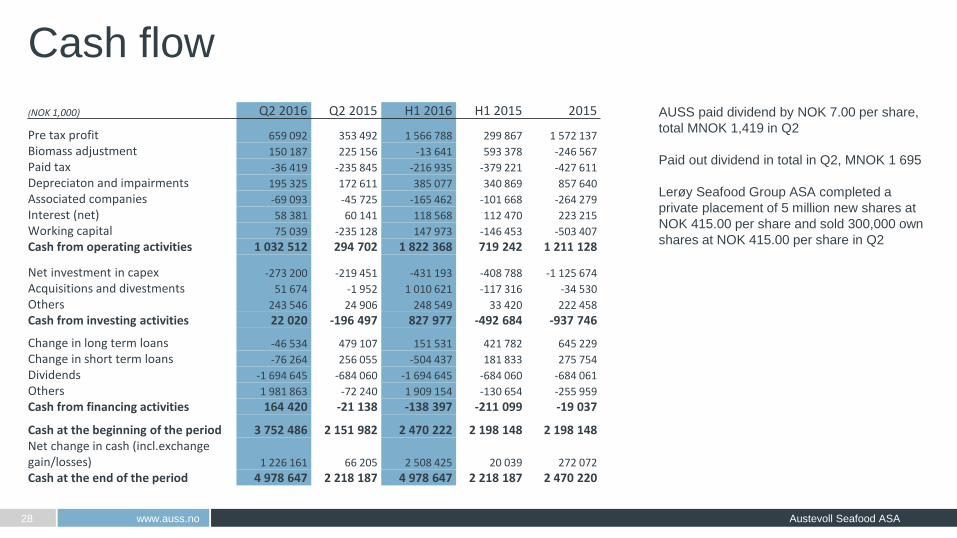
AUSS paid dividend by NOK 7.00 per share,
total MNOK 1,419 in Q2
Paid out dividend in total in Q2, MNOK 1 695
Lerøy Seafood Group ASA completed a
private placement of 5 million new shares at
NOK 415.00 per share and sold 300,000 own
shares at NOK 415.00 per share in Q2
(NOK 1,000) Q2 2016 Q2 2015 H1 2016 H1 2015 2015
Pre tax profit 659 092 353 492 1 566 788 299 867 1 572 137
Biomass adjustment 150 187 225 156 -13 641 593 378 -246 567
Paid tax -36 419 -235 845 -216 935 -379 221 -427 611
Depreciaton and impairments 195 325 172 611 385 077 340 869 857 640
Associated companies -69 093 -45 725 -165 462 -101 668 -264 279
Interest (net) 58 381 60 141 118 568 112 470 223 215
Working capital 75 039 -235 128 147 973 -146 453 -503 407
Cash from operating activities 1 032 512 294 702 1 822 368 719 242 1 211 128
Net investment in capex -273 200 -219 451 -431 193 -408 788 -1 125 674
Acquisitions and divestments 51 674 -1 952 1 010 621 -117 316 -34 530
Others 243 546 24 906 248 549 33 420 222 458
Cash from investing activities 22 020 -196 497 827 977 -492 684 -937 746
Change in long term loans -46 534 479 107 151 531 421 782 645 229
Change in short term loans -76 264 256 055 -504 437 181 833 275 754
Dividends -1 694 645 -684 060 -1 694 645 -684 060 -684 061
Others 1 981 863 -72 240 1 909 154 -130 654 -255 959
Cash from financing activities 164 420 -21 138 -138 397 -211 099 -19 037
Cash at the beginning of the period 3 752 486 2 151 982 2 470 222 2 198 148 2 198 148 Net change in cash (incl.exchange gain/losses) 1 226 161 66 205 2 508 425 20 039 272 072
Cash at the end of the period 4 978 647 2 218 187 4 978 647 2 218 187 2 470 220
Outlook
Fishmeal
www.auss.no Austevoll Seafood ASA 30
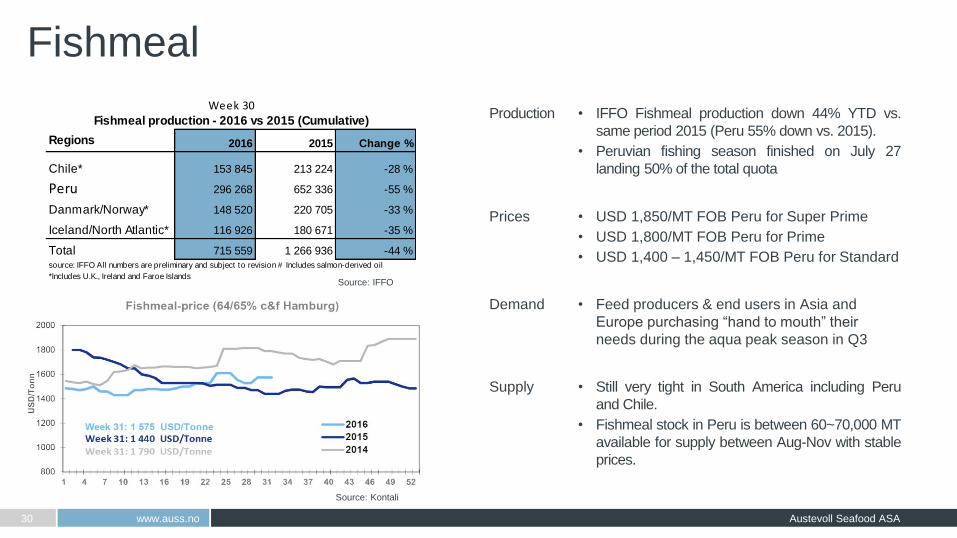
Source: IFFO
2016 2015 Change %
Chile* 153 845 213 224 -28 %
Peru 296 268 652 336 -55 %
Danmark/Norway* 148 520 220 705 -33 %
Iceland/North Atlantic* 116 926 180 671 -35 %
Total 715 559 1 266 936 -44 %
Fishmeal production - 2016 vs 2015 (Cumulative)
Regions
source: IFFO All numbers are preliminary and subject to revision # Includes salmon-derived oil
*Includes U.K., Ireland and Faroe Islands
Week 30Production
• IFFO Fishmeal production down 44% YTD vs.
same period 2015 (Peru 55% down vs. 2015).
• Peruvian fishing season finished on July 27
landing 50% of the total quota
Prices
• USD 1,850/MT FOB Peru for Super Prime
• USD 1,800/MT FOB Peru for Prime
• USD 1,400 – 1,450/MT FOB Peru for Standard
Demand • Feed producers & end users in Asia and
Europe purchasing “hand to mouth” their
needs during the aqua peak season in Q3
Supply • Still very tight in South America including Peru
and Chile.
• Fishmeal stock in Peru is between 60~70,000 MT
available for supply between Aug-Nov with stable
prices.
Source: Kontali
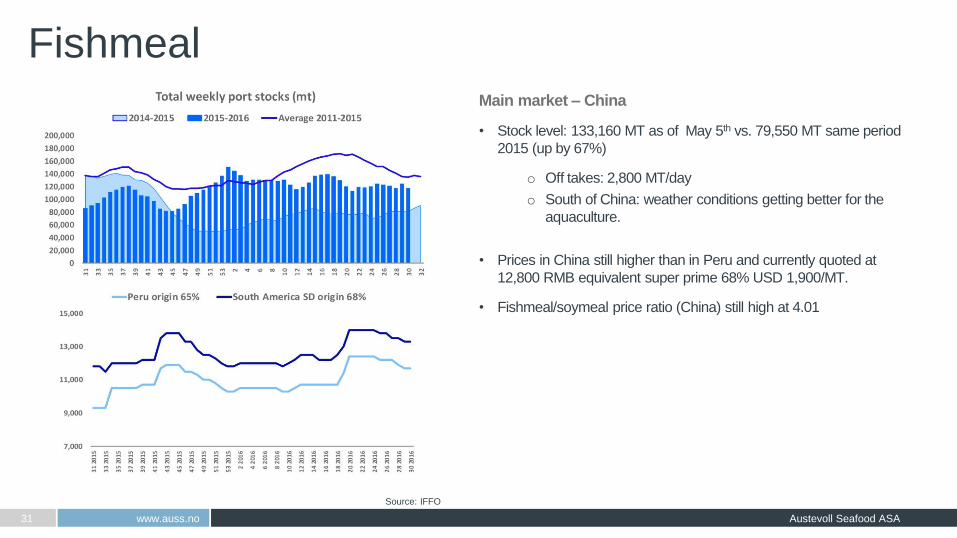
Fishmeal Main market – China
• Stock level: 133,160 MT as of May 5th vs. 79,550 MT same period
2015 (up by 67%)
o Off takes: 2,800 MT/day
o South of China: weather conditions getting better for the
aquaculture.
• Prices in China still higher than in Peru and currently quoted at
12,800 RMB equivalent super prime 68% USD 1,900/MT.
• Fishmeal/soymeal price ratio (China) still high at 4.01
www.auss.no Austevoll Seafood ASA 31
Source: IFFO
Fish oil
www.auss.no Austevoll Seafood ASA 32
Source: IFFO
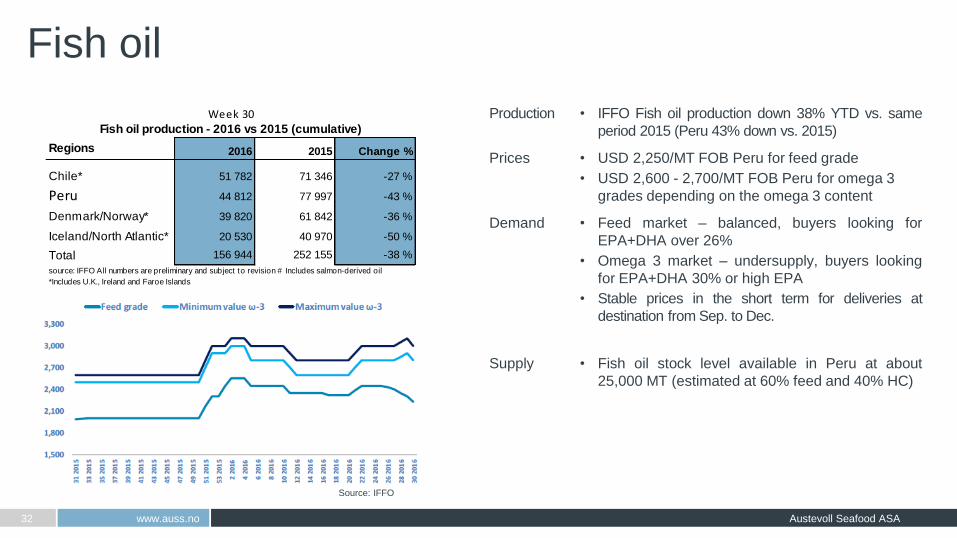
2016 2015 Change %
Chile* 51 782 71 346 -27 %
Peru 44 812 77 997 -43 %
Denmark/Norway* 39 820 61 842 -36 %
Iceland/North Atlantic* 20 530 40 970 -50 %
Total 156 944 252 155 -38 %
Fish oil production - 2016 vs 2015 (cumulative)
Regions
source: IFFO All numbers are preliminary and subject to revision # Includes salmon-derived oil
*Includes U.K., Ireland and Faroe Islands
Week 30 Production
• IFFO Fish oil production down 38% YTD vs. same
period 2015 (Peru 43% down vs. 2015)
Prices
• USD 2,250/MT FOB Peru for feed grade
• USD 2,600 - 2,700/MT FOB Peru for omega 3
grades depending on the omega 3 content
Demand • Feed market – balanced, buyers looking for
EPA+DHA over 26%
• Omega 3 market – undersupply, buyers looking
for EPA+DHA 30% or high EPA
• Stable prices in the short term for deliveries at
destination from Sep. to Dec.
Supply • Fish oil stock level available in Peru at about
25,000 MT (estimated at 60% feed and 40% HC)
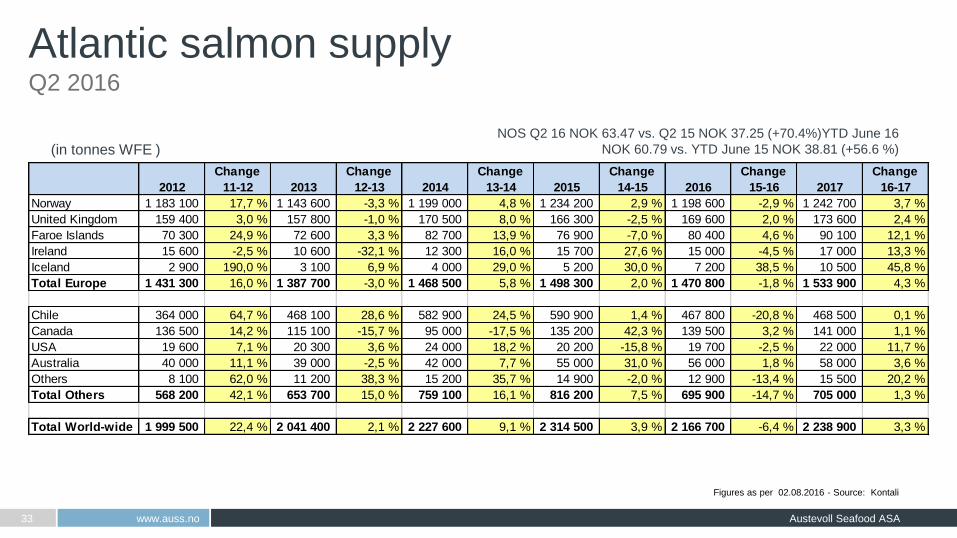
(in tonnes WFE )
Atlantic salmon supply Q2 2016
www.auss.no Austevoll Seafood ASA 33
Figures as per 02.08.2016 - Source: Kontali
NOS Q2 16 NOK 63.47 vs. Q2 15 NOK 37.25 (+70.4%)YTD June 16
NOK 60.79 vs. YTD June 15 NOK 38.81 (+56.6 %)
Change Change Change Change Change Change
2012 11-12 2013 12-13 2014 13-14 2015 14-15 2016 15-16 2017 16-17
Norway 1 183 100 17,7 % 1 143 600 -3,3 % 1 199 000 4,8 % 1 234 200 2,9 % 1 198 600 -2,9 % 1 242 700 3,7 %
United Kingdom 159 400 3,0 % 157 800 -1,0 % 170 500 8,0 % 166 300 -2,5 % 169 600 2,0 % 173 600 2,4 %
Faroe Islands 70 300 24,9 % 72 600 3,3 % 82 700 13,9 % 76 900 -7,0 % 80 400 4,6 % 90 100 12,1 %
Ireland 15 600 -2,5 % 10 600 -32,1 % 12 300 16,0 % 15 700 27,6 % 15 000 -4,5 % 17 000 13,3 %
Iceland 2 900 190,0 % 3 100 6,9 % 4 000 29,0 % 5 200 30,0 % 7 200 38,5 % 10 500 45,8 %
Total Europe 1 431 300 16,0 % 1 387 700 -3,0 % 1 468 500 5,8 % 1 498 300 2,0 % 1 470 800 -1,8 % 1 533 900 4,3 %
Chile 364 000 64,7 % 468 100 28,6 % 582 900 24,5 % 590 900 1,4 % 467 800 -20,8 % 468 500 0,1 %
Canada 136 500 14,2 % 115 100 -15,7 % 95 000 -17,5 % 135 200 42,3 % 139 500 3,2 % 141 000 1,1 %
USA 19 600 7,1 % 20 300 3,6 % 24 000 18,2 % 20 200 -15,8 % 19 700 -2,5 % 22 000 11,7 %
Australia 40 000 11,1 % 39 000 -2,5 % 42 000 7,7 % 55 000 31,0 % 56 000 1,8 % 58 000 3,6 %
Others 8 100 62,0 % 11 200 38,3 % 15 200 35,7 % 14 900 -2,0 % 12 900 -13,4 % 15 500 20,2 %
Total Others 568 200 42,1 % 653 700 15,0 % 759 100 16,1 % 816 200 7,5 % 695 900 -14,7 % 705 000 1,3 %
Total World-wide 1 999 500 22,4 % 2 041 400 2,1 % 2 227 600 9,1 % 2 314 500 3,9 % 2 166 700 -6,4 % 2 238 900 3,3 %
14 %
6 %
-3 %
-33 %
-4 %
-40 %
-30 %
-20 %
-10 %
0 %
10 %
20 %
-
100 000
200 000
300 000
400 000
500 000
600 000
700 000
Japan USA EU Russia Other
Markets
2014 2015 2016 Growth %
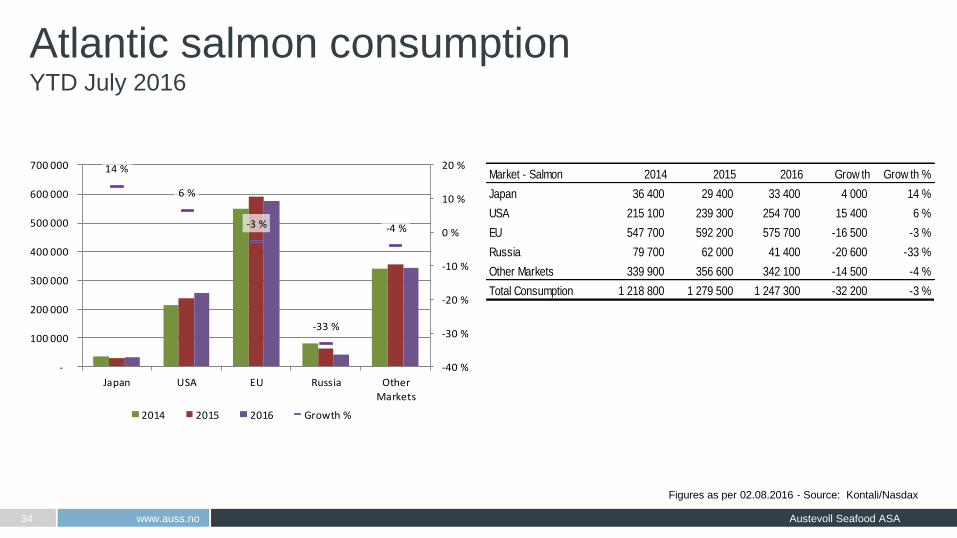
Atlantic salmon consumption YTD July 2016
www.auss.no Austevoll Seafood ASA 34
Figures as per 02.08.2016 - Source: Kontali/Nasdax
Market - Salmon 2014 2015 2016 Grow th Grow th %
Japan 36 400 29 400 33 400 4 000 14 %
USA 215 100 239 300 254 700 15 400 6 %
EU 547 700 592 200 575 700 -16 500 -3 %
Russia 79 700 62 000 41 400 -20 600 -33 %
Other Markets 339 900 356 600 342 100 -14 500 -4 %
Total Consumption 1 218 800 1 279 500 1 247 300 -32 200 -3 %
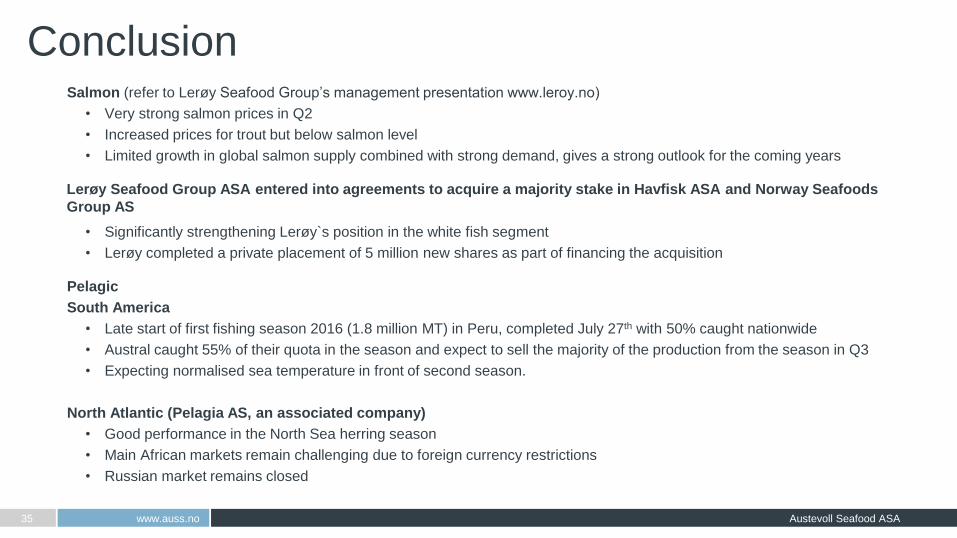
Conclusion Salmon (refer to Lerøy Seafood Group’s management presentation www.leroy.no)
• Very strong salmon prices in Q2
• Increased prices for trout but below salmon level
• Limited growth in global salmon supply combined with strong demand, gives a strong outlook for the coming years
Lerøy Seafood Group ASA entered into agreements to acquire a majority stake in Havfisk ASA and Norway Seafoods
Group AS
• Significantly strengthening Lerøy`s position in the white fish segment
• Lerøy completed a private placement of 5 million new shares as part of financing the acquisition
Pelagic
South America
• Late start of first fishing season 2016 (1.8 million MT) in Peru, completed July 27th with 50% caught nationwide
• Austral caught 55% of their quota in the season and expect to sell the majority of the production from the season in Q3
• Expecting normalised sea temperature in front of second season.
North Atlantic (Pelagia AS, an associated company)
• Good performance in the North Sea herring season
• Main African markets remain challenging due to foreign currency restrictions
• Russian market remains closed
www.auss.no Austevoll Seafood ASA 35
Thank you
Disclaimer • This Presentation has been produced by Austevoll Seafood ASA (the
“Company” or “Austevoll”) solely for use at the presentation to the market held in
connection with the announcement of second quarter results for 2016.
• This document contains certain forward-looking statements relating to the
business, financial performance and results of the Company and/or the industry
in which it operates. Forward-looking statements concern future circumstances
and results and other statements that are not historical facts, sometimes
identified by the words “believes”, expects”, “predicts”, “intends”, “projects”,
“plans”, “estimates”, “aims”, “foresees”, “anticipates”, “targets”, and similar
expressions. The forward-looking statements contained in this Presentation,
including assumptions, opinions and views of the Company or cited from third
party sources are solely opinions and forecasts which are subject to risks,
uncertainties and other factors that may cause actual events to differ materially
from any anticipated development. Neither The Company or any of their
respective group of companies or any such person’s officers or employees
provides any assurance that the assumptions underlying such forward-looking
statements are free from errors nor does any of them accept any responsibility
for the future accuracy of the opinions expressed in this Presentation or the
actual occurrence of the forecasted developments. The Company assumes no
obligation, except as required by law, to update any forward-looking statements
or to conform these forward-looking statements to our actual results.
• An investment in the company involves risk, and several factors could cause the
actual results, performance or achievements of the company to be materially
different from any future results, performance or achievements that may be
expressed or implied by statements and information in this presentation,
including, among others, risks or uncertainties associated with the company’s
business, segments, development, growth management, financing, market
acceptance and relations with customers, and, more generally, general
economic and business conditions, changes in domestic and foreign laws and
regulations, taxes, changes in competition and pricing environments, fluctuations
in currency exchange rates and interest rates and other factors.
• Should one or more of these risks or uncertainties materialise, or should
underlying assumptions prove incorrect, actual results may vary materially from
those described in this presentation. the company does not intend, and does not
assume any obligation, to update or correct the information included in this
presentation.
• No representation or warranty (express or implied) is made as to, and no
reliance should be placed on, any information, including projections, estimates,
targets and opinions, contained herein, and no liability whatsoever is accepted
as to any errors, omissions or misstatements contained herein, and, accordingly,
none of the Company or any of their group companies or any such person’s
officers or employees accepts any liability whatsoever arising directly or indirectly
from the use of this document.
• By attending the quarterly presentation or upon reading the Presentation you
acknowledge that you will be solely responsible for your own assessment of the
market and the market position of the Company and that you will conduct your
own analysis and be solely responsible for forming your own view of the potential
future performance of the Company’s business.
• This Presentation is dated 18.08.2016. Neither the delivery of this Presentation
nor any further discussions of the Company with any of the recipients shall,
under any circumstances, create any implication that there has been no change
in the affairs of the Company since such date.
www.auss.no Austevoll Seafood ASA 37
Appendix
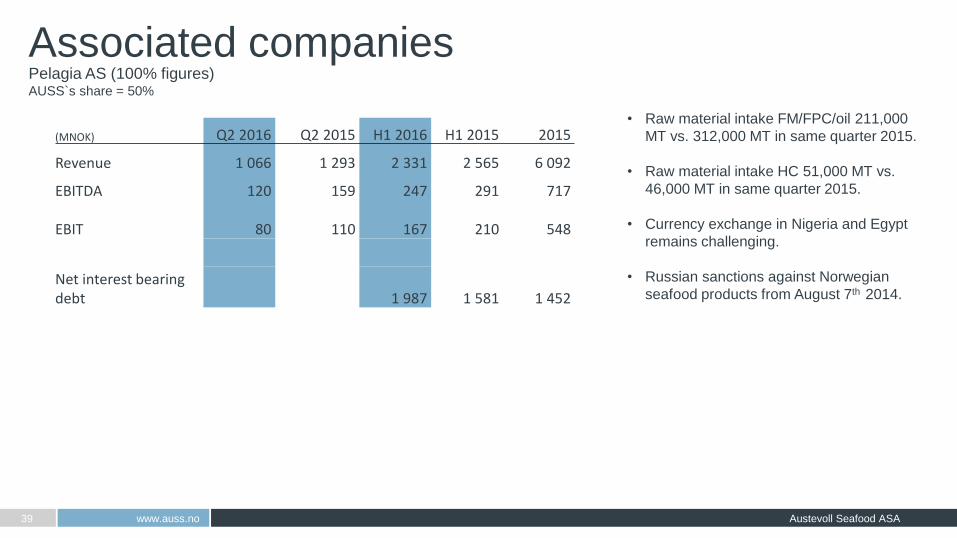
Associated companies
www.auss.no Austevoll Seafood ASA 39
• Raw material intake FM/FPC/oil 211,000
MT vs. 312,000 MT in same quarter 2015.
• Raw material intake HC 51,000 MT vs.
46,000 MT in same quarter 2015.
• Currency exchange in Nigeria and Egypt
remains challenging.
• Russian sanctions against Norwegian
seafood products from August 7th 2014.
Pelagia AS (100% figures) AUSS`s share = 50%
(MNOK) Q2 2016 Q2 2015 H1 2016 H1 2015 2015
Revenue 1 066 1 293 2 331 2 565 6 092
EBITDA 120 159 247 291 717
EBIT 80 110
167
210
548
Net interest bearing debt 1 987 1 581 1 452
Associated companies
www.auss.no Austevoll Seafood ASA 40
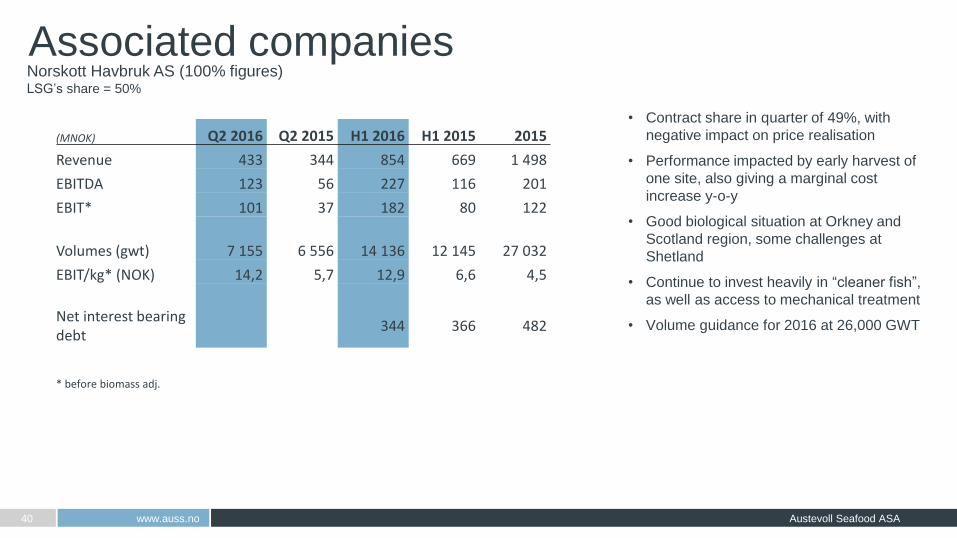
Norskott Havbruk AS (100% figures) LSG’s share = 50%
• Contract share in quarter of 49%, with
negative impact on price realisation
• Performance impacted by early harvest of
one site, also giving a marginal cost
increase y-o-y
• Good biological situation at Orkney and
Scotland region, some challenges at
Shetland
• Continue to invest heavily in “cleaner fish”,
as well as access to mechanical treatment
• Volume guidance for 2016 at 26,000 GWT
(MNOK) Q2 2016 Q2 2015 H1 2016 H1 2015 2015
Revenue 433 344 854 669 1 498
EBITDA 123 56 227 116 201
EBIT* 101 37 182 80 122
Volumes (gwt) 7 155 6 556 14 136 12 145 27 032
EBIT/kg* (NOK) 14,2 5,7 12,9 6,6 4,5
Net interest bearing debt
344 366 482
* before biomass adj.