Embed Size (px)
Citation preview
Certain of the comments and materials in this presentation may contain forward-looking statements, including statements within the meaning of thePrivate Securities Litigation Reform Act of 1995. These statements are based upon current expectations and assumptions regarding anticipateddevelopments and other factors affecting the Group. Actual results may differ materially from those included in these statements due to a variety offactors including, among others, those described in the Group’s filings with the Securities and Exchange Commission and in the transcript of thispresentation, which will be accessible via our website at www.unilever.com.
Q2 & H1 2004 Unilever Results
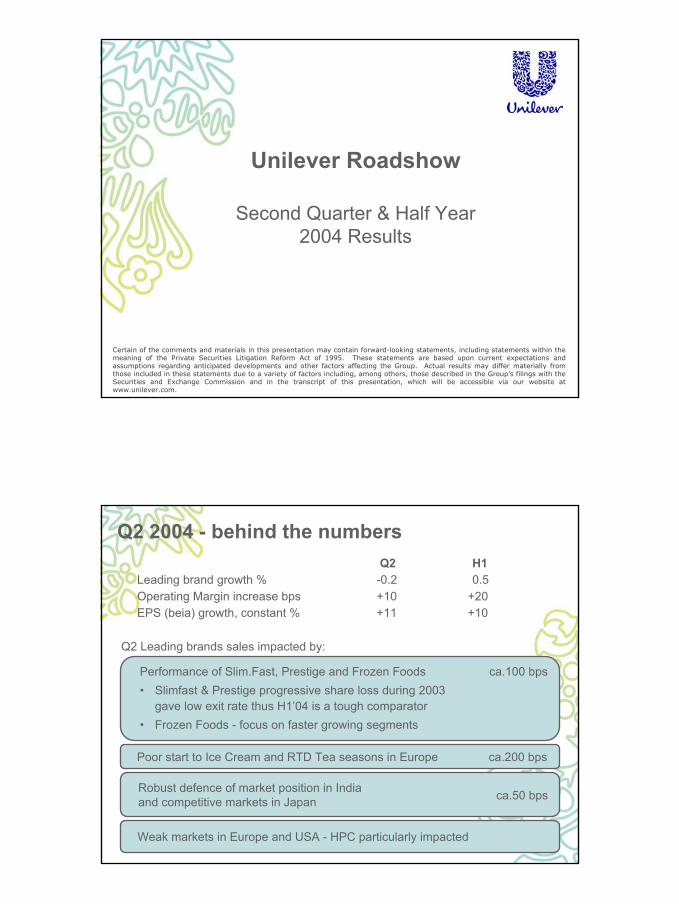
Unilever Roadshow
Second Quarter & Half Year2004 Results
Certain of the comments and materials in this presentation may contain forward-looking statements, including statements within themeaning of the Private Securities Litigation Reform Act of 1995. These statements are based upon current expectations andassumptions regarding anticipated developments and other factors affecting the Group. Actual results may differ materially fromthose included in these statements due to a variety of factors including, among others, those described in the Group’s filings with theSecurities and Exchange Commission and in the transcript of this presentation, which will be accessible via our website atwww.unilever.com.
Q2 Leading brands sales impacted by:
Q2 2004 - behind the numbers
Performance of Slim.Fast, Prestige and Frozen Foods ca.100 bps• Slimfast & Prestige progressive share loss during 2003
gave low exit rate thus H1’04 is a tough comparator• Frozen Foods - focus on faster growing segments
Weak markets in Europe and USA - HPC particularly impacted
Poor start to Ice Cream and RTD Tea seasons in Europe ca.200 bps
Robust defence of market position in Indiaand competitive markets in Japan ca.50 bps
Q2 H1Leading brand growth % -0.2 0.5Operating Margin increase bps +10 +20EPS (beia) growth, constant % +11 +10
Certain of the comments and materials in this presentation may contain forward-looking statements, including statements within the meaning of thePrivate Securities Litigation Reform Act of 1995. These statements are based upon current expectations and assumptions regarding anticipateddevelopments and other factors affecting the Group. Actual results may differ materially from those included in these statements due to a variety offactors including, among others, those described in the Group’s filings with the Securities and Exchange Commission and in the transcript of thispresentation, which will be accessible via our website at www.unilever.com.
Q2 & H1 2004 Unilever Results
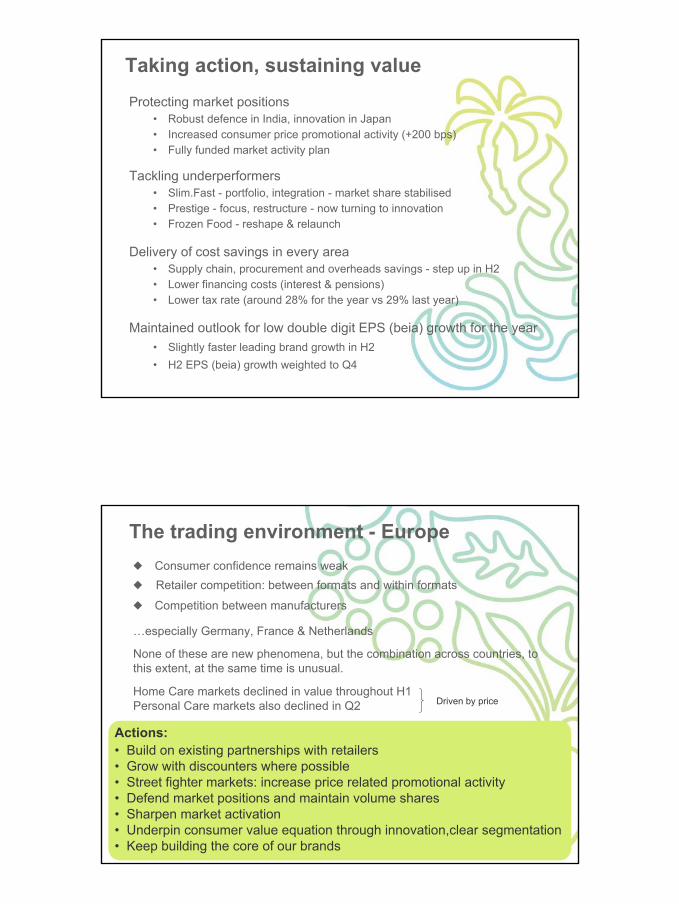
Taking action, sustaining valueProtecting market positions
• Robust defence in India, innovation in Japan• Increased consumer price promotional activity (+200 bps)• Fully funded market activity plan
Tackling underperformers• Slim.Fast - portfolio, integration - market share stabilised• Prestige - focus, restructure - now turning to innovation• Frozen Food - reshape & relaunch
Delivery of cost savings in every area• Supply chain, procurement and overheads savings - step up in H2• Lower financing costs (interest & pensions)• Lower tax rate (around 28% for the year vs 29% last year)
Maintained outlook for low double digit EPS (beia) growth for the year• Slightly faster leading brand growth in H2• H2 EPS (beia) growth weighted to Q4
The trading environment - Europe Consumer confidence remains weak Retailer competition: between formats and within formats
Competition between manufacturers
…especially Germany, France & Netherlands
None of these are new phenomena, but the combination across countries, tothis extent, at the same time is unusual.
Home Care markets declined in value throughout H1Personal Care markets also declined in Q2
Actions:• Build on existing partnerships with retailers• Grow with discounters where possible• Street fighter markets: increase price related promotional activity• Defend market positions and maintain volume shares• Sharpen market activation• Underpin consumer value equation through innovation,clear segmentation• Keep building the core of our brands
Driven by price
Certain of the comments and materials in this presentation may contain forward-looking statements, including statements within the meaning of thePrivate Securities Litigation Reform Act of 1995. These statements are based upon current expectations and assumptions regarding anticipateddevelopments and other factors affecting the Group. Actual results may differ materially from those included in these statements due to a variety offactors including, among others, those described in the Group’s filings with the Securities and Exchange Commission and in the transcript of thispresentation, which will be accessible via our website at www.unilever.com.
Q2 & H1 2004 Unilever Results
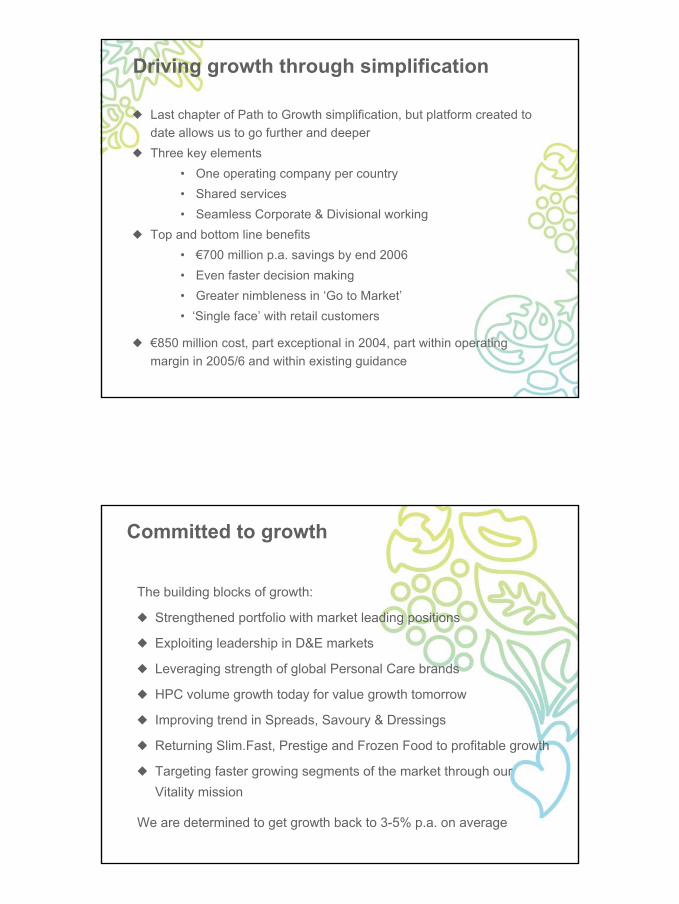
Driving growth through simplification
Last chapter of Path to Growth simplification, but platform created todate allows us to go further and deeperThree key elements
• One operating company per country• Shared services• Seamless Corporate & Divisional working
Top and bottom line benefits• €700 million p.a. savings by end 2006• Even faster decision making• Greater nimbleness in ‘Go to Market’• ‘Single face’ with retail customers
€850 million cost, part exceptional in 2004, part within operatingmargin in 2005/6 and within existing guidance
Committed to growth
The building blocks of growth:
Strengthened portfolio with market leading positions
Exploiting leadership in D&E markets
Leveraging strength of global Personal Care brands
HPC volume growth today for value growth tomorrow
Improving trend in Spreads, Savoury & Dressings
Returning Slim.Fast, Prestige and Frozen Food to profitable growth
Targeting faster growing segments of the market through ourVitality mission
We are determined to get growth back to 3-5% p.a. on average
Certain of the comments and materials in this presentation may contain forward-looking statements, including statements within the meaning of thePrivate Securities Litigation Reform Act of 1995. These statements are based upon current expectations and assumptions regarding anticipateddevelopments and other factors affecting the Group. Actual results may differ materially from those included in these statements due to a variety offactors including, among others, those described in the Group’s filings with the Securities and Exchange Commission and in the transcript of thispresentation, which will be accessible via our website at www.unilever.com.
Q2 & H1 2004 Unilever Results
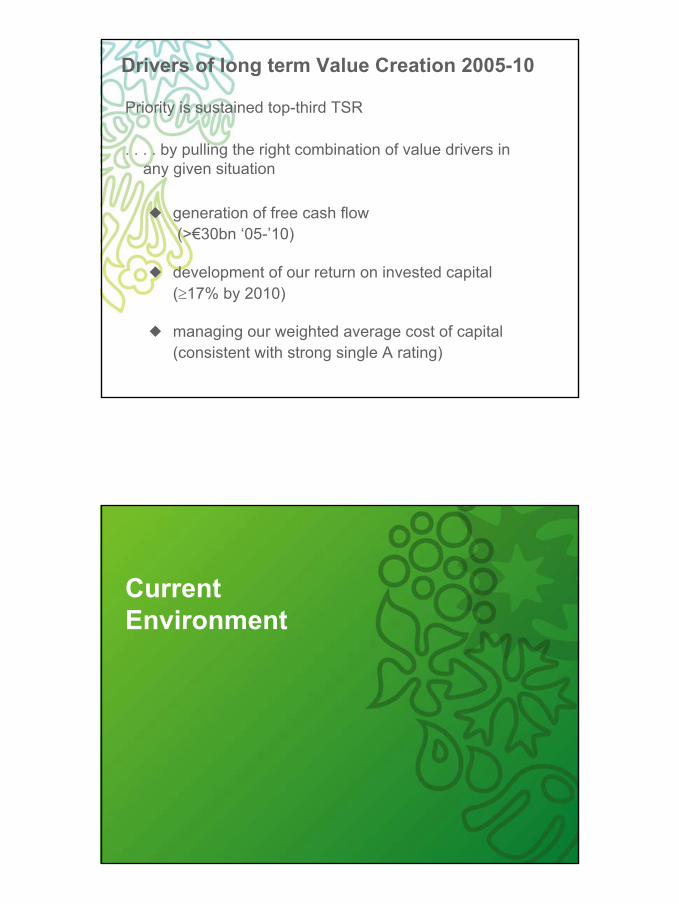
Drivers of long term Value Creation 2005-10
Priority is sustained top-third TSR
. . . . by pulling the right combination of value drivers inany given situation
generation of free cash flow (>€30bn ‘05-’10)
development of our return on invested capital (≥17% by 2010)
managing our weighted average cost of capital (consistent with strong single A rating)
CurrentEnvironment
Certain of the comments and materials in this presentation may contain forward-looking statements, including statements within the meaning of thePrivate Securities Litigation Reform Act of 1995. These statements are based upon current expectations and assumptions regarding anticipateddevelopments and other factors affecting the Group. Actual results may differ materially from those included in these statements due to a variety offactors including, among others, those described in the Group’s filings with the Securities and Exchange Commission and in the transcript of thispresentation, which will be accessible via our website at www.unilever.com.
Q2 & H1 2004 Unilever Results
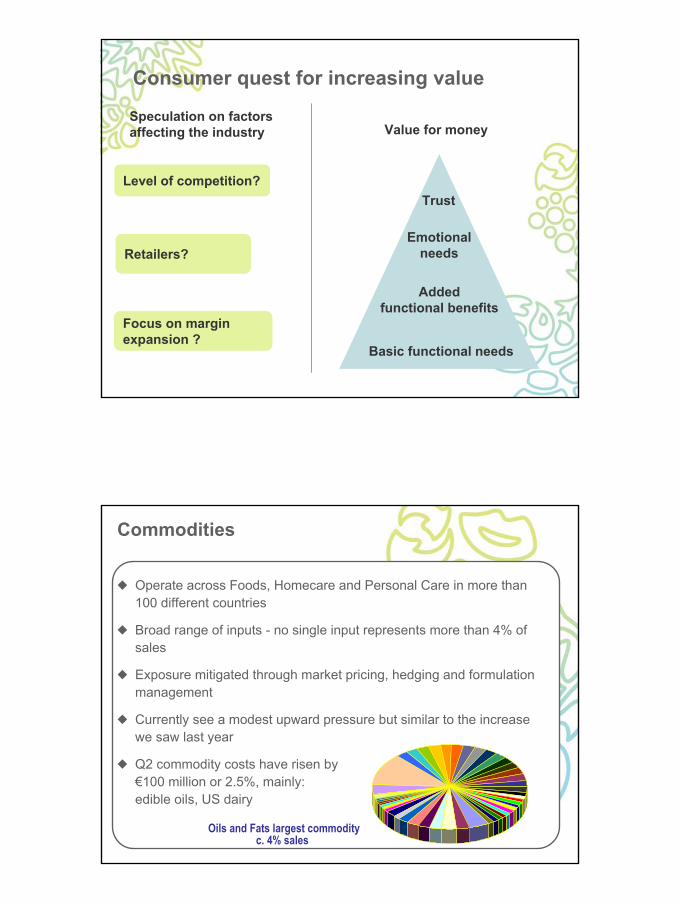
Consumer quest for increasing value
Level of competition?
Focus on marginexpansion ?
Retailers?
Speculation on factorsaffecting the industry Value for money
Trust
Emotionalneeds
Addedfunctional benefits
Basic functional needs
Commodities
Operate across Foods, Homecare and Personal Care in more than100 different countries
Broad range of inputs - no single input represents more than 4% ofsales
Exposure mitigated through market pricing, hedging and formulationmanagement
Currently see a modest upward pressure but similar to the increasewe saw last year
Q2 commodity costs have risen by€100 million or 2.5%, mainly:edible oils, US dairy
Oils and Fats largest commodity c. 4% sales
Certain of the comments and materials in this presentation may contain forward-looking statements, including statements within the meaning of thePrivate Securities Litigation Reform Act of 1995. These statements are based upon current expectations and assumptions regarding anticipateddevelopments and other factors affecting the Group. Actual results may differ materially from those included in these statements due to a variety offactors including, among others, those described in the Group’s filings with the Securities and Exchange Commission and in the transcript of thispresentation, which will be accessible via our website at www.unilever.com.
Q2 & H1 2004 Unilever Results
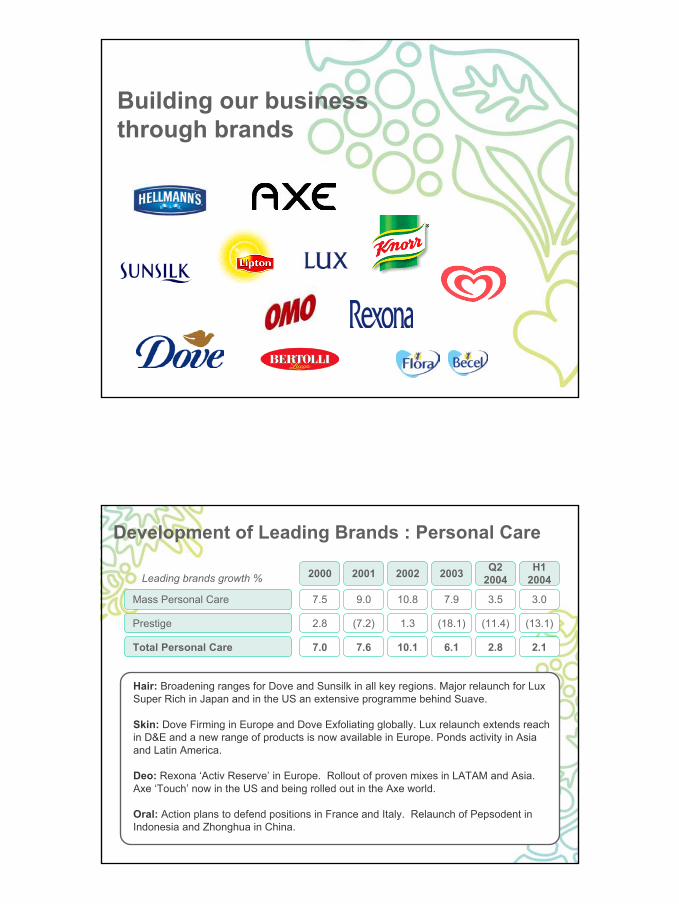
Building our businessthrough brands
Development of Leading Brands : Personal Care
Leading brands growth %
Mass Personal Care 9.0 7.910.8
Prestige (7.2) (18.1)1.32.8
7.5
2000 2001 2002 2003
Total Personal Care 7.6 6.110.17.0
3.0
(13.1)
H12004
2.1
Hair: Broadening ranges for Dove and Sunsilk in all key regions. Major relaunch for LuxSuper Rich in Japan and in the US an extensive programme behind Suave.
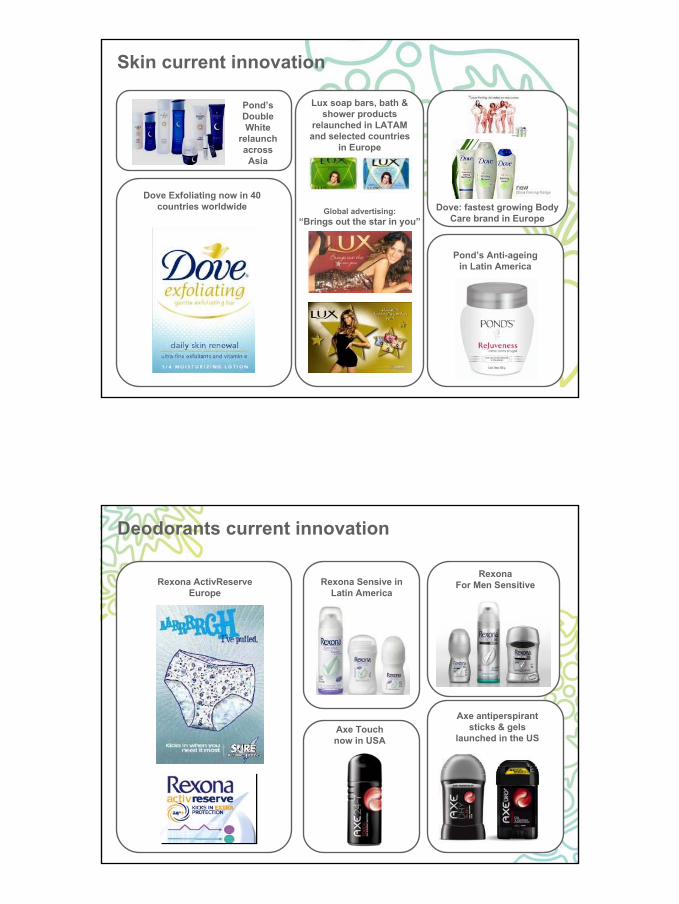
Skin: Dove Firming in Europe and Dove Exfoliating globally. Lux relaunch extends reachin D&E and a new range of products is now available in Europe. Ponds activity in Asiaand Latin America.
Deo: Rexona ‘Activ Reserve’ in Europe. Rollout of proven mixes in LATAM and Asia.Axe ‘Touch’ now in the US and being rolled out in the Axe world.
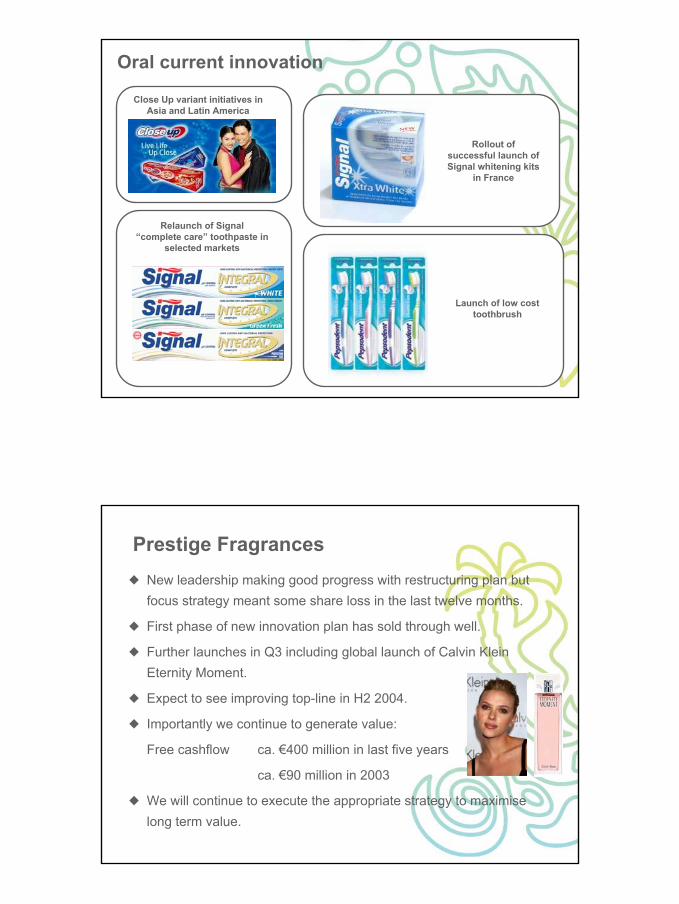
Oral: Action plans to defend positions in France and Italy. Relaunch of Pepsodent inIndonesia and Zhonghua in China.
3.5
(11.4)
Q22004
2.8
Certain of the comments and materials in this presentation may contain forward-looking statements, including statements within the meaning of thePrivate Securities Litigation Reform Act of 1995. These statements are based upon current expectations and assumptions regarding anticipateddevelopments and other factors affecting the Group. Actual results may differ materially from those included in these statements due to a variety offactors including, among others, those described in the Group’s filings with the Securities and Exchange Commission and in the transcript of thispresentation, which will be accessible via our website at www.unilever.com.
Q2 & H1 2004 Unilever Results
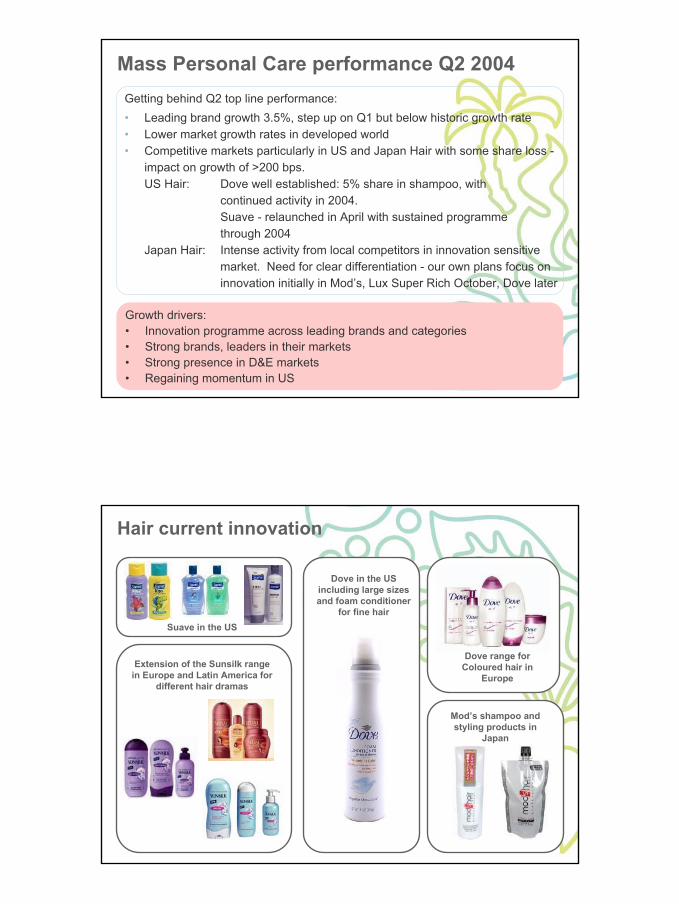
Mass Personal Care performance Q2 2004Getting behind Q2 top line performance:• Leading brand growth 3.5%, step up on Q1 but below historic growth rate• Lower market growth rates in developed world• Competitive markets particularly in US and Japan Hair with some share loss -
impact on growth of >200 bps.US Hair: Dove well established: 5% share in shampoo, with
continued activity in 2004.Suave - relaunched in April with sustained programme through 2004
Japan Hair: Intense activity from local competitors in innovation sensitive market. Need for clear differentiation - our own plans focus on innovation initially in Mod’s, Lux Super Rich October, Dove later
Growth drivers:• Innovation programme across leading brands and categories• Strong brands, leaders in their markets• Strong presence in D&E markets• Regaining momentum in US
Hair current innovation
Dove range forColoured hair in
Europe
Suave in the US
Dove in the USincluding large sizesand foam conditioner
for fine hair
Mod’s shampoo andstyling products in
Japan
Extension of the Sunsilk rangein Europe and Latin America for
different hair dramas
Certain of the comments and materials in this presentation may contain forward-looking statements, including statements within the meaning of thePrivate Securities Litigation Reform Act of 1995. These statements are based upon current expectations and assumptions regarding anticipateddevelopments and other factors affecting the Group. Actual results may differ materially from those included in these statements due to a variety offactors including, among others, those described in the Group’s filings with the Securities and Exchange Commission and in the transcript of thispresentation, which will be accessible via our website at www.unilever.com.
Q2 & H1 2004 Unilever Results
Skin current innovation
Dove: fastest growing BodyCare brand in Europe
Lux soap bars, bath &shower products
relaunched in LATAMand selected countries
in Europe
Pond’s Anti-ageingin Latin America
Dove Exfoliating now in 40countries worldwide
Pond’sDoubleWhite
relaunchacrossAsia
Global advertising:“Brings out the star in you”
Deodorants current innovation
Axe antiperspirantsticks & gels
launched in the US
RexonaFor Men SensitiveRexona Sensive in
Latin America
Axe Touchnow in USA
Rexona ActivReserveEurope
Certain of the comments and materials in this presentation may contain forward-looking statements, including statements within the meaning of thePrivate Securities Litigation Reform Act of 1995. These statements are based upon current expectations and assumptions regarding anticipateddevelopments and other factors affecting the Group. Actual results may differ materially from those included in these statements due to a variety offactors including, among others, those described in the Group’s filings with the Securities and Exchange Commission and in the transcript of thispresentation, which will be accessible via our website at www.unilever.com.
Q2 & H1 2004 Unilever Results
Oral current innovation
Rollout ofsuccessful launch ofSignal whitening kits
in France
Launch of low costtoothbrush
Relaunch of Signal“complete care” toothpaste in
selected markets
Close Up variant initiatives inAsia and Latin America
Prestige FragrancesNew leadership making good progress with restructuring plan butfocus strategy meant some share loss in the last twelve months.
First phase of new innovation plan has sold through well.
Further launches in Q3 including global launch of Calvin KleinEternity Moment.
Expect to see improving top-line in H2 2004.
Importantly we continue to generate value:
Free cashflow ca. €400 million in last five years
ca. €90 million in 2003
We will continue to execute the appropriate strategy to maximiselong term value.
Certain of the comments and materials in this presentation may contain forward-looking statements, including statements within the meaning of thePrivate Securities Litigation Reform Act of 1995. These statements are based upon current expectations and assumptions regarding anticipateddevelopments and other factors affecting the Group. Actual results may differ materially from those included in these statements due to a variety offactors including, among others, those described in the Group’s filings with the Securities and Exchange Commission and in the transcript of thispresentation, which will be accessible via our website at www.unilever.com.
Q2 & H1 2004 Unilever Results
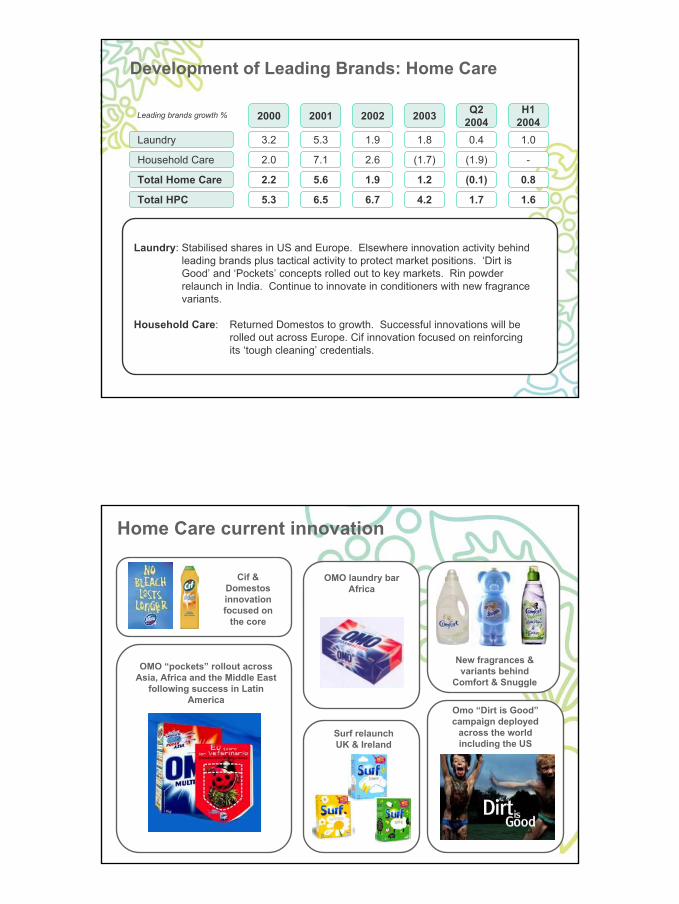
Development of Leading Brands: Home Care
Leading brands growth %
Laundry 5.3 1.81.93.2
Household Care 7.1 (1.7)2.62.0
Total HPC 6.5 4.26.75.3
2000 2001 2002 2003
0.4
(1.9)
1.7
Q22004
Total Home Care 5.6 1.21.92.2 (0.1)
1.0
-
1.6
H12004
0.8
Laundry: Stabilised shares in US and Europe. Elsewhere innovation activity behindleading brands plus tactical activity to protect market positions. ‘Dirt is Good’ and ‘Pockets’ concepts rolled out to key markets. Rin powder relaunch in India. Continue to innovate in conditioners with new fragrancevariants.
Household Care: Returned Domestos to growth. Successful innovations will berolled out across Europe. Cif innovation focused on reinforcingits ‘tough cleaning’ credentials.
Home Care current innovation
OMO laundry barAfrica
New fragrances &variants behind
Comfort & Snuggle
Surf relaunchUK & Ireland
Omo “Dirt is Good”campaign deployed
across the worldincluding the US
OMO “pockets” rollout acrossAsia, Africa and the Middle East
following success in LatinAmerica
Cif &Domestosinnovationfocused on
the core
Certain of the comments and materials in this presentation may contain forward-looking statements, including statements within the meaning of thePrivate Securities Litigation Reform Act of 1995. These statements are based upon current expectations and assumptions regarding anticipateddevelopments and other factors affecting the Group. Actual results may differ materially from those included in these statements due to a variety offactors including, among others, those described in the Group’s filings with the Securities and Exchange Commission and in the transcript of thispresentation, which will be accessible via our website at www.unilever.com.
Q2 & H1 2004 Unilever Results
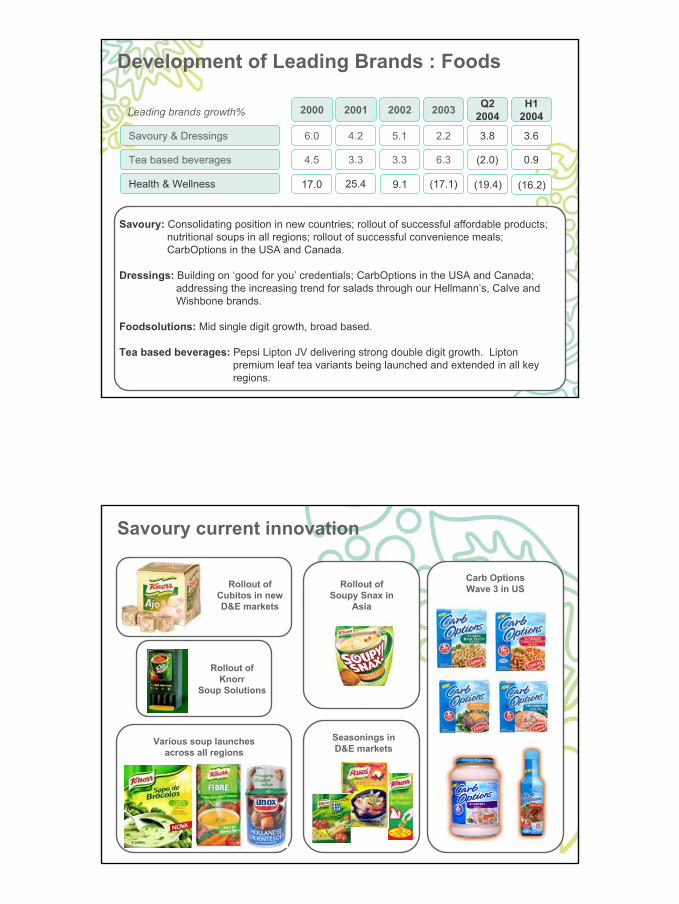
Development of Leading Brands : Foods
Savoury: Consolidating position in new countries; rollout of successful affordable products;nutritional soups in all regions; rollout of successful convenience meals; CarbOptions in the USA and Canada.
Dressings: Building on ‘good for you’ credentials; CarbOptions in the USA and Canada; addressing the increasing trend for salads through our Hellmann’s, Calve and Wishbone brands.
Foodsolutions: Mid single digit growth, broad based.
Tea based beverages: Pepsi Lipton JV delivering strong double digit growth. Lipton premium leaf tea variants being launched and extended in all key regions.
Leading brands growth%
6.0 4.2 5.1 2.2
4.5 3.3 3.3 6.3
Savoury & Dressings
Tea based beverages
2003200220012000
3.8
(2.0)
Q22004
3.6
0.9
H12004
(19.4) (16.2)17.0 25.4 9.1 (17.1)Health & Wellness
Savoury current innovation
Rollout ofCubitos in newD&E markets
Rollout ofSoupy Snax in
Asia
Seasonings inD&E markets
Carb OptionsWave 3 in US
Rollout ofKnorr
Soup Solutions
Various soup launchesacross all regions
Asia
Certain of the comments and materials in this presentation may contain forward-looking statements, including statements within the meaning of thePrivate Securities Litigation Reform Act of 1995. These statements are based upon current expectations and assumptions regarding anticipateddevelopments and other factors affecting the Group. Actual results may differ materially from those included in these statements due to a variety offactors including, among others, those described in the Group’s filings with the Securities and Exchange Commission and in the transcript of thispresentation, which will be accessible via our website at www.unilever.com.
Q2 & H1 2004 Unilever Results
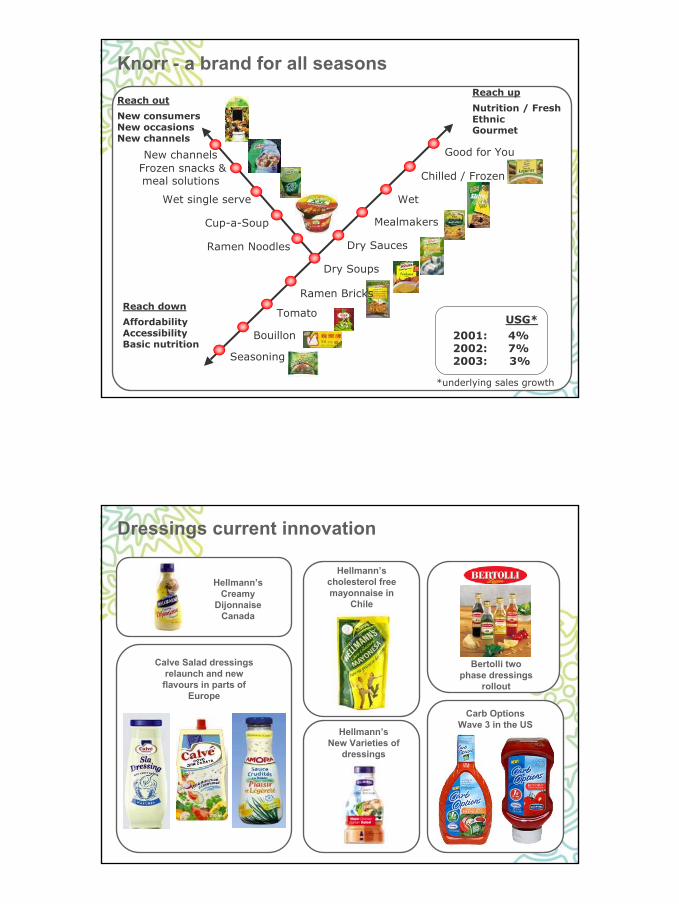
Knorr - a brand for all seasons
Reach out
New consumersNew occasionsNew channels
Reach down
AffordabilityAccessibilityBasic nutrition
New channelsFrozen snacks &meal solutions
Wet single serve
Cup-a-Soup
Ramen Noodles
Chilled / Frozen
Wet
Mealmakers
Dry Sauces
Dry Soups
Ramen Bricks
Tomato
Bouillon
Seasoning
Reach up
Nutrition / FreshEthnicGourmet
Good for You
USG*2001: 4%2002: 7%2003: 3%
*underlying sales growth
Dressings current innovation
Hellmann’sCreamy
DijonnaiseCanada
Hellmann’scholesterol freemayonnaise in
Chile
Bertolli twophase dressings
rollout
Hellmann’sNew Varieties of
dressings
Carb OptionsWave 3 in the US
Calve Salad dressingsrelaunch and newflavours in parts of
Europe
Certain of the comments and materials in this presentation may contain forward-looking statements, including statements within the meaning of thePrivate Securities Litigation Reform Act of 1995. These statements are based upon current expectations and assumptions regarding anticipateddevelopments and other factors affecting the Group. Actual results may differ materially from those included in these statements due to a variety offactors including, among others, those described in the Group’s filings with the Securities and Exchange Commission and in the transcript of thispresentation, which will be accessible via our website at www.unilever.com.
Q2 & H1 2004 Unilever Results
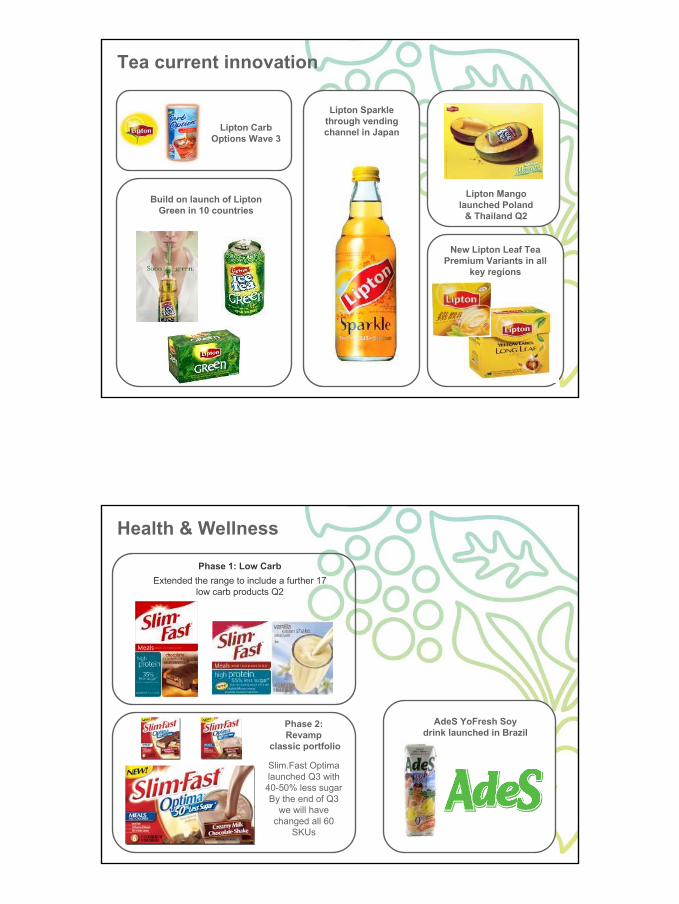
Tea current innovation
Lipton CarbOptions Wave 3
Lipton Sparklethrough vendingchannel in Japan
Lipton Mangolaunched Poland
& Thailand Q2
New Lipton Leaf TeaPremium Variants in all
key regions
Build on launch of LiptonGreen in 10 countries
Health & Wellness
AdeS YoFresh Soydrink launched in Brazil
Slim.Fast Optimalaunched Q3 with
40-50% less sugarBy the end of Q3
we will havechanged all 60
SKUs
Phase 1: Low CarbExtended the range to include a further 17
low carb products Q2
Phase 2: Revamp
classic portfolio
Certain of the comments and materials in this presentation may contain forward-looking statements, including statements within the meaning of thePrivate Securities Litigation Reform Act of 1995. These statements are based upon current expectations and assumptions regarding anticipateddevelopments and other factors affecting the Group. Actual results may differ materially from those included in these statements due to a variety offactors including, among others, those described in the Group’s filings with the Securities and Exchange Commission and in the transcript of thispresentation, which will be accessible via our website at www.unilever.com.
Q2 & H1 2004 Unilever Results
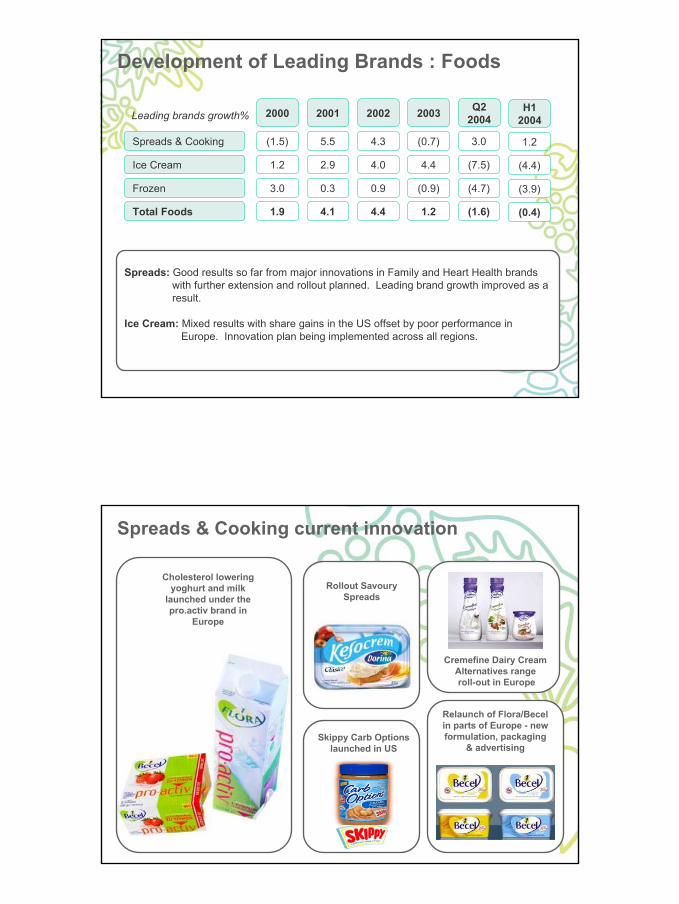
Spreads: Good results so far from major innovations in Family and Heart Health brandswith further extension and rollout planned. Leading brand growth improved as aresult.
Ice Cream: Mixed results with share gains in the US offset by poor performance in Europe. Innovation plan being implemented across all regions.
Development of Leading Brands : Foods
Leading brands growth%
Ice Cream
Frozen
Total Foods
1.2
3.0
1.9
2000
(1.5)
2.9
0.3
4.1
2001
5.5
4.0
0.9
4.4
2002
4.3
4.4
(0.9)
1.2
2003
(0.7)Spreads & Cooking
(7.5)
(4.7)
(1.6)
Q22004
3.0
(4.4)
(3.9)
(0.4)
H12004
1.2
Spreads & Cooking current innovation
Rollout SavourySpreads
Cremefine Dairy CreamAlternatives range roll-out in Europe
Skippy Carb Optionslaunched in US
Relaunch of Flora/Becelin parts of Europe - newformulation, packaging
& advertising
Cholesterol loweringyoghurt and milk
launched under thepro.activ brand in
Europe
Certain of the comments and materials in this presentation may contain forward-looking statements, including statements within the meaning of thePrivate Securities Litigation Reform Act of 1995. These statements are based upon current expectations and assumptions regarding anticipateddevelopments and other factors affecting the Group. Actual results may differ materially from those included in these statements due to a variety offactors including, among others, those described in the Group’s filings with the Securities and Exchange Commission and in the transcript of thispresentation, which will be accessible via our website at www.unilever.com.
Q2 & H1 2004 Unilever Results
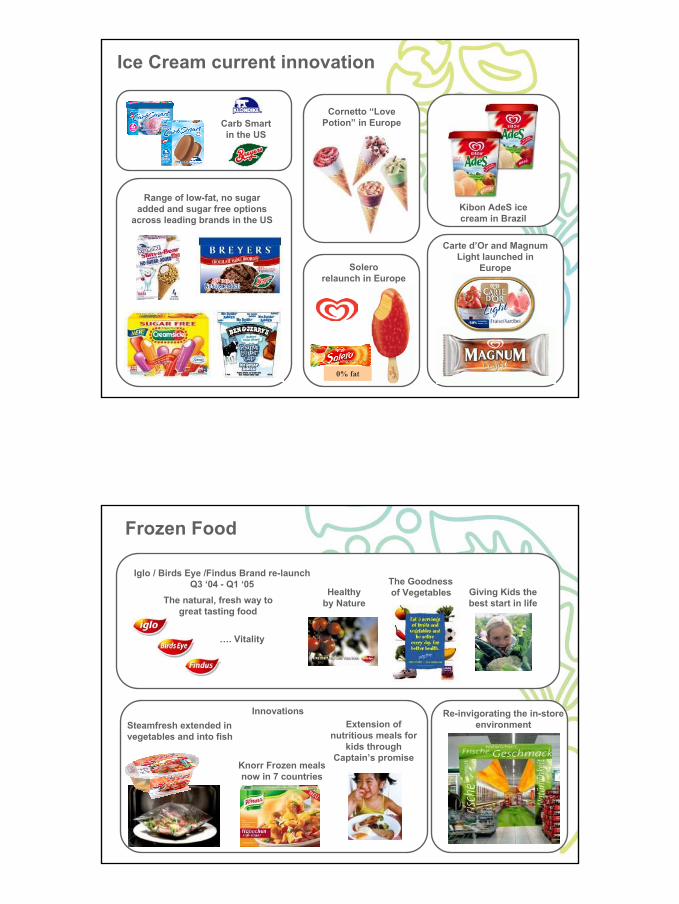
Ice Cream current innovation
Carb Smartin the US
Cornetto “LovePotion” in Europe
Kibon AdeS icecream in Brazil
Solerorelaunch in Europe
Carte d’Or and MagnumLight launched in
Europe
Range of low-fat, no sugaradded and sugar free options
across leading brands in the US
0% fat
Frozen Food
Knorr Frozen mealsnow in 7 countries
Iglo / Birds Eye /Findus Brand re-launchQ3 ‘04 - Q1 ‘05
…. Vitality
InnovationsSteamfresh extended invegetables and into fish
The natural, fresh way togreat tasting food
Healthyby Nature
Giving Kids thebest start in life
The Goodness of Vegetables
Extension ofnutritious meals for
kids throughCaptain’s promise
Re-invigorating the in-storeenvironment
Certain of the comments and materials in this presentation may contain forward-looking statements, including statements within the meaning of thePrivate Securities Litigation Reform Act of 1995. These statements are based upon current expectations and assumptions regarding anticipateddevelopments and other factors affecting the Group. Actual results may differ materially from those included in these statements due to a variety offactors including, among others, those described in the Group’s filings with the Securities and Exchange Commission and in the transcript of thispresentation, which will be accessible via our website at www.unilever.com.
Q2 & H1 2004 Unilever Results
Progress onPath to Growthand Bestfoodsacquisition
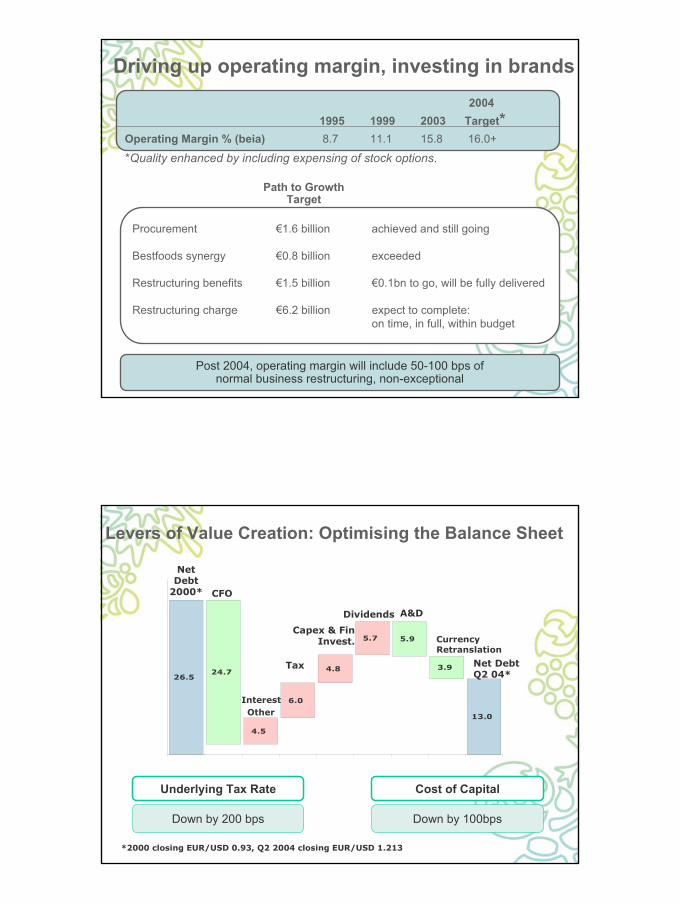
Through the last 8 years:• average operating profit growth of 9% per annum• an average growth in EPS of 8% per annum• an average growth in free cash flow of 14% per annum
Managing the levers of Value Creation
1995 1999 2003Operating Margin % (beia) Total Operating Assets % sales Tax Rate (beia) % Free Cash Flow €bn ROIC %
Cost of Capital reduced by gearing upDistribution to shareholders since 1995 is €17 billion
A much more focused brand portfolio -not yet delivering consistent performance
8.738341.4
9.2
15.82029
3.912.5
11.12932
2.816.5
Certain of the comments and materials in this presentation may contain forward-looking statements, including statements within the meaning of thePrivate Securities Litigation Reform Act of 1995. These statements are based upon current expectations and assumptions regarding anticipateddevelopments and other factors affecting the Group. Actual results may differ materially from those included in these statements due to a variety offactors including, among others, those described in the Group’s filings with the Securities and Exchange Commission and in the transcript of thispresentation, which will be accessible via our website at www.unilever.com.
Q2 & H1 2004 Unilever Results
Post 2004 operating margin will include 50-100 bps of normal business restructuring
Driving up operating margin, investing in brands 2004
1995 1999 2003 Target*Operating Margin % (beia) 8.7 11.1 15.8 16.0+
Procurement €1.6 billion achieved and still going
Bestfoods synergy €0.8 billion exceeded
Restructuring benefits €1.5 billion €0.1bn to go, will be fully delivered
Restructuring charge €6.2 billion expect to complete:on time, in full, within budget
Path to GrowthTarget
Post 2004, operating margin will include 50-100 bps ofnormal business restructuring, non-exceptional
*Quality enhanced by including expensing of stock options.
Levers of Value Creation: Optimising the Balance Sheet
24.7
5.9
3.9
4.5
6.0
4.8
5.7
26.5
13.0
Underlying Tax Rate
Down by 200 bps
Cost of Capital
Down by 100bps
Net DebtQ2 04*
CurrencyRetranslation
Capex & FinInvest.
Interest
Tax
Dividends
NetDebt
2000* CFO
A&D
Other
*2000 closing EUR/USD 0.93, Q2 2004 closing EUR/USD 1.213
Certain of the comments and materials in this presentation may contain forward-looking statements, including statements within the meaning of thePrivate Securities Litigation Reform Act of 1995. These statements are based upon current expectations and assumptions regarding anticipateddevelopments and other factors affecting the Group. Actual results may differ materially from those included in these statements due to a variety offactors including, among others, those described in the Group’s filings with the Securities and Exchange Commission and in the transcript of thispresentation, which will be accessible via our website at www.unilever.com.
Q2 & H1 2004 Unilever Results
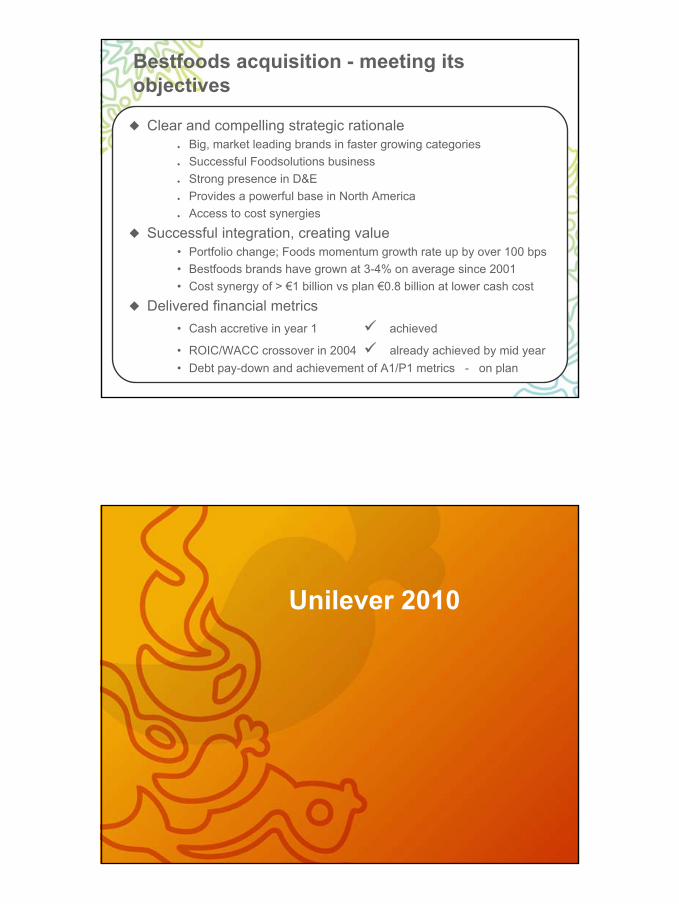
Bestfoods acquisition - meeting itsobjectives
Clear and compelling strategic rationaleBig, market leading brands in faster growing categoriesSuccessful Foodsolutions businessStrong presence in D&EProvides a powerful base in North AmericaAccess to cost synergies
Successful integration, creating value• Portfolio change; Foods momentum growth rate up by over 100 bps• Bestfoods brands have grown at 3-4% on average since 2001• Cost synergy of > €1 billion vs plan €0.8 billion at lower cash cost
Delivered financial metrics• Cash accretive in year 1 achieved
• ROIC/WACC crossover in 2004 already achieved by mid year• Debt pay-down and achievement of A1/P1 metrics - on plan
Unilever 2010
Certain of the comments and materials in this presentation may contain forward-looking statements, including statements within the meaning of thePrivate Securities Litigation Reform Act of 1995. These statements are based upon current expectations and assumptions regarding anticipateddevelopments and other factors affecting the Group. Actual results may differ materially from those included in these statements due to a variety offactors including, among others, those described in the Group’s filings with the Securities and Exchange Commission and in the transcript of thispresentation, which will be accessible via our website at www.unilever.com.
Q2 & H1 2004 Unilever Results
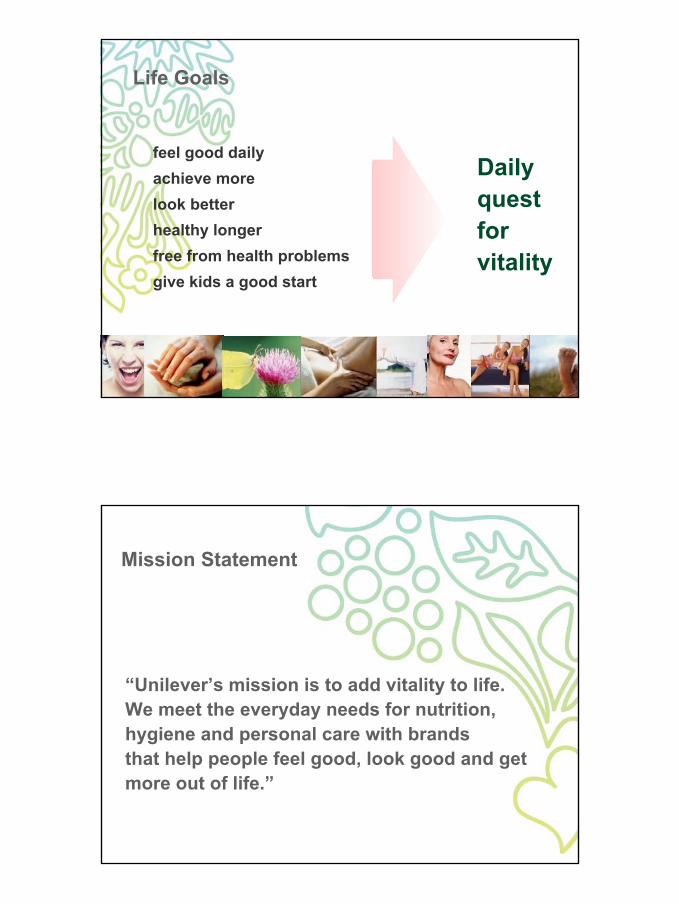
Life Goals
feel good dailyachieve morelook betterhealthy longerfree from health problemsgive kids a good start
Dailyquestforvitality
Mission Statement
“Unilever’s mission is to add vitality to life.We meet the everyday needs for nutrition,hygiene and personal care with brandsthat help people feel good, look good and getmore out of life.”
Certain of the comments and materials in this presentation may contain forward-looking statements, including statements within the meaning of thePrivate Securities Litigation Reform Act of 1995. These statements are based upon current expectations and assumptions regarding anticipateddevelopments and other factors affecting the Group. Actual results may differ materially from those included in these statements due to a variety offactors including, among others, those described in the Group’s filings with the Securities and Exchange Commission and in the transcript of thispresentation, which will be accessible via our website at www.unilever.com.
Q2 & H1 2004 Unilever Results
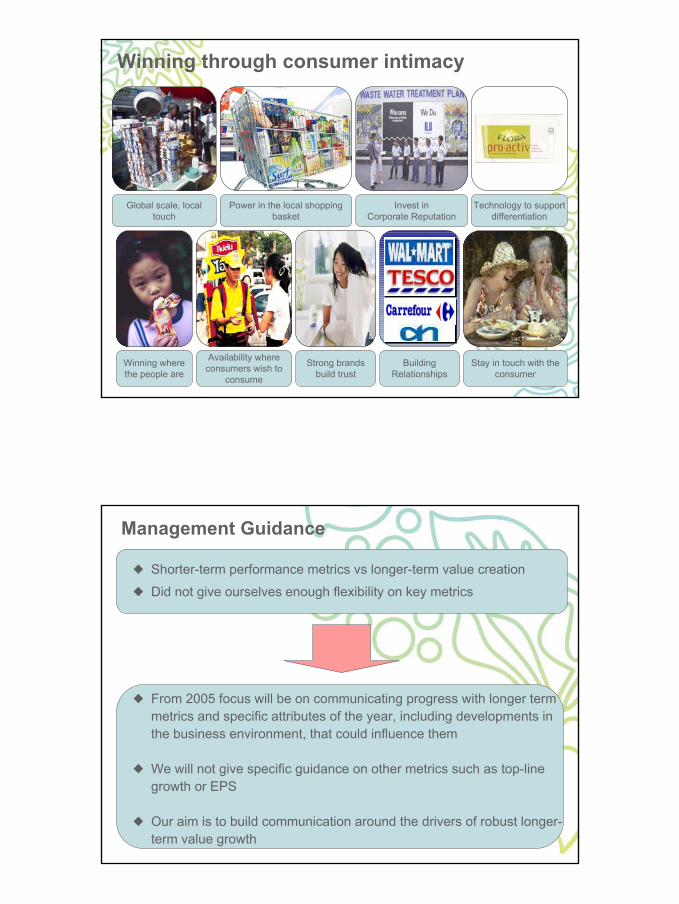
Winning through consumer intimacy
Power in the local shoppingbasket
Winning wherethe people are
Global scale, localtouch
Availability whereconsumers wish to
consume
Strong brandsbuild trust
BuildingRelationships
Invest inCorporate Reputation
Stay in touch with theconsumer
Technology to supportdifferentiation
Management Guidance
Shorter-term performance metrics vs longer-term value creation
Did not give ourselves enough flexibility on key metrics
From 2005 focus will be on communicating progress with longer termmetrics and specific attributes of the year, including developments inthe business environment, that could influence them
We will not give specific guidance on other metrics such as top-linegrowth or EPS
Our aim is to build communication around the drivers of robust longer-term value growth
Certain of the comments and materials in this presentation may contain forward-looking statements, including statements within the meaning of thePrivate Securities Litigation Reform Act of 1995. These statements are based upon current expectations and assumptions regarding anticipateddevelopments and other factors affecting the Group. Actual results may differ materially from those included in these statements due to a variety offactors including, among others, those described in the Group’s filings with the Securities and Exchange Commission and in the transcript of thispresentation, which will be accessible via our website at www.unilever.com.
Q2 & H1 2004 Unilever Results
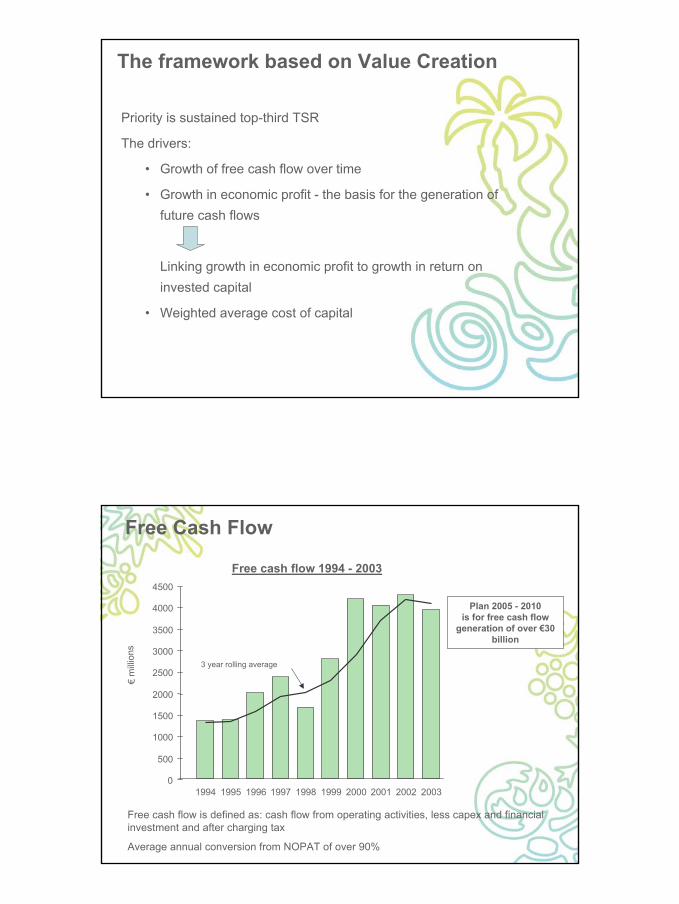
The framework based on Value Creation
Priority is sustained top-third TSR
The drivers:
• Growth of free cash flow over time
• Growth in economic profit - the basis for the generation offuture cash flows
Linking growth in economic profit to growth in return oninvested capital
• Weighted average cost of capital
Free Cash Flow
1994 1995 1996 1997 1998 1999 2000 2001 2002 20030
500
1000
1500
2000
2500
3000
3500
4000
4500
Free cash flow is defined as: cash flow from operating activities, less capex and financialinvestment and after charging tax
Average annual conversion from NOPAT of over 90%
Free cash flow 1994 - 2003
€ m
illio
ns
Plan 2005 - 2010is for free cash flow
generation of over €30billion
3 year rolling average
Certain of the comments and materials in this presentation may contain forward-looking statements, including statements within the meaning of thePrivate Securities Litigation Reform Act of 1995. These statements are based upon current expectations and assumptions regarding anticipateddevelopments and other factors affecting the Group. Actual results may differ materially from those included in these statements due to a variety offactors including, among others, those described in the Group’s filings with the Securities and Exchange Commission and in the transcript of thispresentation, which will be accessible via our website at www.unilever.com.
Q2 & H1 2004 Unilever Results
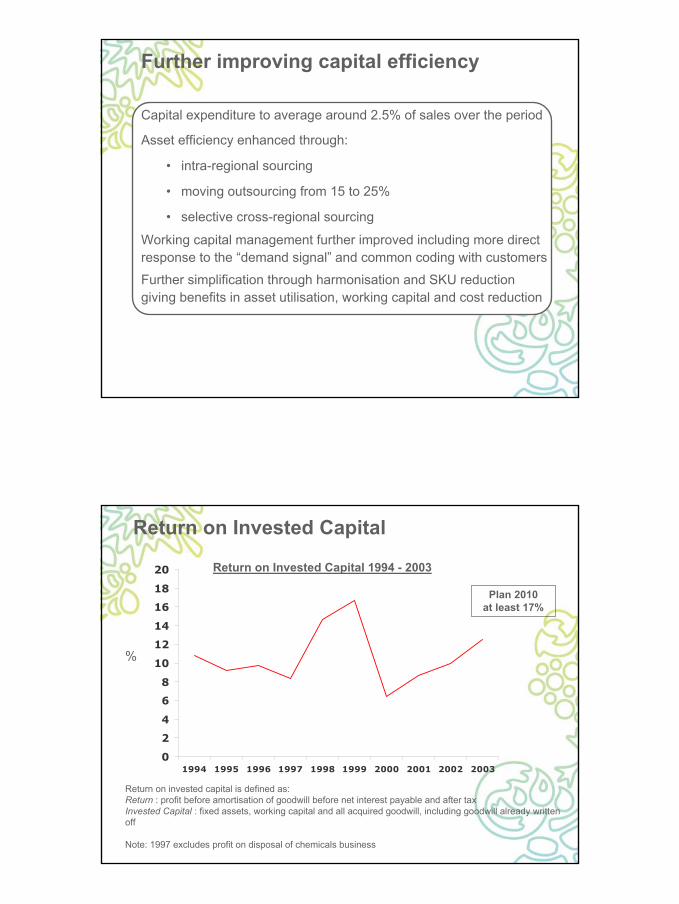
Further improving capital efficiency
Capital expenditure to average around 2.5% of sales over the period
Asset efficiency enhanced through:
• intra-regional sourcing
• moving outsourcing from 15 to 25%
• selective cross-regional sourcing
Working capital management further improved including more directresponse to the “demand signal” and common coding with customers
Further simplification through harmonisation and SKU reductiongiving benefits in asset utilisation, working capital and cost reduction
Return on Invested Capital
0
2
4
6
8
10
12
14
16
18
20
1994 1995 1996 1997 1998 1999 2000 2001 2002 2003
%
Plan 2010at least 17%
Return on invested capital is defined as:Return : profit before amortisation of goodwill before net interest payable and after taxInvested Capital : fixed assets, working capital and all acquired goodwill, including goodwill already writtenoff
Note: 1997 excludes profit on disposal of chemicals business
Return on Invested Capital 1994 - 2003
Certain of the comments and materials in this presentation may contain forward-looking statements, including statements within the meaning of thePrivate Securities Litigation Reform Act of 1995. These statements are based upon current expectations and assumptions regarding anticipateddevelopments and other factors affecting the Group. Actual results may differ materially from those included in these statements due to a variety offactors including, among others, those described in the Group’s filings with the Securities and Exchange Commission and in the transcript of thispresentation, which will be accessible via our website at www.unilever.com.
Q2 & H1 2004 Unilever Results
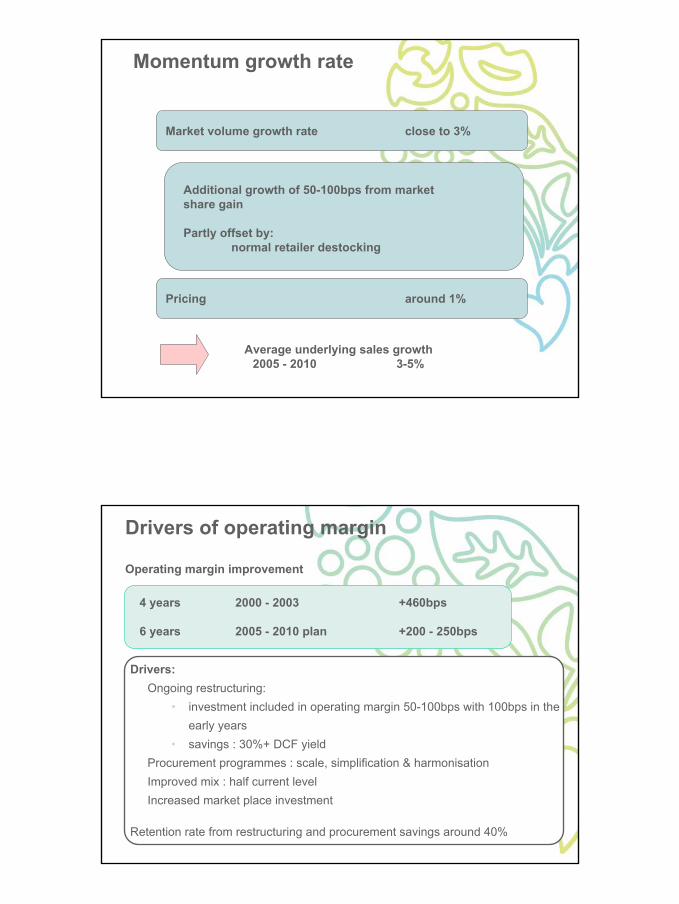
Momentum growth rate
Market volume growth rate close to 3%
Additional growth of 50-100bps from market share gain
Partly offset by:normal retailer destocking
Pricing around 1%
Average underlying sales growth2005 - 2010 3-5%
Drivers of operating margin
Operating margin improvement
4 years
6 years
2000 - 2003
2005 - 2010 plan
+460bps
+200 - 250bps
Drivers:Ongoing restructuring:
• investment included in operating margin 50-100bps with 100bps in theearly years
• savings : 30%+ DCF yieldProcurement programmes : scale, simplification & harmonisationImproved mix : half current levelIncreased market place investment
Retention rate from restructuring and procurement savings around 40%
Certain of the comments and materials in this presentation may contain forward-looking statements, including statements within the meaning of thePrivate Securities Litigation Reform Act of 1995. These statements are based upon current expectations and assumptions regarding anticipateddevelopments and other factors affecting the Group. Actual results may differ materially from those included in these statements due to a variety offactors including, among others, those described in the Group’s filings with the Securities and Exchange Commission and in the transcript of thispresentation, which will be accessible via our website at www.unilever.com.
Q2 & H1 2004 Unilever Results
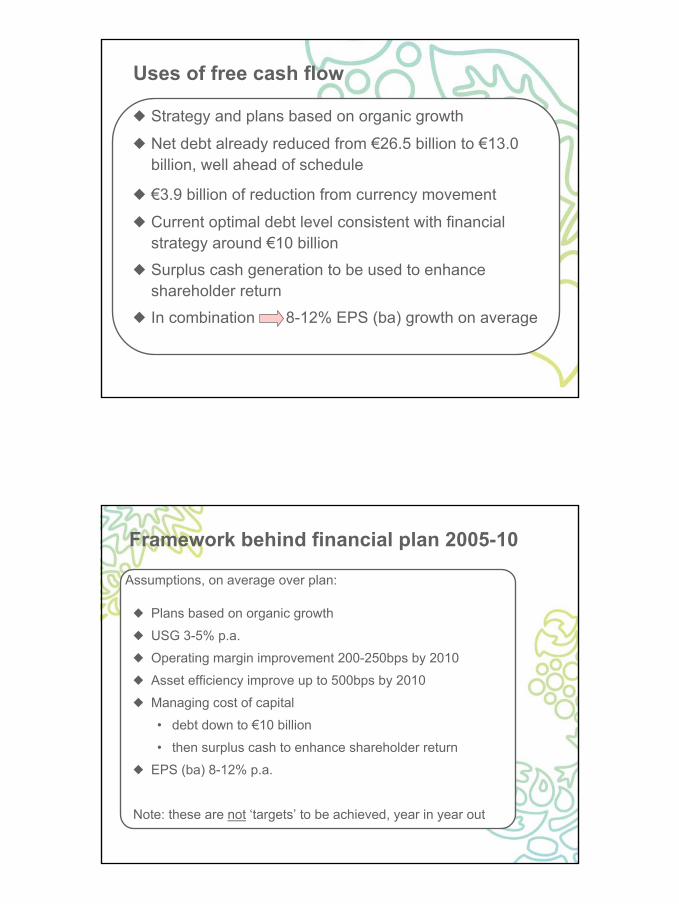
Uses of free cash flow
Strategy and plans based on organic growth
Net debt already reduced from €26.5 billion to €13.0billion, well ahead of schedule
€3.9 billion of reduction from currency movement
Current optimal debt level consistent with financialstrategy around €10 billion
Surplus cash generation to be used to enhanceshareholder return
In combination 8-12% EPS (ba) growth on average
Framework behind financial plan 2005-10
Plans based on organic growth
USG 3-5% p.a.
Operating margin improvement 200-250bps by 2010
Asset efficiency improve up to 500bps by 2010
Managing cost of capital
• debt down to €10 billion
• then surplus cash to enhance shareholder return
EPS (ba) 8-12% p.a.
Note: these are not ‘targets’ to be achieved, year in year out
Assumptions, on average over plan:
Certain of the comments and materials in this presentation may contain forward-looking statements, including statements within the meaning of thePrivate Securities Litigation Reform Act of 1995. These statements are based upon current expectations and assumptions regarding anticipateddevelopments and other factors affecting the Group. Actual results may differ materially from those included in these statements due to a variety offactors including, among others, those described in the Group’s filings with the Securities and Exchange Commission and in the transcript of thispresentation, which will be accessible via our website at www.unilever.com.
Q2 & H1 2004 Unilever Results
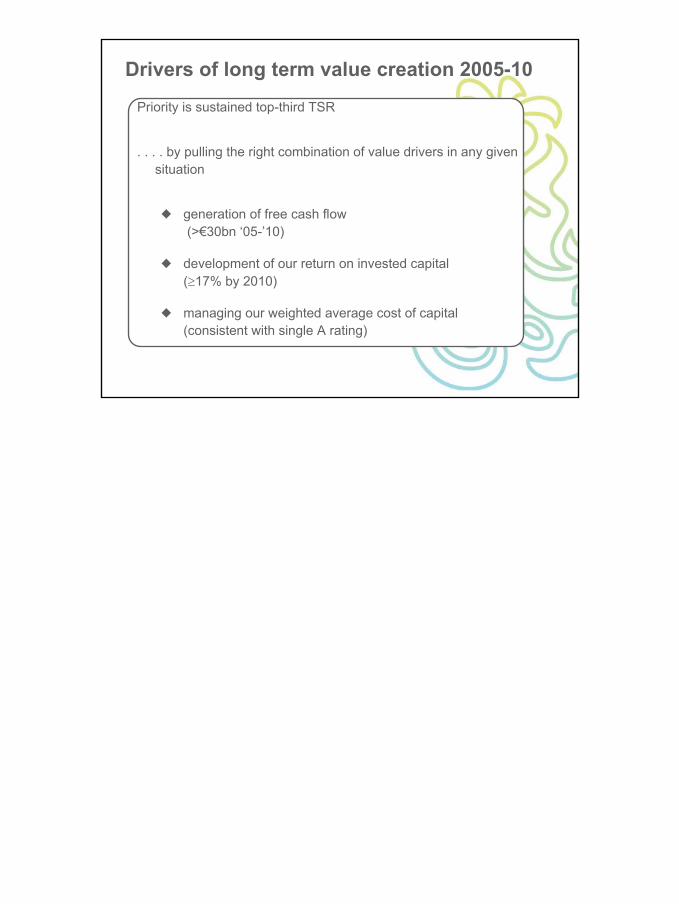
Drivers of long term value creation 2005-10
Priority is sustained top-third TSR
. . . . by pulling the right combination of value drivers in any givensituation
generation of free cash flow (>€30bn ‘05-’10)
development of our return on invested capital (≥17% by 2010)
managing our weighted average cost of capital (consistent with single A rating)