Embed Size (px)
Citation preview

Evaluation for Stability data Q1E
Sumie Yoshioka, Ph. D.
MHLW
National Institute of Health Sciences

Q1E provides recommendations on :
How to use stability data generated according to Q1AR
When and how a retest period or a shelf life can be extended beyond the period covered by long-term data
Q1E contains
examples of statistical approaches to stability data analysis

Extrapolation
toto extend retest period/shelf life
Statistical approaches
recommended in the guideline

Significant change
No Yes
Accelerated condition

Where no significant change occurs at accelerated condition
No YesLittle or no changeLittle or no variability
Accelerated data & Long-term data

Where accelerated data show significant change
No YesSignificant change
Intermediate condition
Amenable?Performed?
No Yes
Statistical analysis

Available? No Yes
Supporting data

12 month extension
Four outcomes passing through crossroadsfor Room Temperature Storage
No extension
6 month extension
3 month extension

Outcome 1 12 month extensionaccelerated data show
no significant change
accelerated data & long-term data
little or no change
little or no variability
Outcome 4 no extensionsignificant change
at accelerated condition
at intermediate condition
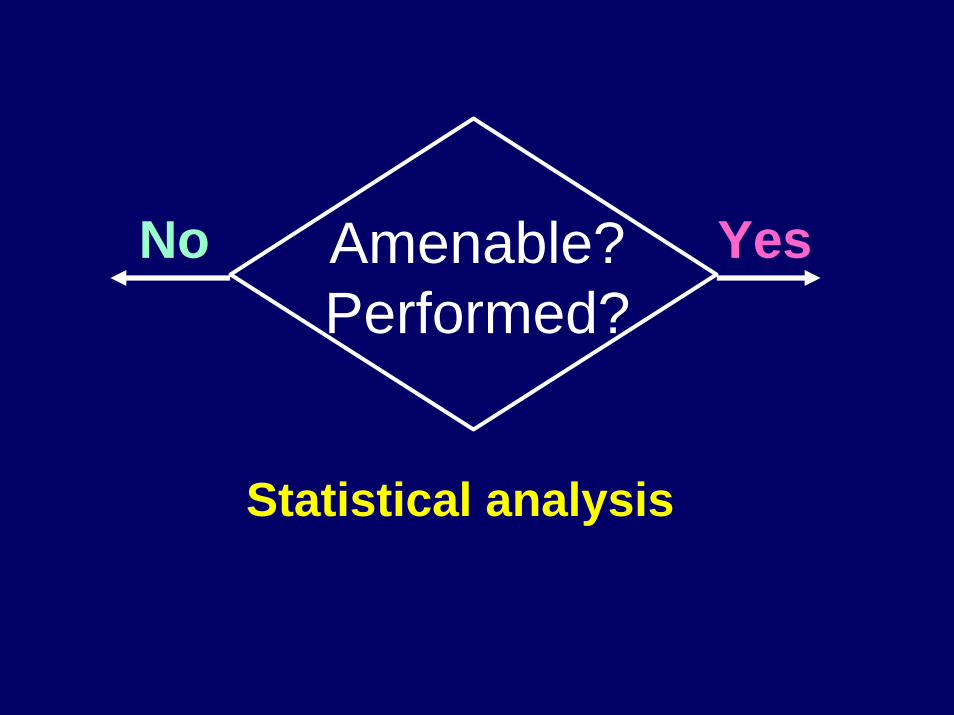
Statistical analysis
longer retest period/shelf life
(not necessarily required)
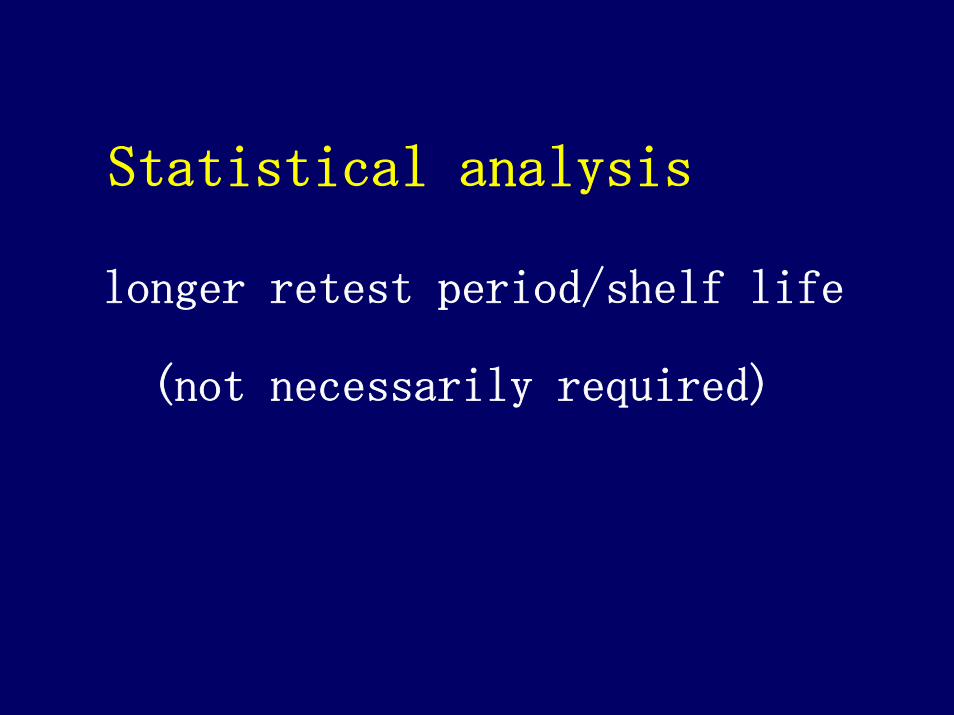
amenable?performed?
Yes
No
12 month extension
6 month extension
Where Accelerated data show no significant changeChanges and variations in accelerated data
long-term data
with Supporting data

amenable?performed?
Yes
No
6 month extension
3 month extension
Where Significant change at accelerated condition
but not at intermediate condition
with Supporting data

Statistical analysis can be appropriate to verify retest period/shelf life
Statistical analysis
longer retest period/shelf life
not always required
Where significant change
at accelerated & intermediate conditions
variability in long-term data
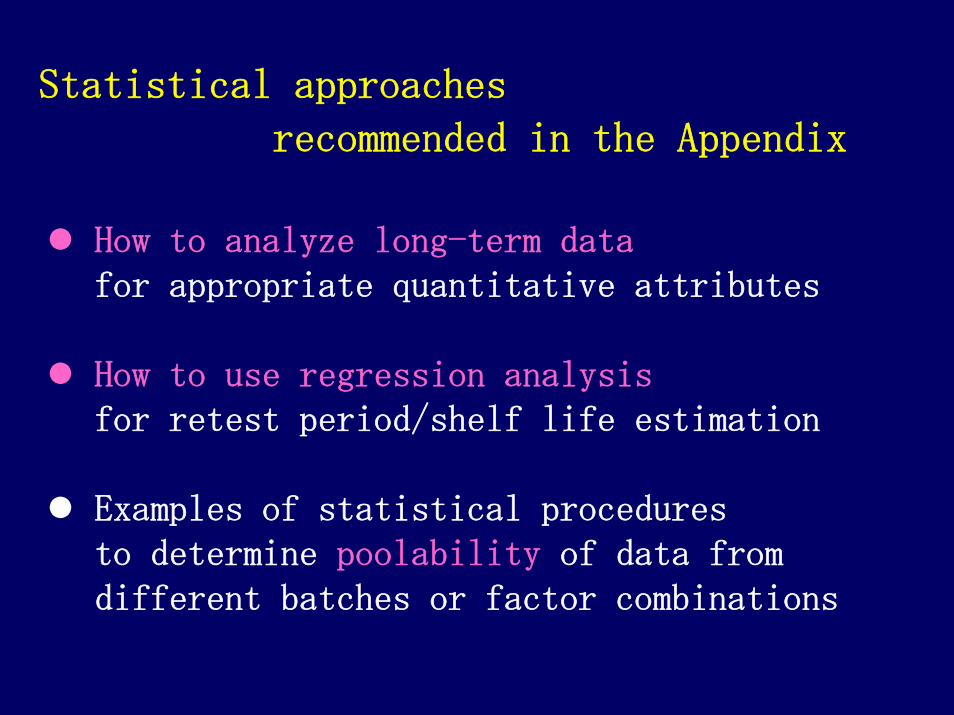
Statistical approaches
recommended in the Appendix
How to analyze long-term datafor appropriate quantitative attributes
How to use regression analysisfor retest period/shelf life estimation
Examples of statistical procedures to determine poolability of data from different batches or factor combinations

Regression analysis
Establish retest period/shelf life
with a high degree of confidence
Quantitative attribute will remain
within acceptance criteria
for all future batches

Shelf-life Estimation with Upper and Lower Acceptance Criteria Based on Assay at25C/60%RH
80
85
90
95
100
105
110
115
120
0 3 6 9 12 15 18 21 24 27 30 33 36 39 42 45 48
Time Point (Months)
Ass
ay (%
of L
abel
Cla
im)
Raw Data
Upper confidence limit
Lower confidence limit
Regression line
Upper acceptancecriterion: 105
Lower acceptancecriterion: 95

Statistical approaches for determining whether data from different batches/factor combinations can be pooled
(Approach #1) Whether data from all batches/factor combinations support the proposed period
(Approach #2 “Poolability test”)Whether data from all batches/factor
combinations can be combined for overall estimate of a single period
(Alternative approaches)

Approaches #1 and #2 can
also be applied to data analysis
for multi-factor studies including Bracketing & Matrixing Designs
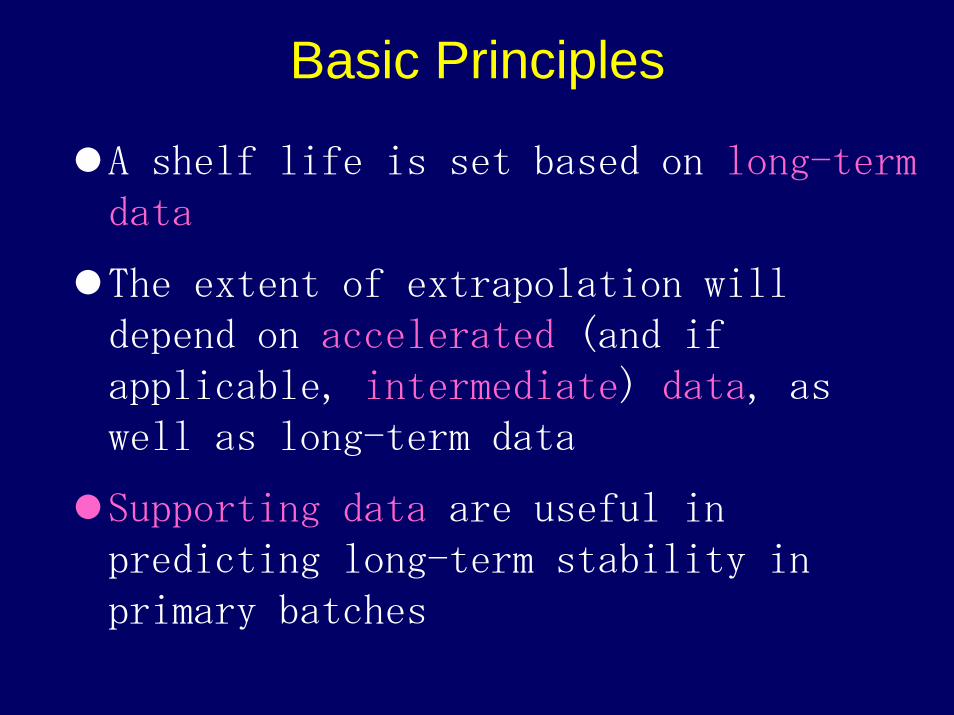
Basic Principles
A shelf life is set based on long-termdata
The extent of extrapolation will depend on accelerated (and if applicable, intermediate) data, as well as long-term data
Supporting data are useful in predicting long-term stability in primary batches

Basic Principles (cont’d)
Statistical analysis is not always necessary for setting a shelf life
A shelf life beyond the period covered by available long-term data can be proposed with supporting data, with or without statistical analysis
Where a statistical analysis is performed, longer extrapolation can be justified

MHLW Perspective - Q1EBefore Q1E
EU---12 month extrapolation with or without statistical analysis;
US--- max 6 month extrapolation with statistical analysis;
Japan--- no practical extrapolation
Q1E provides guidance on the extent of shelf life extrapolation in a variety of situations
Q1E clearly describes the role of accelerated data and of supporting data in shelf life estimation