Embed Size (px)
Citation preview
Eng US20 April, 2018
Q1 Presentation 2018
Eng US
• This presentation has been prepared by Duni AB (the “Company”) solely for use at this investor presentation and is furnished to you solely for your information and may not be reproduced or redistributed, in whole or in part, to any other person. By attending the meeting where this presentation is made, or by reading the presentation slides, you agree to be bound by the following limitations.
• This presentation is not for presentation or transmission into the United States or to any U.S. person, as that term is defined under Regulation S promulgated under the Securities Act of 1933, as amended.
• This presentation contains various forward-looking statements that reflect management’s current views with respect to future events and financial and operational performance. The words “believe,” “expect,” “anticipate,” “intend,” “may,” “plan,” “estimate,” “should,” “could,” “aim,” “target,” “might,” or, in each case, their negative, or similar expressions identify certain of these forward-looking statements. Others can be identified from the context in which the statements are made. These forward-looking statements involve known and unknown risks, uncertainties and other factors, which are in some cases beyond the Company’s control and may cause actual results or performance to differ materially from those expressed or implied from such forward-looking statements. These risks include but are not limited to the Company’s ability to operate profitably, maintain its competitive position, to promote and improve its reputation and the awareness of the brands in its portfolio, to successfully operate its growth strategy and the impact of changes in pricing policies, political and regulatory developments in the markets in which the Company operates, and other risks.
• The information and opinions contained in this document are provided as at the date of this presentation and are subject to change without notice.• No representation or warranty (expressed or implied) is made as to, and no reliance should be placed on, the fairness, accuracy or completeness of
the information contained herein. Accordingly, none of the Company, or any of its principal shareholders or subsidiary undertakings or any of such person’s officers or employees accepts any liability whatsoever arising directly or indirectly from the use of this document.
Disclaimer
2
3
• Net sales SEK 1 080 m (1 004)
• Operating income SEK 90 m (89)
• Operating margin 8.4% (8.9%)
2018 Q1 Highlights• Operating income marginally improved vs. previous year
contributed from improved volumes and positive FX effects.
• Biopac UK Ltd acquired in order to further strengthen Duni’sposition in sustainable disposable segment.
• Organic growth 2% in spite of less invoicing days in the quarter.
• Pulp prices continue to rise, putting pressure on gross margin.
• Price compensation activities only had limited effect, but will from second quarter mitigate the higher costs.
• Table Top operating income on par with previous year - launch of a new marketing concept strengthens go-to-market strategy.
• Meal Service with improved profitability vs. previous year and Biopac acquired in the quarter.
• Consumer with improvements in Central regions through successful campaigns and higher cost efficiency.
• New Markets continues to strengthen in Asia and Oceania, but high investment costs in some markets weaken the margin.
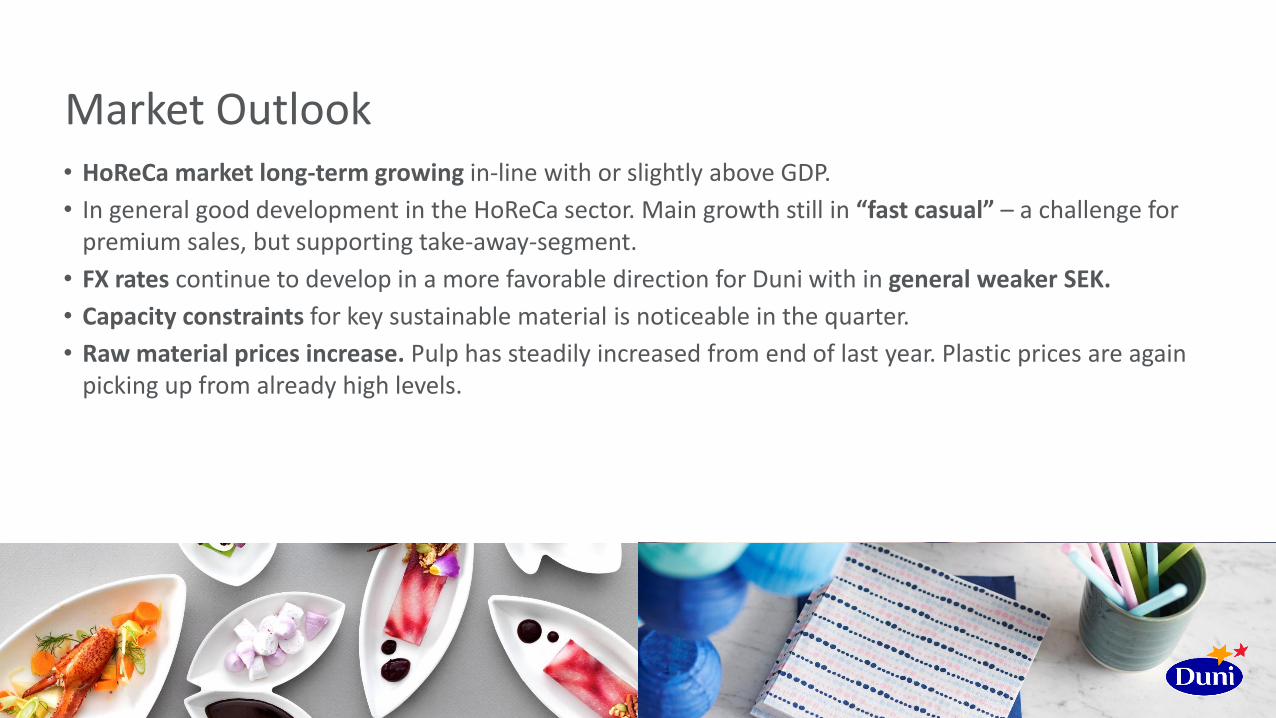
Market Outlook• HoReCa market long-term growing in-line with or slightly above GDP.
• In general good development in the HoReCa sector. Main growth still in “fast casual” – a challenge for premium sales, but supporting take-away-segment.
• FX rates continue to develop in a more favorable direction for Duni with in general weaker SEK.
• Capacity constraints for key sustainable material is noticeable in the quarter.
• Raw material prices increase. Pulp has steadily increased from end of last year. Plastic prices are again picking up from already high levels.

Eng US
Business Areas
Table TopPulp puts pressure on margins.
7
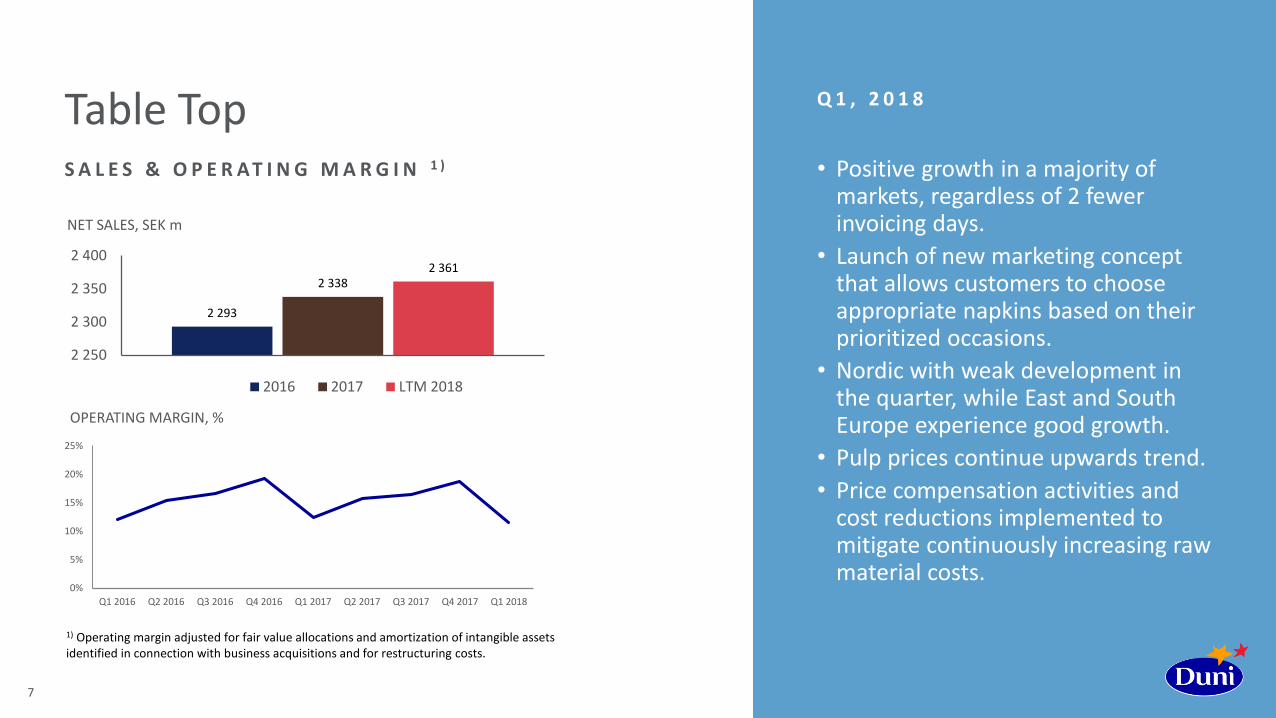
Table TopS A L E S & O P E R A T I N G M A R G I N 1 )
Q 1 , 2 0 1 8
2 293
2 3382 361
2 250
2 300
2 350
2 400
NET SALES, SEK m
2016 2017 LTM 2018
1) Operating margin adjusted for fair value allocations and amortization of intangible assets identified in connection with business acquisitions and for restructuring costs.
0%
5%
10%
15%
20%
25%
Q1 2016 Q2 2016 Q3 2016 Q4 2016 Q1 2017 Q2 2017 Q3 2017 Q4 2017 Q1 2018
OPERATING MARGIN, %
• Positive growth in a majority of markets, regardless of 2 fewer invoicing days.
• Launch of new marketing concept that allows customers to choose appropriate napkins based on their prioritized occasions.
• Nordic with weak development in the quarter, while East and South Europe experience good growth.
• Pulp prices continue upwards trend.
• Price compensation activities and cost reductions implemented to mitigate continuously increasing raw material costs.
Meal ServiceBiopac UK Ltd acquired in the quarter.
9
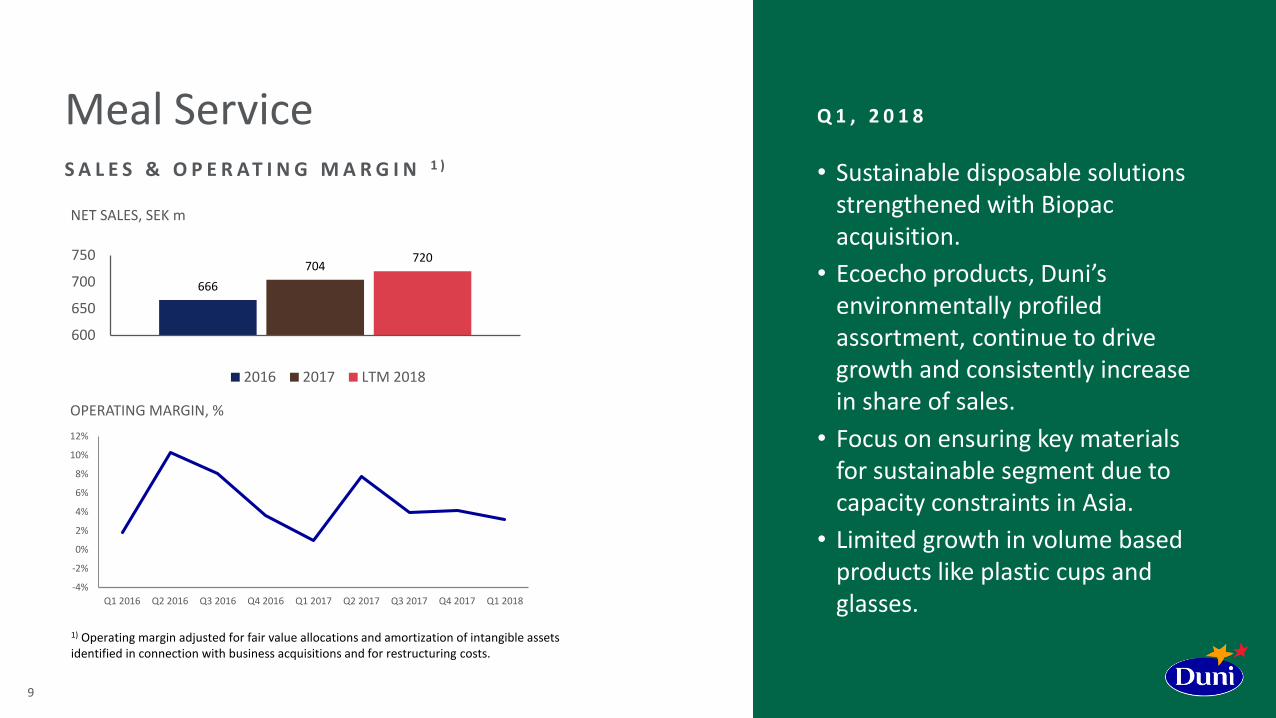
Meal ServiceS A L E S & O P E R A T I N G M A R G I N 1 )
666
704720
600
650
700
750
NET SALES, SEK m
2016 2017 LTM 2018
1) Operating margin adjusted for fair value allocations and amortization of intangible assets identified in connection with business acquisitions and for restructuring costs.
-4%
-2%
0%
2%
4%
6%
8%
10%
12%
Q1 2016 Q2 2016 Q3 2016 Q4 2016 Q1 2017 Q2 2017 Q3 2017 Q4 2017 Q1 2018
OPERATING MARGIN, %
Q 1 , 2 0 1 8
• Sustainable disposable solutions strengthened with Biopacacquisition.
• Ecoecho products, Duni’senvironmentally profiled assortment, continue to drive growth and consistently increase in share of sales.
• Focus on ensuring key materials for sustainable segment due to capacity constraints in Asia.
• Limited growth in volume based products like plastic cups and glasses.
ConsumerGood growth in Central region.
11
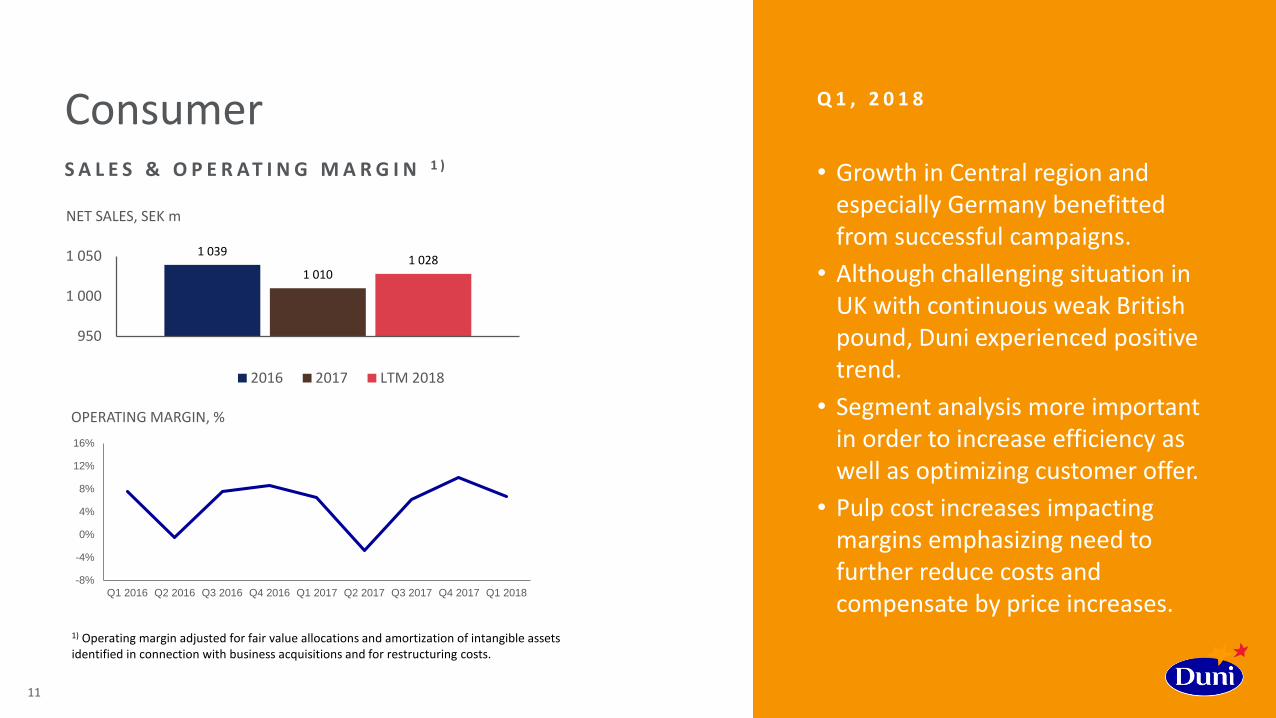
ConsumerS A L E S & O P E R A T I N G M A R G I N 1 )
Q 1 , 2 0 1 8
1 039
1 0101 028
950
1 000
1 050
NET SALES, SEK m
2016 2017 LTM 2018
1) Operating margin adjusted for fair value allocations and amortization of intangible assets identified in connection with business acquisitions and for restructuring costs.
-8%
-4%
0%
4%
8%
12%
16%
Q1 2016 Q2 2016 Q3 2016 Q4 2016 Q1 2017 Q2 2017 Q3 2017 Q4 2017 Q1 2018
OPERATING MARGIN, %
• Growth in Central region and especially Germany benefitted from successful campaigns.
• Although challenging situation in UK with continuous weak British pound, Duni experienced positive trend.
• Segment analysis more important in order to increase efficiency as well as optimizing customer offer.
• Pulp cost increases impacting margins emphasizing need to further reduce costs and compensate by price increases.

New MarketsGlobal coverage and expansion.
13
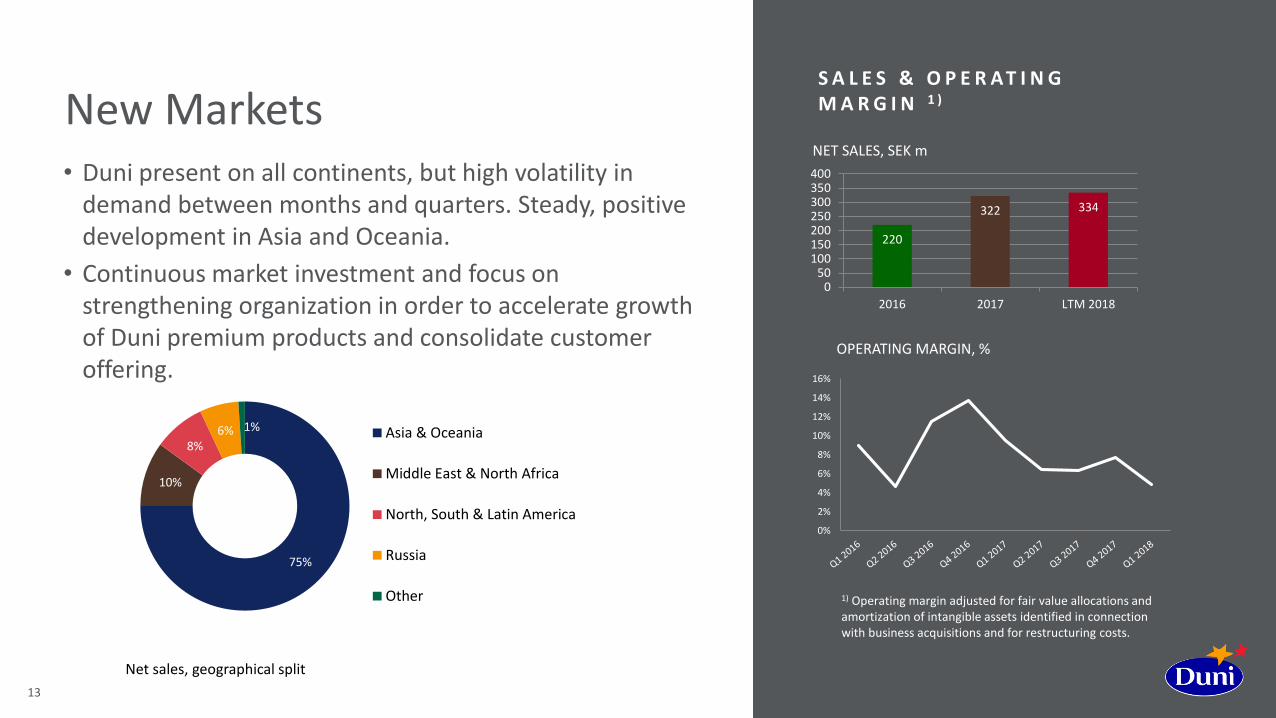
New Markets
75%
10%
8%6% 1% Asia & Oceania
Middle East & North Africa
North, South & Latin America
Russia
Other
Net sales, geographical split
S A L E S & O P E R A T I N G M A R G I N 1 )
1) Operating margin adjusted for fair value allocations and amortization of intangible assets identified in connection with business acquisitions and for restructuring costs.
0%
2%
4%
6%
8%
10%
12%
14%
16%
OPERATING MARGIN, %
220
322 334
050
100150200250300350400
2016 2017 LTM 2018
NET SALES, SEK m
• Duni present on all continents, but high volatility in demand between months and quarters. Steady, positive development in Asia and Oceania.
• Continuous market investment and focus on strengthening organization in order to accelerate growth of Duni premium products and consolidate customer offering.

Financials

Eng US
15
Earnings per share on par with previous year
1) Operating income adjusted for fair value allocations and amortization of intangible assets identified in connection with business acquisitions and for restructuring costs.
SEK m Q1 2018
Q1 2017
LTM 2017/2018
FY 2017
Net sales 1 080 1 004 4 517 4 441
Gross profit 295 286 1 274 1 264
Gross margin 27.3% 28.4% 28.2% 28.5%
Selling expenses -141 -130 -516 -505
Administrative expenses -64 -61 -264 -261
R & D expenses -3 -2 -9 -8
Other operating net -5 -11 -29 -35
EBIT 81 81 456 456
Adjustments -9 -8 -35 -35
Operating income 1) 90 89 492 491
Operating margin 8.4% 8.9% 10.9% 11.1%
Financial net -3 -3 -17 -17
Taxes -20 -20 -105 -106
Net income 59 58 334 334
Earnings per share 1.22 1.22 6.99 6.99
Eng US
16
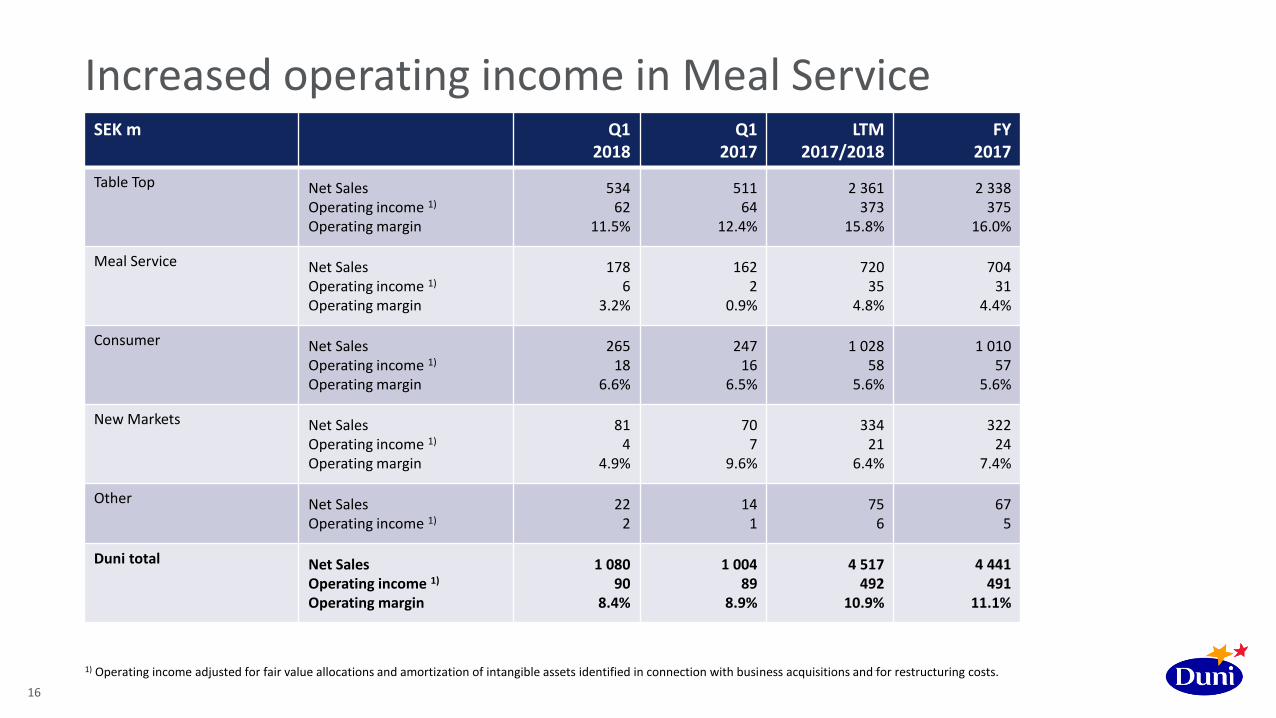
Increased operating income in Meal Service
1) Operating income adjusted for fair value allocations and amortization of intangible assets identified in connection with business acquisitions and for restructuring costs.
SEK m Q1 2018
Q1 2017
LTM2017/2018
FY2017
Table Top Net SalesOperating income 1)
Operating margin
53462
11.5%
51164
12.4%
2 361373
15.8%
2 338375
16.0%
Meal Service Net SalesOperating income 1)
Operating margin
1786
3.2%
1622
0.9%
72035
4.8%
70431
4.4%
Consumer Net SalesOperating income 1)
Operating margin
26518
6.6%
24716
6.5%
1 02858
5.6%
1 01057
5.6%
New Markets Net SalesOperating income 1)
Operating margin
814
4.9%
707
9.6%
33421
6.4%
32224
7.4%
Other Net SalesOperating income 1)
222
141
756
675
Duni total Net SalesOperating income 1)
Operating margin
1 08090
8.4%
1 00489
8.9%
4 517492
10.9%
4 441491
11.1%
Eng US
17
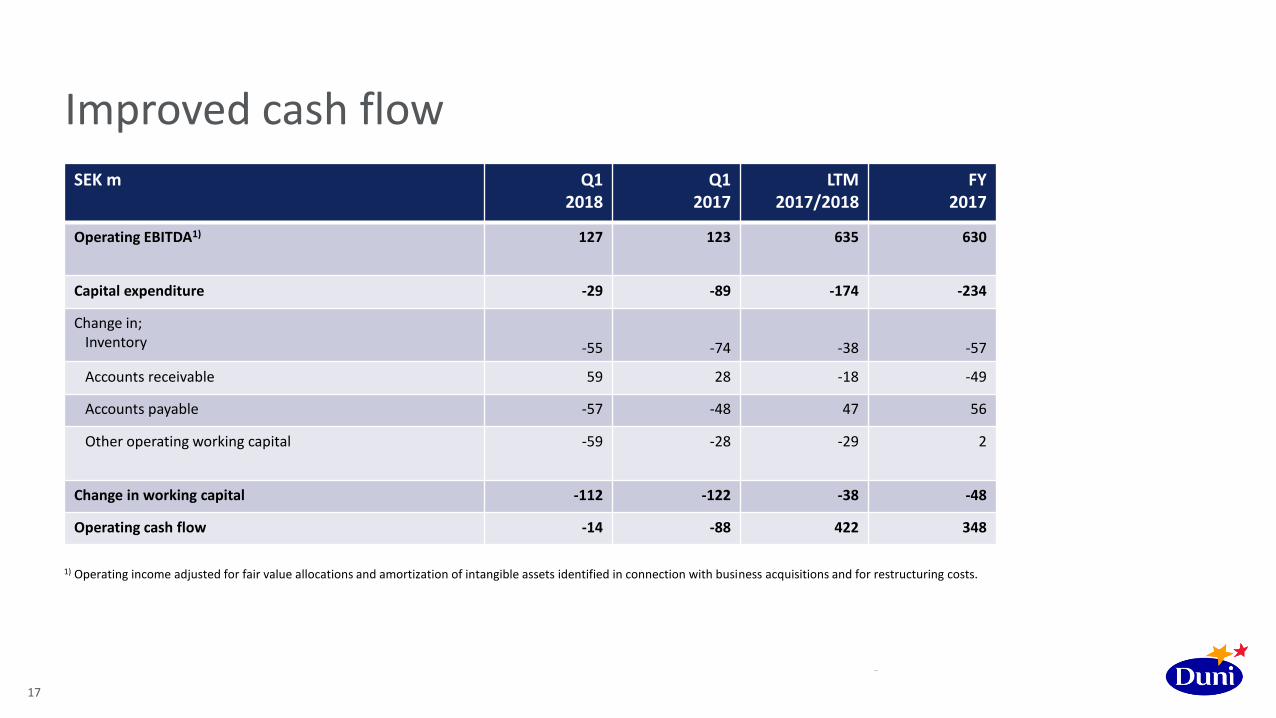
Improved cash flow
1) Operating income adjusted for fair value allocations and amortization of intangible assets identified in connection with business acquisitions and for restructuring costs.
SEK m Q1 2018
Q1 2017
LTM2017/2018
FY2017
Operating EBITDA1) 127 123 635 630
Capital expenditure -29 -89 -174 -234
Change in;Inventory -55 -74 -38 -57
Accounts receivable 59 28 -18 -49
Accounts payable -57 -48 47 56
Other operating working capital -59 -28 -29 2
Change in working capital -112 -122 -38 -48
Operating cash flow -14 -88 422 348

Eng US
18
Financial position
1) Deferred tax assets and liabilities + Income tax receivables and payables.2) Operating income adjusted for fair value allocations and amortization of intangible assets identified in connection with business acquisitions and for restructuring costs. Calculated based on the last twelve months.3) Including restructuring provision and derivatives.
SEK m March 2018 December 2017 March 2017
Goodwill 1 654 1 617 1 580
Tangible and intangible fixed assets 1 410 1 374 1 308
Net financial assets 1) -110 -107 -69
Inventories 712 627 622
Accounts receivable 777 798 703
Accounts payable -385 -428 -326
Other operating assets and liabilities 3) -390 -433 -377
Net assets 3 668 3 449 3 441
Net debt 987 855 887
Equity 2 681 2 594 2 554
Equity and net debt 3 668 3 449 3 441
ROCE 2) 14% 14% 15%
ROCE 2) w/o Goodwill 25% 28% 28%
Net debt / Equity 37% 33% 35%
Net debt / EBITDA 2)1.56 1.36 1.39

Eng US
19
Organic growth of 5% over a business cycle
Consider acquisitions to reach new markets or to strengthen current market positions
Top line growth – premium focus
Improvements in manufacturing, sourcing and logistics
Target at least 40% of net profit
> 5%
> 10%
40+%
Sales growth
Operating margin
Dividend payout ratio
LTM
1.1%at fixed exchange rates,
excluding hygiene business
LTM
10.9%
2017
5.00 SEKper share
Proposal AGM 2018

Thank you!