Embed Size (px)
Citation preview

ADVANTAGE SOLUTIONS, INC.Q1 2021 Earnings Presentation
May 10, 2021

DISCLAIMER
1
Forward Looking Statements
Certain statements in this presentation or accompanying commentary may be considered forward-looking statements with the meaning of federal securities laws. Forward-looking statements generally relate to future events or Advantage’s future financial or operating performance, In some cases, you can identify forward-looking statements by terminology such as “may”, “should”, “expect”, “intend”, “will”, “would”, “estimate”, “anticipate”, “believe”, “predict”, “potential” or “continue”, or the negatives of these terms or variations of them or similar terminology. Such forward- looking statements are predictions, projections and other statements about future events that are based on current expectations and assumptions, and as a result, are subject to risks, uncertainties, and other factors which could cause actual results to differ materially from those expressed or implied by such forward looking statements.
These forward-looking statements are based upon estimates and assumptions that, while considered reasonable by Advantage and its management are inherently uncertain. Factors that may cause actual results to differ materially from current expectations include, but are not limited to, the COVID-19 pandemic and the measures taken in response thereto; the availability, acceptance, administration and effectiveness of any COVID-19 vaccine; changes to labor laws or wage or job classification regulations, including minimum wage, or other market-driven wage changes; Advantage’s ability to continue to generate significant operating cash flow; client procurement strategies and consolidation of Advantage’s clients’ industries creating pressure on the nature and pricing of its services; consumer goods manufacturers and retailers reviewing and changing their sales, retail, marketing, and technology programs and relationships; Advantage’s ability to successfully develop and maintain relevant omni-channel services for our clients in an evolving industry and to otherwise adapt to significant technological change; Advantage’s ability to effectively remediate material weaknesses and maintain proper and effective internal controls in the future; potential and actual harms to Advantage’s business arising from the Take 5 Matter; Advantage’s substantial indebtedness and our ability to refinance at favorable rates; and other risks and uncertainties set forth in the section titled “Risk Factors” in the Annual Report on Form 10-K filed by Advantage with the Securities and Exchange Commission (the “SEC”) on March 16, 2021 and in its other filings made from time to time with the SEC. These filings identify and address other important risks and uncertainties that could cause actual events and results to differ materially from those contained in the forward-looking statements. Forward-looking statements speak only as of the date they are made. Readers are cautioned not to put undue reliance on forward-looking statements, and Advantage assumes no obligation and does not intend to update or revise these forward-looking statements, whether as a result of new information, future events, or otherwise, except as required by law.
Non-GAAP Financial Measure and Related Information
This presentation includes certain financial measures not presented in accordance with generally accepted accounting principles (“GAAP”) including Adjusted EBITDA and Adjusted Net Income. These non-GAAP financial measures are not measures of financial performance in accordance with GAAP and may exclude items that are significant in understanding and assessing the Company’s financial results. Therefore, these measures are in addition to, and not a substitute for or superior to, measures of financial performance prepared in accordance with GAAP, and should not be considered in isolation or as an alternative to net income, cash flows from operations or other measures of profitability, liquidity or performance under GAAP. You should be aware that the Company’s presentation of these measures may not be comparable to similarly-titled measures used by other companies.
The Company believes these non-GAAP measures of financial results provide useful information to management and investors regarding certain financial and business trends relating to the Company’s financial condition and results of operations. The Company believes that the use of Adjusted EBITDA and Adjusted Net Income provides an additional tool for investors to use in evaluating ongoing operating results and trends in and in comparing the Company’s financial measures with other similar companies, many of which present similar non-GAAP financial measures to investors. These non-GAAP financial measures are subject to inherent limitations as they reflect the exercise of judgments by management about which expense and income are excluded or included in determining these non-GAAP financial measures.
Adjusted EBITDA means net income (loss) before (i) interest expense, net, (ii) (benefit from) provision for income taxes, (iii) depreciation, (iv) impairment of goodwill and indefinite-lived assets, (v) amortization of intangible assets, (vi) equity based compensation of Karman Topco L.P. and Advantage’s private equity sponsors’ management fee, (vii) change in fair value of warrant liability, (viii) stock-based compensation expense, (ix) fair value adjustments of contingent consideration related to acquisitions, (x) acquisition-related expenses, (xi) costs associated with COVID-19, net of benefits received, (xii) EBITDA for economic interests in investments, (xiii) restructuring expenses, (xiv) litigation expenses, (xv) (Recovery from) loss on Take 5, (xvi) costs associated with the Take 5 Matter and (xvii) other adjustments that management believes are helpful in evaluating our operating performance.
Adjusted Net Income is a non-GAAP financial measure. Adjusted Net Income means net loss before (i) impairment of goodwill and indefinite-lived assets, (ii) amortization of intangible assets, (iii) equity based compensation of Karman Topco L.P. and Advantage’s private equity sponsors’ management fee, (iv) change in fair value of warrant liability, (v) fair value adjustments of contingent consideration related to acquisitions, (vi) acquisition-related expenses, (vii) costs associated with COVID-19, net of benefits received, (viii) EBITDA for economic interests in investments, (ix) restructuring expenses, (x) litigation expenses, (xi) (Recovery from) loss on Take 5, (xii) deferred financing fees, (xiii) costs associated with the Take 5 Matter, (xiv) other adjustments that management believes are helpful in evaluating our operating performance, and (xv) related tax adjustments.
The Company has presented the financial data for the last twelve-month (“LTM”) period ended March 31, 2021 by adding the unaudited results of operations for the three-month period ended March 31, 2021 to its audited results of operations for the year endedDecember 31, 2020 and then subtracting the unaudited results of operations for the three- month period ended March 31, 2020. The financial data for the LTM period ended March 31, 2021 does not comply with GAAP.
Due to rounding, numbers presented throughout this document may not add up precisely to the totals provided and percentages may not precisely reflect the absolute figures.

KEY MESSAGES
• Delivered results ahead of expectations for the third quarter in a row
• Highly confident in full year Adjusted EBITDA outlook of $515-525 million, despite COVID uncertainty
• Seeing steady recovery in businesses most impacted by COVID, with sampling and demonstration events up 30% m/m from February to March
• Seeing continued strength in at-home consumer goods demand – volume and price
• Excited about acquisition and new business pipelines coming out of the pandemic
• Reinvesting through the P&L to stand up businesses shuttered by COVID – and fuel organic growth
• Working rapidly to resolve technical accounting for warrants
2

IMPROVING TRENDS IN Q1 RESULTS
Note: Please see the appendix for a reconciliation of non-GAAP financial measures to most directly comparable GAAP measures.
3
TotalAdvantage
Sales Segment
MarketingSegment
$106 $111
Q1'20A Q1'21A
Y/Y growth 4.8%
$79 $84
Q1'20A Q1'21A
7.0%
$28 $27
Q1'20A Q1'21A
(1.6%)
Y/Y growth
Y/Y growth
$ in millions.
Adjusted EBITDA
$879 $791
Q1'20A Q1'21A
$508 $534
Q1'20A Q1'21A
$372 $257
Q1'21A Q1'20A
(10.0%)
5.2%
(30.9%)
Y/Y growth
Y/Y growth
Y/Y growth
$ in millions.
Revenues
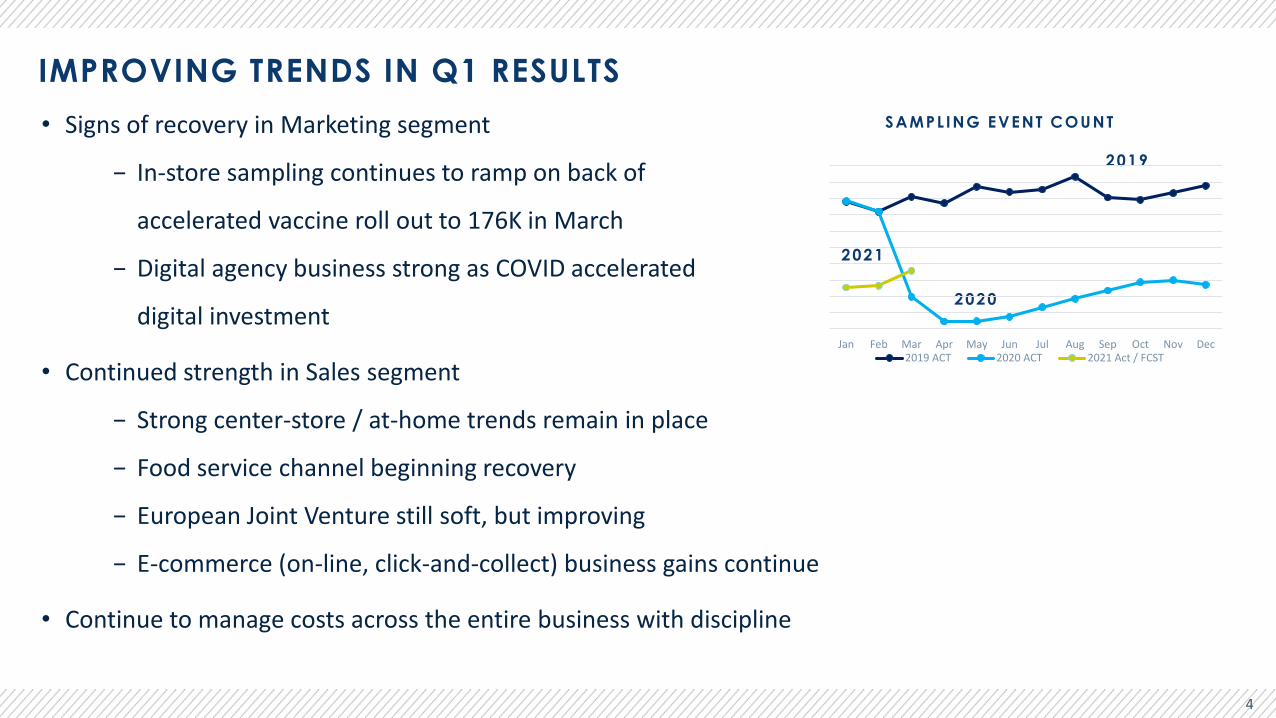
IMPROVING TRENDS IN Q1 RESULTS• Signs of recovery in Marketing segment
− In-store sampling continues to ramp on back of
accelerated vaccine roll out to 176K in March
− Digital agency business strong as COVID accelerated
digital investment
• Continued strength in Sales segment
− Strong center-store / at-home trends remain in place
− Food service channel beginning recovery
− European Joint Venture still soft, but improving
− E-commerce (on-line, click-and-collect) business gains continue
• Continue to manage costs across the entire business with discipline
4
2019
2020
2021
SAMPL ING EVENT COUNT
Jan Feb Mar Apr May Jun Jul Aug Sep Oct Nov Dec2019 ACT 2020 ACT 2021 Act / FCST
PILLARS OF OUR STRATEGY FOR VALUE CREATION
• Operate with excellence by serving existing clients well and delivering productivity through continuous improvement
• Invest wisely in talent, technology and capability to support clients’ evolving needs through attractive opportunities for
− Organic reinvestment
− Disciplined tuck-in acquisitions
• Nurture ‘evolutionary’ culture so that we remain flexible as we build the business to be
− The partner of choice for brands and retailers as their needs change
− Opportunistic when circumstances present us with pitches in our sweet-spot
5

FINANCIAL PERFORMANCE
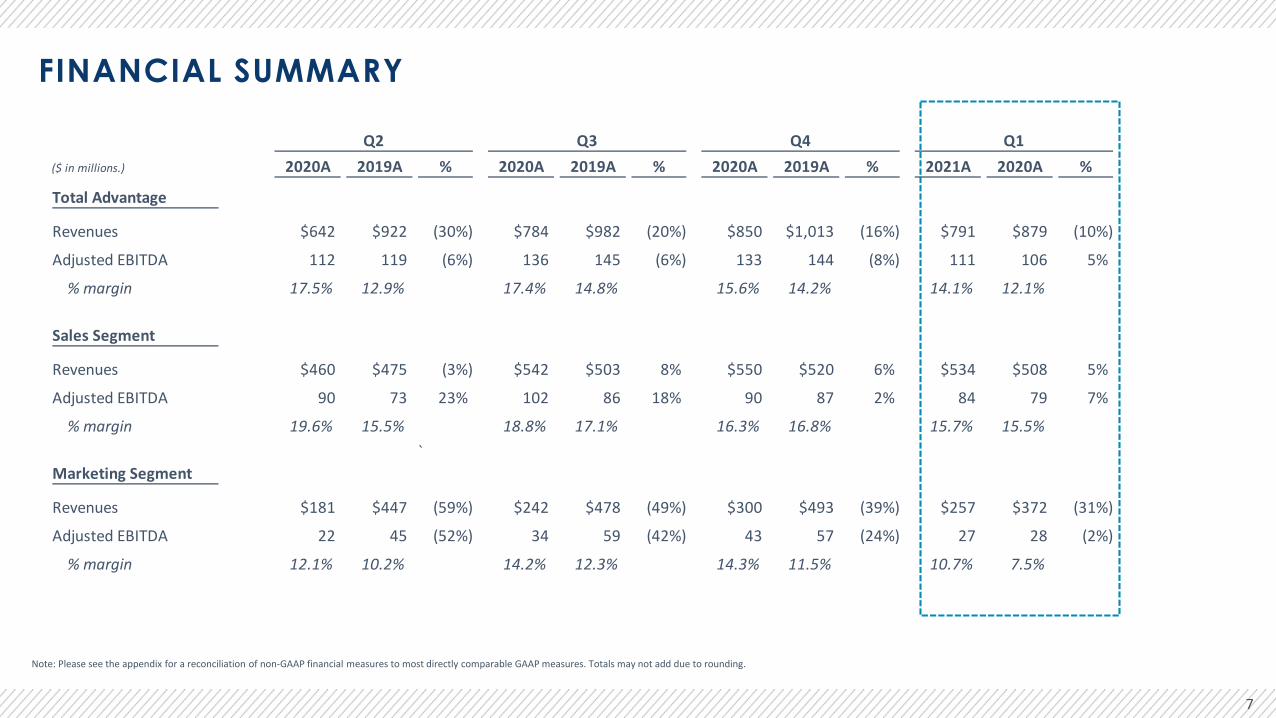
FINANCIAL SUMMARY
Note: Please see the appendix for a reconciliation of non-GAAP financial measures to most directly comparable GAAP measures. Totals may not add due to rounding.
7
Q2 Q3 Q4 Q1($ in millions.) 2020A 2019A % 2020A 2019A % 2020A 2019A % 2021A 2020A %
Total Advantage
Revenues $642 $922 (30%) $784 $982 (20%) $850 $1,013 (16%) $791 $879 (10%)
Adjusted EBITDA 112 119 (6%) 136 145 (6%) 133 144 (8%) 111 106 5%
% margin 17.5% 12.9% 17.4% 14.8% 15.6% 14.2% 14.1% 12.1%
Sales Segment
Revenues $460 $475 (3%) $542 $503 8% $550 $520 6% $534 $508 5%
Adjusted EBITDA 90 73 23% 102 86 18% 90 87 2% 84 79 7%
% margin 19.6% 15.5% 18.8% 17.1% 16.3% 16.8% 15.7% 15.5%`
Marketing Segment
Revenues $181 $447 (59%) $242 $478 (49%) $300 $493 (39%) $257 $372 (31%)
Adjusted EBITDA 22 45 (52%) 34 59 (42%) 43 57 (24%) 27 28 (2%)
% margin 12.1% 10.2% 14.2% 12.3% 14.3% 11.5% 10.7% 7.5%
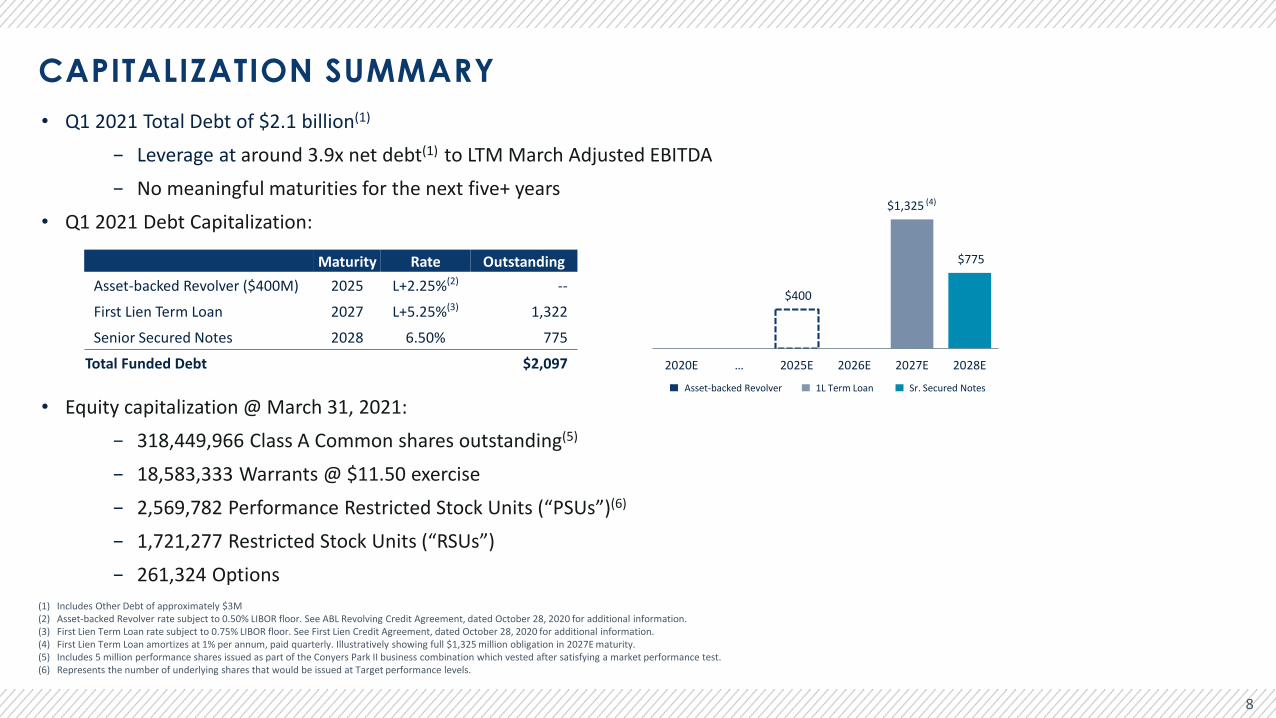
• Q1 2021 Total Debt of $2.1 billion(1)
− Leverage at around 3.9x net debt(1) to LTM March Adjusted EBITDA− No meaningful maturities for the next five+ years
• Q1 2021 Debt Capitalization:
• Equity capitalization @ March 31, 2021:− 318,449,966 Class A Common shares outstanding(5)
− 18,583,333 Warrants @ $11.50 exercise− 2,569,782 Performance Restricted Stock Units (“PSUs”)(6)
− 1,721,277 Restricted Stock Units (“RSUs”)− 261,324 Options
CAPITALIZATION SUMMARY
(1) Includes Other Debt of approximately $3M(2) Asset-backed Revolver rate subject to 0.50% LIBOR floor. See ABL Revolving Credit Agreement, dated October 28, 2020 for additional information.(3) First Lien Term Loan rate subject to 0.75% LIBOR floor. See First Lien Credit Agreement, dated October 28, 2020 for additional information.(4) First Lien Term Loan amortizes at 1% per annum, paid quarterly. Illustratively showing full $1,325 million obligation in 2027E maturity.(5) Includes 5 million performance shares issued as part of the Conyers Park II business combination which vested after satisfying a market performance test.(6) Represents the number of underlying shares that would be issued at Target performance levels.
8
Asset-backed Revolver 1L Term Loan Sr. Secured Notes
$400
$1,325
$775
2020E … 2025E 2026E 2027E 2028E
(4)
Maturity Rate OutstandingAsset-backed Revolver ($400M) 2025 L+2.25%(2) --
First Lien Term Loan 2027 L+5.25%(3) 1,322
Senior Secured Notes 2028 6.50% 775
Total Funded Debt $2,097

OUTLOOK
Highly confident in FY 2021 Outlook:
• FY 2021 Adjusted EBITDA of $515-525 million
• Q2 headwinds from Marketing segment reinvestment and Sales segment pantry loading comp
• COVID recovery back-half weighted
• Net Debt / Adjusted EBITDA trending downwards in 2021, toward 3.0x by end of 2022
• Planning to invest in promising medium-term opportunities through the P&L in FY 2021
9

THANK YOU
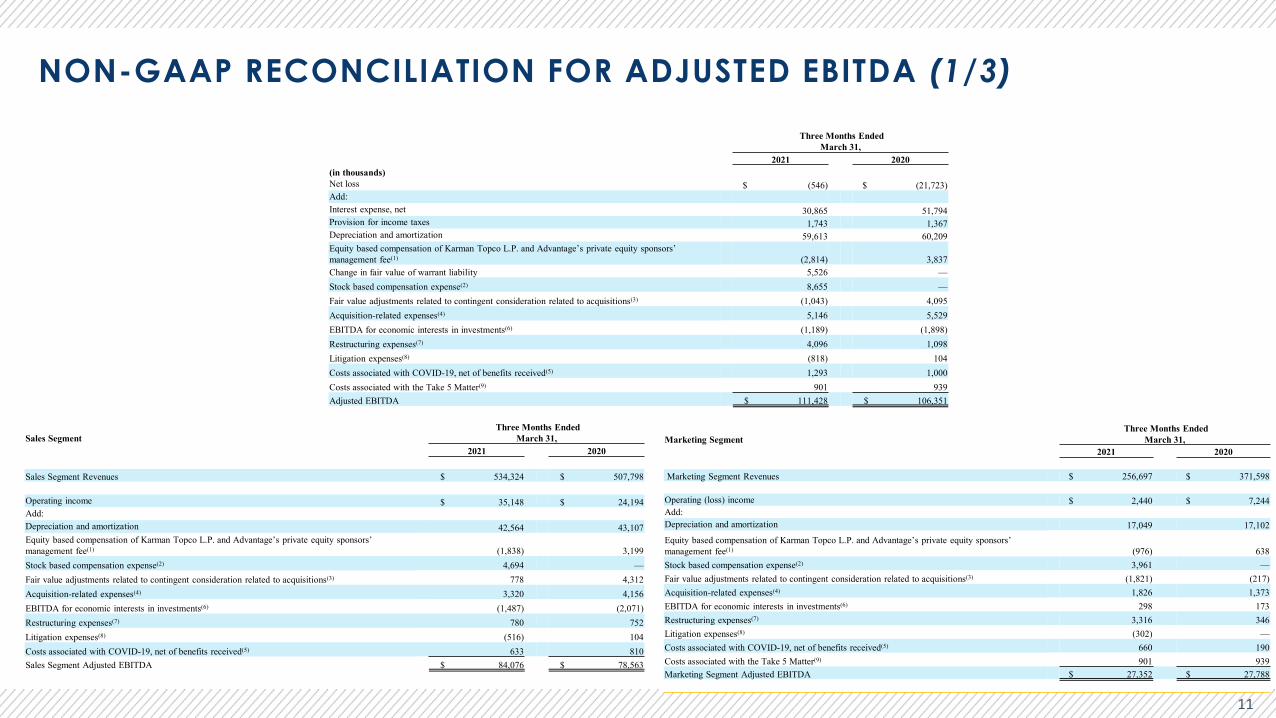
NON-GAAP RECONCILIATION FOR ADJUSTED EBITDA (1/3)
11
Sales SegmentThree Months Ended
March 31, 2021 2020
Sales Segment Revenues $ 534,324 $ 507,798
Operating income $ 35,148 $ 24,194 Add:Depreciation and amortization 42,564 43,107 Equity based compensation of Karman Topco L.P. and Advantage’s private equity sponsors’ management fee(1) (1,838) 3,199 Stock based compensation expense(2) 4,694 —Fair value adjustments related to contingent consideration related to acquisitions(3) 778 4,312 Acquisition-related expenses(4) 3,320 4,156 EBITDA for economic interests in investments(6) (1,487) (2,071)Restructuring expenses(7) 780 752 Litigation expenses(8) (516) 104 Costs associated with COVID-19, net of benefits received(5) 633 810 Sales Segment Adjusted EBITDA $ 84,076 $ 78,563
Three Months EndedMarch 31,
2021 2020(in thousands)Net loss $ (546) $ (21,723)Add:Interest expense, net 30,865 51,794 Provision for income taxes 1,743 1,367 Depreciation and amortization 59,613 60,209 Equity based compensation of Karman Topco L.P. and Advantage’s private equity sponsors’ management fee(1) (2,814) 3,837 Change in fair value of warrant liability 5,526 —Stock based compensation expense(2) 8,655 —Fair value adjustments related to contingent consideration related to acquisitions(3) (1,043) 4,095 Acquisition-related expenses(4) 5,146 5,529 EBITDA for economic interests in investments(6) (1,189) (1,898)Restructuring expenses(7) 4,096 1,098 Litigation expenses(8) (818) 104 Costs associated with COVID-19, net of benefits received(5) 1,293 1,000 Costs associated with the Take 5 Matter(9) 901 939 Adjusted EBITDA $ 111,428 $ 106,351
Marketing SegmentThree Months Ended
March 31, 2021 2020
Marketing Segment Revenues $ 256,697 $ 371,598
Operating (loss) income $ 2,440 $ 7,244 Add:Depreciation and amortization 17,049 17,102 Equity based compensation of Karman Topco L.P. and Advantage’s private equity sponsors’ management fee(1) (976) 638 Stock based compensation expense(2) 3,961 —Fair value adjustments related to contingent consideration related to acquisitions(3) (1,821) (217)Acquisition-related expenses(4) 1,826 1,373 EBITDA for economic interests in investments(6) 298 173 Restructuring expenses(7) 3,316 346 Litigation expenses(8) (302) —Costs associated with COVID-19, net of benefits received(5) 660 190 Costs associated with the Take 5 Matter(9) 901 939 Marketing Segment Adjusted EBITDA $ 27,352 $ 27,788

NON-GAAP RECONCILIATION FOR HISTORICAL PERIODS (2/3)
12
(in millions) March 31, 2021Current portion of long-term debt $ 13.3Long-term debt, net of current portion 2,028.1Total Debt 2,041.4Less: Debt issuance costs (58.3)Cash and cash equivalents 156.4
Total Net Debt (11) $ 1,943.3
Three Months EndedMarch 31,
2021 2020
Net loss $ (546) $ (21,723)Less: Net loss attributable to noncontrolling interest (430) (15)Add:
Equity based compensation of Karman Topco L.P. and Advantage’s private equity sponsors’ management fee(1) (2,814) 3,837 Change in fair value of warrant liability 5,526 —Fair value adjustments related to contingent consideration related to acquisitions(3) (1,043) 4,095 Acquisition-related expenses(4) 5,146 5,529 Restructuring expenses(7) 4,096 1,098 Litigation expenses(8) (818) 104 Amortization of intangible assets 49,438 47,846 Costs associated with COVID-19, net of benefits received(5) 1,293 1,000 Costs associated with the Take 5 Matter(9) 901 939 Tax adjustments related to non-GAAP adjustments(10) (15,345) (15,891)Adjusted Net Income $ 46,264 $ 26,849
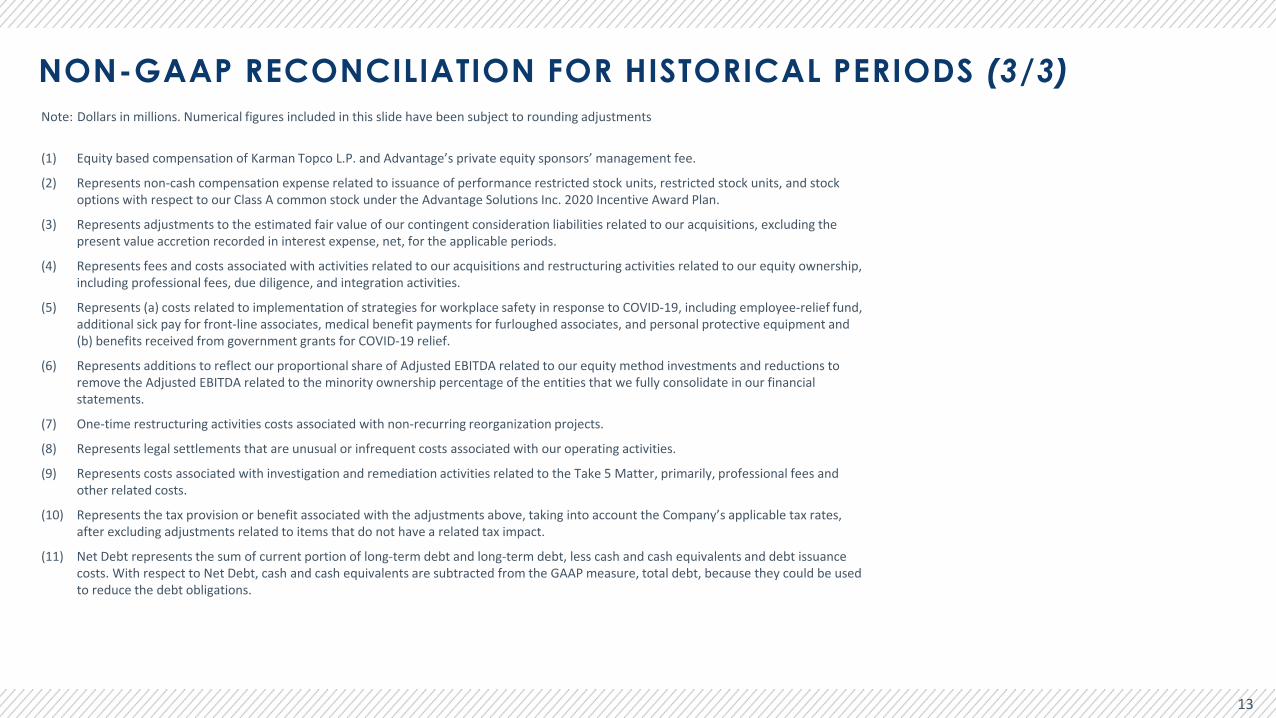
NON-GAAP RECONCILIATION FOR HISTORICAL PERIODS (3/3)Note: Dollars in millions. Numerical figures included in this slide have been subject to rounding adjustments
(1) Equity based compensation of Karman Topco L.P. and Advantage’s private equity sponsors’ management fee.
(2) Represents non-cash compensation expense related to issuance of performance restricted stock units, restricted stock units, and stock options with respect to our Class A common stock under the Advantage Solutions Inc. 2020 Incentive Award Plan.
(3) Represents adjustments to the estimated fair value of our contingent consideration liabilities related to our acquisitions, excluding the present value accretion recorded in interest expense, net, for the applicable periods.
(4) Represents fees and costs associated with activities related to our acquisitions and restructuring activities related to our equity ownership, including professional fees, due diligence, and integration activities.
(5) Represents (a) costs related to implementation of strategies for workplace safety in response to COVID-19, including employee-relief fund, additional sick pay for front-line associates, medical benefit payments for furloughed associates, and personal protective equipment and (b) benefits received from government grants for COVID-19 relief.
(6) Represents additions to reflect our proportional share of Adjusted EBITDA related to our equity method investments and reductions to remove the Adjusted EBITDA related to the minority ownership percentage of the entities that we fully consolidate in our financial statements.
(7) One-time restructuring activities costs associated with non-recurring reorganization projects.
(8) Represents legal settlements that are unusual or infrequent costs associated with our operating activities.
(9) Represents costs associated with investigation and remediation activities related to the Take 5 Matter, primarily, professional fees and other related costs.
(10) Represents the tax provision or benefit associated with the adjustments above, taking into account the Company’s applicable tax rates, after excluding adjustments related to items that do not have a related tax impact.
(11) Net Debt represents the sum of current portion of long-term debt and long-term debt, less cash and cash equivalents and debt issuance costs. With respect to Net Debt, cash and cash equivalents are subtracted from the GAAP measure, total debt, because they could be used to reduce the debt obligations.
13