Embed Size (px)
Citation preview
Python Tips for Data Scientist
Wenqiang Feng, Xu Gao and Upendra Madam
June 26, 2019


CONTENTS
1 Preface 31.1 About . . . . . . . . . . . . . . . . . . . . . . . . . . . . . . . . . . . . . . . . . 3
1.1.1 About this note . . . . . . . . . . . . . . . . . . . . . . . . . . . . . . . 31.1.2 About the authors . . . . . . . . . . . . . . . . . . . . . . . . . . . . . . 3
1.2 Motivation for this note . . . . . . . . . . . . . . . . . . . . . . . . . . . . . . . 41.3 Feedback and suggestions . . . . . . . . . . . . . . . . . . . . . . . . . . . . . . 5
2 Python Installation 7
3 Notebooks 93.1 Nteract . . . . . . . . . . . . . . . . . . . . . . . . . . . . . . . . . . . . . . . . 93.2 Jupyter Notebook Viewer . . . . . . . . . . . . . . . . . . . . . . . . . . . . . . 93.3 Apache Zeppelin . . . . . . . . . . . . . . . . . . . . . . . . . . . . . . . . . . . 93.4 Jupyter Notebook . . . . . . . . . . . . . . . . . . . . . . . . . . . . . . . . . . . 13
4 Confidential Information 15
5 Primer Functions 175.1 * . . . . . . . . . . . . . . . . . . . . . . . . . . . . . . . . . . . . . . . . . . . 175.2 range . . . . . . . . . . . . . . . . . . . . . . . . . . . . . . . . . . . . . . . . 175.3 random . . . . . . . . . . . . . . . . . . . . . . . . . . . . . . . . . . . . . . . 18
5.3.1 random.random . . . . . . . . . . . . . . . . . . . . . . . . . . . . . 185.3.2 np.random . . . . . . . . . . . . . . . . . . . . . . . . . . . . . . . . 18
5.4 round . . . . . . . . . . . . . . . . . . . . . . . . . . . . . . . . . . . . . . . . 195.5 TODO.. . . . . . . . . . . . . . . . . . . . . . . . . . . . . . . . . . . . . . . . . 19
6 Data Structures 216.1 List . . . . . . . . . . . . . . . . . . . . . . . . . . . . . . . . . . . . . . . . . . 21
6.1.1 Create list . . . . . . . . . . . . . . . . . . . . . . . . . . . . . . . . . . 216.1.2 Unpack list . . . . . . . . . . . . . . . . . . . . . . . . . . . . . . . . . 226.1.3 Methods of list objects . . . . . . . . . . . . . . . . . . . . . . . . . . . 22
6.2 Tuple . . . . . . . . . . . . . . . . . . . . . . . . . . . . . . . . . . . . . . . . . 236.3 Dictionary . . . . . . . . . . . . . . . . . . . . . . . . . . . . . . . . . . . . . . 23
i

6.3.1 Create dict from lists . . . . . . . . . . . . . . . . . . . . . . . . . . . 236.3.2 dict.get() . . . . . . . . . . . . . . . . . . . . . . . . . . . . . . . 246.3.3 Looping Techniques . . . . . . . . . . . . . . . . . . . . . . . . . . . . 246.3.4 Update Values in Dict . . . . . . . . . . . . . . . . . . . . . . . . . . . . 256.3.5 Update Keys in Dict . . . . . . . . . . . . . . . . . . . . . . . . . . . . 25
6.4 One line if-else statement . . . . . . . . . . . . . . . . . . . . . . . . . . . . . . 266.4.1 With filter . . . . . . . . . . . . . . . . . . . . . . . . . . . . . . . . . . 266.4.2 Without filter . . . . . . . . . . . . . . . . . . . . . . . . . . . . . . . . 26
7 Data Read and Ingestion with DataBase 297.1 Data Ingestion from Local to DataBase . . . . . . . . . . . . . . . . . . . . . . . 297.2 Data Read from DataBase to Local . . . . . . . . . . . . . . . . . . . . . . . . . 307.3 Hive and Impala Tabel Ingestion . . . . . . . . . . . . . . . . . . . . . . . . . . . 31
8 pd.DataFrame manipulation 338.1 TODO.. . . . . . . . . . . . . . . . . . . . . . . . . . . . . . . . . . . . . . . . . 33
9 rdd.DataFrame manipulation 359.1 TODO.. . . . . . . . . . . . . . . . . . . . . . . . . . . . . . . . . . . . . . . . . 35
10 pd.DataFrame vs pd.DataFrame 3710.1 Create DataFrame . . . . . . . . . . . . . . . . . . . . . . . . . . . . . . . . . . 37
10.1.1 From List . . . . . . . . . . . . . . . . . . . . . . . . . . . . . . . . . . 3710.1.2 From Dict . . . . . . . . . . . . . . . . . . . . . . . . . . . . . . . . . . 38
10.2 Load DataFrame . . . . . . . . . . . . . . . . . . . . . . . . . . . . . . . . . . . 3810.2.1 From DataBase . . . . . . . . . . . . . . . . . . . . . . . . . . . . . . . 3810.2.2 From .csv . . . . . . . . . . . . . . . . . . . . . . . . . . . . . . . . . 3910.2.3 From .json . . . . . . . . . . . . . . . . . . . . . . . . . . . . . . . . 40
10.3 First n Rows . . . . . . . . . . . . . . . . . . . . . . . . . . . . . . . . . . . . . 4110.4 Column Names . . . . . . . . . . . . . . . . . . . . . . . . . . . . . . . . . . . . 4110.5 Data types . . . . . . . . . . . . . . . . . . . . . . . . . . . . . . . . . . . . . . 4110.6 Replace Data types . . . . . . . . . . . . . . . . . . . . . . . . . . . . . . . . . . 4210.7 Fill Null . . . . . . . . . . . . . . . . . . . . . . . . . . . . . . . . . . . . . . . 4310.8 Replace Values . . . . . . . . . . . . . . . . . . . . . . . . . . . . . . . . . . . . 4310.9 Rename Columns . . . . . . . . . . . . . . . . . . . . . . . . . . . . . . . . . . . 44
10.9.1 Rename all columns . . . . . . . . . . . . . . . . . . . . . . . . . . . . 4410.9.2 Rename one or more columns . . . . . . . . . . . . . . . . . . . . . . . 44
10.10 Drop Columns . . . . . . . . . . . . . . . . . . . . . . . . . . . . . . . . . . . . 4510.11 Filter . . . . . . . . . . . . . . . . . . . . . . . . . . . . . . . . . . . . . . . . . 4610.12 With New Column . . . . . . . . . . . . . . . . . . . . . . . . . . . . . . . . . . 4710.13 Join . . . . . . . . . . . . . . . . . . . . . . . . . . . . . . . . . . . . . . . . . . 50
10.13.1 Left Join . . . . . . . . . . . . . . . . . . . . . . . . . . . . . . . . . . . 5010.13.2 Right Join . . . . . . . . . . . . . . . . . . . . . . . . . . . . . . . . . . 5110.13.3 Inner Join . . . . . . . . . . . . . . . . . . . . . . . . . . . . . . . . . . 5110.13.4 Full Join . . . . . . . . . . . . . . . . . . . . . . . . . . . . . . . . . . . 52
ii

10.14 Concat Columns . . . . . . . . . . . . . . . . . . . . . . . . . . . . . . . . . . . 5310.15 GroupBy . . . . . . . . . . . . . . . . . . . . . . . . . . . . . . . . . . . . . . . 5310.16 Pivot . . . . . . . . . . . . . . . . . . . . . . . . . . . . . . . . . . . . . . . . . 5410.17 Unixtime to Date . . . . . . . . . . . . . . . . . . . . . . . . . . . . . . . . . . . 54
11 Kaggle Competitions 5711.1 TODO.. . . . . . . . . . . . . . . . . . . . . . . . . . . . . . . . . . . . . . . . . 57
12 Package Wrapper 5912.1 Hierarchical Structure . . . . . . . . . . . . . . . . . . . . . . . . . . . . . . . . 5912.2 Set Up . . . . . . . . . . . . . . . . . . . . . . . . . . . . . . . . . . . . . . . . 5912.3 Requirements . . . . . . . . . . . . . . . . . . . . . . . . . . . . . . . . . . . . . 6012.4 ReadMe . . . . . . . . . . . . . . . . . . . . . . . . . . . . . . . . . . . . . . . . 61
13 Publish Package to PyPI 6313.1 Register PyPI account . . . . . . . . . . . . . . . . . . . . . . . . . . . . . . . . 6313.2 Install twine . . . . . . . . . . . . . . . . . . . . . . . . . . . . . . . . . . . . 6313.3 Build Your Package . . . . . . . . . . . . . . . . . . . . . . . . . . . . . . . . . 6313.4 Upload Your Package . . . . . . . . . . . . . . . . . . . . . . . . . . . . . . . . 6413.5 Package at PyPI . . . . . . . . . . . . . . . . . . . . . . . . . . . . . . . . . . . 64
14 Model Deployment with Flask 6514.1 Install flask . . . . . . . . . . . . . . . . . . . . . . . . . . . . . . . . . . . . 6514.2 Train and Save your model . . . . . . . . . . . . . . . . . . . . . . . . . . . . . . 6514.3 Deplyment with Flask . . . . . . . . . . . . . . . . . . . . . . . . . . . . . . . . 6814.4 Lunch your app on server . . . . . . . . . . . . . . . . . . . . . . . . . . . . . . 70
14.4.1 1. Lunch the APP . . . . . . . . . . . . . . . . . . . . . . . . . . . . . . 7014.4.2 2. Run the APP . . . . . . . . . . . . . . . . . . . . . . . . . . . . . . . 70
15 API Book 7115.1 Basics Module . . . . . . . . . . . . . . . . . . . . . . . . . . . . . . . . . . . . 71
15.1.1 rnorm . . . . . . . . . . . . . . . . . . . . . . . . . . . . . . . . . . . 7115.1.2 dnorm . . . . . . . . . . . . . . . . . . . . . . . . . . . . . . . . . . . 7115.1.3 runif . . . . . . . . . . . . . . . . . . . . . . . . . . . . . . . . . . . 72
15.2 Tests Module . . . . . . . . . . . . . . . . . . . . . . . . . . . . . . . . . . . . . 7215.2.1 T-test . . . . . . . . . . . . . . . . . . . . . . . . . . . . . . . . . . . 72
16 Main Reference 75
Bibliography 77
Python Module Index 79
Index 81
iii

iv

Python Tips for Data Scientist
Welcome to my Python Tips for Data Scientist notes! In those notes, you will learn some usefultips for Data Scientist daily work. The PDF version can be downloaded from HERE.
CONTENTS 1

Python Tips for Data Scientist
2 CONTENTS

CHAPTER
ONE
PREFACE
Chinese proverb
The palest ink is better than the best memory. – old Chinese proverb
1.1 About
1.1.1 About this note
This document is a summary of our valueable experiences in using Python for DataScientist daily work. The PDF version can be downloaded from HERE.
You may download and distribute it. Please be aware, however, that the note contains typosas well as inaccurate or incorrect description.
In this repository, we try to use the detailed Data Scientist related demo code and examplesto share some useful python tips for Data Scientist work. If you find your work wasn’t cited in thisnote, please feel free to let me know.
Although we are by no means a python programming and Data Scientist expert, We decided thatit would be useful for us to share what we learned about Python in the form of easy note withdetailed example. We hope those notes will be a valuable tool for your studies.
The notes assume that the reader has a preliminary knowledge of python programing, LaTexand Linux. And this document is generated automatically by using sphinx. More details can befound at [Georg2018].
1.1.2 About the authors
• Wenqiang Feng
– Data Scientist and PhD in Mathematics
3
Python Tips for Data Scientist
– University of Tennessee, Knoxville
– Webpage: http://web.utk.edu/~wfeng1
– Email: [email protected]
• Xu Gao
– Data Scientist/Quantitative Analyst and PhD in Statistics
– Statistics, University of California, Irvine
– Webpage: https://sites.google.com/view/xugao
– Email: [email protected], [email protected]
• Upendra Madam
– Senior Data Engineer
– Computer and Information Sciences
– University of Texas, Arlington
– Email: [email protected]
• Declaration
The work of Wenqiang Feng was supported by the IMA, while working at IMA. However,any opinion, finding, and conclusions or recommendations expressed in this material arethose of the authors and do not necessarily reflect the views of the IMA, UTK, UCI, DSTand Google.
1.2 Motivation for this note
No matter you like it or not, Python has been one of the most popular programming languages. Ihave been using Python for almost 4 years. Frankly speaking, I wasn’t impressed and attracted byPython at the first using. After starting working in industry, I have to use Python. Graduately Irecognize the elegance of Python and use it as one of my main programming language. But I foudthat:
• Most of the Python books or tutorials which emphasize on programming will overwhelmethe green hand.
• While most of the Python books or tutorials for Data Scientist or DataAnalysis didn’t cover some essential skills from the engineer side.
So I want to keep some of my valuable tips which are heavily applied in my daily work.
4 Chapter 1. Preface

Python Tips for Data Scientist
1.3 Feedback and suggestions
Your comments and suggestions are highly appreciated. I am more than happy to receive cor-rections, suggestions or feedbacks through email (Wenqiang Feng: [email protected], XuGao:[email protected]) for improvements.
1.3. Feedback and suggestions 5

Python Tips for Data Scientist
6 Chapter 1. Preface

CHAPTER
TWO
PYTHON INSTALLATION
Note: This Chapter Python Installation is for beginner. If you have some Python programmingexperience, you may skip this chapter.
No matter what operator system is, I will strongly recommend you to install Anaconda whichcontains Python, Jupyter, spyder, Numpy, Scipy, Numba, pandas, DASK, Bokeh,HoloViews, Datashader, matplotlib, scikit-learn, H2O.ai, TensorFlow,CONDA and more.
Download link: https://www.anaconda.com/distribution/
7

Python Tips for Data Scientist
8 Chapter 2. Python Installation

CHAPTER
THREE
NOTEBOOKS
Note: This Chapter Notebooks is for beginner. If you have alreay know Nteract, Zeppelinand Python, you may skip this chapter.
If you are a Data Scientist, it’s not enough to just know Jupyter Notebook. You should alsotake a look at nbviewer, Nteract and Zeppelin notebooks.
3.1 Nteract
Nteract is an amazing .ipynb reader. You can open and run the .ipynb by just doubleclicking the .ipynb file.
Download from: https://nteract.io/
3.2 Jupyter Notebook Viewer
If you are a MAC user, you can also install the Jupyter Notebook Viewer –nbviewer-appwhichis much faster than Nteract.
Download from: https://github.com/tuxu/nbviewer-app
3.3 Apache Zeppelin
The Zeppelin (Apache Zeppelin) is an open-source Web-based notebook that enables data-driven, interactive data analytics and collaborative documents with Python, PySpark, SQL,Scala and more.
Download from: https://zeppelin.apache.org/
9

Python Tips for Data Scientist
10 Chapter 3. Notebooks

Python Tips for Data Scientist
3.3. Apache Zeppelin 11

Python Tips for Data Scientist
12 Chapter 3. Notebooks
Python Tips for Data Scientist
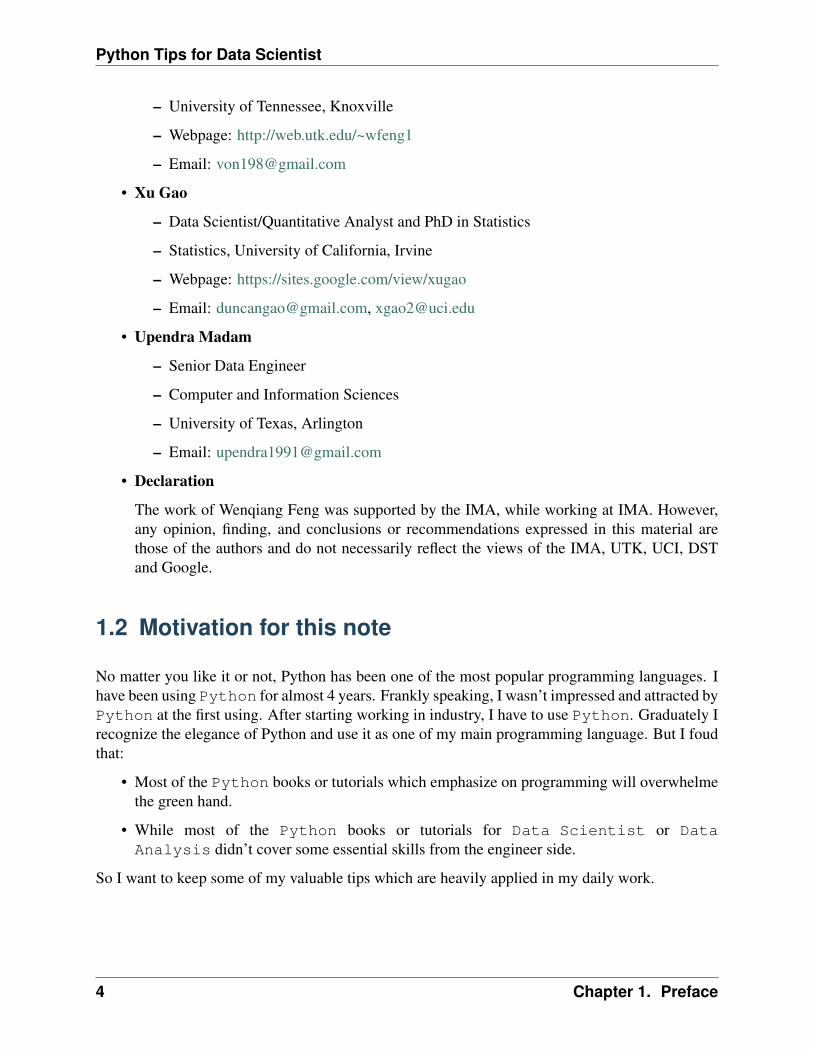
3.4 Jupyter Notebook
The Jupyter Notebook (Ipython Notebook) is an open-source web application that allowsyou to create and share documents that contain live code, equations, visualizationsand narrative text. Uses include: data cleaning and transformation, numerical simulation,statistical modeling, data visualization, machine learning, and much more.
3.4. Jupyter Notebook 13

Python Tips for Data Scientist
14 Chapter 3. Notebooks

CHAPTER
FOUR
CONFIDENTIAL INFORMATION
Chinese proverb
Be mindful of guarding against harm from others, and stay away from placing harming upon others.
If you are a real Data Scientist, you have to share your code with your colleagues or release yourcode for Code Review or Quality assurance(QA). You will definitely do not want to have yourUser Information in the code. So you can save them in login.txt in a safe folder:
runawayhorse001PythonTips
and use the following code to import your User Information:
#User Informationtry:
login = pd.read_csv(r'login.txt', header=None)user = login[0][0]pw = login[0][1]print('User information is ready!')
except:print('Login information is not available!!!')
You may also want to get the User Information by using os.environ in Python:
try:user = os.environ['LOGNAME']
except OSError:user = os.environ['USER']
except OSError:user = os.environ['USERNAME']print(err)
except OSError as err:print('The user information is not available!!!')
15

Python Tips for Data Scientist
16 Chapter 4. Confidential Information

CHAPTER
FIVE
PRIMER FUNCTIONS
Note: This Chapter Primer Functions is for beginner. If you have some Python programmingexperience, you may skip this chapter.
The following functions have been heavily used in my daily Data Scientist work.
5.1 *
Single asterisk as used in function declaration allows variable number of arguments passed fromcalling environment. Inside the function it behaves as a tuple.
:: Python Code:
my_list = [1,2,3]print(my_list)print(*my_list)
:: Ouput:
[1, 2, 3]1 2 3
5.2 range
:: Python Code:
print(range(5))print(*range(5))print(*range(3,8))
17

Python Tips for Data Scientist
:: Ouput:
range(0, 5)0 1 2 3 43 4 5 6 7
5.3 random
More details can be found at:
a. random: https://docs.python.org/3/library/random.html#random.randint
b. np.random: https://docs.scipy.org/doc/numpy/reference/routines.random.html
5.3.1 random.random
:: Python Code:
import randomrandom.random()
# (b - a) * random() + arandom.uniform(3,8)
:: Ouput:
0.338440512430736257.772024014335885
5.3.2 np.random
:: Python Code:
np.random.random_sample()np.random.random_sample(4)np.random.random_sample([2,4])
# (b - a) * random_sample() + aa = 3; b = 8(b-a)*np.random.random_sample([2,4])+a
:: Ouput:
18 Chapter 5. Primer Functions

Python Tips for Data Scientist
0.11919402208670005array([0.07384755, 0.9005251 , 0.30030561, 0.38221819])array([[0.76851156, 0.56973309, 0.47074505, 0.7814957 ],
[0.5778028 , 0.94653057, 0.51193493, 0.48693931]])
array([[4.65799262, 6.32702018, 6.55545234, 5.45877784],[7.69941994, 4.68709357, 5.49790728, 4.60913966]])
5.4 round
Sometimes, we really do not need the scientific decimals for output results. So you can use thisfunction to round an array to the given number of decimals.
:: Python Code:
np.round(np.random.random_sample([2,4]),2)
:: Ouput:
array([[0.76, 0.06, 0.41, 0.4 ],[0.07, 0.51, 0.84, 0.76]])
5.5 TODO..
:: Python Code:
:: Ouput:
:: Python Code:
:: Ouput:
:: Python Code:
5.4. round 19

Python Tips for Data Scientist
:: Ouput:
:: Python Code:
:: Ouput:
20 Chapter 5. Primer Functions

CHAPTER
SIX
DATA STRUCTURES
Note: This Chapter Data Structures is for beginner. If you have some Python programmingexperience, you may skip this chapter.
6.1 List
list is one of data sctructures which is heavily using in my daily work.
6.1.1 Create list
1. Create empty list
The empty list is used to initialize a list.
:: Python Code:
my_list = []type(my_list)
:: Ouput:
list
I applied the empty list to initialize my silhouette score list when I try to find the optimalnumber of the clusters.
:: Example:
min_cluster = 3max_cluster =8
(continues on next page)
21

Python Tips for Data Scientist
(continued from previous page)
# silhouette_scorescores = []
for i in range(min_cluster, max_cluster):score = np.round(np.random.random_sample(),2)scores.append(score)
print(scores)
:: Ouput:
[0.16, 0.2, 0.3, 0.87, 0.59]
6.1.2 Unpack list
:: Example:
num = [1,2,3,4,5,6,7,8,9,10]print(*num)
:: Ouput:
1 2 3 4 5 6 7 8 9 10
6.1.3 Methods of list objects
Methods of list objects:
Name Descriptionlist. append(x) Add an item to the end of the listlist. extend(iterable) Extend the list by appending alllist. insert(i, x) Insert an item at a given positionlist. remove(x) Remove the first itemlist. pop([i]) Remove the item at given positionlist. clear() Remove all items from the listlist. index(x[,s[,e]]) Return zero-based index in the listlist. count(x) Return the number of times xlist. sort(key,reverse) Sort the items of the listlist. reverse() Reverse the elements of the listlist. copy() Return a shallow copy1 of list
1 Shallow Copy vs Deep Copy Reference: https://stackoverflow.com/posts/184780/revisions
22 Chapter 6. Data Structures

Python Tips for Data Scientist
6.2 Tuple
A tuple is an assortment of data, separated by commas, which makes it similar to the Python list,but a tuple is fundamentally different in that a tuple is “immutable.” This means that it cannot bechanged, modified, or manipulated.
6.3 Dictionary
dict is one of another data sctructures which is heavily using in my daily work. I heavily appliedthe dict in my PyAudit package, more details can be found at PyAudit.
6.3.1 Create dict from lists
:: Example:
Shallow copy:
The variables A and B refer to different areas of memory, when B is assigned to A the two variables refer to thesame area of memory. Later modifications to the contents of either are instantly reflected in the contents of other, asthey share contents.
Deep Copy:
The variables A and B refer to different areas of memory, when B is assigned to A the values in the memory areawhich A points to are copied into the memory area to which B points. Later modifications to the contents of eitherremain unique to A or B; the contents are not shared.
6.2. Tuple 23

Python Tips for Data Scientist
col_names = ['name','Age', 'Sex', 'Car']col_values = ['Michael', '30', 'Male', ['Honda','Tesla']]#d = {key: value for key, value in zip(col_names, col_values)}print(d)#import pandas as pd
df = pd.DataFrame(d)print(df)
:: Ouput:
{'name': 'Michael', 'Age': '30', 'Sex': 'Male', 'Car': ['Honda→˓', 'Tesla']}
name Age Sex Car0 Michael 30 Male Honda1 Michael 30 Male Tesla
6.3.2 dict.get()
When get() is called, Python checks if the specified key exists in the dict. If it does, then get()returns the value of that key. If the key does not exist, then get() returns the value specified inthe second argument to get(). A good application of get() can be found at Update Keys inDict.
:: Example:
data1 = d.get("name", "best")data2 = d.get("names", "George")print(data1) # Michaelprint(data2) # George
:: Ouput:
MichaelGeorge
6.3.3 Looping Techniques
:: Example:
print([(key, val) for key, val in d.items()])
24 Chapter 6. Data Structures

Python Tips for Data Scientist
:: Ouput:
[('name', 'Michael'), ('Age', '30'), ('Sex', 'Male'), ('Car',→˓['Honda', 'Tesla'])]
6.3.4 Update Values in Dict
1. Replace values in dict
:: Example:
replace = {'Car': ['Tesla S', 'Tesla X']}print(d)d.update(replace)print(d)
:: Ouput:
{'name': 'Michael', 'Age': '30', 'Sex': 'Male', 'Car→˓': ['Honda', 'Tesla']}{'name': 'Michael', 'Age': '30', 'Sex': 'Male', 'Car→˓': ['Tesla S', 'Tesla X']}
2. Add key and values in dict
:: Example:
# add key and values in dictadded = {'Kid': ['Tom', 'Jim']}print(d)d.update(added)print(d)
:: Ouput:
{'name': 'Michael', 'Age': '30', 'Sex': 'Male', 'Car→˓': ['Tesla S', 'Tesla X']}{'name': 'Michael', 'Age': '30', 'Sex': 'Male', 'Car→˓': ['Tesla S', 'Tesla X'], 'Kid': ['Tom', 'Jim']}
6.3.5 Update Keys in Dict
:: Example:
6.3. Dictionary 25
Python Tips for Data Scientist
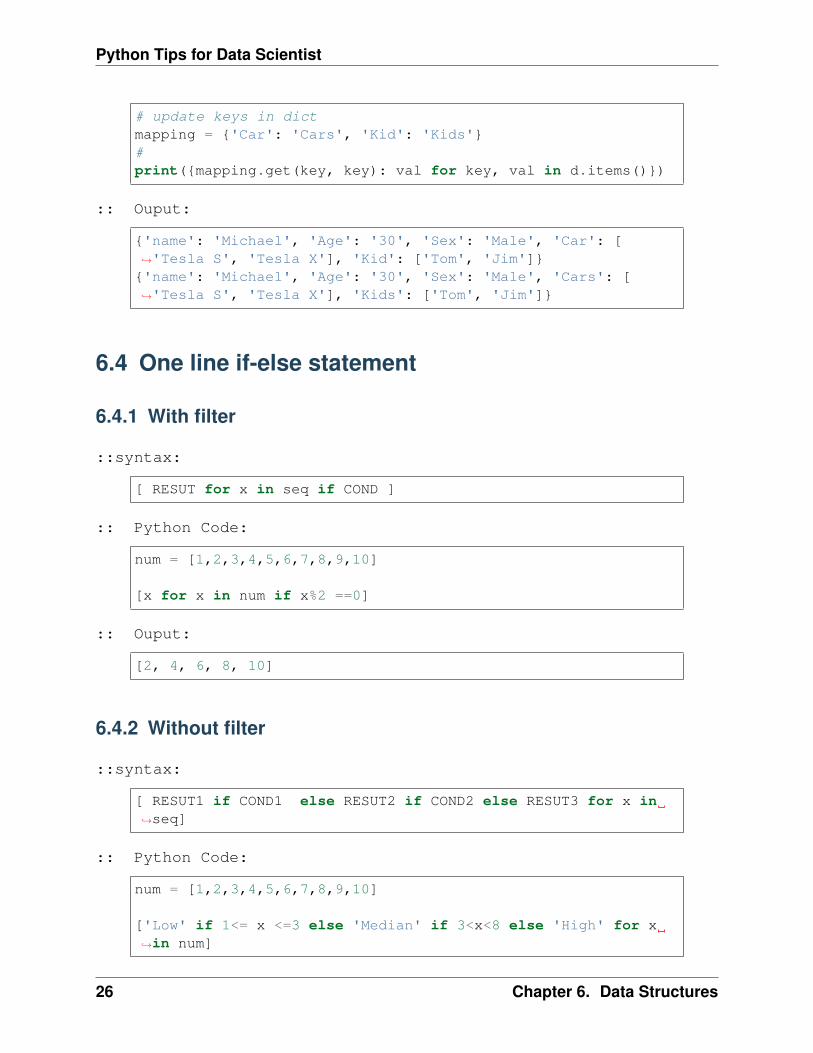
# update keys in dictmapping = {'Car': 'Cars', 'Kid': 'Kids'}#print({mapping.get(key, key): val for key, val in d.items()})
:: Ouput:
{'name': 'Michael', 'Age': '30', 'Sex': 'Male', 'Car': [→˓'Tesla S', 'Tesla X'], 'Kid': ['Tom', 'Jim']}{'name': 'Michael', 'Age': '30', 'Sex': 'Male', 'Cars': [→˓'Tesla S', 'Tesla X'], 'Kids': ['Tom', 'Jim']}
6.4 One line if-else statement
6.4.1 With filter
::syntax:
[ RESUT for x in seq if COND ]
:: Python Code:
num = [1,2,3,4,5,6,7,8,9,10]
[x for x in num if x%2 ==0]
:: Ouput:
[2, 4, 6, 8, 10]
6.4.2 Without filter
::syntax:
[ RESUT1 if COND1 else RESUT2 if COND2 else RESUT3 for x in→˓seq]
:: Python Code:
num = [1,2,3,4,5,6,7,8,9,10]
['Low' if 1<= x <=3 else 'Median' if 3<x<8 else 'High' for x→˓in num]
26 Chapter 6. Data Structures

Python Tips for Data Scientist
:: Ouput:
['Low','Low','Low','Median','Median','Median','Median','High','High','High']
[VanderPlas2016] [McKinney2013]
6.4. One line if-else statement 27

Python Tips for Data Scientist
28 Chapter 6. Data Structures

CHAPTER
SEVEN
DATA READ AND INGESTION WITH DATABASE
7.1 Data Ingestion from Local to DataBase
# User Informationtry:
login = pd.read_csv(r'login.txt', header=None)user = login[0][0]pw = login[0][1]print('User information is ready!')
except:print('Login information is not available!!!')
# Database informationhost = '##.###.###.##'db_name = 'db_name'table_name = 'table_name'
# Setup connectionconn = psycopg2.connect(host=host, database=db_name, user=user,→˓password=pw)cur = conn.cursor()
# Creat table in DataBaseconn.commit()query = """
DROP TABLE IF EXISTS {table_name};CREATE TABLE {table_name}( id character varying(20), val1 double precision, val2 double precision, val3 double precision, val4 text
)DISTRIBUTED BY (id);
(continues on next page)
29

Python Tips for Data Scientist
(continued from previous page)
GRANT SELECT ON TABLE {table_name} TO xxxx;""".format(table_name=table_name)
cur.execute(query)conn.commit()
# load the datadf = pd.read_csv('xx.csv')
# Write dataframe to memory as csvcsv_io = io.StringIO()df.to_csv(csv_io, sep='\t', header=True, index=False)csv_io.seek(0)
# Copy the dataframe in memory to GPconn.commit()copy_sql = """
COPY {table_name} FROM stdin WITH CSV HEADERDELIMITER as '\t'""".format(table_name=table_name)
cur.copy_expert(sql=copy_sql, file=csv_io)conn.commit()
Note: You can also use copy_to to copy the dataframe from local memory to GP
cur.copy_to(df, table_name)
7.2 Data Read from DataBase to Local
# User informationtry:
login = pd.read_csv(r'login.txt', header=None)user = login[0][0]pw = login[0][1]print('User information is ready!')
except:print('Login information is not available!!!')
# Database informationhost = '##.###.###.##'db_name = 'db_name'
(continues on next page)
30 Chapter 7. Data Read and Ingestion with DataBase

Python Tips for Data Scientist
(continued from previous page)
table_name = 'table_name'
# Setup connectionconn = psycopg2.connect(host=host, database=db_name, user=user,→˓password=pw)cur = conn.cursor()
# Read tablesql = """
select *from {table_name}""".format(table_name=table_name)
dp = pd.read_sql(sql, conn)
7.3 Hive and Impala Tabel Ingestion
7.3. Hive and Impala Tabel Ingestion 31

Python Tips for Data Scientist
32 Chapter 7. Data Read and Ingestion with DataBase

CHAPTER
EIGHT
PD.DATAFRAME MANIPULATION
Note: This Chapter Notebooks is for beginner. If you have some Python programming experi-ence, you may skip this chapter.
8.1 TODO..
33

Python Tips for Data Scientist
34 Chapter 8. pd.DataFrame manipulation

CHAPTER
NINE
RDD.DATAFRAME MANIPULATION
Note: This Chapter Notebooks is for beginner. If you have some Python programming experi-ence, you may skip this chapter.
9.1 TODO..
35

Python Tips for Data Scientist
36 Chapter 9. rdd.DataFrame manipulation

CHAPTER
TEN
PD.DATAFRAME VS PD.DATAFRAME
10.1 Create DataFrame
10.1.1 From List
my_list = [['a', 1, 2], ['b', 2, 3],['c', 3, 4]]col_name = ['A', 'B', 'C']
:: Python Code:
# caution for the columns=pd.DataFrame(my_list,columns= col_name)#spark.createDataFrame(my_list, col_name).show()
:: Comparison:
+---+---+---+| A| B| C|
A B C +---+---+---+0 a 1 2 | a| 1| 2|1 b 2 3 | b| 2| 3|2 c 3 4 | c| 3| 4|
+---+---+---+
Attention: Pay attentation to the parameter columns= in pd.DataFrame. Since thedefault value will make the list as rows.
:: Python Code:
# caution for the columns=pd.DataFrame(my_list, columns= col_name)#pd.DataFrame(my_list, col_name)
37

Python Tips for Data Scientist
:: Comparison:
A B C 0 1 20 a 1 2 A a 1 21 b 2 3 B b 2 32 c 3 4 C c 3 4
10.1.2 From Dict
d = {'A': [0, 1, 0],'B': [1, 0, 1],'C': [1, 0, 0]}
:: Python Code:
pd.DataFrame(d)for# Tedious for PySparkspark.createDataFrame(np.array(list(d.values())).T.tolist(),list(d.→˓keys())).show()
:: Comparison:
+---+---+---+| A| B| C|
A B C +---+---+---+0 0 1 1 | 0| 1| 1|1 1 0 0 | 1| 0| 0|2 0 1 0 | 0| 1| 0|
+---+---+---+
10.2 Load DataFrame
10.2.1 From DataBase
Most of time, you need to share your code with your colleagues or release your code forCode Review or Quality assurance(QA). You will definitely do not want to have your UserInformation in the code. So you can save them in login.txt:
runawayhorse001PythonTips
and use the following code to import your User Information:
38 Chapter 10. pd.DataFrame vs pd.DataFrame

Python Tips for Data Scientist
#User Informationtry:
login = pd.read_csv(r'login.txt', header=None)user = login[0][0]pw = login[0][1]print('User information is ready!')
except:print('Login information is not available!!!')
#Database informationhost = '##.###.###.##'db_name = 'db_name'table_name = 'table_name'
:: Comparison:
conn = psycopg2.connect(host=host, database=db_name, user=user,→˓password=pw)cur = conn.cursor()
sql = """select *from {table_name}""".format(table_name=table_name)
dp = pd.read_sql(sql, conn)
# connect to databaseurl = 'jdbc:postgresql://'+host+':5432/'+db_name+'?user='+user+'&→˓password='+pwproperties ={'driver': 'org.postgresql.Driver', 'password': pw,'user':→˓user}ds = spark.read.jdbc(url=url, table=table_name, properties=properties)
Attention: Reading tables from Database with PySpark needs the proper drive for the corre-sponding Database. For example, the above demo needs org.postgresql.Driver and you need todownload it and put it in jars folder of your spark installation path. I download postgresql-42.1.1.jar from the official website and put it in jars folder.
10.2.2 From .csv
:: Comparison:
10.2. Load DataFrame 39

Python Tips for Data Scientist
# pd.DataFrame dp: DataFrame pandasdp = pd.read_csv('Advertising.csv')#rdd.DataFrame. dp: DataFrame sparkds = spark.read.csv(path='Advertising.csv',# sep=',',# encoding='UTF-8',# comment=None,
header=True,inferSchema=True)
10.2.3 From .json
Data from: http://api.luftdaten.info/static/v1/data.json
dp = pd.read_json("data/data.json")ds = spark.read.json('data/data.json')
:: Python Code:
dp[['id','timestamp']].head(4)#ds[['id','timestamp']].show(4)
:: Comparison:
+----------+-----------→˓--------+
| id|→˓timestamp|
id timestamp +----------+-----------→˓--------+0 2994551481 2019-02-28 17:23:52 |2994551481|2019-02-28→˓17:23:52|1 2994551482 2019-02-28 17:23:52 |2994551482|2019-02-28→˓17:23:52|2 2994551483 2019-02-28 17:23:52 |2994551483|2019-02-28→˓17:23:52|3 2994551484 2019-02-28 17:23:52 |2994551484|2019-02-28→˓17:23:52|
+----------+-----------→˓--------+
only showing top 4 rows
40 Chapter 10. pd.DataFrame vs pd.DataFrame

Python Tips for Data Scientist
10.3 First n Rows
:: Python Code:
dp.head(4)#ds.show(4)
:: Comparison:
+-----+-----+---------+-----+| TV|Radio|Newspaper|Sales|
TV Radio Newspaper Sales +-----+-----+---------+-----+0 230.1 37.8 69.2 22.1 |230.1| 37.8| 69.2| 22.1|1 44.5 39.3 45.1 10.4 | 44.5| 39.3| 45.1| 10.4|2 17.2 45.9 69.3 9.3 | 17.2| 45.9| 69.3| 9.3|3 151.5 41.3 58.5 18.5 |151.5| 41.3| 58.5| 18.5|
+-----+-----+---------+-----+only showing top 4 rows
10.4 Column Names
:: Python Code:
dp.columns#ds.columns
:: Comparison:
Index(['TV', 'Radio', 'Newspaper', 'Sales'], dtype='object')['TV', 'Radio', 'Newspaper', 'Sales']
10.5 Data types
:: Python Code:
dp.dtypes#ds.dtypes
:: Comparison:
10.3. First n Rows 41

Python Tips for Data Scientist
TV float64 [('TV', 'double'),Radio float64 ('Radio', 'double'),Newspaper float64 ('Newspaper', 'double'),Sales float64 ('Sales', 'double')]dtype: object
10.6 Replace Data types
my_list = [('a', 2, 3),('b', 5, 6),('c', 8, 9),('a', 2, 3),('b', 5, 6),('c', 8, 9)]
col_name = ['col1', 'col2', 'col3']
dp = pd.DataFrame(my_list,columns=col_name)ds = spark.createDataFrame(dp)
dp.dtypes
col1 objectcol2 int64col3 int64dtype: object
:: Python Code:
d = {'col2': 'string','col3':'string'}dp = dp.astype({'col2': 'str','col3':'str'})ds = ds.select(*list(set(ds.columns)-set(d.keys())),
*(col(c[0]).astype(c[1]).alias(c[0]) for c in d.→˓items()))
:: Comparison:
col1 objectcol2 object [('col1', 'string'), ('col2', 'string'), (→˓'col3', 'string')]col3 objectdtype: object
42 Chapter 10. pd.DataFrame vs pd.DataFrame

Python Tips for Data Scientist
10.7 Fill Null
my_list = [['a', 1, None], ['b', 2, 3],['c', 3, 4]]dp = pd.DataFrame(my_list,columns=['A', 'B', 'C'])ds = spark.createDataFrame(my_list, ['A', 'B', 'C'])#dp.head()ds.show()
:: Comparison:
+------+---+----+| A| B| C|
A B C +------+---+----+0 male 1 NaN | male| 1|null|1 female 2 3.0 |female| 2| 3|2 male 3 4.0 | male| 3| 4|
+------+---+----+
:: Python Code:
dp.fillna(-99)#ds.fillna(-99).show()
:: Comparison:
+------+---+----+| A| B| C|
A B C +------+---+----+0 male 1 -99 | male| 1| -99|1 female 2 3.0 |female| 2| 3|2 male 3 4.0 | male| 3| 4|
+------+---+----+
10.8 Replace Values
:: Python Code:
# caution: you need to chose specific coldp.A.replace(['male', 'female'],[1, 0], inplace=True)dp#caution: Mixed type replacements are not supportedds.na.replace(['male','female'],['1','0']).show()
10.7. Fill Null 43
Python Tips for Data Scientist
:: Comparison:
+---+---+----+| A| B| C|
A B C +---+---+----+0 1 1 NaN | 1| 1|null|1 0 2 3.0 | 0| 2| 3|2 1 3 4.0 | 1| 3| 4|
+---+---+----+
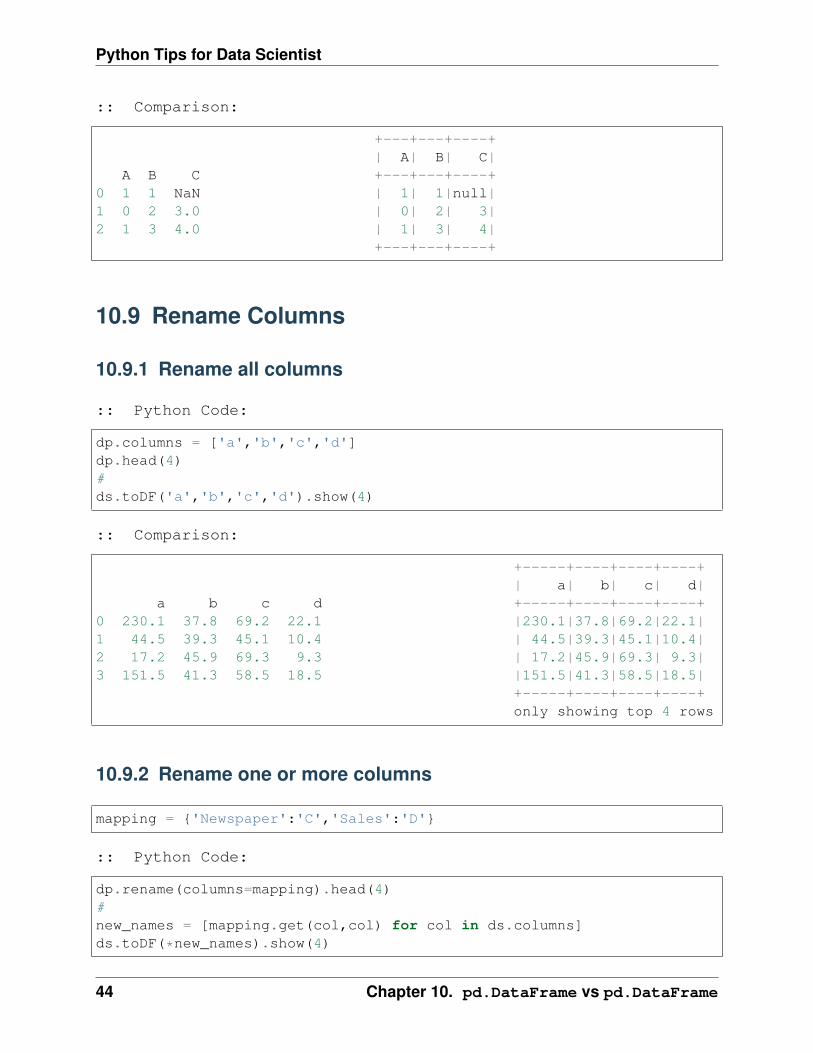
10.9 Rename Columns
10.9.1 Rename all columns
:: Python Code:
dp.columns = ['a','b','c','d']dp.head(4)#ds.toDF('a','b','c','d').show(4)
:: Comparison:
+-----+----+----+----+| a| b| c| d|
a b c d +-----+----+----+----+0 230.1 37.8 69.2 22.1 |230.1|37.8|69.2|22.1|1 44.5 39.3 45.1 10.4 | 44.5|39.3|45.1|10.4|2 17.2 45.9 69.3 9.3 | 17.2|45.9|69.3| 9.3|3 151.5 41.3 58.5 18.5 |151.5|41.3|58.5|18.5|
+-----+----+----+----+only showing top 4 rows
10.9.2 Rename one or more columns
mapping = {'Newspaper':'C','Sales':'D'}
:: Python Code:
dp.rename(columns=mapping).head(4)#new_names = [mapping.get(col,col) for col in ds.columns]ds.toDF(*new_names).show(4)
44 Chapter 10. pd.DataFrame vs pd.DataFrame

Python Tips for Data Scientist
:: Comparison:
+-----+-----+----+----+| TV|Radio| C| D|
TV Radio C D +-----+-----+----+----+0 230.1 37.8 69.2 22.1 |230.1| 37.8|69.2|22.1|1 44.5 39.3 45.1 10.4 | 44.5| 39.3|45.1|10.4|2 17.2 45.9 69.3 9.3 | 17.2| 45.9|69.3| 9.3|3 151.5 41.3 58.5 18.5 |151.5| 41.3|58.5|18.5|
+-----+-----+----+----+only showing top 4 rows
Note: You can also use withColumnRenamed to rename one column in PySpark.
:: Python Code:
ds.withColumnRenamed('Newspaper','Paper').show(4
:: Comparison:
+-----+-----+-----+-----+| TV|Radio|Paper|Sales|+-----+-----+-----+-----+|230.1| 37.8| 69.2| 22.1|| 44.5| 39.3| 45.1| 10.4|| 17.2| 45.9| 69.3| 9.3||151.5| 41.3| 58.5| 18.5|+-----+-----+-----+-----+only showing top 4 rows
10.10 Drop Columns
drop_name = ['Newspaper','Sales']
:: Python Code:
dp.drop(drop_name,axis=1).head(4)#ds.drop(*drop_name).show(4)
:: Comparison:
10.10. Drop Columns 45

Python Tips for Data Scientist
+-----+-----+| TV|Radio|
TV Radio +-----+-----+0 230.1 37.8 |230.1| 37.8|1 44.5 39.3 | 44.5| 39.3|2 17.2 45.9 | 17.2| 45.9|3 151.5 41.3 |151.5| 41.3|
+-----+-----+only showing top 4 rows
10.11 Filter
dp = pd.read_csv('Advertising.csv')#ds = spark.read.csv(path='Advertising.csv',
header=True,inferSchema=True)
:: Python Code:
dp[dp.Newspaper<20].head(4)#ds[ds.Newspaper<20].show(4)
:: Comparison:
+-----+-----+---------→˓+-----+
|→˓TV|Radio|Newspaper|Sales|
TV Radio Newspaper Sales +-----+-----+---------→˓+-----+7 120.2 19.6 11.6 13.2 |120.2| 19.6| 11.→˓6| 13.2|8 8.6 2.1 1.0 4.8 | 8.6| 2.1| 1.→˓0| 4.8|11 214.7 24.0 4.0 17.4 |214.7| 24.0| 4.→˓0| 17.4|13 97.5 7.6 7.2 9.7 | 97.5| 7.6| 7.→˓2| 9.7|
+-----+-----+---------→˓+-----+
only showing top 4 rows
46 Chapter 10. pd.DataFrame vs pd.DataFrame

Python Tips for Data Scientist
:: Python Code:
dp[(dp.Newspaper<20)&(dp.TV>100)].head(4)#ds[(ds.Newspaper<20)&(ds.TV>100)].show(4)
:: Comparison:
+-----+-----+---------→˓+-----+
|→˓TV|Radio|Newspaper|Sales|
TV Radio Newspaper Sales +-----+-----+---------→˓+-----+7 120.2 19.6 11.6 13.2 |120.2| 19.6| 11.→˓6| 13.2|11 214.7 24.0 4.0 17.4 |214.7| 24.0| 4.→˓0| 17.4|19 147.3 23.9 19.1 14.6 |147.3| 23.9| 19.→˓1| 14.6|25 262.9 3.5 19.5 12.0 |262.9| 3.5| 19.→˓5| 12.0|
+-----+-----+---------→˓+-----+
only showing top 4 rows
10.12 With New Column
:: Python Code:
dp['tv_norm'] = dp.TV/sum(dp.TV)dp.head(4)#ds.withColumn('tv_norm', ds.TV/ds.groupBy().agg(F.sum("TV")).→˓collect()[0][0]).show(4)
:: Comparison:
+-----+-----+---------→˓+-----+--------------------+
|→˓TV|Radio|Newspaper|Sales| tv_norm|
TV Radio Newspaper Sales tv_norm +-----+-----+---------→˓+-----+--------------------+0 230.1 37.8 69.2 22.1 0.007824 |230.1| 37.8| 69.→˓2| 22.1|0.007824268493802813| (continues on next page)
10.12. With New Column 47

Python Tips for Data Scientist
(continued from previous page)
1 44.5 39.3 45.1 10.4 0.001513 | 44.5| 39.3| 45.→˓1| 10.4|0.001513167961643...|2 17.2 45.9 69.3 9.3 0.000585 | 17.2| 45.9| 69.→˓3| 9.3|5.848649200061207E-4|3 151.5 41.3 58.5 18.5 0.005152 |151.5| 41.3| 58.→˓5| 18.5|0.005151571824472517|
+-----+-----+---------→˓+-----+--------------------+
only showing top 4 rows
:: Python Code:
dp['cond'] = dp.apply(lambda c: 1 if ((c.TV>100)&(c.Radio<40)) else 2→˓if c.Sales> 10 else 3,axis=1)#ds.withColumn('cond',F.when((ds.TV>100)&(ds.Radio<40),1)\
.when(ds.Sales>10, 2)\
.otherwise(3)).show(4)
:: Comparison:
+-----+-----+---------→˓+-----+----+
|→˓TV|Radio|Newspaper|Sales|cond|
TV Radio Newspaper Sales cond +-----+-----+---------→˓+-----+----+0 230.1 37.8 69.2 22.1 1 |230.1| 37.8| 69.→˓2| 22.1| 1|1 44.5 39.3 45.1 10.4 2 | 44.5| 39.3| 45.→˓1| 10.4| 2|2 17.2 45.9 69.3 9.3 3 | 17.2| 45.9| 69.→˓3| 9.3| 3|3 151.5 41.3 58.5 18.5 2 |151.5| 41.3| 58.→˓5| 18.5| 2|
+-----+-----+---------→˓+-----+----+
only showing top 4 rows
:: Python Code:
dp['log_tv'] = np.log(dp.TV)dp.head(4)#ds.withColumn('log_tv',F.log(ds.TV)).show(4)
48 Chapter 10. pd.DataFrame vs pd.DataFrame

Python Tips for Data Scientist
:: Comparison:
+-----+-----+---------→˓+-----+------------------+
|→˓TV|Radio|Newspaper|Sales| log_tv|
TV Radio Newspaper Sales log_tv +-----+-----+---------→˓+-----+------------------+0 230.1 37.8 69.2 22.1 5.438514 |230.1| 37.8| 69.→˓2| 22.1| 5.43851399704132|1 44.5 39.3 45.1 10.4 3.795489 | 44.5| 39.3| 45.→˓1| 10.4|3.7954891891721947|2 17.2 45.9 69.3 9.3 2.844909 | 17.2| 45.9| 69.→˓3| 9.3|2.8449093838194073|3 151.5 41.3 58.5 18.5 5.020586 |151.5| 41.3| 58.→˓5| 18.5| 5.020585624949423|
+-----+-----+---------→˓+-----+------------------+
only showing top 4 rows
:: Python Code:
dp['tv+10'] = dp.TV.apply(lambda x: x+10)dp.head(4)#ds.withColumn('tv+10', ds.TV+10).show(4)
:: Comparison:
+-----+-----+---------→˓+-----+-----+
|→˓TV|Radio|Newspaper|Sales|tv+10|
TV Radio Newspaper Sales tv+10 +-----+-----+---------→˓+-----+-----+0 230.1 37.8 69.2 22.1 240.1 |230.1| 37.8| 69.→˓2| 22.1|240.1|1 44.5 39.3 45.1 10.4 54.5 | 44.5| 39.3| 45.→˓1| 10.4| 54.5|2 17.2 45.9 69.3 9.3 27.2 | 17.2| 45.9| 69.→˓3| 9.3| 27.2|3 151.5 41.3 58.5 18.5 161.5 |151.5| 41.3| 58.→˓5| 18.5|161.5|
+-----+-----+---------→˓+-----+-----+
only showing top 4 rows
10.12. With New Column 49

Python Tips for Data Scientist
10.13 Join
leftp = pd.DataFrame({'A': ['A0', 'A1', 'A2', 'A3'],'B': ['B0', 'B1', 'B2', 'B3'],'C': ['C0', 'C1', 'C2', 'C3'],'D': ['D0', 'D1', 'D2', 'D3']},index=[0, 1, 2, 3])
rightp = pd.DataFrame({'A': ['A0', 'A1', 'A6', 'A7'],'F': ['B4', 'B5', 'B6', 'B7'],'G': ['C4', 'C5', 'C6', 'C7'],'H': ['D4', 'D5', 'D6', 'D7']},index=[4, 5, 6, 7])
lefts = spark.createDataFrame(leftp)rights = spark.createDataFrame(rightp)
A B C D A F G H0 A0 B0 C0 D0 4 A0 B4 C4 D41 A1 B1 C1 D1 5 A1 B5 C5 D52 A2 B2 C2 D2 6 A6 B6 C6 D63 A3 B3 C3 D3 7 A7 B7 C7 D7
10.13.1 Left Join
:: Python Code:
leftp.merge(rightp,on='A',how='left')#lefts.join(rights,on='A',how='left')
.orderBy('A',ascending=True).show()
:: Comparison:
+---+---+---+---+----+----+----→˓+
| A| B| C| D| F| G|→˓H|
A B C D F G H +---+---+---+---+----+----+----→˓+0 A0 B0 C0 D0 B4 C4 D4 | A0| B0| C0| D0| B4| C4|→˓D4|1 A1 B1 C1 D1 B5 C5 D5 | A1| B1| C1| D1| B5| C5|→˓D5|
(continues on next page)
50 Chapter 10. pd.DataFrame vs pd.DataFrame

Python Tips for Data Scientist
(continued from previous page)
2 A2 B2 C2 D2 NaN NaN NaN | A2| B2| C2|→˓D2|null|null|null|3 A3 B3 C3 D3 NaN NaN NaN | A3| B3| C3|→˓D3|null|null|null|
+---+---+---+---+----+----+----→˓+
10.13.2 Right Join
:: Python Code:
leftp.merge(rightp,on='A',how='right')#lefts.join(rights,on='A',how='right')
.orderBy('A',ascending=True).show()
:: Comparison:
+---+----+----+----+---+---+---→˓+
| A| B| C| D| F| G|→˓H|
A B C D F G H +---+----+----+----+---+---+---→˓+0 A0 B0 C0 D0 B4 C4 D4 | A0| B0| C0| D0| B4| C4|→˓D4|1 A1 B1 C1 D1 B5 C5 D5 | A1| B1| C1| D1| B5| C5|→˓D5|2 A6 NaN NaN NaN B6 C6 D6 | A6|null|null|null| B6| C6|→˓D6|3 A7 NaN NaN NaN B7 C7 D7 | A7|null|null|null| B7| C7|→˓D7|
+---+----+----+----+---+---+---→˓+
10.13.3 Inner Join
:: Python Code:
leftp.merge(rightp,on='A',how='inner')#lefts.join(rights,on='A',how='inner')
.orderBy('A',ascending=True).show()
10.13. Join 51

Python Tips for Data Scientist
:: Comparison:
+---+---+---+---+---+---+---+| A| B| C| D| F| G| H|
A B C D F G H +---+---+---+---+---+---+---+0 A0 B0 C0 D0 B4 C4 D4 | A0| B0| C0| D0| B4| C4| D4|1 A1 B1 C1 D1 B5 C5 D5 | A1| B1| C1| D1| B5| C5| D5|
+---+---+---+---+---+---+---+
10.13.4 Full Join
:: Python Code:
leftp.merge(rightp,on='A',how='full')#lefts.join(rights,on='A',how='full')
.orderBy('A',ascending=True).show()
:: Comparison:
+---+----+----+----+----+----+-→˓---+
| A| B| C| D| F| G|→˓ H|
A B C D F G H +---+----+----+----+----+----+-→˓---+0 A0 B0 C0 D0 B4 C4 D4 | A0| B0| C0| D0| B4| C4|→˓ D4|1 A1 B1 C1 D1 B5 C5 D5 | A1| B1| C1| D1| B5| C5|→˓ D5|2 A2 B2 C2 D2 NaN NaN NaN | A2| B2| C2|→˓D2|null|null|null|3 A3 B3 C3 D3 NaN NaN NaN | A3| B3| C3|→˓D3|null|null|null|4 A6 NaN NaN NaN B6 C6 D6 | A6|null|null|null| B6| C6|→˓ D6|5 A7 NaN NaN NaN B7 C7 D7 | A7|null|null|null| B7| C7|→˓ D7|
+---+----+----+----+----+----+-→˓---+
52 Chapter 10. pd.DataFrame vs pd.DataFrame

Python Tips for Data Scientist
10.14 Concat Columns
my_list = [('a', 2, 3),('b', 5, 6),('c', 8, 9),('a', 2, 3),('b', 5, 6),('c', 8, 9)]
col_name = ['col1', 'col2', 'col3']#dp = pd.DataFrame(my_list,columns=col_name)ds = spark.createDataFrame(my_list,schema=col_name)
col1 col2 col30 a 2 31 b 5 62 c 8 93 a 2 34 b 5 65 c 8 9
:: Python Code:
dp['concat'] = dp.apply(lambda x:'%s%s'%(x['col1'],x['col2']),axis=1)dp#ds.withColumn('concat',F.concat('col1','col2')).show()
:: Comparison:
+----+----+----+------+|col1|col2|col3|concat|
col1 col2 col3 concat +----+----+----+------+0 a 2 3 a2 | a| 2| 3| a2|1 b 5 6 b5 | b| 5| 6| b5|2 c 8 9 c8 | c| 8| 9| c8|3 a 2 3 a2 | a| 2| 3| a2|4 b 5 6 b5 | b| 5| 6| b5|5 c 8 9 c8 | c| 8| 9| c8|
+----+----+----+------+
10.15 GroupBy
:: Python Code:
10.14. Concat Columns 53
Python Tips for Data Scientist
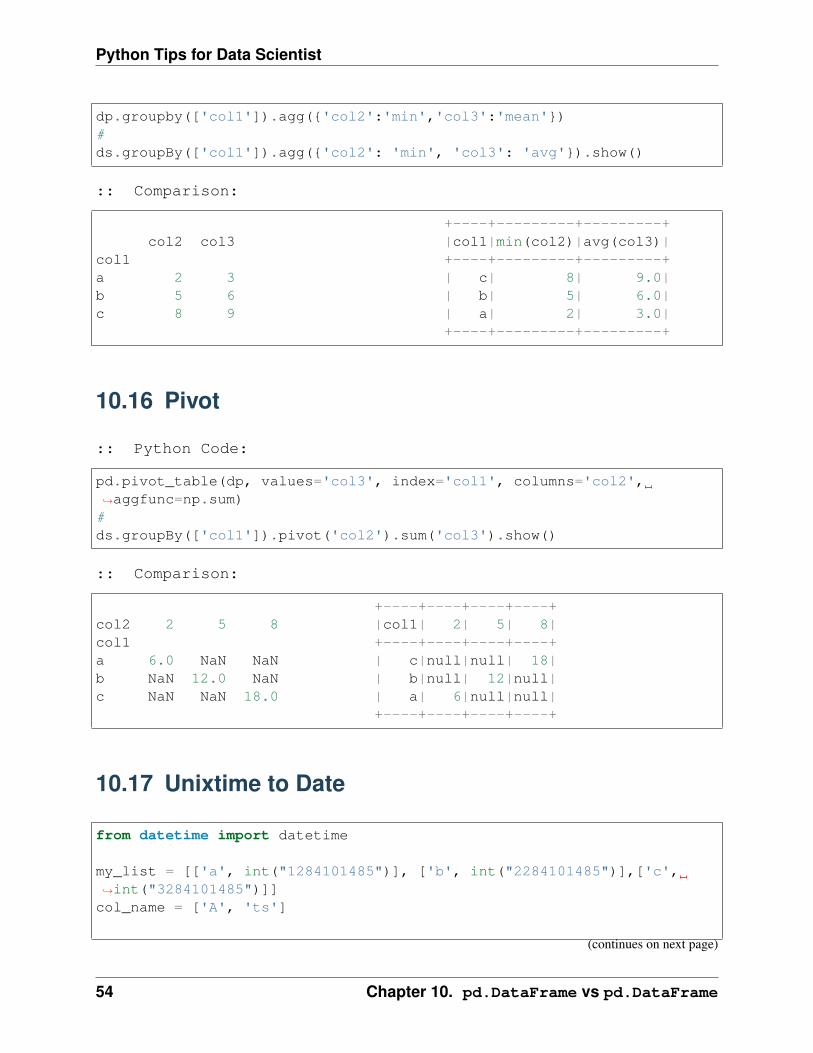
dp.groupby(['col1']).agg({'col2':'min','col3':'mean'})#ds.groupBy(['col1']).agg({'col2': 'min', 'col3': 'avg'}).show()
:: Comparison:
+----+---------+---------+col2 col3 |col1|min(col2)|avg(col3)|
col1 +----+---------+---------+a 2 3 | c| 8| 9.0|b 5 6 | b| 5| 6.0|c 8 9 | a| 2| 3.0|
+----+---------+---------+
10.16 Pivot
:: Python Code:
pd.pivot_table(dp, values='col3', index='col1', columns='col2',→˓aggfunc=np.sum)#ds.groupBy(['col1']).pivot('col2').sum('col3').show()
:: Comparison:
+----+----+----+----+col2 2 5 8 |col1| 2| 5| 8|col1 +----+----+----+----+a 6.0 NaN NaN | c|null|null| 18|b NaN 12.0 NaN | b|null| 12|null|c NaN NaN 18.0 | a| 6|null|null|
+----+----+----+----+
10.17 Unixtime to Date
from datetime import datetime
my_list = [['a', int("1284101485")], ['b', int("2284101485")],['c',→˓int("3284101485")]]col_name = ['A', 'ts']
(continues on next page)
54 Chapter 10. pd.DataFrame vs pd.DataFrame

Python Tips for Data Scientist
(continued from previous page)
dp = pd.DataFrame(my_list,columns=col_name)ds = spark.createDataFrame(dp)
:: Python Code:
dp['datetime'] = pd.to_datetime(dp['ts'], unit='s').dt.tz_localize('UTC→˓')dp
spark.conf.set("spark.sql.session.timeZone", "UTC")from pyspark.sql.types import DateTypeds.withColumn('date', F.from_unixtime('ts')).show() #.cast(DateType())
:: Comparison:
+---+----------+-------→˓------------+
| A| ts|→˓ date|
A ts datetime +---+----------+-------→˓------------+0 a 1284101485 2010-09-10 06:51:25+00:00 | a|1284101485|2010-→˓09-10 06:51:25|1 b 2284101485 2042-05-19 08:38:05+00:00 | b|2284101485|2042-→˓05-19 08:38:05|2 c 3284101485 2074-01-25 10:24:45+00:00 | c|3284101485|2074-→˓01-25 10:24:45|
+---+----------+-------→˓------------+
10.17. Unixtime to Date 55

Python Tips for Data Scientist
56 Chapter 10. pd.DataFrame vs pd.DataFrame

CHAPTER
ELEVEN
KAGGLE COMPETITIONS
Chinese proverb
practice makes perfect.
11.1 TODO..
57

Python Tips for Data Scientist
58 Chapter 11. Kaggle Competitions

CHAPTER
TWELVE
PACKAGE WRAPPER
It’s super easy to wrap your own package in Python. I packed some functions which I frequentlyused in my daily work. You can download and install it from My ststspy library. The hierarchicalstructure and the directory structure of this package are as follows.
12.1 Hierarchical Structure
README.md__init__.pyrequirements.txtsetup.pystatspy
__init__.pybasics.pytests.py
testnb
t.test.ipynbtest1.py
3 directories, 9 files
From the above hierarchical structure, you will find that you have to have __init__.py in eachdirectory. I will explain the __init__.py file with the example below:
12.2 Set Up
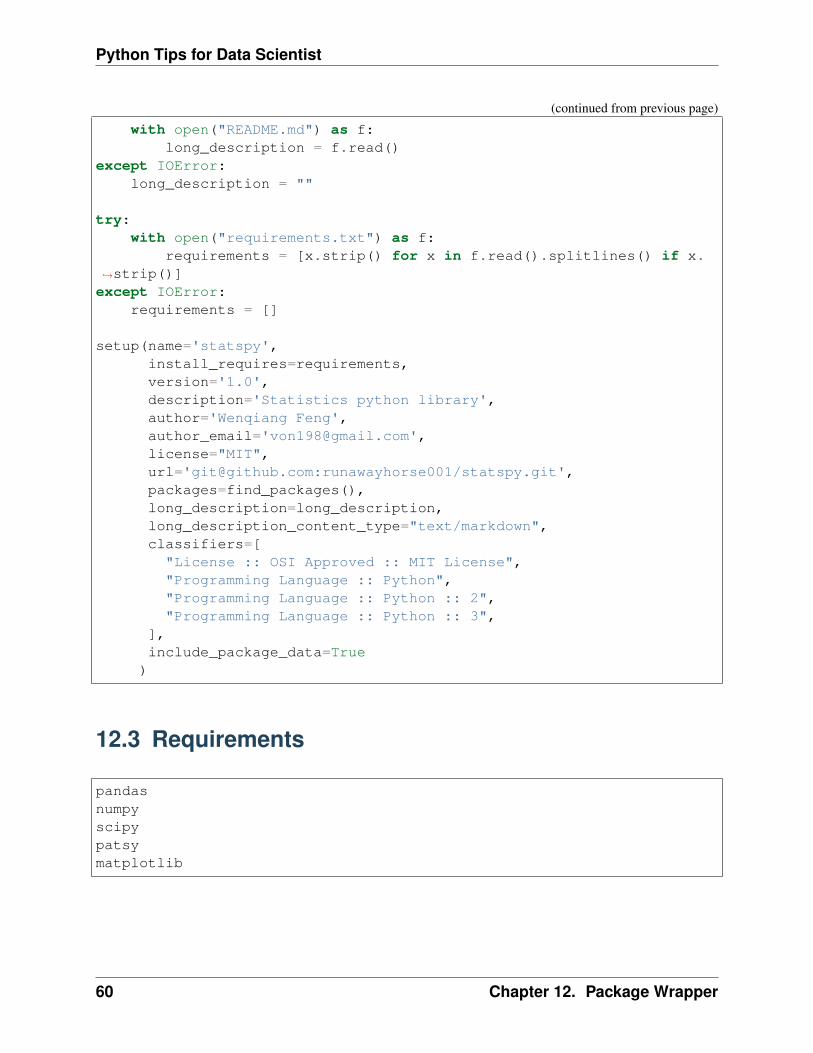
from setuptools import setup, find_packages
try:(continues on next page)
59
Python Tips for Data Scientist
(continued from previous page)
with open("README.md") as f:long_description = f.read()
except IOError:long_description = ""
try:with open("requirements.txt") as f:
requirements = [x.strip() for x in f.read().splitlines() if x.→˓strip()]except IOError:
requirements = []
setup(name='statspy',install_requires=requirements,version='1.0',description='Statistics python library',author='Wenqiang Feng',author_email='[email protected]',license="MIT",url='[email protected]:runawayhorse001/statspy.git',packages=find_packages(),long_description=long_description,long_description_content_type="text/markdown",classifiers=[
"License :: OSI Approved :: MIT License","Programming Language :: Python","Programming Language :: Python :: 2","Programming Language :: Python :: 3",
],include_package_data=True
)
12.3 Requirements
pandasnumpyscipypatsymatplotlib
60 Chapter 12. Package Wrapper

Python Tips for Data Scientist
12.4 ReadMe
# StatsPy
This is my statistics python library repositories.The ``API`` can be found at: https://runawayhorse001.github.io/statspy.If you want to colne and install it, you can use
- clone
```{bash}git clone [email protected]:runawayhorse001/statspy.git```- install
```{bash}cd statspypip install -r requirements.txtpython setup.py install```- uninstall
```{bash}pip uninstall statspy```
- test
```{bash}cd statspy/testpython test1.py```
12.4. ReadMe 61

Python Tips for Data Scientist
62 Chapter 12. Package Wrapper

CHAPTER
THIRTEEN
PUBLISH PACKAGE TO PYPI
In this chapter, you’ll learn how to upload your own package to PyPI.
13.1 Register PyPI account
If you do not have a PyPI accout, you need to register an account at https://pypi.org/account/register.
13.2 Install twine
pip install twine
13.3 Build Your Package
python setup.py sdist bdist_wheel
Then you will get a new folder dist:
.PyAudit-1.0-py3-none-any.whlPyAudit-1.0-py3.6.eggPyAudit-1.0.tar.gz
63

Python Tips for Data Scientist
13.4 Upload Your Package
twine upload dist/*
During the uploading processing, you need to provide your PyPI account username andpassword:
Enter your username: runawayhorse001Enter your password:
13.5 Package at PyPI
Here is my PyAudit package at [PyPI](https://pypi.org/project/PyAudit). You can installPyAudit using:
pip install PyAudit
64 Chapter 13. Publish Package to PyPI

CHAPTER
FOURTEEN
MODEL DEPLOYMENT WITH FLASK
In this chapter, you’ll learn how to deployment your model with flask. The main idea andcode (I made some essential modification to make it work for Python 3) are from the Gitrepo:https://github.com/llSourcell/how_to_deploy_a_keras_model_to_production. So the copy-right belongs to the original author.
14.1 Install flask
pip install Flask
14.2 Train and Save your model
You can use the following code to train and save your CNN model:
#python 2/3 compatibilityfrom __future__ import print_function#simplified interface for building modelsimport keras#our handwritten character labeled datasetfrom keras.datasets import mnist#because our models are simplefrom keras.models import Sequential#dense means fully connected layers, dropout is a technique to improve→˓convergence, flatten to reshape our matrices for feeding#into respective layersfrom keras.layers import Dense, Dropout, Flatten#for convolution (images) and pooling is a technique to help choose→˓the most relevant features in an imagefrom keras.layers import Conv2D, MaxPooling2Dfrom keras import backend as K
(continues on next page)
65

Python Tips for Data Scientist
(continued from previous page)
#mini batch gradient descent ftwbatch_size = 128#10 difference charactersnum_classes = 10#very short training timeepochs = 12
#input image dimensions#28x28 pixel images.img_rows, img_cols = 28, 28
#the data downloaded, shuffled and split between train and test sets#if only all datasets were this easy to import and format(x_train, y_train), (x_test, y_test) = mnist.load_data()
#this assumes our data format#For 3D data, "channels_last" assumes (conv_dim1, conv_dim2, conv_dim3,→˓ channels) while#"channels_first" assumes (channels, conv_dim1, conv_dim2, conv_dim3).if K.image_data_format() == 'channels_first':
x_train = x_train.reshape(x_train.shape[0], 1, img_rows, img_cols)x_test = x_test.reshape(x_test.shape[0], 1, img_rows, img_cols)input_shape = (1, img_rows, img_cols)
else:x_train = x_train.reshape(x_train.shape[0], img_rows, img_cols, 1)x_test = x_test.reshape(x_test.shape[0], img_rows, img_cols, 1)input_shape = (img_rows, img_cols, 1)
#more reshapingx_train = x_train.astype('float32')x_test = x_test.astype('float32')x_train /= 255x_test /= 255print('x_train shape:', x_train.shape)print(x_train.shape[0], 'train samples')print(x_test.shape[0], 'test samples')
#convert class vectors to binary class matricesy_train = keras.utils.to_categorical(y_train, num_classes)y_test = keras.utils.to_categorical(y_test, num_classes)
#build our modelmodel = Sequential()
(continues on next page)
66 Chapter 14. Model Deployment with Flask

Python Tips for Data Scientist
(continued from previous page)
#convolutional layer with rectified linear unit activationmodel.add(Conv2D(32, kernel_size=(3, 3),
activation='relu',input_shape=input_shape))
#againmodel.add(Conv2D(64, (3, 3), activation='relu'))#choose the best features via poolingmodel.add(MaxPooling2D(pool_size=(2, 2)))#randomly turn neurons on and off to improve convergencemodel.add(Dropout(0.25))#flatten since too many dimensions, we only want a classification→˓outputmodel.add(Flatten())#fully connected to get all relevant datamodel.add(Dense(128, activation='relu'))#one more dropout for convergence' sake :)model.add(Dropout(0.5))#output a softmax to squash the matrix into output probabilitiesmodel.add(Dense(num_classes, activation='softmax'))#Adaptive learning rate (adaDelta) is a popular form of gradient→˓descent rivaled only by adam and adagrad#categorical ce since we have multiple classes (10)model.compile(loss=keras.losses.categorical_crossentropy,
optimizer=keras.optimizers.Adadelta(),metrics=['accuracy'])
#trainmodel.fit(x_train, y_train,
batch_size=batch_size,epochs=epochs,verbose=1,validation_data=(x_test, y_test))
#how well did it do?score = model.evaluate(x_test, y_test, verbose=0)print('Test loss:', score[0])print('Test accuracy:', score[1])
#Save the model# serialize model to JSONmodel_json = model.to_json()with open("model.json", "w") as json_file:
json_file.write(model_json)# serialize weights to HDF5model.save_weights("model.h5")print("Saved model to disk")
14.2. Train and Save your model 67

Python Tips for Data Scientist
14.3 Deplyment with Flask
#our web app framework!
#you could also generate a skeleton from scratch via#http://flask-appbuilder.readthedocs.io/en/latest/installation.html
#Generating HTML from within Python is not fun, and actually pretty→˓cumbersome because you have to do the#HTML escaping on your own to keep the application secure. Because of→˓that Flask configures the Jinja2 template engine#for you automatically.#requests are objects that flask handles (get set post, etc)from flask import Flask, render_template,request#scientific computing library for saving, reading, and resizing images#from scipy.misc import imsave, imread, imresize# import cv2 library for saving, reading, and resizing imagesimport cv2#for matrix mathimport numpy as np#for importing our keras modelimport keras.models#for regular expressions, saves time dealing with string dataimport re# for convert base64 string to imageimport base64
#system level operations (like loading files)import sys#for reading operating system dataimport os#tell our app where our saved model issys.path.append(os.path.abspath("./model"))from load import *#initalize our flask appapp = Flask(__name__)#global vars for easy reusabilityglobal model, graph#initialize these variablesmodel, graph = init()
#decoding an image from base64 into raw representationdef convertImage(imgData1):
imgData1 = imgData1.decode("utf-8")imgstr = re.search(r'base64,(.*)',imgData1).group(1)#print(imgstr)
(continues on next page)
68 Chapter 14. Model Deployment with Flask

Python Tips for Data Scientist
(continued from previous page)
imgstr_64 = base64.b64decode(imgstr)with open('output/output.png','wb') as output:
output.write(imgstr_64)
@app.route('/')def index():
#initModel()#render out pre-built HTML file right on the index pagereturn render_template("index.html")
@app.route('/predict/',methods=['GET','POST'])def predict():
#whenever the predict method is called, we're going#to input the user drawn character as an image into the model#perform inference, and return the classification#get the raw data format of the imageimgData = request.get_data()#print(imgData)#encode it into a suitable formatconvertImage(imgData)print("debug")#read the image into memoryx = cv2.imread('output/output.png',0)#compute a bit-wise inversion so black becomes white and vice
→˓versax = np.invert(x)#make it the right sizex = cv2.resize(x,(28,28))#imshow(x)#convert to a 4D tensor to feed into our modelx = x.reshape(1,28,28,1)print("debug2")#in our computation graphwith graph.as_default():
#perform the predictionout = model.predict(x)#print(out)print(np.argmax(out,axis=1))print("debug3")#convert the response to a stringresponse = np.array_str(np.argmax(out,axis=1))return response
(continues on next page)
14.3. Deplyment with Flask 69

Python Tips for Data Scientist
(continued from previous page)
if __name__ == "__main__":#decide what port to run the app inport = int(os.environ.get('PORT', 5000))#run the app locally on the givn portapp.run(host='0.0.0.0', port=port)#optional if we want to run in debugging mode#app.run(debug=False)
14.4 Lunch your app on server
14.4.1 1. Lunch the APP
python app.py
14.4.2 2. Run the APP
Open the browser with: http://0.0.0.0:5000
70 Chapter 14. Model Deployment with Flask

CHAPTER
FIFTEEN
API BOOK
If you developed an amazing library or tool, you need to teach the users how to use it. Now a APIbook is necessary and a good API book will save a lot of time for the users. The Sphinx providesan awesome auto API book generator. The followings are my statistics python library: statspyAPI demo book:
15.1 Basics Module
15.1.1 rnorm
statspy.basics.rnorm(n, mean=0, sd=1)Random generation for the normal distribution with mean equal to mean and standard devi-ation equation to sd same functions as rnorm in r: rnorm(n, mean=0, sd=1)
Parameters
• n – the number of the observations
• mean – vector of means
• sd – vector of standard deviations
Returns the vector of the random numbers
Author Wenqiang Feng
Email [email protected]
15.1.2 dnorm
statspy.basics.dnorm(x, mean=0, sd=1, log=False)Density of the normal distribution with mean equal to mean and standard deviation equationto sd same functions as rnorm in r: dnorm(x, mean=0, sd=1, log=FALSE)
Parameters
71

Python Tips for Data Scientist
• x – the vector od quantiles
• mean – vector of means
• sd – vector of standard deviations
Returns the list of the density
Author Wenqiang Feng
Email [email protected]
15.1.3 runif
statspy.basics.runif(n, min=0, max=1)Random generation from the uniform distribution same functions as rnorm in r: runif(n,min=0, max=1)
Parameters
• n – the number of the observations
• min – the lower limit of the distribution
• max – the upper limit of the distribution
Returns the list of n uniform random numers
Author Wenqiang Feng
Email [email protected]
15.2 Tests Module
15.2.1 T-test
statspy.tests.t_test(x, y=None, mu=0.0, conf_level=0.95)Performs one and two sample t-tests on vectors of data.
same functions as t.test in r: t.test(x, ...)
t.test(x, y = NULL,
alternative = c("two.sided", "less", "greater"),
mu = 0, paired = FALSE, var.equal = FALSE,
conf.level = 0.95, ...)
Parameters
72 Chapter 15. API Book

Python Tips for Data Scientist
• x – a (non-empty) numeric vector of data values.
• y – an optional (non-empty) numeric vector of data values.
• mu – vector of standard deviations.
• conf_level – confidence level of the interval.
Returns the vector of the random numbers.
Author Wenqiang Feng
Email [email protected]
15.2. Tests Module 73

Python Tips for Data Scientist
74 Chapter 15. API Book

CHAPTER
SIXTEEN
MAIN REFERENCE
75

Python Tips for Data Scientist
76 Chapter 16. Main Reference

BIBLIOGRAPHY
[VanderPlas2016] Jake VanderPlas. Python Data Science Handbook: Essential Tools for Workingwith Data, 2016.
[McKinney2013] Wes McKinney. Python for Data Analysis, 2013.
[Georg2018] Georg Brandl. Sphinx Documentation, Release 1.7.10+, 2018.
77

Python Tips for Data Scientist
78 Bibliography

PYTHON MODULE INDEX
sstatspy.basics, 71statspy.tests, 72
79

Python Tips for Data Scientist
80 Python Module Index

INDEX
Rrnorm() (in module statspy.basics), 71
Sstatspy.basics (module), 71statspy.tests (module), 72
Tt_test() (in module statspy.tests), 72
81