Embed Size (px)
Citation preview

Python: Its Past, Present, and Future in Meteorology
7th Symposium on Advances in Modeling and Analysis Using Python
23 January 2016 | Seattle, WA
Ryan May (@dopplershift)UCAR/Unidata

Outline• The Past
• What is Python?• A History Lesson
• The Present• Recent events• Today’s Python Landscape
• The Future• What you should keep an eye on• What’s coming down the pipe• Ryan predicts the weather

A long time ago in an office far, far away...

What is Python?• Dynamic, strongly-typed language
• Automatic memory management• Exception handling• “Fits your brain”• Large standard library (batteries included)• Interpreted (i.e. slow)
• Free and open-source• Quick to develop• “Glue language”
Zen of Python (import this)The Zen of Python, by Tim Peters
Beautiful is better than ugly.Explicit is better than implicit.Simple is better than complex.Complex is better than complicated.Flat is better than nested.Sparse is better than dense.Readability counts.Special cases aren't special enough to break the rules.Although practicality beats purity.Errors should never pass silently.Unless explicitly silenced.In the face of ambiguity, refuse the temptation to guess.There should be one-- and preferably only one --obvious way to do it.Although that way may not be obvious at first unless you're Dutch.Now is better than never.Although never is often better than *right* now.If the implementation is hard to explain, it's a bad idea.If the implementation is easy to explain, it may be a good idea.Namespaces are one honking great idea -- let's do more of those!

First PyCon Held
A Brief History of Python
1990 1992 1994 1996 1998 2000 2002
2004 2006 2008 2010 2012 2014 2016
Python 1.0 Released
Python started by Guido van Rossum
Python Software Foundation created
Python 2.0 Released
Python 3.0 Released
Python 2.7 Released
Python 3.6 Released
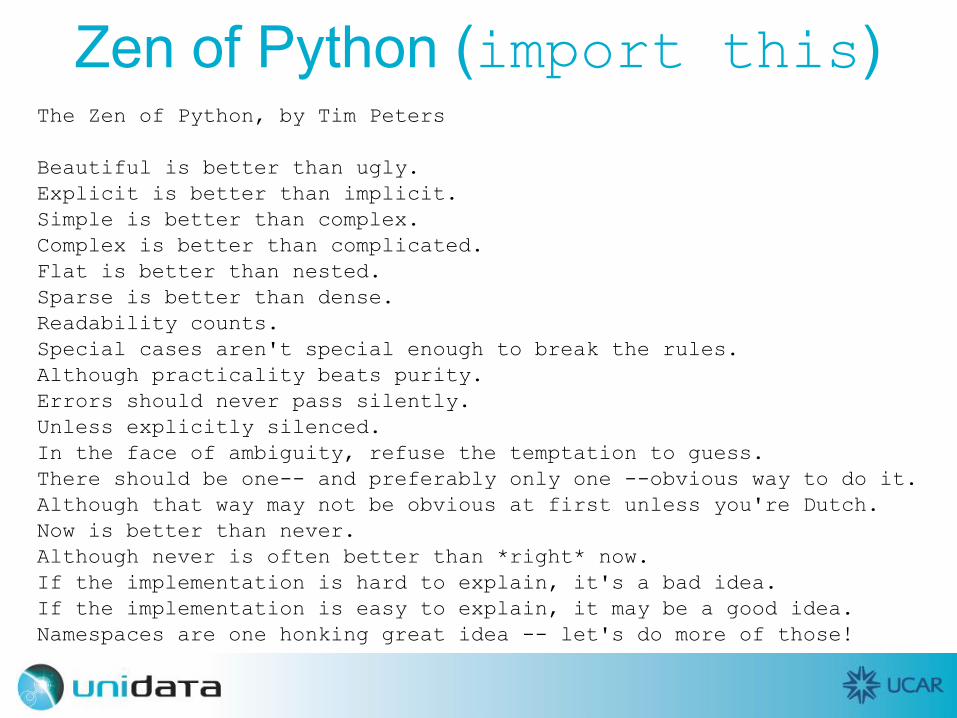
Scientific Python: Matplotlib• Matplotlib
• Provide MATLAB-like plotting interface
• Works with wide array of GUI interfaces
• Produces publication-quality figures
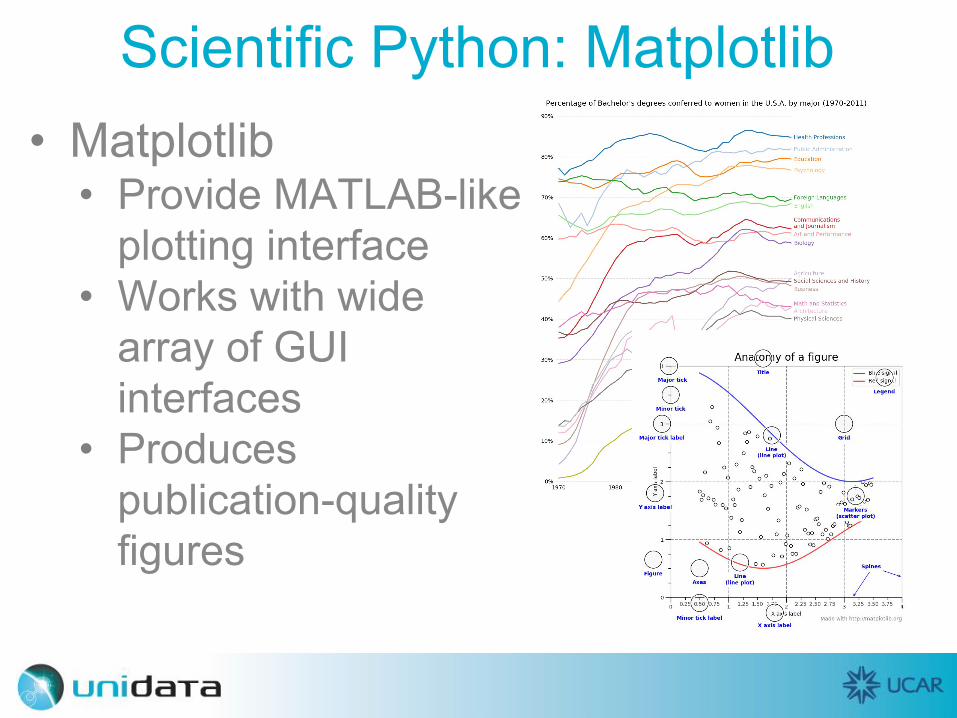
Scientific Python: The Core• NumPy: Fast mathematical arrays
• Array math• Avoid python loops
• SciPy: interfaces to general algorithms• Integration, linear algebra, FFT• Spatial algorithms, random numbers, stats
• IPython: interactive analysis sandbox• Interactive plotting with matplotlib• Various improvements for working with
data interactively

Where do we stand today?

Second Most Popular?Based on active GitHub repositories. (October 2016)
Python is also #5 in the Tiobe programming language index.http://www.tiobe.com/tiobe-index
Python
Python: Healthy as Ever• Growing migration from Python 2 to 3• End-of-life for 2.7 announced for
2020--Jupyter/IPython, Matplotlib, Pandas all following suit
• 3.6 released 23 December 2016• Many small additions• Some performance optimization• 3.6 up to 20% faster than 2.7

Python Upload StatisticsSupports Python 2 only or both
Supports Python 3 only or both
Per
cent
age
of U
ploa
ds

What About for Science?• Numpy 1.12
• released 15 January• Matplotlib 2.0
• released 16 January• Tutorial Tuesday
• SciPy 0.18.1• Released 19 Sept.
• IPython has grown into Jupyter
https://xkcd.com/353/

What’s It Like?import matplotlib.pyplot as pltimport netCDF4
# Read netCDF fileds = netCDF4.Dataset('ndfd.nc')time_var = ds['time']time = netCDF4.num2date(time_var[:], time_var.units)temps = ds['Temperature'][:].squeeze()
# Plot time seriesfig, ax = plt.subplots(figsize=(12, 8), dpi=300)ax.plot(time.squeeze(), temps - 273, 'tab:red')ax.grid()ax.set_ylabel('Temperature (\N{DEGREE CELSIUS})', fontsize='x-large')fig.autofmt_xdate()

The Result

Tools That Fit Together• NumPy, Matplotlib, SciPy, IPython• CartoPy: Maps to go with Matplotlib• Pandas & Xarray: Array data structures• Sympy: Symbolic mathematics• Scikit-learn: Machine learning• Scikit-image: Image processing• Cython/f2py: Optimize
and link to compiled codeAnd many, many more!

Examples
Scikit-Image
Scikit-Learn
Matplotlib

The Double Pendulum System

Examples (CartoPy)NOAA Aurora Forecast

Others Using Python• Domains
• Quantitative Finance • Astronomy
• LIGO gravitational wave experiment
• Oceanography• Genomics
• Web Applications• Scientific Python
consulting• Many, many others
And Meteorology!• MetPy: General metr. tools (GEMPAK)• Siphon: THREDDS Python API• netcdf4-Python: netCDF reader/writer• Pyart: ARM Radar Toolkit• SHARPpy: NSHARP ported to Python• Pygrib: GRIB format reader• PyNIO/PyNGL: NCL wrappers• UV-CDAT: Ultrascale Visualization
Climate Data Analysis Tools• Aospy, windrose, windspharm, ....

Examples (MetPy)
It’s Not Just Pretty PicturesMy projects that have used Python:
• Radar simulation• Feeding real-time NEXRAD data into
Amazon S3 for NOAA Big Data Projecthttps://aws.amazon.com/noaa-big-data/nexrad/
• Mass data conversion• Website scraping• Algorithm prototypes

Getting Python
• Conda (from Continuum Analytics)• Python distributions
• Anaconda: Download full collection• Miniconda: Download what you need
• Simplifies installing libraries with compiled extensions
• Conda-forge community channel with over 1500 packages

Jupyter Notebooks• Notebooks combine text, code, and rich output
• HTML and Javascript• Images
• Share analysis and code• Learning resources• Runs on its own server over http -> accessed
through a web browser• Notebook server can be remote--close to data!• JupyterHub authenticated, multi-user server

Notebook Demo

Python for Gravitational Waves?

Community• All of this work is free and open-source• ANYONE can contribute• Pyaos Mailing list• Community conferences and workshops
• Unidata Training Workshops• SciPy (10-16 July Austin, TX)• PyCon (17-25 May Portland, OR)• AnacondaCon (7-9 February Austin, TX)• PyData

Unidata and MetPy• Unidata is here to help support the use of Python
in the atmospheric sciences• Python projects on GitHub: MetPy, Siphon,
netcdf4-python, notebook-gallery• https://github.com/Unidata
• Join us!• Bug reports and feature requests• Contributions: code, examples, documentation
• Follow along:• @metpy on Twitter • [email protected]

Coming soon to a python environment near you...
Python Performance• Dask
• “Versatile parallel programming with task scheduling”
• Numba• JIT compile parts of Python code with LLVM
• PyPy• Full JIT-compiled Python interpreter• Only recent support for C-extensions and
numpy

Dask Demo

Jupyter and More Jupyter• Notebook Widgets
• Make your notebooks interactive without editing
• Dashboards• Layout notebooks outputs on a grid or cell• Works really well with widgets
• Dashboard server• Deploy a notebook as a web application
• JupyterLab

Notebook Widgets

Dashboard Layout

Dashboard Running

JupyterLab

Would you like to know more?
Takeaways• Python continues to be a strong,
community-driven tool for science• Tools for meteorology are growing
• MetPy wants your contributions!• Leverages the efforts of a broad community
• Better tools• Better skills for graduates in our field• We get out what we put in
• Jupyter notebooks and javascript are important tool for our increasing data volumes

Unidata is one of the University Corporation for Atmospheric Research (UCAR)'s
Community Programs (UCP), and is funded primarily by the National Science Foundation
(Grant NSF-1344155).

Resources• PyAOS: http://pyaos.johnny-lin.com/• SciPy Organization: https://scipy.org/• Unidata Python Training Workshop:
http://unidata.github.io/unidata-python-workshop• MetPy: http://unidata.github.io/MetPy• JupyterLab: https://github.com/jupyterlab• Dashboard: https://github.com/jupyter/dashboards• Anaconda: https://www.continuum.io/downloads• Miniconda: http://conda.pydata.org/miniconda.html

Links to Examples• Scikit-learn:
http://scikit-learn.org/stable/auto_examples/index.html• Scikit-image:
http://scikit-image.org/docs/dev/auto_examples/• CartoPy:
http://scitools.org.uk/cartopy/docs/latest/gallery.html• MetPy: https://unidata.github.io/MetPy/examples/index.html• Matplotlib:
• http://matplotlib.org/gallery.html• http://matplotlib.org/examples/index.html
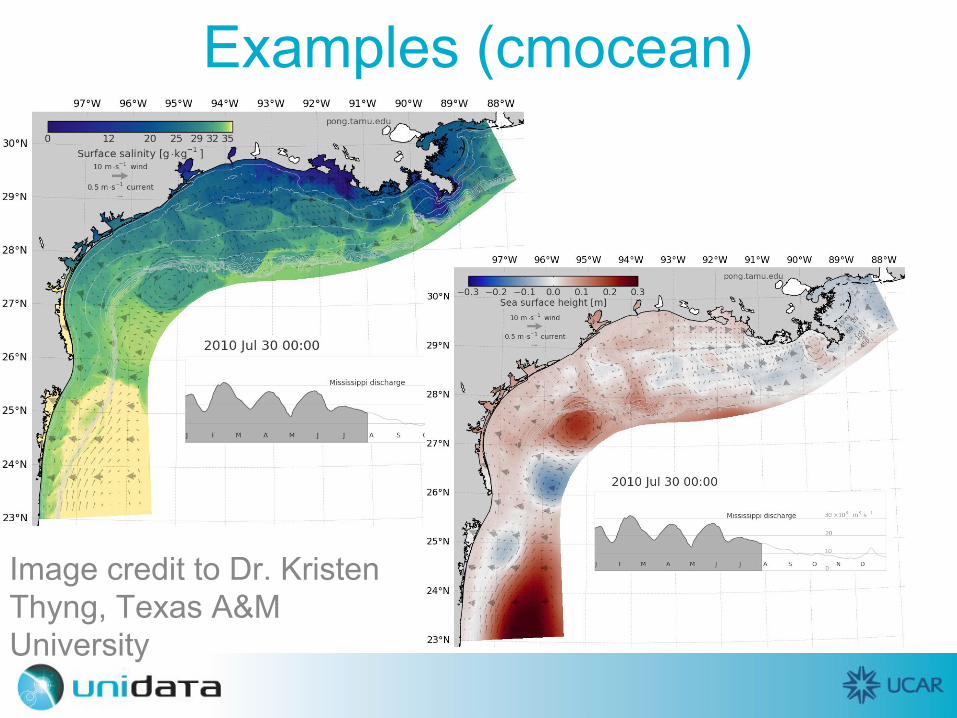
Examples (cmocean)
Image credit to Dr. Kristen Thyng, Texas A&M University