Embed Size (px)
Citation preview

PYRAMID SERVINGS DATAResults from USDA’s 1994 Continuing Survey of Food Intakes by Individuals
Table Set 3
By
Linda E. Cleveland, Annetta J. Cook, John W. Wilson, James E. Friday, Jane W. Ho, and Parshotam S. Chahil
Food Surveys Research Group Beltsville Human Nutrition Research Center
Agricultural Research Service U.S. Department of Agriculture
10300 Baltimore Ave., Bldg. 005, Rm 102, BARC-West Beltsville, Maryland 20705-2350
http://www.barc.usda.gov/bhnrc/foodsurvey/home.htmMarch 1997

Fats, Oils, and SweetsUSE SPARINGLY
2-3dairy
servings
5-7meatounces
3-5vegetableservings
2-4fruit
servings
6-11grain servings
Fats, Oils, and Sweets
1-1/2dairy
servings
4-3/4meatounces
3-1/3vegetableservings
1-2/3fruit
servings
6-2/3grain servings
USDA's Food Guide Pyramid Average American Diet, 1994
The Pyramid shows a recommended range of servings to eat each day from five major food groups -- Grain, Vegetable, Fruit, Dairy, and Meat. In general, the numbers of servings that are right for a person depend on calorie needs; people who need more calories should eat more servings. The Pyramid also provides guidance to help people choose diets low in fat and moderate in sugars.
In 1994, the average diet of Americans 2 years of age and over contained almost 2,000 calories. On average, servings from the fruit, dairy, and meat groups were below recommended ranges and servings from the grain and vegetable groups were near the bottom of recommended ranges. Calories from fats and sugars exceeded Pyramid recommendations.
page 1
How Do American Diets Stack Up Compared to Food Guide Pyramid Recommendations?
A survey of what Americans eat conducted by the U.S. Department of Agriculture (USDA) provides the answer. In 1994, as part of theContinuing Survey of Food Intakes by Individuals (CSFII), USDA interviewed people nationwide to find out what they ate and drank (USDA-ARS1996). Results reported here are based on information from 4,952 people 2 years of age and over who provided food intakes on 2 days. Theseresults were compared to the recommendations in USDA’s Food Guide Pyramid (USDA 1992).

page 2
A New Method for Evaluating Food Intakes...
USDA has developed a new method for converting data from theCSFII into servings to find out how well Americans eat compared toPyramid recommendations. The method adheres to Pyramidprinciples, uses the serving sizes specified by the Pyramid, andstrictly categorizes foods according to Pyramid criteria. Since manyfoods people eat -- foods like pizza, soups, and pies -- count towardmore than one food group, the method separates foods into theiringredients before servings are counted.
Interpreting the Food Guide Pyramid Recommendations...
The Pyramid provides guidance for individuals 2 years of age andover. According to the Pyramid, everyone should eat at least thelowest number of servings within recommended ranges. Except forthe dairy group, the number of servings that is right for a persondepends on his or her calorie needs. For the dairy group, therecommended number of servings depends on age and for women, onwhether or not they are pregnant or lactating.
Generally speaking, the bottom of the recommended range of servingsis about right for many sedentary women and older adults, the middleis about right for most children, teenage girls, active women, andmany sedentary men, and the top of the range is about right forteenage boys, many active men, and some very active women. Preschool children with low calorie needs (less than 1,600 calories)should eat at least the lowest number of servings in the ranges, butthey can eat smaller servings from all except the dairy group.
Shown below are sample Pyramid diets for a day at three calorielevels. These diets are guides to the number of servings from eachfood group people should eat depending on their calorie needs.
SAMPLE DIETS FOR A DAY AT 3 CALORIE LEVELS
Lower Moderate Higher
about about about
1,600 2,200 2,800
Bread GroupServings
6 9 11
Vegetable GroupServings
3 4 5
Fruit GroupServings
2 3 4
Dairy GroupServings
2-3 2-3 2-31 1 1
Meat Group(ounces)
5 6 7
Women who are pregnant or lactating, teenagers, and young adults1
to age 24 need 3 servings.

page 3
What We Eat in America ..... 1994 Results
Grain Group . The Pyramid recommends eating 6 to 11 servings ofgrain products each day; several should be whole-grain servings. One serving is defined as 1 slice of bread, 1 small roll or muffin, 1/2of a bagel or croissant, 1 ounce of ready-to-eat cereal, or 1/2 cup ofcooked cereal, rice, or pasta.
> Americans ate an average of about 6-2/3 servings of grainproducts daily. Only 1 of these servings (15%) was a whole-grain serving. That's well below what the Pyramid suggests.
> About half (51%) of Americans consumed at least 6 servings ofgrain products daily (the bottom of the recommended range), andonly 36 percent met or exceeded the recommendation based ontheir calorie intake.
Vegetable Group. The Pyramid recommends eating 3 to 5 servingsof vegetables each day. It suggests eating dark-green leafyvegetables and cooked dry beans and peas several times a week. One serving is defined as 1 cup of raw leafy vegetables, 1/2 cup ofcooked or chopped raw vegetables, or 3/4 cup of vegetable juice.
> Americans ate an average of 3-1/3 servings of vegetables daily. Intakes of vegetables that the Pyramid emphasizes were notablylow. Dark-green leafy vegetables made up only 3 percent of thevegetable servings and cooked dry beans and peas made up only6 percent. In contrast, white potatoes made up 33 percent of thevegetable servings.
> Americans were more likely to meet their recommendation forthe vegetable group than for most other groups. Still, 59 percentfailed to meet the recommendation based on their calorie intake.
Fruit Group . The Pyramid recommends eating 2 to 4 servings offruit each day -- about half from citrus fruit, melons, and berries andhalf from other fruits. One serving is defined as a whole fruit such asa medium apple, banana, or orange, a grapefruit half, 1/2 cup ofberries, melon, or chopped raw fruit, 1/2 cup of cooked or cannedfruit, 1/4 cup of dried fruit, or 3/4 cup of fruit juice.
> Americans ate an average of 1-2/3 servings of fruit daily. Equalproportions were from citrus fruits, melons, and berries and fromother fruits.
> The percentage of Americans who met their recommendation waslow (24%). Almost half (48%) failed to consume even 1 servingof fruit a day.
Dairy Group . The Pyramid recommends consuming 2 to 3 servingsof dairy products each day. One serving is defined as 1 cup of milkor yogurt, 1-1/2 ounces of natural cheese, or 2 ounces of processedcheese. Dairy ingredients in ice cream, ice milk, frozen yogurt,custard, pudding and other foods count toward dairy servings, too.
> Americans consumed an average of 1-1/2 servings a day from thedairy group, with 1 serving from milk and 1/2 serving fromcheese.
> The percentage of Americans who met their dairy grouprecommendation was low (23%). It was especially low amongteenage girls (12%) and women 20 years and over (14%).

page 4
Meat Group. The Pyramid recommends consuming 2 to 3 servings The Pyramid suggests that Americans try to limit their added sugarseach day of foods from the meat group. The total amount of these to 6 teaspoons a day if they eat about 1,600 calories, 12 teaspoons atservings should be the equivalent of 5 to 7 ounces of cooked lean 2,200 calories, or 18 teaspoons at 2,800 calories.meat, poultry, or fish. According to the Pyramid, 1 egg, 1/2 cup oftofu, 2 tablespoons of peanut butter, 1/3 cup of nuts, and 1/4 cup of > Americans consumed an average of 19 teaspoons of addedseeds are each equivalent to 1 ounce of cooked lean meat. sugars a day in a diet that provided about 2,000 calories. Added
> The average amount of meat and meat alternates consumed byAmericans was the equivalent of about 4-3/4 ounces of cookedlean meat a day. Forty percent was from red meat, and 27percent was from poultry. Meat alternates (eggs, nuts, seeds, andsoybean products) accounted for only 10 percent of the meatservings.
> Fifty-two percent of men, but only 25 percent of women met theirmeat group recommendation.
The Pyramid Tip. The Pyramid recommends that Americans limitthe fat in their diets to 30 percent of calories. People will consumeabout half of this amount if they eat the recommended number ofservings from each food group, select the lowest fat choices, and addno fat to their foods in preparation or at the table. Additional fat, upto 30 percent of calories, is considered discretionary in that peoplecan decide whether to get it from higher-fat food choices or additionsto their foods.
> The average fat intake of Americans, at 33 percent of calories,exceeded the recommendation.
> Discretionary fat accounted for 25 percent of calories. Discretionary fat includes fat added to foods in preparation or atthe table and excess fat above amounts people would consume ifthey selected only the lowest-fat foods within the major foodgroups. Examples are the fat absorbed by french-fried potatoesduring preparation, the fat from margarine spread on bread at thetable, and the fat in whole milk.
sugars accounted for 15 percent of calories.
page 5
References
U.S. Department of Agriculture. 1992. The Food Guide Pyramid. Home and Garden Bulletin 252.
U.S. Department of Agriculture, Agricultural Research Service. 1996. 1994 Continuing Survey of Food Intakes by Individuals and1994 Diet and Health Knowledge Survey. CD-ROM, NTISaccession number PB96-501010.
Summary Data Tables and Microdata
Summary data tables showing average food intakes as Pyramidservings and percentages of people by sex and age consumingvarious numbers of servings are available on the Home Page forUSDA's Food Surveys Research Group at http://www.barc.usda.gov/bhnrc/foodsurvey/home.htm. In addition, the microdata are availableon CD-ROM for use in secondary analyses. The CD-ROM can bepurchased by writing to the National Technical Information Service,5285 Port Royal Road, Springfield, VA 22161 or calling them at(703) 487-4650. The price is $50. When placing an order, requestthe 1994 Continuing Survey of Food Intakes by Individuals: PyramidServings, accession number PB97-502058.
Suggested citation: Cleveland, L.E., A.J. Cook, J.W. Wilson, J.E.Friday, J.W. Ho, and P.S. Chahil. 1997, March 10. PyramidServings Data: Results from USDA’s 1994 Continuing Survey ofFood Intakes by Individuals, [Online]. ARS Food Surveys ResearchGroup. Available (under “Releases”): <http://www.barc.usda.gov/bhnrc/foodsurvey/home.htm> [visited year, month, date].

page 6
PYRAMID SERVINGS DATA
This table set presents data comparing food intakes of Americans to recommendations in the U.S. Department of Agriculture's Food Guide Pyramid-- a general guide designed to help Americans choose what and how much to eat to get the nutrients they need without excess calories or fat. ThePyramid specifies numbers of servings to eat from five major food groups (grain, vegetable, fruit, dairy, and meat) and gives advice about intakesof fats and added sugars as well.
The data are derived from the 1994 Continuing Survey of Food Intakes by Individuals (CSFII 1994) conducted by the Agricultural ResearchService of the U.S. Department of Agriculture. The data in these tables provide national probability estimates for the U.S. population based onfood intakes reported by 4,952 individuals 2 years of age and older on 2 nonconsecutive days. Sample sizes on which the estimates are based areprovided in appendix A. Daggers are used in the tables to flag estimates that may tend to be less statistically reliable than those that are notflagged. Statistical guidelines are provided in appendix B.
List of Tables
Average daily servings from Pyramid food groups Table 1A. Grain group Table 2A. Vegetable group Table 3A. Fruit group Table 4A. Dairy group Table 5A. Meat and meat alternates group
Percentages of individuals consuming various numbers of servings from Pyramid food groups Table 1B. Grain group Table 2B. Vegetable group Table 3B. Fruit group Table 4B. Dairy group Table 5B. Meat and meat alternates group
The Pyramid tip Table 6. Calories, total fat, discretionary fat, and added sugars
Appendixes A. Counts of individuals B. Statistical notes

Table 1A.--Grain Group: How many servings did Americans eat a day, on average, in 1994? USDA's Food Guide Pyramid recommends eating between 6 and 11 servings of grain products each day, depending on calorie needs.
PercentageSex and age Nonwhole-grain Whole-grain Total of(years) products products grain products population
-------------------------------------------- Servings ‡ ---------------------------------------------Percent
Males:5.4.96.33.4x 2-5...............................................5.8.96.74.7x 6-11.............................................8.21.09.25.9x 12-19..........................................7.41.18.57.0x 20-29..........................................7.01.28.29.3x 30-39..........................................6.91.28.16.8x 40-49..........................................5.81.27.04.8x 50-59..........................................5.81.27.03.5x 60-69..........................................5.11.36.43.4x 70 and over................................6.61.27.834.9x 20 and over.............................
Females:5.01.06.03.1x 2-5...............................................5.1.86.04.5x 6-11.............................................5.6.96.55.7x 12-19..........................................4.7.85.57.2x 20-29..........................................4.7.95.59.3x 30-39..........................................4.9.85.76.9x 40-49..........................................4.3.95.25.2x 50-59..........................................3.9.94.84.6x 60-69..........................................3.9.94.94.7x 70 and over................................4.5.85.337.9x 20 and over.............................
5.61.06.6100.0xAll Individuals 2 and over..............
‡ One serving is 1 slice of bread; 1 small roll; 1/2 bagel, English muffin, or croissant; 1 ounce of ready-to-eat cereal; 1/2 cup cooked cereal, rice, or pasta; 1 small muffin; or amounts of other grain products such as pretzels and cakes that contain an amount of grain equivalent to that in a standard slice of bread. For children 2 to 5 years old who consume less than 1,600 calories per day, 1 serving is two-thirds of the standard serving size to allow for their lower energy needs. Whole- and nonwhole-grain servings were calculated based on the proportionof whole- and nonwhole-grain ingredients in foods as consumed.
SOURCE: 1994 Continuing Survey of Food Intakes by Individuals, 2-day average, excluding breast-fed children USDA, ARS, Beltsville Human Nutrition Research Center, Food Surveys Research Group
page 7

Table 1B.--Grain Group: In 1994, what percentage of Americans consumed less than 1 serving of grain products a day? What percentage consumed the number of servings recommended by USDA's Food Guide Pyramid?
Percentage of individuals...... PercentageSex and age of(years)
Consuming number of Consuming at least Consuming less than population servings recommended minimum number of 1 serving a day based on caloric intake ‡ servings recommended
(6 a day)
---------------------------------------------------------- Percent -------------------------------------------------------Percent
Males:4852† *3.4x 2-5...............................................4357† *4.7x 6-11.............................................517505.9x 12-19..........................................4168† *7.0x 20-29..........................................416909.3x 30-39..........................................3965† *6.8x 40-49..........................................3557† 14.8x 50-59..........................................3957† *3.5x 60-69..........................................3952† 13.4x 70 and over................................3963† *34.9x 20 and over.............................
Females:4244† 13.1x 2-5...............................................3444† 14.5x 6-11.............................................4152† 15.7x 12-19..........................................2333† 27.2x 20-29..........................................2839† 29.3x 30-39..........................................3442† 16.9x 40-49..........................................2833† 15.2x 50-59..........................................2527† 44.6x 60-69..........................................293204.7x 70 and over................................2835237.9x 20 and over.............................
36511100.0xAll Individuals 2 and over..............
‡ Recommended servings were derived from sample patterns in "The Food Guide Pyramid" (USDA 1992). Individuals consuming less than 2,200 caloriesmet the recommendation if they ate at least 6 grain servings a day; individuals consuming 2,200 up to 2,800 calories met the recommendation if they ateat least 9 grain servings a day; and individuals consuming 2,800 calories or more met the recommendation if they ate at least 11 grain servings a day.
* Value less than 0.5 but greater than 0.
† See "Statistical notes," appendix B.
SOURCE: 1994 Continuing Survey of Food Intakes by Individuals, 2-day average, excluding breast-fed children USDA, ARS, Beltsville Human Nutrition Research Center, Food Surveys Research Group page 8

Table 2A.--Vegetable Group: How many servings did Americans eat a day, on average, in 1994? USDA's Food Guide Pyramid recommends eating between 3 and 5 servings of vegetables each day, depending on calorie needs.
Starchy vegetables Other Cooked Deep Dark Total PercentageSex and age vegetables Tomatoes dry beans yellow green leafy vegetables of(years)
Other White and peas vegetables vegetables population starchy ‡ potatoes
------------------------------------------------------------------------------------------ Servings § ---------------------------------------------------------------------------------------Percent
Males:.5.4.2.9.1.1.12.23.4x 2-5................................................5.4.21.0.1.1† .12.44.7x 6-11..............................................8.7.21.6.2.1.13.75.9x 12-19..........................................
1.2.7.21.7.2.1.14.47.0x 20-29..........................................1.4.7.21.5.2.2.24.49.3x 30-39..........................................1.3.6.31.3.2.2.24.26.8x 40-49..........................................1.2.5.31.2.2.2.23.94.8x 50-59..........................................1.4.5.31.2.2.3.24.13.5x 60-69..........................................1.1.5.3.9.2.2.23.43.4x 70 and over................................1.3.6.31.4.2.2.24.234.9x 20 and over.............................
Females:.5.3.2.9.1.1.12.23.1x 2-5................................................5.3.2.8.1.1† .12.04.5x 6-11..............................................7.5.11.2.1.1.12.95.7x 12-19...........................................9.5.2.9.1.1.12.87.2x 20-29..........................................
1.0.4.2.8.2.2.23.09.3x 30-39..........................................1.2.5.2.8.1.2.23.26.9x 40-49..........................................1.1.4.2.9.1.2.23.25.2x 50-59..........................................1.2.5.2.7.2.2.23.14.6x 60-69..........................................
.9.4.2.6.1.2.22.74.7x 70 and over................................1.0.5.2.8.1.2.23.037.9x 20 and over.............................
1.0.5.21.1.2.2.13.3100.0xAll Individuals 2 and over..............
‡ Examples are corn, green peas, and lima beans (immature).
§ One serving is 1 cup of raw leafy vegetables; 1/2 cup of cooked or chopped raw vegetables; 1 ounce of vegetable chips; or 3/4 cup of vegetable juice. For children 2 to 5 years old who consume less than 1,600 calories per day, 1 serving is two-thirds of the standard serving size to allow for their lower energy needs.
† See "Statistical notes," appendix B.
SOURCE: 1994 Continuing Survey of Food Intakes by Individuals, 2-day average, excluding breast-fed children USDA, ARS, Beltsville Human Nutrition Research Center, Food Surveys Research Group
page 9

Table 2B.--Vegetable Group: In 1994, what percentage of Americans consumed less than 1 serving of vegetables a day? What percentage consumed the number of servings recommended by USDA's Food Guide Pyramid?
Percentage of individuals...... PercentageSex and age of(years)
Consuming number of Consuming at least Consuming less than population servings recommended minimum number of 1 serving a day based on caloric intake ‡ servings recommended
(3 a day)
--------------------------------------------------------- Percent ------------------------------------------------------Percent
Males:2526213.4x 2-5...............................................2328154.7x 6-11.............................................395495.9x 12-19..........................................5369† 57.0x 20-29..........................................4967† 59.3x 30-39..........................................516166.8x 40-49..........................................546394.8x 50-59..........................................5465† 33.5x 60-69..........................................4252113.4x 70 and over................................5164634.9x 20 and over.............................
Females:2223233.1x 2-5...............................................1823274.5x 6-11.............................................3139125.7x 12-19..........................................3438157.2x 20-29..........................................404389.3x 30-39..........................................485276.9x 40-49..........................................454995.2x 50-59..........................................485064.6x 60-69..........................................3838104.7x 70 and over................................4245937.9x 20 and over.............................
414910100.0xAll Individuals 2 and over..............
‡ Recommended servings were derived from sample patterns in "The Food Guide Pyramid" (USDA 1992). Individuals consuming less than 2,200 caloriesmet the recommendation if they ate at least 3 vegetable servings a day; individuals consuming 2,200 up to 2,800 calories met the recommendation if they ate at least 4 vegetable servings a day; and individuals consuming 2,800 calories or more met the recommendation if they ate at least 5 vegetable servingsa day.
† See "Statistical notes," appendix B.
SOURCE: 1994 Continuing Survey of Food Intakes by Individuals, 2-day average, excluding breast-fed children USDA, ARS, Beltsville Human Nutrition Research Center, Food Surveys Research Group
page 10

Table 3A.--Fruit Group: How many servings did Americans eat a day, on average, in 1994? USDA's Food Guide Pyramid recommends eating between 2 and 4 servings of fruits each day, depending on calorie needs.
PercentageSex and age Other Citrus fruits, Total of(years) fruits melons, berries fruits population
-------------------------------------- Servings ‡ -------------------------------------Percent
Males:1.7.82.43.4x 2-5...............................................
.9.61.64.7x 6-11.............................................
.6.81.35.9x 12-19..........................................
.5.81.37.0x 20-29..........................................
.9.61.59.3x 30-39..........................................
.8.81.66.8x 40-49..........................................
.8.71.64.8x 50-59..........................................1.0.91.93.5x 60-69..........................................1.21.02.23.4x 70 and over................................
.8.81.634.9x 20 and over.............................
Females:1.3.62.03.1x 2-5...............................................
.9.71.64.5x 6-11.............................................
.6.61.25.7x 12-19..........................................
.6.61.27.2x 20-29..........................................
.7.61.49.3x 30-39..........................................
.8.71.56.9x 40-49..........................................
.8.91.75.2x 50-59..........................................
.91.12.04.6x 60-69..........................................
.9.81.74.7x 70 and over................................
.8.81.537.9x 20 and over.............................
.8.71.6100.0xAll Individuals 2 and over..............
‡ One serving is a whole fruit such as a medium apple, banana, or orange; a grapefruit half; 1/2 cup of berries, melon, or chopped raw fruit; 1/2 cup of cooked or canned fruit; 1/4 cup of dried fruit; or 3/4 cup of fruit juice. For children 2 to 5 years old who consume less than 1,600 calories, 1 serving is two-thirds of the standard serving size to allow for their lower energy needs.
SOURCE: 1994 Continuing Survey of Food Intakes by Individuals, 2-day average, excluding breast-fed children USDA, ARS, Beltsville Human Nutrition Research Center, Food Surveys Research Group
page 11
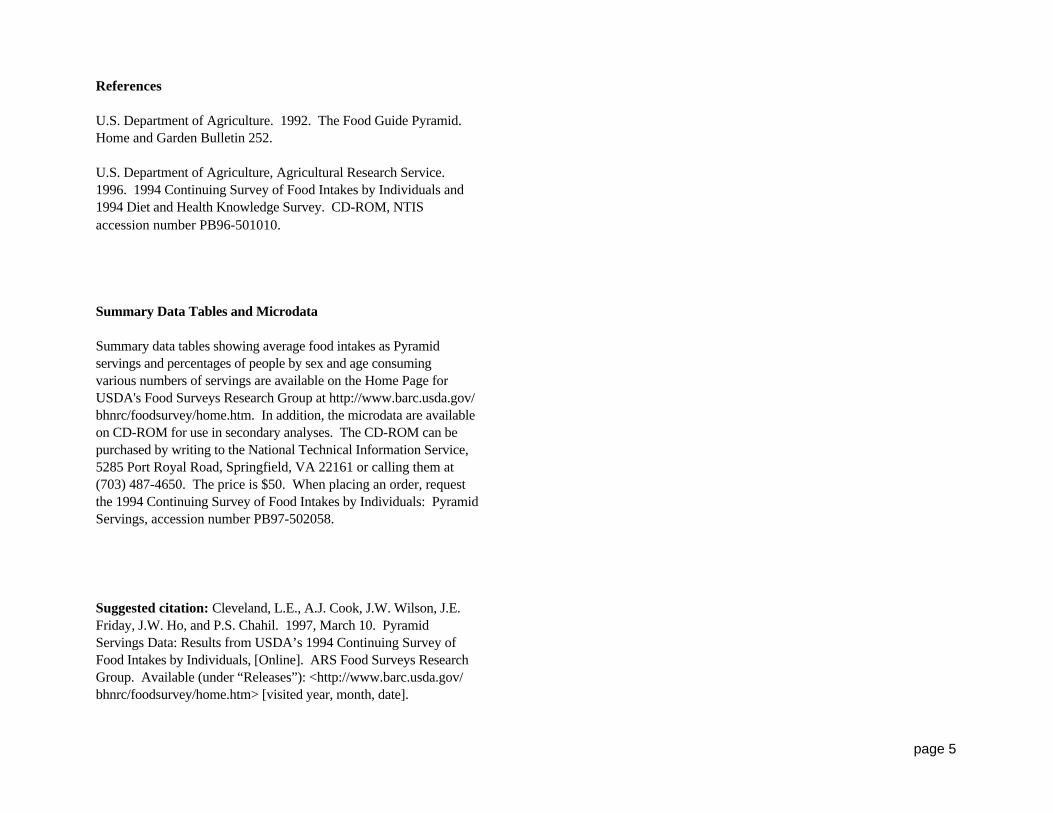
Table 3B.--Fruit Group: In 1994, What percentage of Americans consumed less than 1 serving of fruit a day? What percentage consumed the number of servings recommended by USDA's Food Guide Pyramid?
Percentage of individuals...... PercentageSex and age of(years)
Consuming number of Consuming at least Consuming less than population servings recommended minimum number of 1 serving a day based on caloric intake ‡ servings recommended
(2 a day)
---------------------------------------------------------- Percent --------------------------------------------------------Percent
Males:4851263.4x 2-5...............................................2327444.7x 6-11.............................................1320545.9x 12-19..........................................1422607.0x 20-29..........................................1928569.3x 30-39..........................................1928526.8x 40-49..........................................2230484.8x 50-59..........................................2734433.5x 60-69..........................................3544333.4x 70 and over................................21295134.9x 20 and over.............................
Females:4243313.1x 2-5...............................................2830434.5x 6-11.............................................1520565.7x 12-19..........................................1719587.2x 20-29..........................................2025549.3x 30-39..........................................2729496.9x 40-49..........................................3133435.2x 50-59..........................................3738374.6x 60-69..........................................3031354.7x 70 and over................................26284837.9x 20 and over.............................
242948100.0xAll Individuals 2 and over..............
‡ Recommended servings were derived from sample patterns in "The Food Guide Pyramid" (USDA 1992). Individuals consuming less than 2,200 caloriesmet the recommendation if they ate at least 2 fruit servings a day; individuals consuming 2,200 up to 2,800 calories met the recommendation if they ate atleast 3 fruit servings a day; and individuals consuming 2,800 calories or more met the recommendation if they ate at least 4 fruit servings a day.
SOURCE: 1994 Continuing Survey of Food Intakes by Individuals, 2-day average, excluding breast-fed children USDA, ARS, Beltsville Human Nutrition Research Center, Food Surveys Research Group
page 12

Table 4A.--Dairy Group: How many servings did Americans eat a day, on average, in 1994? USDA's Food Guide Pyramid recommends eating 2 or 3 servings of dairy products each day, depending on age and physiological status.
PercentageSex and age Cheese Yogurt Milk Total of(years)
dairy ‡ population
---------------------------------------------- Servings § -----------------------------------------------Percent
Males:.3*1.51.93.4x 2-5................................................5*1.72.34.7x 6-11..............................................8† *1.62.35.9x 12-19...........................................8† *.91.77.0x 20-29...........................................7*1.01.79.3x 30-39...........................................5*1.01.56.8x 40-49...........................................4† *.81.24.8x 50-59...........................................4† *.91.33.5x 60-69...........................................3† *1.11.33.4x 70 and over.................................6*.91.534.9x 20 and over.............................
Females:.3*1.51.83.1x 2-5................................................4*1.51.94.5x 6-11..............................................5† *1.01.65.7x 12-19...........................................5† *.81.37.2x 20-29...........................................4*.71.29.3x 30-39...........................................4† *.71.16.9x 40-49...........................................3.1.71.05.2x 50-59...........................................3*.71.04.6x 60-69...........................................2† *.71.04.7x 70 and over.................................4*.71.137.9x 20 and over.............................
.5*1.01.5100.0xAll Individuals 2 and over..............
‡ Includes small amounts of miscellaneous dairy products, such as whey and nonfat sour cream, that are not included in the subgroups(milk, yogurt, cheese).
§ One serving is 1 cup of milk; 1 cup of yogurt; 1-1/2 ounces of natural cheese; 2 ounces of processed cheese; 1/2 cup of ricotta cheese; or 2 cups of cottage cheese. Dairy desserts, such as ice cream, ice milk, frozen yogurt, custard, and pudding, were separated into ingredientsand servings from dairy ingredients (usually milk) are tabulated. Serving sizes are the same for all individuals regardless of age.
* Value less than 0.05 but greater than 0.
SOURCE: 1994 Continuing Survey of Food Intakes by Individuals, 2-day average, excluding breast-fed children USDA, ARS, Beltsville Human Nutrition Research Center, Food Surveys Research Group
page 13

Table 4B.--Dairy Group: In 1994, what percentage of Americans consumed less than 1 serving of dairy products a day? What percentage consumed at least 2 servings a day? What percentage consumed the number of servings recommended by USDA's Food Guide Pyramid?
Percentage of individuals...... PercentageSex and age of(years)
Consuming number of Consuming at least Consuming less than population servings recommended 2 servings a day 1 serving a day based on age and physiological status ‡
---------------------------------------------------------- Percent --------------------------------------------------------Percent
Males:3838203.4x 2-5...............................................4550134.7x 6-11.............................................2949255.9x 12-19..........................................2734377.0x 20-29..........................................3030409.3x 30-39..........................................2929426.8x 40-49..........................................1818534.8x 50-59..........................................2121483.5x 60-69..........................................2323423.4x 70 and over................................26274234.9x 20 and over.............................
Females:3737223.1x 2-5...............................................3743184.5x 6-11.............................................1228375.7x 12-19..........................................1421467.2x 20-29..........................................1418549.3x 30-39..........................................1919526.9x 40-49..........................................1111575.2x 50-59..........................................1212584.6x 60-69..........................................1111624.7x 70 and over................................14165437.9x 20 and over.............................
232742100.0xAll Individuals 2 and over..............
‡ The recommendation for an individual is based on age and physiological status. Women who were pregnant or lactating and individuals 11 to 24 years of age were counted as meeting the recommendation if they consumed at least 3 dairy servings a day; all other individuals were counted as meeting the recommendation if they consumed at least 2 dairy servings a day.
SOURCE: 1994 Continuing Survey of Food Intakes by Individuals, 2-day average, excluding breast-fed children USDA, ARS, Beltsville Human Nutrition Research Center, Food Surveys Research Group
page 14

Table 5A.--Meat Group: How many ounces of cooked lean meat or the equivalent in meat alternates did Americans eat a day, on average, in 1994? USDA's Food Guide Pyramid recommends eating between 5 and 7 ounces of cooked lean meat or the equivalent in meat alternates each day, depending on calorie needs.
Frankfurter Total PercentageSex and age Nuts and Soybean Eggs and lunch Organ Fish Poultry Meat meat and of(years) seeds products § meat meat alternates ‡ population
---------------------------------------------------------------------- Ounces Cooked Lean Meat Equivalents ¶ ---------------------------------------------------------------------Percent
Males:.2*.3.60.0.1.71.02.93.4x 2-5................................................2† *.3.8† *.3.71.53.84.7x 6-11..............................................2† *.4.9† *.41.62.45.95.9x 12-19...........................................2† *.51.1† .1.32.03.07.17.0x 20-29...........................................2† *.41.0† *.61.72.96.89.3x 30-39...........................................2† *.51.0† *.61.82.76.86.8x 40-49...........................................20.0.51.0† *.51.92.56.54.8x 50-59...........................................2† *.5.8† *.51.42.35.73.5x 60-69...........................................2† *.5.7† .1.61.01.64.73.4x 70 and over.................................2*.51.0*.51.72.66.534.9x 20 and over.............................
Females:.10.0.2.6† *.1.6.92.63.1x 2-5................................................1† *.2.80.0.1.71.13.14.5x 6-11..............................................1† *.3.6† *.3.91.73.95.7x 12-19...........................................1† *.3.6† *.31.31.44.07.2x 20-29...........................................1† *.3.7† *.31.11.64.19.3x 30-39...........................................1† *.4.5† .1.41.21.64.26.9x 40-49...........................................1† *.3.6† *.51.31.44.25.2x 50-59...........................................10.0.4.4† *.6.91.43.84.6x 60-69...........................................1*.4.4† .1.51.01.13.54.7x 70 and over.................................1*.3.5† *.41.11.44.037.9x 20 and over.............................
.1*.4.7*.41.31.94.8100.0xAll Individuals 2 and over..............
‡ Excludes cooked dry beans and peas, which are tabulated with vegetables in Table 2A; according to USDA's Food Guide Pyramid they can be counted as a vegetable or a meat alternate.
§ Includes tofu and simulated meat products made from soy.
¶ Only the lean portion of meat, poultry, fish, and simulated meat products is tabulated here. One egg, 1/2 cup of tofu, 2 tablespoons of peanut butter, 1/3 cup of nuts, and 1/4 cup of seeds are each equivalent to 1 ounce of cooked lean meat. Fat in excess of amounts in the leanest meats is tabulated as discretionary fat in Table 6.
* Value less than 0.05 but greater than 0.
† See "Statistical notes," appendix B.
SOURCE: 1994 Continuing Survey of Food Intakes by Individuals, 2-day average, excluding breast-fed children USDA, ARS, Beltsville Human Nutrition Research Center, Food Surveys Research Group
page 15

Table 5B.--Meat Group: In 1994, what percentage of Americans consumed less than 1 ounce of cooked lean meat or the equivalent in meat alternates a day? What percentage consumed the amount recommended by USDA's Food Guide Pyramid?
Percentage of individuals...... PercentageSex and age of(years)
Consuming number of Consuming at least 5 Consuming less than population ounce equivalents recommended ounce equivalents a day 1 ounce equivalent a day based on caloric intake ‡
-------------------------------------------------------------------------------- Percent ------------------------------------------------------------------------------Percent
Males:1910103.4x 2-5...............................................1721† 44.7x 6-11.............................................4556† 25.9x 12-19..........................................5467† 27.0x 20-29..........................................5565† *9.3x 30-39..........................................5668† 16.8x 40-49..........................................5663† 24.8x 50-59..........................................4959† 23.5x 60-69..........................................3541† 23.4x 70 and over................................5263134.9x 20 and over.............................
Females:178143.1x 2-5...............................................111394.5x 6-11.............................................242795.7x 12-19..........................................242867.2x 20-29..........................................262849.3x 30-39..........................................272966.9x 40-49..........................................283055.2x 50-59..........................................2627† 54.6x 60-69..........................................182064.7x 70 and over................................2527537.9x 20 and over.............................
34395100.0xAll Individuals 2 and over..............
‡ Recommended amounts were derived from sample patterns in "The Food Guide Pyramid" (USDA 1992). Individuals consuming less than 2,200 calories met the recommendation if theyate at least 5 ounces of cooked lean meat equivalents a day; individuals consuming 2,200 up to 2,800 calories met the recommendation if they ate at least 6 ounces of cooked lean meat equivalents a day; and individuals consuming 2,800 calories or more met the recommendation if they ate at least 7 ounces of cooked lean meat equivalents a day. The recommendationwas adjusted for children 2 to 5 years old who consumed less than 1,600 calories. To allow for their lower energy needs, the minimum recommendation was lowered by one-third to 3.3ounce equivalents. (For grains, fruits, and vegetables, these children's intakes were compared to minimum recommendations, but smaller serving sizes counted as a serving.)
* Value less than 0.5 but greater than 0.
† See "Statistical notes," appendix B.
SOURCE: 1994 Continuing Survey of Food Intakes by Individuals, 2-day average, excluding breast-fed children USDA, ARS, Beltsville Human Nutrition Research Center, Food Surveys Research Group
page 16

Table 6.--Pyramid Tip: How many calories and how much fat and sugar did Americans eat a day, on average, in 1994? USDA's Food Guide Pyramid recommends that fats and sugars be used sparingly; they contain calories and little else of nutritional value.
Added Discretionary Added Discretionary Total Food PercentageSex and age sugars fat sugars § fat ‡ fat energy of(years)
population
--- Teaspoons ¶ --- ---------- Grams --------- --------------------------- Percent of Kilocalories -------------------------- KilocaloriesPercent
Males:14.944.415.125.432.71,5493.4x 2-5...............................................21.556.717.825.833.31,9614.7x 6-11.............................................35.476.620.525.232.92,7055.9x 12-19..........................................26.776.515.724.933.52,7457.0x 20-29..........................................23.674.214.725.934.42,5499.3x 30-39..........................................20.070.613.125.734.62,4446.8x 40-49..........................................18.163.113.125.334.22,1844.8x 50-59..........................................16.358.412.024.533.22,0863.5x 60-69..........................................13.753.111.424.933.41,8683.4x 70 and over................................21.068.713.725.434.02,40334.9x 20 and over.............................
Females:14.342.515.926.333.41,4323.1x 2-5...............................................20.449.518.325.732.81,7334.5x 6-11.............................................22.253.219.125.333.11,8595.7x 12-19..........................................18.849.617.525.433.11,7097.2x 20-29..........................................16.845.415.824.232.21,6619.3x 30-39..........................................13.946.613.525.433.81,6276.9x 40-49..........................................13.245.013.425.033.21,5655.2x 50-59..........................................11.640.612.124.632.91,4584.6x 60-69..........................................10.636.312.323.932.21,3454.7x 70 and over................................14.844.714.524.832.91,58737.9x 20 and over.............................
19.256.115.225.233.31,971100.0xAll Individuals 2 and over..............
‡ Discretionary fat includes fats added to foods in preparation and at the table (i.e., cream, butter, margarine, cream cheese, oil, lard, meat drippings, cocoa, and chocolate) and fat from grainproducts, vegetables, fruits, dairy products, and meats and meat alternates beyond amounts people would consume if they seleted only the lowest-fat foods in each food group.
§ Includes white sugar, brown sugar, raw sugar, corn syrup, honey, molasses, and artificial sweeteners containing carbohydrate that were eaten separately or used as ingredients in processed or prepared foods such as breads, cakes, soft drinks, jams, and ice cream. Does not include sugars such as fructose and lactose that occur naturally in foods such as fruit and milk.
¶ Quantities are standardized on a carbohydrate equivalent basis. One teaspoon of added sugars is defined as the quantity of a sweetener that contains the same amount of carbohydrate as 1teaspoon (4 grams) of table sugar (sucrose).
SOURCE: 1994 Continuing Survey of Food Intakes by Individuals, 2-day average, excluding breast-fed children USDA, ARS, Beltsville Human Nutrition Research Center, Food Surveys Research Group
page 17

page 18
APPENDIX A. PYRAMID SERVINGS: COUNTS OF 2-DAY RESPONDENTS AND POPULATION PERCENTAGES, BY SEX AND AGE, 1994
Interpreting information in Appendix A--
! Appendix A shows unweighted counts of survey respondents in each sex-age group shown in the tables and the weighted percentages of thepopulation that they represent. One breast-fed child is excluded from the unweighted counts and the weighted percentages of the populationthey represent. Weights are used to account for differential rates of selection and nonresponse, to calibrate the sample to match populationcharacteristics known to be correlated with eating behavior, and to equalize intakes over the 4 quarters of the year and the 7 days of the week.

Appendix A.-- Pyramid Servings: Counts of 2-day respondents and population percentages, by sex and age, 1994
2-day 2-day percentage of countSex and age population (unweighted)(years) (weighted)
---------------- Percent ----------------
Males:3.4419x 2-5...............................................4.7252x 6-11.............................................5.9268x 12-19..........................................7.0244x 20-29..........................................9.3295x 30-39..........................................6.8288x 40-49..........................................4.8255x 50-59..........................................3.5231x 60-69..........................................3.4234x 70 and over................................
34.91,547x 20 and over.............................
Females:3.1410x 2-5...............................................4.5254x 6-11.............................................5.7261x 12-19..........................................7.2256x 20-29..........................................9.3278x 30-39..........................................6.9287x 40-49..........................................5.2272x 50-59..........................................4.6232x 60-69..........................................4.7216x 70 and over................................
37.91,541x 20 and over.............................
100.04,952xAll Individuals 2 and over..............
SOURCE: 1994 Continuing Survey of Food Intakes by Individuals, excluding 1 breast-fed child USDA, ARS, Beltsville Human Nutrition Research Center, Food Surveys Research Group
page 19

page 20
APPENDIX B. STATISTICAL NOTES
Estimates based on small cell sizes may tend to be less statistically reliable than estimates based on larger cell sizes. Cell size refers to theunweighted number of individuals in a given sex-age group or demographic group (see appendix A). The guidelines (listed below) for determiningwhen a cell size is small take into account the average design effect for the survey. The design effect results from the complex sample design andfrom the procedures used to weight the data. When the design effect is 1.00, its effect on accuracy is negligible; a larger design effect implies agreater effect on variance. The guidelines derive from a policy statement (FASEB/LSRO 1995) that specifies the use of a broadly calculatedaverage design effect. In that role, we are using a variance inflation factor. A variance inflation factor of 1.60, which is specific to the 2-day CSFIIdata set, was used in generating these tables.
Daggers † are used in the tables to flag estimates that may tend to be less statistically reliable than those that are not flagged. The rules used forflagging estimates are listed below, and tables to which each rule applies are identified.
1. An estimated mean or median is flagged when it is based on a cell size of less than 30 times the average design effect or when its coefficient ofvariation (CV) is equal to or greater than 30 percent. The CV is the ratio of the estimated standard error of the mean to the estimated mean,expressed as a percentage.
Rule 1 has been applied to data in tables 1A, 2A, 3A, 4A, 5A, and 6 to flag estimates that should be used with caution. It applies to mean intakes of servings and means expressed as percentages, such as the percent of kilocalories in table 6.
2. An estimated proportion (percent) that falls above 25 percent and below 75 percent is flagged when it is based on a cell size of less than 30
times the average design effect or when the CV is equal to or greater than 30 percent.
3. An estimated proportion of 25 percent or lower or 75 percent or higher is flagged when the smaller of np and n(1-p) is less than 8 times theaverage design effect, where "n" is the cell size on which the estimate is based and "p" is the proportion expressed as a fraction.
Rules 2 and 3 have been applied to data in tables 1B, 2B, 3B, 4B, and 5B to flag estimates that should be used with caution.
REFERENCEFederation of American Societies for Experimental Biology, Life Sciences Research Office. 1995. Third Report on Nutrition Monitoring in theUnited States: Volume 1. Prepared for the Interagency Board for Nutrition Monitoring and Related Research. U.S. Government Printing Office,Washington, DC, pages III-1 to III-10.


![[Proposal/report Click here and type;]'€¦ · Web viewGuideline Fruit ( 2 servings per day Vegetables ( 3 servings per day1 Fruit and vegetables ( 5 servings per day1 n % SEP](https://img.dokumen.tips/doc/110x75/5f3d17fdeed438296023db6d/proposalreport-click-here-and-type-web-view-guideline-fruit-2-servings-per.jpg)