Embed Size (px)
Citation preview

PYA3 Research Methods
Non Experimental Techniques

Non-Experimental Techniques
BATsBe able to describe the different types of
non-experimental techniques in Psychological research.
Identify different techniques in research studies learned so far
Evaluate the strengths and weaknesses of each type of technique
Interpret data from a correlational analysis

Types of Research Methods
• Investigations using correlational analysis.
• Naturalistic observations
• Questionnaires
• Interviews
• Case Studies
• Content analysis

Types of Experiment
You will need to know:
• how and when each type of non- experiment is used.
• the strengths and weaknesses of each research method
• The ethical issues raised when each type of research is carried out.

Non-Experimental Techniques
Choose one Non-experimental technique from the list below:
Naturalistic Observation p86/88
Questionnaire Survey p91/93
Interview p94/95
Correlational Analysis p84/5
Case Studies p97/99
Content analysis p124/5
Use your text book to find out:
1. Uses of this type of research
2. Its strengths and weaknesses.
3. Examples
4. Ethical IssuesYou will share your findings with the rest of the class/group

Non-Experimental Techniques
Now go round the other groups to fill in the rest of your sheet

Correlational Analysis
• A technique that shows whether or not 2 variables are associated.
• Correlations are presented as- a scattergram- A correlation coefficient – ranges from -1 to +1 (tells you the strength of the
correlation)-1 = strong negative correlation+1= strong positive correlation

Scattergrams
Look at these graphs.
Which is the positive, negative or no correlation?
A
CB
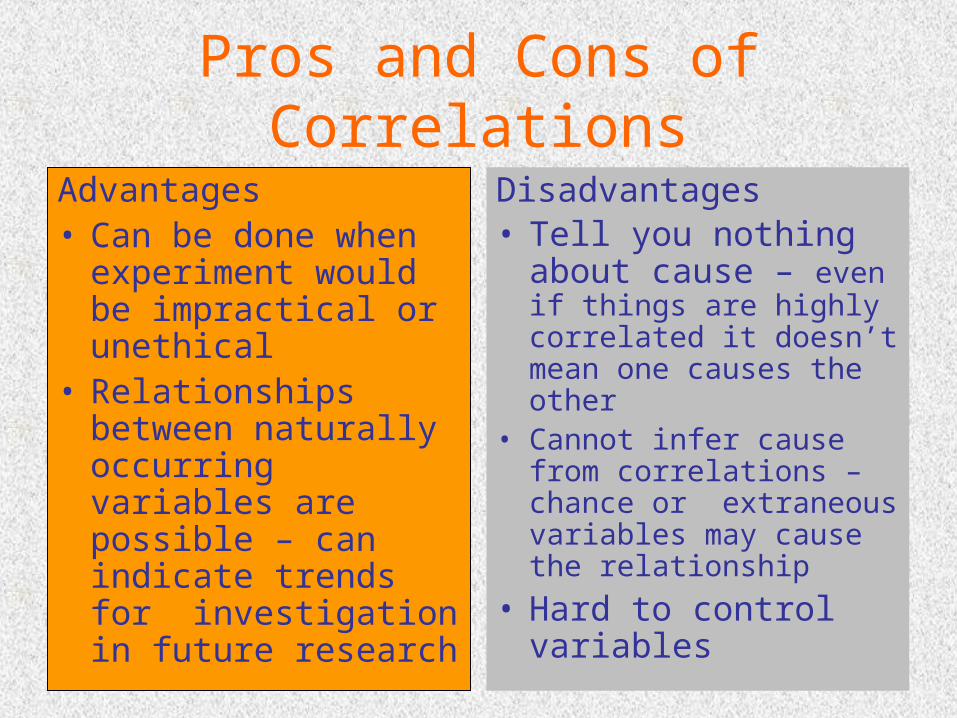
Pros and Cons of Correlations
Advantages• Can be done when
experiment would be impractical or unethical
• Relationships between naturally occurring variables are possible – can indicate trends for investigation in future research
Disadvantages• Tell you nothing about
cause – even if things are highly correlated it doesn’t mean one causes the other
• Cannot infer cause from correlations – chance or extraneous variables may cause the relationship
• Hard to control variables

Hypotheses in Correlational Studies
• More correct to use the term alternative hypothesis as not an experiment.
• Non-Directional hypothesis = There will be a relationship between age and intelligence
• Directional – there will be a positive correlation between age and intelligence or as age increases intelligence increases
• Null hypothesis – any relationship between variable x and variable y is due to chance

Try out a Correlational Analysis
• Aim: To find out if there is a correlation between exam stress score and exam confidence score
• Write an ALTERNATIVE operationalised hypothesis.
• Use the worksheets to help you collect data

Applying this to your data!
• Create a scattergram for your data
• Use Excel to calculate the correlation coefficient of the data.
• Was there a correlation between the 2 variables?
• See next slide or worksheet for instructions on how to calculate Correlation coefficient using Excel
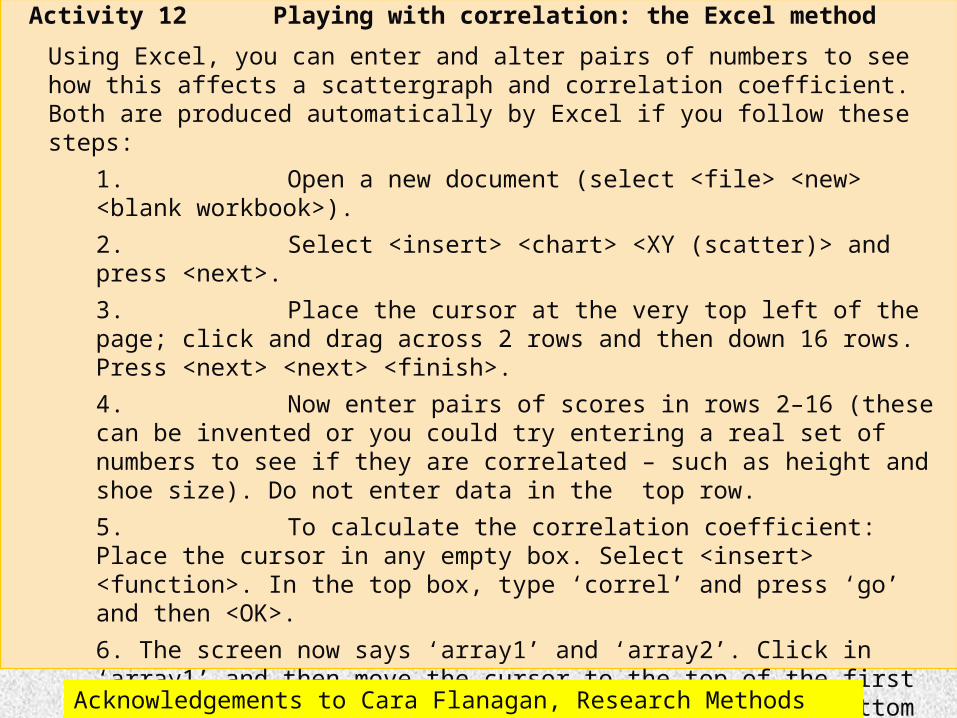
Activity 12 Playing with correlation: the Excel method
Using Excel, you can enter and alter pairs of numbers to see how this affects a scattergraph and correlation coefficient. Both are produced automatically by Excel if you follow these steps:
1. Open a new document (select <file> <new> <blank workbook>).
2. Select <insert> <chart> <XY (scatter)> and press <next>.
3. Place the cursor at the very top left of the page; click and drag across 2 rows and then down 16 rows. Press <next> <next> <finish>.
4. Now enter pairs of scores in rows 2–16 (these can be invented or you could try entering a real set of numbers to see if they are correlated – such as height and shoe size). Do not enter data in the top row.
5. To calculate the correlation coefficient: Place the cursor in any empty box. Select <insert> <function>. In the top box, type ‘correl’ and press ‘go’ and then <OK>.
6. The screen now says ‘array1’ and ‘array2’. Click in ‘array1’ and then move the cursor to the top of the first column of your numbers; then click and drag to the bottom of the column. Do the same for array2.
7. Try changing some of the numbers and see how this alters your scattergraph and correlation coefficient.
Or see p 124 of Exploring Psychology
Acknowledgements to Cara Flanagan, Research Methods text p48

Observations
What do the following terms mean?• Naturalistic observation• Controlled observation• Disclosed (overt) observation• Non-disclosed (covert) observation• Participant observation• Non-participant observation
Find an example of each in the text (p86 -88 may help)

Observations
Using Behavioural Categories• Impossible to record all behaviours in an
observation• Researchers decide which specific
behaviours will be the focus of the observation
• Behavioural Categories operationalised (measurable) and clearly defined so that all observers record same info. (improves inter-observer reliability)

Coding systems, categories and rating scales
Uses• Observational studies• Content analysis
What are they?A code is invented to represent each category of
behaviourSometimes a list of behaviours is rated by the
observer on a rating scaleWhy used?• To prevent observer bias and improve inter-
observer reliability (cuts down differences between observers)

Examples of coding systems
Observers rates each item on a 7 point scale from inadequate to excellent
Facial Action Coding System
Early Child Environment Rating Scale

Observations
Using Behavioural Categories
• What categories were used by Ainsworth and Wittig in 1969 for the ‘Strange Situation’? See p89 for help
• Read p 89-90 and try the ‘Thinking creatively about Psychology’ task on p90
• Try it out!!
• During break you will conduct a simple observation!

Activity 17 Making systematic observations
The coding system below is adapted from one used by Fick (1993) in a study looking at the effects of having a dog as a pet on the nature and frequency of social interactions in nursing home residents.
You can use this shortened version to make observations of other students in a common room or cafeteria. Shortened coding system:
Non-attentive behaviour: Participant is not engaged in group activity.
Attentive listening: Participant maintains eye contact with other group members.
Verbal interaction with another person: Participant initiates or responds verbally to another person.
Non-verbal interaction with another person: Participant touches, gestures, smiles, nods, etc. to another person
1. Decide on your research aims; e.g. you could compare the differences in social interactions between boys and girls in the sixth form common room or in the canteen.
2. State your hypothesis.3. Draw up a grid to record your observations.4. Decide on a sampling procedure.

Content analysis – DIY!
Try one of these 2 content analysis tasks1. Lonely Hearts Adverts2. Gender bias in toy sales
In your group:Choose a coding system/checklist to gather
dataDisplay your findings in a graph and write a
conclusion

Homework
• Finish your content analysis.
• Mind map or create a revision summary of the strengths and weaknesses of different experimental/non-experimental techniques