Embed Size (px)
Citation preview
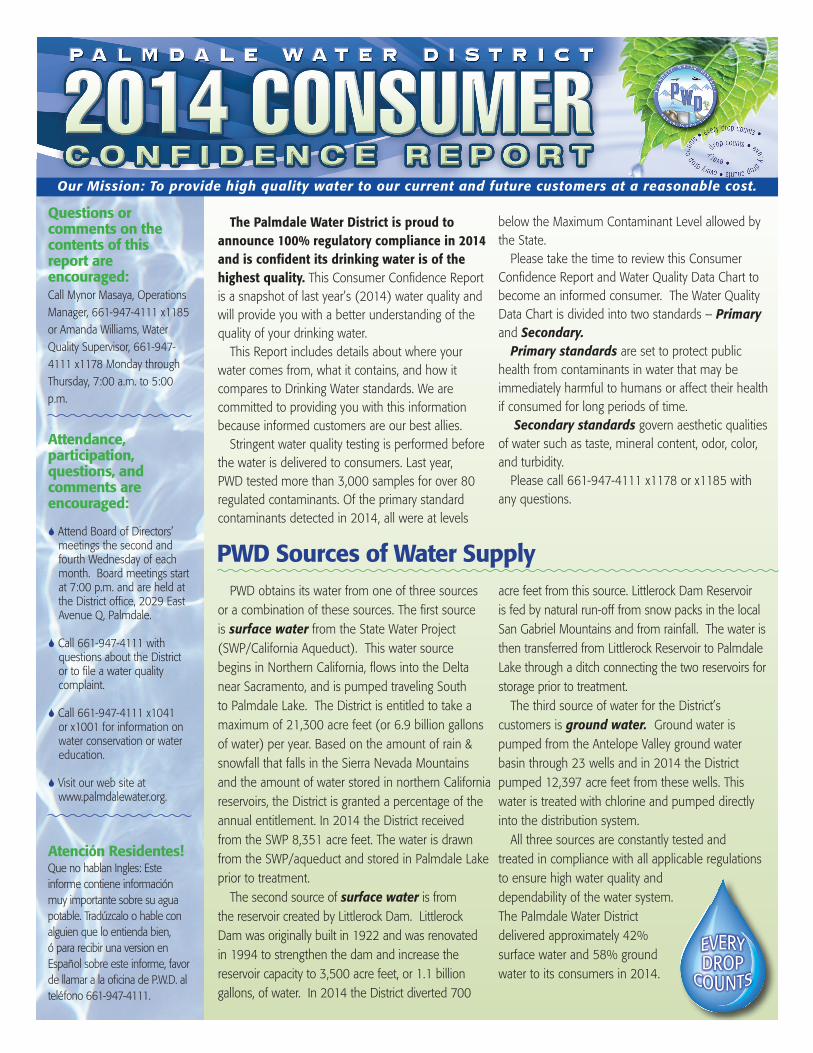
PWD Sources of Water Supply
below the Maximum Contaminant Level allowed by the State.
Please take the time to review this Consumer Confidence Report and Water Quality Data Chart to become an informed consumer. The Water Quality Data Chart is divided into two standards – Primary and Secondary.
Primary standards are set to protect public health from contaminants in water that may be immediately harmful to humans or affect their health if consumed for long periods of time.
Secondary standards govern aesthetic qualities of water such as taste, mineral content, odor, color, and turbidity.
Please call 661-947-4111 x1178 or x1185 with any questions.
acre feet from this source. Littlerock Dam Reservoir is fed by natural run-off from snow packs in the local San Gabriel Mountains and from rainfall. The water is then transferred from Littlerock Reservoir to Palmdale Lake through a ditch connecting the two reservoirs for storage prior to treatment.
The third source of water for the District’s customers is ground water. Ground water is pumped from the Antelope Valley ground water basin through 23 wells and in 2014 the District pumped 12,397 acre feet from these wells. This water is treated with chlorine and pumped directly into the distribution system.
All three sources are constantly tested and treated in compliance with all applicable regulations to ensure high water quality and dependability of the water system. The Palmdale Water District delivered approximately 42% surface water and 58% ground water to its consumers in 2014.
The Palmdale Water District is proud to announce 100% regulatory compliance in 2014 and is confident its drinking water is of the highest quality. This Consumer Confidence Report is a snapshot of last year’s (2014) water quality and will provide you with a better understanding of the quality of your drinking water.
This Report includes details about where your water comes from, what it contains, and how it compares to Drinking Water standards. We are committed to providing you with this information because informed customers are our best allies.
Stringent water quality testing is performed before the water is delivered to consumers. Last year, PWD tested more than 3,000 samples for over 80 regulated contaminants. Of the primary standard contaminants detected in 2014, all were at levels
PWD obtains its water from one of three sources or a combination of these sources. The first source is surface water from the State Water Project (SWP/California Aqueduct). This water source begins in Northern California, flows into the Delta near Sacramento, and is pumped traveling South to Palmdale Lake. The District is entitled to take a maximum of 21,300 acre feet (or 6.9 billion gallons of water) per year. Based on the amount of rain & snowfall that falls in the Sierra Nevada Mountains and the amount of water stored in northern California reservoirs, the District is granted a percentage of the annual entitlement. In 2014 the District received from the SWP 8,351 acre feet. The water is drawn from the SWP/aqueduct and stored in Palmdale Lake prior to treatment.
The second source of surface water is from the reservoir created by Littlerock Dam. Littlerock Dam was originally built in 1922 and was renovated in 1994 to strengthen the dam and increase the reservoir capacity to 3,500 acre feet, or 1.1 billion gallons, of water. In 2014 the District diverted 700
Atención Residentes! Que no hablan Ingles: Este informe contiene información muy importante sobre su agua potable. Tradúzcalo o hable con alguien que lo entienda bien, ó para recibir una version en Español sobre este informe, favor de llamar a la oficina de P.W.D. al teléfono 661-947-4111.
Questions orcomments on the contents of thisreport areencouraged:Call Mynor Masaya, Operations Manager, 661-947-4111 x1185 or Amanda Williams, Water Quality Supervisor, 661-947-4111 x1178 Monday through Thursday, 7:00 a.m. to 5:00 p.m.
Attendance, participation, questions, and comments are encouraged:
S Attend Board of Directors’ meetings the second and fourth Wednesday of each month. Board meetings start at 7:00 p.m. and are held at the District office, 2029 East Avenue Q, Palmdale.
S Call 661-947-4111 with questions about the District or to file a water quality complaint.
S Call 661-947-4111 x1041 or x1001 for information on water conservation or water education.
S Visit our web site at www.palmdalewater.org.
Our Mission: To provide high quality water to our current and future customers at a reasonable cost.

Definitions
S Detection Limit for purposes of reporting (DLR): The designated minimum level at or above which any analytical finding of a contaminant in drinking water shall be reported to the Department of Public Health.S Unregulated Contaminant Monitoring
(UCMR): Unregulated contaminant monitoring helps USEPA and the California Department of Public Health to determine where certain contaminants occur and whether the contaminants need to be regulated.S Treatment Technique (TT): A required
process intended to reduce the level of a contaminant in drinking water.S Regulatory Action Level (AL) or
Notification Level (NL): The concentration of a contaminant which, if exceeded, triggers treatment or other requirements that a water system must follow.S Primary Drinking Water Standard
(PDWS): MCLs and MRDLs for contaminants that affect health along with their monitoring and reporting requirements and water treatment requirements.S Secondary Drinking Water Standard
(SDWS): MCLs for contaminants that affect taste, odor, or appearance of the drinking water. Contaminants with SWDSs do not affect the health at the MCL level.S Counting Error: The 95% confidence level
for the radioactivity analysis.
Abbreviations used in 2014 Water Quality Data Chart:S ND: Not detectable or None detected at
testing limit (DLR)S NA: Not ApplicableS Nreg: No regulationS < Less ThanS > Greater ThanS pCi/L: picocuries per liter (a measure of
radiation)S DBP: Disinfection Byproducts
Comparison examples are provided for the following measurements to help you better understand the amount of chemical contaminants detected in the water. This does not mean that the amounts are not significant regarding risk of health effects for specific contaminants.S ppm: parts per million or milligrams per liter
(mg/L) = qualitatively, approx. 1 drop in 10 gals.S ppb: parts per billion or micrograms per
liter (ug/L) = qualitatively, approx. 1 drop in 10,000 gals.S ppt: parts per trillion or nanograms per
liter (ng/L) = qualitatively, approx. 1 drop in 100,000 gals.
S Maximum Contaminant Level (MCL): The highest level of a contaminant that is allowed in drinking water. Primary MCLs are set as close to the PHGs (or MCLGs) as is economically and technologically feasible. Secondary MCLs are set to protect the odor, taste, and appearance of drinking water.S Maximum Contaminant Level Goal
(MCLG): The level of a contaminant in drinking water below which there is no known or expected risk to health. MCLGs are set by the U.S. Environmental Protection Agency (USEPA).S Public Health Goal (PHG): The level
of a contaminant in drinking water below which there is no known or expected risk to health. PHGs are set by OEHHA (Office of Environmental Health Hazard Assessment) a division of the California Environmental Protection Agency (CEPA).S Maximum Residual Disinfectant
Level (MRDL): The highest level of a disinfectant allowed in drinking water. There is convincing evidence that addition of a disinfectant is necessary for control of microbial contaminants. S Maximum Residual Disinfectant Level
Goal (MRDLG): The level of a drinking water disinfectant below which there is no known or expected risk to health. MRDLGs do not reflect the benefits of the use of disinfectants to control microbial contaminants.S Running Annual Average (RAA): The
running annual arithmetic average, computed quarterly, of quarterly arithmetic averages of all samples collected.
The following definitions of key terms are provided to help you understand the data used in this report.
Drinking Water Source Assessment and Protection Program:treatment costs, and increase public confidence in the quality, reliability and safety of drinking water.
You can help prevent water contamination and pollution by properly disposing of trash and waste materials. Remember, many common household products can contaminate surface and ground water supplies. Anything you throw in the trash, dump on the ground, pour down the drain, or wash down the driveway can eventually reach water sources and cause contamination.
The Sanitary Survey, Source Water Assessment, Groundwater Assessment, and Wellhead Protection Plan are available for review on the Districts website (palmdalewater.org) or at the District’s office by calling Mynor Masaya at 661-947-4111 x1185
The Palmdale Water District’s Sanitary Survey, including a Source Water Assessment of surface waters, was updated in 2012 in compliance with State of California regulations. The assessment of surface water sources included Littlerock Reservoir and Palmdale Lake. A Groundwater Assessment and Protection Program was completed in January of 1999, and a Wellhead Protection Plan was completed in November 2000.
The District’s drinking water sources are considered most vulnerable to the following activities associated with contaminants detected in the water supply: illegal activities, such as unauthorized dumping; recreation; highways; railroads; and sewer collection systems. A comprehensive source water protection program can prevent contaminants from entering the public water supply, reduce

2014 Water Quality Data ChartThe Water Quality Data chart lists all drinking water contaminants detected during the 2014 calendar year. The presence of these contaminants in the water does not necessarily indicate the water poses a health risk. PWD tests for many contaminants in addition to those listed in the chart. Test results for these additional contaminants were all “None Detected (ND)” and are not required to be included in the chart. The state allows us to monitor for some contaminants less than once per year because the concentrations of these contaminants do not change frequently. As a result, some of the data, though representative of the water quality, is more than one year old. Unless otherwise noted, the data presented in this chart is from testing performed January 1 to December 31, 2014.
Unregulated contaminant monitoring helps USEPA and the California Department of Public Health to determine where certain contaminants occur and whether the contaminants need to be regulated.
Parameter
Primary Standards
MCL or MRDL(Units)
SampleFrequency*Surface Water/Ground Water
Treated Surface Water *Ground WaterSampled in 2013
Range RangeEffluent Average
Sampled4/17/14
or Average
MeetsStandard?YES/NO
DLR EPA (MCLG)
PHGOR
(MRDLG)
Typical Source of Contaminant
* Wells are sampled once/3yrs except for Fluoride, Chloride, Sulfate, & Nitrate which are sampled quarterly.
** Sampled between 2010 and 2014. Individual sites are sampled once/6yrs or once/9yrs. Range is from individual sample results.
*** Sample collected only when quarterly average of Gross Alpha exceeds 5pCi/L.
Turbidity (Water Clarity) TT = 1NTU 0.05 - 0.14 0.07 <0.2-2.6 0.25 Turbidity is a measure of the cloudiness of the water. We measure it because it is a good indicator of the effectiveness TT = 95% of monthly samples ≤0.3 NTU YES NA Continuous/Once in 3 yrs. 100% 100% NA NA NA Soil Runoff of our filtration system. Treated Surface Water Range and Average are of Daily Maximum
Dist. System Microbiological
Total Coliform Bacteria (Total Coliform Rule) For systems that collect less than 40 samples per month: No more than 1 positive sample For systems that collect 40 or more samples YES NA Weekly N/A 0% NA NA (0) Naturally present in the environment per month: More than 5.0% of monthly samples are positive
E. coli (Federal Ground Water Rule) 0 YES NA Weekly N/A 0% NA 0 (0) Human and animal fecal waste
Organic Chemicals
Disinfection By-products Stage 2 D/DBP All Sample Range Highest LRAA TTHMs 80µg/L YES NA Monthly/NA 1 - 128 50 NA NA NA By-product of drinking water disinfection HAA5 60µg/L YES NA Quarterly/NA ND - 14 7.0 NA By-product of drinking water disinfection Disinfectant Residual System RAA from Dist. Syst. Chlorine Residual 4.0 (mg/L as Cl2) YES NA Weekly/NA 0.04- 1.96 1.0 NA NA |4| Drinking water disinfectant added for treatment Disinfectant By-product Precursors Control of DBP Precursor (Total Organic Carbon, (TOC) - TT= ratio of actual TOC removal to required see explanation on the next page TOC removal shall be ≥ 1 YES 1 Monthly/NA 2.4- 3.1 2.7 NA NA NA Various natural and manmade sources Total Organic Carbon Reported as mg/L 0.3 0.6- 1.4 1.1
Inorganic Chemicals Arsenic 10µg/L YES 2 Yearly/Once in 3yrs. NA ND ND - 2 ND 0.004 Erosion of natural deposits; runoff from orchards; glass and electronics production wastes Barium 1000µg/L YES 100 Yearly/Once in 3yrs. NA ND ND - 120 ND 2000 Discharges of oil drilling wastes and from metal refineries; erosion of natural deposits Fluoride 2mg/L YES 0.1 Quarterly/Quarterly 0.13 - 0.20 0.17 ND - 0.53 0.18 1 Erosion of natural deposits; water additive that promotes strong teeth; discharge from fertilizer and aluminum factories Nitrate (as N03) 45mg/L YES 2 Quarterly/Quarterly ND - 2.7 ND ND - 28.4 6.7 45 Runoff and leaching from fertilizer use; leaching from septic tanks and sewage; erosion of natural deposits Chromium 50µg/L YES 10 Yearly/Once in 3yrs. NA ND ND - 10 ND (100) Steel and pulp mill discharges, chrome plating, natural erosion Hexavalent Chromium 10µg/L YES 1 Quarterly/Quarterly NA ND ND - 7.9 3.9 0.02 Steel and pulp mill discharges, chrome plating, natural erosion
Radioactivity Gross Alpha Activity** 15 pCi/L YES 3 **See comment below NA ND ND - 6.1 ND (0) Erosion of natural deposits Uranium*** 20 pCi/L YES 1 NA/Quarterly NA ND 1.9 - 9.5 5.7 0.43 Erosion of natural deposits
Tap Monitoring Lead & Copper Action Level No. of samples in 2012 90th Percentile No. sites exceeded AL Lead 15µg/L YES 5 50 ND 1 NA 0.2 Internal corrosion of household water plumbing systems; discharges from industrial manufacturers; erosion of natural deposits Copper 1.3mg/L YES 0.05 50 0.370 None NA 0.3 Internal corrosion of household plumbing systems; erosion of natural deposits; leaching from wood preservatives
Secondary Standards Inorganic Chemicals
Color 15 units YES NA Weekly/Once in 3yrs. NA <5 ND - 3 0.3 NA Naturally occurring organic materials Odor-Threshold 3 units YES 1 Weekly/Once in 3yrs. NA 1 ND - 2 ND NA Naturally occurring organic materials Chloride 500 mg/L YES NA Quarterly/Quarterly 70 - 121 103 5.7 - 110 24.4 NA Runoff/leaching from natural deposits; seawater influence Iron 300µg/L YES 100 Monthly/Once in 3yrs. ND ND ND - 220 ND NA Leaching from natural deposits; industrial wastes Sulfate 500mg/L YES 0.5 Quarterly/Quarterly 43 - 68 56.0 17 - 175 41.3 NA Runoff/leaching of natural deposits; industrial wastes Total Dissolved Solids 1000mg/L YES NA Yearly/Once in 3yrs. NA 370 150 - 490 251 NA Runoff/leaching of natural deposits Specific Conductance 1600 µmhos/cm YES NA Yearly/Once in 3yrs. NA 680 240 - 810 414 NA Substances that form ions when in water; seawater influence
Additional Constituents Analyzed pH NA (Units) NA NA Continuous/Once in 3yrs. 7.0 - 7.4 7.2 7.8 - 8.3 8.0 NA Leaching from natural deposits Hardness NA(mg/L) NA NA Weekly/Once in 3yrs. 74 - 140 123 27 - 300 124 NA Sum of polyvalent cations present in the water, generally magnesium and calcium. The cations are usually naturally-occurring. Alkalinity NA(mg/L) NA NA Weekly/Once in 3yrs. 55 - 87 75 79 - 220 116 NA Dissolved as water passes through limestone deposits Sodium NA(mg/L) NA NA Yearly/Once in 3yrs. NA 81 17 - 69 38 NA Generally naturally-occurring salt present in water Calcium NA(mg/L) NA NA Yearly/Once in 3yrs. NA 30 9.4 - 78 38 NA Dissolved as water passes through limestone deposits Potassium NA(mg/L) NA NA Yearly/Once in 3yrs. NA 2.9 ND - 2.7 1.4 NA Leaching from natural deposits Magnesium NA(mg/L) NA NA Yearly/Once in 3yrs. NA 12 0.9 - 24 7.1 NA Dissolved as water passes through magnesium-bearing minerals
Special Testing NA

Total Trihalomethanes (TTHMS): Total Trihalomethanes (TTHMs) are the total of four trihalomethanes of concern in drinking water: chloroform, bromoform, bromodichloromethane, and chlorodibromomethane. In the Primary Standards Disinfection Byproducts section of the Water Quality Chart under Highest LRAA from Distribution System, the highest Locational Running Annual Average (LRAA) for 2014 is 50 µg/L, which is less than and complies with the Federal TTHM MCL of 80 µg/L. The range of monthly sample results from all 8 sampling points in 2014 is 1 – 128 µg/L, indicating that certain sampling points or specific locations within the customer service area have exceeded 80 µg/L. These samples were taken from dedicated sample points within the distribution system and are representative of maximum residence time in the system.S Health effects of Total Trihalomethanes (TTHMs): Some people who drink water containing trihalomethanes in excess of the MCL over
many years may experience liver, kidney, or central nervous system problems and may have an increased risk of getting cancer.
Total Organic Carbon (TOC): Total Organic Carbon (TOC) has no health effects. However, TOC provides a medium for the formation of disinfection byproducts. TOC result is based on quarterly RAA of percent removal ratio. Paired samples (one from source and the other from treated water) are collected monthly. The percent removal between source water and treated water is divided by the required monthly TOC percent removal based on certain criteria that all public water systems must follow. The quarterly RAA of these monthly results should be 1.0 or higher. Our quarterly RAA in 2014 ranged from 2.43 to 3.14 and averaged 2.72. Individual TOC sample results for treated water ranged from 0.6 to 1.4 mg/L and averaged 1.1 mg/L.
Arsenic: In the Primary Standards Inorganic Chemicals section of the chart for Arsenic, the treated surface water sample was None Detected (ND). For groundwater samples (23 total), the range is None Detected (ND) to 2.0 µg/L. The average for all groundwater sources based on 2014 analysis is less than the DLR of 2 µg/L, MCL = 10 µg/L.S Health effects of Arsenic: While your drinking water meets the federal and state standard for arsenic, it does contain low levels of arsenic.
The arsenic standard balances the current understanding of arsenic’s possible health effects against the costs of removing arsenic from drinking water. The USEPA continues to research the health effects of low levels of arsenic, which is a mineral known to cause cancer in humans at high concentrations and is linked to other health effects such as skin damage and circulatory problems.
Barium: In the Primary Standards Inorganic Chemicals section of the chart for Barium, treated surface water sample is None Detected (ND). In the groundwater column, the range of barium is ND to120 µg/L and the average is ND, which is well under the MCL of 1000 µg/L. Out of 23 wells tested, one well (Well 18) exceeded the DLR for barium.S Health effects of Barium: Some people who drink water containing barium in excess of the MCL over many years may experience an
increase in blood pressure.
Fluoride: Fluoride in the treated surface water ranged from 0.13 to 0.20 mg/L and averaged 0.17 mg/L. The groundwater samples ranged from ND to 0.53 mg/L and averaged 0.18 mg/L. The fluoride MCL is 2 mg/L and the DLR is 0.1 mg/L. S Health effects of Fluoride: Some people who drink water containing fluoride in excess of the federal MCL of 4 mg/L over many years may
get bone disease, including pain and tenderness of the bones. Children who drink water containing fluoride in excess of the state MCL of 2 mg/L may get mottled teeth.
Nitrate: In the Primary Standards Inorganic Chemicals section of the chart for Nitrate as (NO3), treated surface water sample range is ND to 2.7 mg/L and the average is ND. In the groundwater column, the range of Nitrate is ND to 28.4 mg/L, and the average is 6.7 mg/L. The State Water Resources Control Board requires annual sampling if all results are less than 50% of the MCL. If the result from any one source is greater than 50% of the MCL, then sampling must be done quarterly at that source. The District samples all its wells on a quarterly basis (4 times a year) even when they test below 50% of the MCL. The numbers expressed on the chart are derived from quarterly sampling of all District wells, except those that are out of service.S Health effects of Nitrate: Nitrate in drinking water at levels above 45 mg/L is a health risk for infants of less than six months of age. Such
nitrate levels in drinking water can interfere with the capacity of the infant’s blood to carry oxygen, resulting in a serious illness; symptoms include shortness of breath and blueness of the skin. Nitrate levels above 45 mg/L may also affect the ability of the blood to carry oxygen in other individuals, such as pregnant women and those with certain specific enzyme deficiencies. If you are caring for an infant, or you are pregnant, you should ask advice from your health care provider. Nitrate levels may rise quickly for short periods of time because of rainfall or agricultural activity.
*Information Continued on Next Page
Gross Alpha Particle Activity: Well 18 was the only source sampled in 2014 for Gross Alpha with the result being None Detected (ND). In the groundwater column of the chart, the results are from analysis conducted between 2006 and 2014. The range of Gross Alpha is ND to 6.1 µg/L and the average is ND. The remaining water sources will be monitored in the future during this compliance cycle. S Health effects of Gross Alpha Particle Activity: Certain minerals are radioactive and may emit a form of radiation known as alpha radiation.
Some people who drink water containing alpha emitters in excess of the MCL over many years may have an increased risk of getting cancer.
Uranium: Samples for Uranium are collected only when the quarterly average of Gross Alpha particle activity exceeds 5 pCi/L. Since the result of Well 18 monitoring was below this level, there were no samples collected for Uranium in 2014. In the groundwater column of the chart, the results are from analysis conducted between 2006 and 2014. The range of Uranium is 1.9 to 9.5 µg/L and the average is 5.7 µg/L.S Health effects of Uranium: Some people who drink water containing uranium in excess of the MCL over many years may have kidney
problems or an increased risk of getting cancer.
Lead and Copper: The tap samples for Lead and Copper were taken in the year 2012 (50 samples). The 90th percentile results of <5 ppb for lead and 0.370 ppm for copper are well within the AL of 15 ppb lead and the AL of 1.3 ppm for copper. The District is scheduled to draw new sample sets this year.
S If present, elevated levels of lead can cause serious health problems, especially for pregnant women and young children. Lead in drinking water is primarily from materials and components associated with service lines and home plumbing. Palmdale Water District is responsible for providing high quality drinking water, but cannot control the variety of materials used in plumbing components. When your water has been sitting for several hours, you can minimize the potential for lead exposure by flushing your tap for 30 seconds to 2 minutes before using water for drinking or cooking. If you are concerned about lead in your drinking water, you may wish to have your water tested. Information on lead in drinking water, testing methods, and steps you can take to minimize exposure is available from the Safe Drinking Water Hotline (800-426-4791) or at http://www.epa.gov/safewater/lead.S Health effects of Lead: Infants and young children are typically more vulnerable to lead in drinking water than the general population. It
is possible that lead levels at your home may be higher than at other homes in the community as a result of materials used in your home’s plumbing. If you are concerned about elevated lead levels in your home’s water, you may wish to have your water tested and/or flush your tap for 30 seconds to 2 minutes before using tap water. S Health effects of Copper: Copper is an essential nutrient, but some people who drink water containing copper in excess of the action level
over a relatively short amount of time may experience gastrointestinal distress. Some people who drink water containing copper in excess of the action level over many years may suffer liver or kidney damage. People with Wilson’s disease should consult their personal doctor.
Our New Way of LifeThe record California Drought is now in its fourth straight year. Governor Brown has just signed a mandatory 25% reduction in water
usage for cities and towns. Our agricultural industry is relying on groundwater as a primary source of water for irrigation and many communities are too. Snowpack is at an all-time low of 6% and the state has recorded the highest monthly temperatures for February and March since record keeping began.
We are asked to do more with less but does the drought’s severity actually influence our personal behaviors? Every time we turn on our faucet, the water is there, so how do we get people to see the big picture? For those of us who live in Palmdale, we already know how to live with less and do more. It is our way of life.
The Antelope Valley has a great story to tell the rest of the State. We know how to live in a constant drought. But we also know what “community” means. Each one of us has been doing a good job of making small adjustments to our daily habits. Turning off the water when brushing our teeth, or taking shorter showers to name a couple. But we also have perseverance. The will to see things through no matter how difficult.
The Palmdale Water District recognizes the sacrifices our community members make every day and we, as employees and residents, are making those sacrifices too. Thanks for everything all of you do every day to make our community better. Less is More . . . Save for OUR Future!
Palmdale Water District2029 E. Avenue Q
Palmdale, CA 93550661.947.4111
Board of Directors
Robert E. AlvaradoDivision 1
Joe EstesDivision 2
Gloria DizmangDivision 3
Kathy MacLarenDivision 4
Vincent DinoDivision 5
General ManagerDennis LaMoreaux
PRSRT STDU.S. POSTAGE
PAIDPERMIT NO. 1PALMDALE, CA
Educational Information and Possible Drinking Water Contaminants: Contaminants that may be present in source water include:S Microbial Contaminants, such as viruses and bacteria that may
come from sewage treatment plants, septic systems, agricultural livestock operations, and wildlife.S Inorganic Contaminants, such as salts and metals, that can be
naturally-occurring or result from urban stormwater runoff, industrial or domestic wastewater discharges, oil and gas production, mining, or farming.S Pesticides and herbicides, which may come from a variety of
sources such as agriculture, urban stormwater runoff, and residential uses.S Organic chemical contaminants, including synthetic and volatile
organic chemicals that are by-products of industrial processes and petroleum production, and can also come from gas stations, urban stormwater runoff, agricultural application, and septic systems.S Radioactive contaminants, which can be naturally-occurring or be
the result of oil and gas production and mining activities.
In order to ensure that tap water is safe to drink, the USEPA and the State Water Resources Control Board (State Board) make regulations that limit the amount of certain contaminants in water provided by public water systems. State Board regulations also establish limits for contaminants in bottled water that must provide the same protection for public health.
Drinking water, including bottled water, may reasonably be expected to contain at least small amounts of some contaminants. The presence of contaminants does not necessarily indicate that water poses a health risk. More information about contaminants and potential health effects can be obtained by calling the USEPA’s Safe Drinking Water Hotline (1-800-426-4791).
Some people may be more vulnerable to contaminants in drinking water than the general population. Immuno-compromised persons such as persons with cancer undergoing chemotherapy, persons who have undergone organ transplants, people with HIV/AIDS or other immune system disorders, some elderly, and infants can be particularly at risk from infections. These people should seek advice about drinking water from their health care providers. USEPA/Centers for Disease Control (CDC) guidelines on appropriate means to lessen the risk of infection by Cryptosporidium and other microbial contaminants are available from the Safe Drinking Water Hotline (1-800-426-4791). PWD tested for cryptosporidium monthly in 2007 and results were “none detected.”
The sources of drinking water (both tap water and bottled water) include rivers, lakes, streams, ponds, reservoirs, springs, and wells. As water travels over the surface of the land or through the ground, it dissolves naturally-occurring minerals and, in some cases, radioactive material, and can pick up substances resulting from the presence of animals or from human activity.