Embed Size (px)
Citation preview

Implementing Integrated Energy PolicyExpanding of Options for Power*26,July 2006
Integrated Research and Action for DevelopmentNew Delhi
*connectedthinking

Contents
ContextRequirements & Key IssuesOptions for Expanding Power

ContextDefining Energy Security for India
Current Energy Mix, Intensity & SecurityDevelopment & Growth RequirementsRole of Power in Energy Security
“The country is energy Secure when we can supply lifeline energy to all our citizens as well as meet their effective demand for their safe and convenient energy to satisfy various needs at affordable costs at all times with a prescribed confidence level considering shocks and disruptions that can be reasonably expected”
- Expert Committee on Integrated Energy Policy

Slide 4Expanding PowerPricewaterhouseCoopers
July 2006
EDI and components for select countries
0
0.25
0.5
0.75
1
EDI Commercial energyuse per capita
Commercial energyto total energy
ElectrificationIndex
BrazilChinaIndonesiaIndia
India Energy Needs: Energy Development Index
• IEA has developed a simple composite measure of a country’s progress in transition to modern fuels & the degree of maturity of energy end-use
• It has been calculated for 75 developing countries only.
• It is a simple average of the following three sub-indicators
1. Per capita commercial energy consumption.
2. Share of commercial energy in total final energy use.
3. Share of population with access to electricity.
India ranks a poor 53rd and fares very poorly in all three sub-indicators
EDI and components for select countries
Slide 5Expanding PowerPricewaterhouseCoopers
July 2006
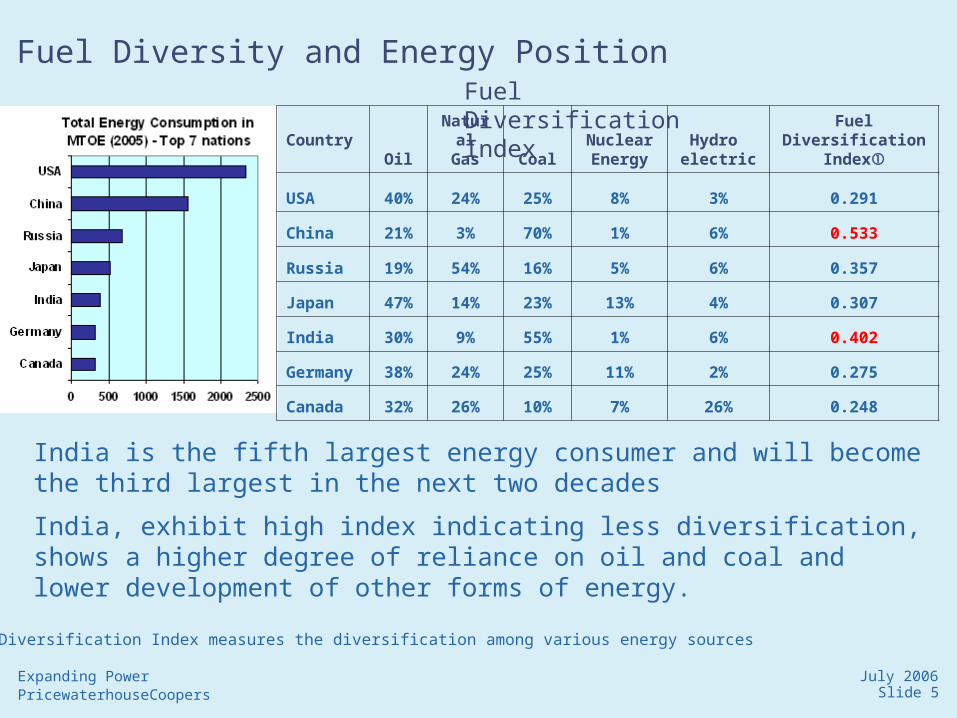
Fuel Diversity and Energy Position
Country OilNatural
Gas CoalNuclear Energy
Hydro electric
Fuel Diversification Index
USA 40% 24% 25% 8% 3% 0.291
China 21% 3% 70% 1% 6% 0.533
Russia 19% 54% 16% 5% 6% 0.357
Japan 47% 14% 23% 13% 4% 0.307
India 30% 9% 55% 1% 6% 0.402
Germany 38% 24% 25% 11% 2% 0.275
Canada 32% 26% 10% 7% 26% 0.248
India is the fifth largest energy consumer and will become the third largest in the next two decades
India, exhibit high index indicating less diversification, shows a higher degree of reliance on oil and coal and lower development of other forms of energy.
Fuel Diversification Index
Fuel Diversification Index measures the diversification among various energy sources

Slide 6Expanding PowerPricewaterhouseCoopers
July 2006
Energy Security Strategy Vulnerability to external shocks
• India, despite the improvement, is three times more energy intense when compared to developed nations making the economic growth energy dependent
•India because of higher import dependence relative to the exports remains vulnerable
•India has a lonely position in a quadrant which is high dependence and vulnerability
•It is imperative that India chalks an energy security strategy to lessen the external shocks and sustain its economic growth
USA, 246
Japan, 112
Brazil, 11
India, 39
China, 52
Canada, 23UK, 30
France, 46Germany, 59
0%
5%
10%
15%
20%
25%
30%
0 0.2 0.4 0.6 0.8 1 1.2
Energy Intensity
En
erg
y Im
po
rts
as %
of
Exp
ort
s
Bubble size indicates Oil Import Bill in 2003 USD
High Risk - Vulnerable & Dependant
Competitive - Low Dependence & Vulnerability

India’s Energy Security- Requirements & Key Issues
Learning from other countriesDiversification of Energy Supply
Energy Security : Equity, efficiency, diversity & sustainability

Slide 8Expanding PowerPricewaterhouseCoopers
July 2006
Need to alter the source of energy for householdsEquity component of energy security
Total Final Consumption: By Source
Gas2%
Electricity9%
Coal9%
Petroleum26%
Combustible & Waste54%
Quantum of Biomass & waste (Fuel wood, straw, charcoal, agricultural residue & cow dung) consumption at 54% is very high.
Dependence on Petroleum is significantly high
The changes in energy mix in residential use will help to address equity issues
There is huge potential to improve overall energy efficiency in industrial and transport sector
The Challenge is related to governance of the large dispersed rural system
Total Final Consumption: By sector
Residential57%
Industry27%
Non energy3%
Transport9%
Other2%
Agriculture2%
Source: IEA

Slide 9Expanding PowerPricewaterhouseCoopers
July 2006
End-Use Oil (2004-05) LPG
Kerosene Naphta Diesel LDO
Furnace Oil LSHS MS
Total Consumed (MMT) 9.9 9.4 14.0 39.7 1.5 9.4 4.4 8.3Domestic 95.4% 98.9% 0.0% 0.0% 0.0% 0.0% 0.0% 0.0%Transport 0.0% 0.0% 0.0% 56.8% 3.3% 2.7% 0.0% 100.0%Power Gen 0.0% 0.0% 6.9% 7.0% 5.9% 3.3% 28.1% 0.0%Agri 0.0% 0.0% 0.0% 18.9% 2.5% 0.0% 0.0% 0.0%Industrial/Comm 4.6% 1.1% 93.1% 17.4% 88.3% 94.0% 71.9% 0.0%
Source: MoPNG
Improving energy efficiency & reducing oil dependency Opportunity for expanding power
Improved Access to Electricity could significantly reduce Kerosene for domestic use
Appropriate Supply of Power for Irrigation will reduce Diesel in Agriculture
Improved Mass Transportation based on Electricity can arrest rapid growth of the Motor Spirits

Slide 10Expanding PowerPricewaterhouseCoopers
July 2006
Expanding Power in Transportation A case of INDIAN RAILWAYS
• Total energy consumption of transport sector only 1.5% met through electricity and remaining about 98.5 % through petroleum products
• IR consumes about 5.1% of total energy consumed by transport sector (and 1.1% of total energy consumption)
Within Railways energy consumption- 77.5% consumed in the form of diesel (HSD)- 22.5% consumed in the form of electricity
As a proportion to the total energy consumption by the Nation: - 1.8% of total electric energy- 4.4% of total diesel consumption
• Had there been no electrification IR would have been using additional 2.25 million tonnes of diesel oil per annum- This would have raised consumption of oil in Rail sector from 4% to 9%
• If entire IR was electrified there would have been saving of 1.7 million tonnes of diesel oil per annum - This would have reduced the nation’s requirement of diesel oil by 4%

Slide 11Expanding PowerPricewaterhouseCoopers
July 2006
Increase Mass Urban Transport
• Savings in fuel costs is potentially high with introduction of electrified Metro (EIA study for Bangalore estimates savings of Rs.876 cr./yr on a price of Rs.35/ltr of petrol for just 2 & 3 wheelers for just 32 km of metro length)
• In the Delhi Metro project phase-II, the estimated foreign exchange savings due to reduced consumption of 7 Mn lts of Diesel, 31.5 Mn lts of Petrol and 18.6 Mn kg of CNG is Rs. 1.722 Bn, in addition to reduced CO2, travel time and decongestion of roads
• With a fully integrated Metro, Bus and Rail network, only 13% use personal motorised transport to travel into central London
Expected reduction of fuel consumption in 2011
Category of Vehicles
No of vehicles without Metro
No of vehicles with
Metro
Fuel consumption without Metro (litres)
Fuel consumption with Metro (litres)
Fuel Saved (litres)
Two Wheelers 2,394,075 1,676,137 1,795,556 1,257,102 538,454Three Wheelers 157,224 125,829 786,120 629,145 156,975
Total Saving in Fuel, litres per day 695,429
Urban Mass TransportEnhancing energy efficiency & Expanding power
Slide 12Expanding PowerPricewaterhouseCoopers
July 2006
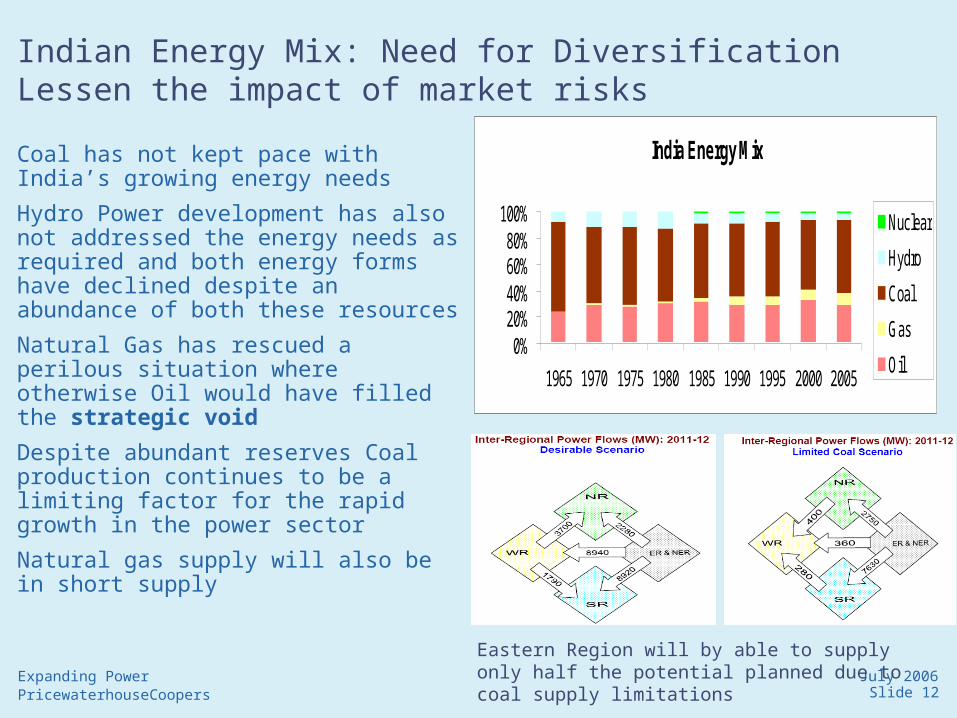
Indian Energy Mix: Need for DiversificationLessen the impact of market risks
Coal has not kept pace with India’s growing energy needs
Hydro Power development has also not addressed the energy needs as required and both energy forms have declined despite an abundance of both these resources
Natural Gas has rescued a perilous situation where otherwise Oil would have filled the strategic void
Despite abundant reserves Coal production continues to be a limiting factor for the rapid growth in the power sector
Natural gas supply will also be in short supply
India Energy Mix
0%20%40%60%80%
100%
1965 1970 1975 1980 1985 1990 1995 2000 2005
Nuclear
Hydro
Coal
Gas
Oil
Eastern Region will by able to supply only half the potential planned due to coal supply limitations
Slide 13Expanding PowerPricewaterhouseCoopers
July 2006
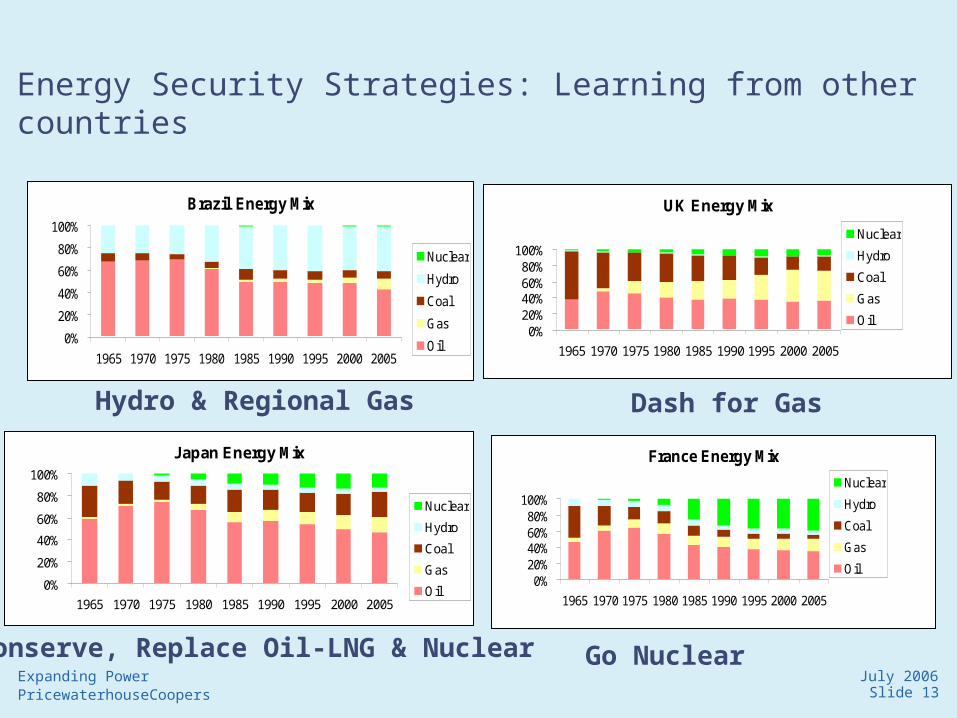
Energy Security Strategies: Learning from other countries
UK Energy Mix
0%20%40%60%80%
100%
1965 1970 1975 1980 1985 1990 1995 2000 2005
Nuclear
Hydro
Coal
Gas
Oil
France Energy Mix
0%20%40%60%80%
100%
1965 1970 1975 1980 1985 1990 1995 2000 2005
Nuclear
Hydro
Coal
Gas
Oil
Brazil Energy Mix
0%
20%
40%
60%
80%
100%
1965 1970 1975 1980 1985 1990 1995 2000 2005
Nuclear
Hydro
Coal
Gas
Oil
Japan Energy Mix
0%
20%
40%
60%
80%
100%
1965 1970 1975 1980 1985 1990 1995 2000 2005
Nuclear
Hydro
Coal
Gas
Oil
Hydro & Regional Gas Dash for Gas
Go Nuclear Conserve, Replace Oil-LNG & Nuclear

Slide 14Expanding PowerPricewaterhouseCoopers
July 2006
Diversification - International lessons
Local/Regional resources play a critical role in meeting the energy needs (E.g. USA– Coal & Oil, China– Coal, Russia– Nat. Gas)
For Developed Economies, reliance on Combustibles, renewables and wastes decreases, almost disappears – India would need to find commercial energy for all
Transportation and Industrial Sector increases its share in sectoral mix vis-à-vis residential sector requiring a multiplier to the energy needs. The next decade will require India to review its transportation growth options in view of the energy needs
Source : IEA 2003
Comparison of Total Final Consumption
Total Final Consumption - by source
0% 20% 40% 60% 80% 100%
India
Indonesia
China
Brazil
Russia
USACombustible& wastesPetroleumProductsElectricity
Coal
Gas
Others
Total Final Consumption: by sector
0% 20% 40% 60% 80% 100%
India
Indonesia
China
Brazil
Russia
USAResidential
Industry sector
TransportationsectorAgriculture
Other sectors
Non-Energy Use
MTOE1571418162885116394

Options for Expanding Power
Expanding of Regional MarketsExpanding Internal Resources

Options for Expanding PowerExpanding Regional Markets
Energy Resources of the RegionsDevelopment of Regional Power MarketsBilateral and Regional Energy Market Development

Slide 17Expanding PowerPricewaterhouseCoopers
July 2006
Why Regional Resources for power?Generation Based on Imported Fuel
• Imported fuel poses significant cost implication for power generation
• Light area shows price at which gas is competitive vis-à-vis coal, while dark area coal is competitive
• Spot prices and freight rates indicate $ 45/ton of delivered cost of coal and gas prices is considered at $6.2 MMBTU – bus-bar cost of generation at these levels is Rs. 3.0/kwh and Rs. 3.39 per kwh respectively
• Current levels are however ruling at their highs and recent long term deals are showing signs of softening prices

Slide 18Expanding PowerPricewaterhouseCoopers
July 2006
Energy Resources of the RegionNepal
Nepal’s topography and hydro sources emanating from snows and glaciers provides scope for hydroelectric development
India has assisted in a limited way Nepal to develop its hydro resources: • HE schemes: Pokhra (1 MW), Trisuli (21
MW), Western Gandak (15 MW) and Devighat (14.1 MW)
• Projects under consideration:- Karnali (10,800 MW)- Pancheshwar (5,600 MW) - Sapta Koshi (3,300 MW)
• NHPC considering Upper Karnali Project (300 MW) as an IPP
• DPR of Burhi Gandaki (600 MW) by WAPCOS under consideration
River Basin
Major (MW)
Small (MW)
Total (MW)
Kosi 18,750 360 22,530
Gandak 17,950 270 20,650
Karnali (Ghaghra)
28,840 3,170 32,010
Mahakali 3,840 320 4,160
Southern Rivers
3,070 1,040 4,110
Total 72,450 10,830 83,280
Total Hydro Potential of Nepal
Improving political situation in Nepal could facilitate development of some of the above potential.

Slide 19Expanding PowerPricewaterhouseCoopers
July 2006
Nepal – Interconnections with India
India Nepal Voltage
Anand Nagar Bhairahawa 33 kV
Itawa Krishna Nagar 33 kV
Nanpara Nepalganj 33 kV
Pallia Dhangadhi 33 kV
Tulsipur Koliabas 11 kV
Lohiahead Mahendranagar 33 kV
Pithoragarh Baitadi 11 kV
Dharchula Jaljibe 11 kV
Dharchula Pipale 11 kV
Gandak East Surajpura 132 kV
Raxaul Birganj 33 kV
Jogbani Biratnagar 11 kV
Thakurganj Bhadrapur 33 kV
Balmikinagar Surajpura 11 kV
Kataiya Duhabi 132 kV
Kataiya Biratnagar 33 kV
Kataiya Rajbiraj 33 kV
Bargania Gaur 11 kV
Sitamarhi Jaleswar 33 kV
Transmission links at 132 kV, 33 kV and 11 kV – Low capacity for energy exchange

Slide 20Expanding PowerPricewaterhouseCoopers
July 2006
Energy Resources of the RegionBhutan
Bhutan’s hydro power potential is assessed to be 30,000 MW, of which 23,500 MW is considered techno-economically feasible.
Developed hydro capacity of 469 MW constitutes ~2% of the potential
The upcoming Tala Project will add 1020 MW of new capacity on commencement (July 06) and increase the capacity threefold
Tala is expected to produce 4865 MU
Hydro Projects to be taken up on Priority basis have been identified
Tala Transmission System Developed by Powerlinks, a JV between Tata Power & PGCIL (51:49) provides a secure infrastructure for Bhutan power to reach more power deficit Northern Indian States. Indirectly it provides also access to western Indian market
3000 MW Capacity, 1200 km length (2384 Ckt Km) BOOT project is integrated into Eastern Transmission system.
Slide 21Expanding PowerPricewaterhouseCoopers
July 2006
Regional Energy Cooperation
There is a need and potential for higher level of energy co-operation within the region to promote energy security
•SAARC Initiatives
•BIMSTEC Initiatives• Strengthen bi-lateral agreements• Allow of more access to Indian market segments• Integration & Strengthening of transmission network• Developing commercial framework for trading: framework
trading agreements, model power purchase agreements
Cross-border energy exchanges through trans-national oil & gas pipelines and transnational grids for transmission of power.

Options for Expanding PowerExpanding Internal Resources
Energy Resources & DemandTransmission InfrastructurePower Trading ArrangementsTechnology Improvements

Slide 23Expanding PowerPricewaterhouseCoopers
July 2006
Energy Resources & Demand
• Energy resources are concentrated in Eastern region
• North East India ranked highest in unexploited hydro potential
• The Northern, Western and Southern are expected face the maximum shortages in energy, while the eastern region is expected remain surplus and export power
Energy & Power Requirement
78037 81492
115705
157107
50700 5450071900
97500
0
50000
100000
150000
FY 01 FY 03 FY 07 FY 12
MU
Peak Requirement (MW) Energy Requirement (MU)

Slide 24Expanding PowerPricewaterhouseCoopers
July 2006
Hydro Power Potential in India
• India itself has significant hydro-power capability undeveloped and has targeted 50 GW for development
• Significant potential for development in N-E and North India.
• These states see hydro power as the main strategy for development of their economies
• South India and Western India has diminishing HEP opportunity. These states are facing energy and peak power shortages
CEA Ranking Study on River Basins
Uttaranchal & HP have focused plans for Hydro power development through involvement of private sector.
State Assessed (MW)
In Operation
Under Construction
Balance (MW)
Arunchal Pradesh
50,328 11 405 49,913
Uttaranchal 18,898 1,610 3,453 13,835
Himachal Pradesh
18,820 3,823 1,926 13,071
Jammu & Kashmir
14,146 1,394 469 12,283
Sikkim 4,286 84 519 3,683
Karnataka 6,602 2,789 222 3,591
Meghalaya 2,394 185 - 2,209
Mizoram 2,196 - 60 2,136
MP/ Chattisgarth
4,485 899 30 1,684
Kerala 3,514 1,800 30 1,684
West Bengal
2,841 301 936 1,605
Manipur 1,784 105 90 1,589
Nagaland 1,574 75 24 1,475
Orissa 2,999 1,838 66 1,096
Total 134,867 14,912 8,231 109,852

Slide 25Expanding PowerPricewaterhouseCoopers
July 2006
Requirements for meeting demand
Year ER-SR
ER-NR
ER-WR
ER-NER
NR-WR
WR-SR NER-NR
Total
2002 600 100 400 1,250 1,000 1,700 0 5,050
2007 3,600 5,000 2,800 1,250 2,100 1,700 0 16,450
2012 3,600 8,500 8,500 2,250 7,600 2,700 4,000 37,150
Transmission system• To facilitate evacuation of power from
eastern region to rest of India• The capacity of the transmission
system needs multi fold increase• JVs similar to Tala system would help
to speed up
Development of Power Market
•Incentives for eastern region states to attract investments in Generation
• Country wide consistent Open Access regime to provide choice and competition
•Third party supplies with credible open access is essential prerequisite as payment security mechanism
•Need to remove both tariff and non-tariff barriers
Slide 26Expanding PowerPricewaterhouseCoopers
July 2006
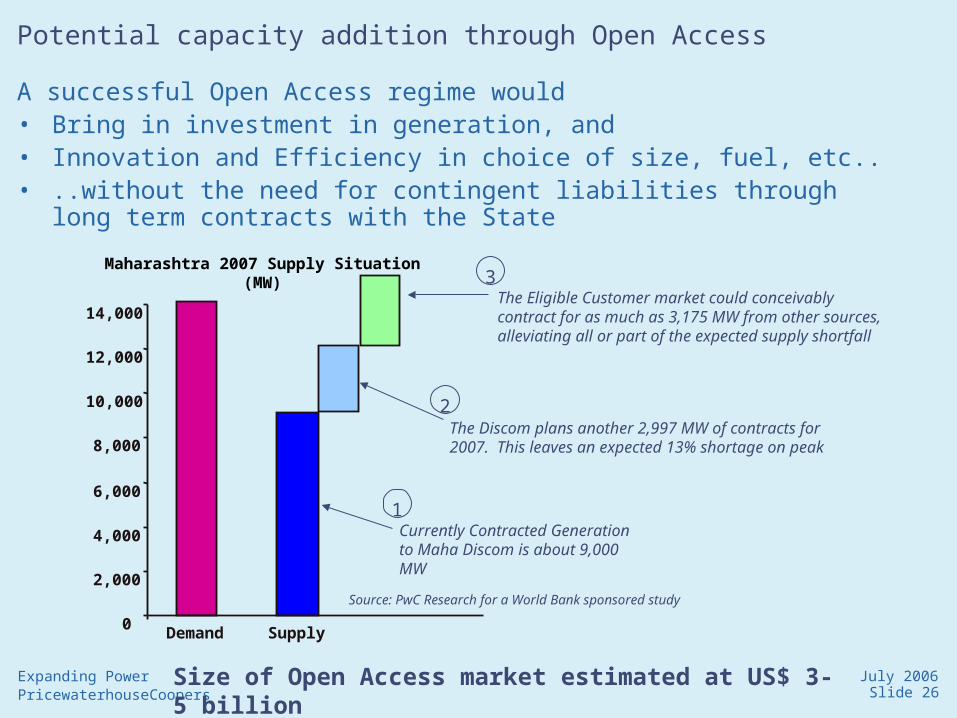
Potential capacity addition through Open Access
A successful Open Access regime would• Bring in investment in generation, and• Innovation and Efficiency in choice of size, fuel, etc..• ..without the need for contingent liabilities through long term contracts
with the State
0
2,000
4,000
6,000
8,000
10,000
12,000
14,000
Deman
d
Supply
Currently Contracted Generation to Maha Discom is about 9,000 MW
Maharashtra 2007 Supply Situation(MW)
1
The Discom plans another 2,997 MW of contracts for 2007. This leaves an expected 13% shortage on peak
2
The Eligible Customer market could conceivably contract for as much as 3,175 MW from other sources, alleviating all or part of the expected supply shortfall
3
Source: PwC Research for a World Bank sponsored study
Size of Open Access market estimated at US$ 3-5 billion

Slide 27Expanding PowerPricewaterhouseCoopers
July 2006
The change challenge
Nearly 60% of respondents thought the industry needed to have a strong 10-year focus on reducing environmental damage, developing new technologies and improving customer service relationships.
The importance of technology is highlighted by utility companies’ identification of coal, alongside piped gas, as the key fuel in meeting much of future demand growth. Nuclear has grown in favour and finds fifth rank. Hydro-Carbons (LNG and Oil) are low on the rankings of CEOs
The Big Leap: PwC Utilities Survey 2006 - Inside the boardroom

Slide 28Expanding PowerPricewaterhouseCoopers
July 2006
Big Leap – Where would technology Investment yield results
Slide 29Expanding PowerPricewaterhouseCoopers
July 2006
Summary
• Energy Security challenges are Global in nature but we need to develop India specific strategy and action plans
• Oil intensity of our economy has to be reduced in favour of Electricity • Coal & Hydro potential of the nation and the region could help alter the
energy balance• Energy Security Plans have to be developed at the State level progressing
further from Expert Committee Recommendations• Indian supply resources have to be augmented through national
transmission network development & connectivity• Regional Power resources could be developed through appropriate
development of regional power markets and Framework Agreements on trade & energy cooperation
Expanding options for Power

Slide 30Expanding PowerPricewaterhouseCoopers
July 2006
Thank You


![ESIA - Services Architecture Enterprise Services Integrated Architecture [ESIA] Viv Noot PwC](https://img.dokumen.tips/doc/110x75/56649e715503460f94b70588/esia-services-architecture-enterprise-services-integrated-architecture-esia.jpg)