Embed Size (px)
Citation preview

PwC European BankingTransformation andM&A Conference
Transforming the market, creating value
27 March 2019

The Future of BankingPart 1
PwC European Banking Transformation and M&A Conference
27th March 2019

The Future of Banking
Part 1
Richard Thompson
Conference Chairman
A discussion with…
Isabelle Jenkins
PwC UK Banking Leader

PwC
Return on Equity is slowly recovering but remains below the cost of capital
Note: (1) The eight countries captured include Belgium, France, Germany, Great Britain, Italy, Netherlands, Spain and Sweden. Source: ECB
(5%)
0%
5%
10%
15%
2004 2005 2006 2007 2008 2009 2010 2011 2012 2013 2014 2015 2016 2017
Return on Equity, banks across the largest European economies, 2004-17
Euro area specific 8 largest European economies¹

PwC
Banks have not experienced any sustained income growth
(10%)
(5%)
0%
5%
10%
15%
20%
25%
2009 2010 2011 2012 2013 2014 2015 2016 2017
Income growth YoY, banks across the largest European economies1, 2009-17
Note: (1) The eight countries captured include Belgium, France, Germany, Great Britain, Italy, Netherlands, Spain and Sweden. Source: ECB

PwC
Despite cost cutting efforts, cost-to-income ratios remain stubbornly high
0%
10%
20%
30%
40%
50%
60%
70%
80%
2008 2009 2010 2011 2012 2013 2014 2015 2016 2017
Cost-to-income ratio, banks across the largest European economies1, 2008-17
Note: (1) The eight countries captured include Belgium, France, Germany, Great Britain, Italy, Netherlands, Spain and Sweden. Source: ECB

PwC
Europe has seen a wave of consolidation, with further potential across Germany, France and Italy
0%
20%
40%
60%
80%
100%
(60%) (40%) (20%) 0%
Ma
rke
t s
ha
re o
f T
op
5 b
an
ks
(b
y a
ss
ets
), 2
01
6
Change in number of institutions, 2008-2018
Number of credit institutions legally incorporated by European country, 2008-2018
Spain
United Kingdom
Portugal
Austria
France Poland
Germany
Denmark
Finland
Italy
Sweden
Belgium
Consolidation potential
Size of bubble indicative of
number of credit
institutions, 2018
Source: ECB, ZEB

PwC
Market map
Low cost manufacturers
Reallocate resources and shed unattractive
businesses from portfolio
Low cost and flexible business model
Sophisticated risk pricing
“Utility” service providers
Specialist lenders
Less complex business model than traditional banks
Innovative product development
High-touch and relationship driven
Potentially white labelling products to 3rd parties
Digitised providers
Large customer base
Mix of own and 3rd party products
Reduce legacy systems and drive efficiencies by
digitising and automating processes
CLTV focus driving high share of wallet
Marketplace
Large, engaged customer base
CRM and cross-selling
Strong brand, low CPA and high loyalty
Wide range of financial and non-financial services and
products
Partnership management skills

PwC
What could happen in banking by 2029
European citizens have a portable digital KYC identity and credit worthiness
Standardisation gives way to mass personalisation
Competitive
landscape
Product
developments
Operating
models
Amazon launches its own cryptocurrency driving widespread customer adoption
FAANGs penetrate financial services more decisively
Half of today’s fintechs are acquired or merge with traditional banks
A pan-European investment bank champion emerges
Core banking is a utility with differentiation occurring at the front end / customer
interface
Back and middle office functions are shared or outsourced to large utility providers

PwCPwC
Time for a Word Cloud…

PwC
Simplify
Standardise
OutsourceDigitise/Automate
Partner/Acquire
Consolidate
How do we get there?
The Future of Banking Part 2
PwC European Banking Transformation and M&A Conference
27th March 2019

The Future of Banking
Part 2
Richard Thompson
Conference Chairman
A discussion with…
Anne Boden MBEFounder & CEOStarling Bank

The Future of Banking Part 3
PwC European Banking Transformation and M&A Conference
27th March 2019

The Future of Banking
Part 3
Richard Thompson
Conference Chairman
Panel members
Henrietta Baldock
Member of PwC
Advisory Council
Nick Page
PwC Global Origination
Rob Boulding
Partner
Portfolio Advisory Group

PwCPwC
European loan portfolio transaction volumes over time
0
20
40
60
80
100
120
140
160
2011 2012 2013 2014 2015 2016 2017 2018
Face V
alu
e (
€bn)
PwCPwC
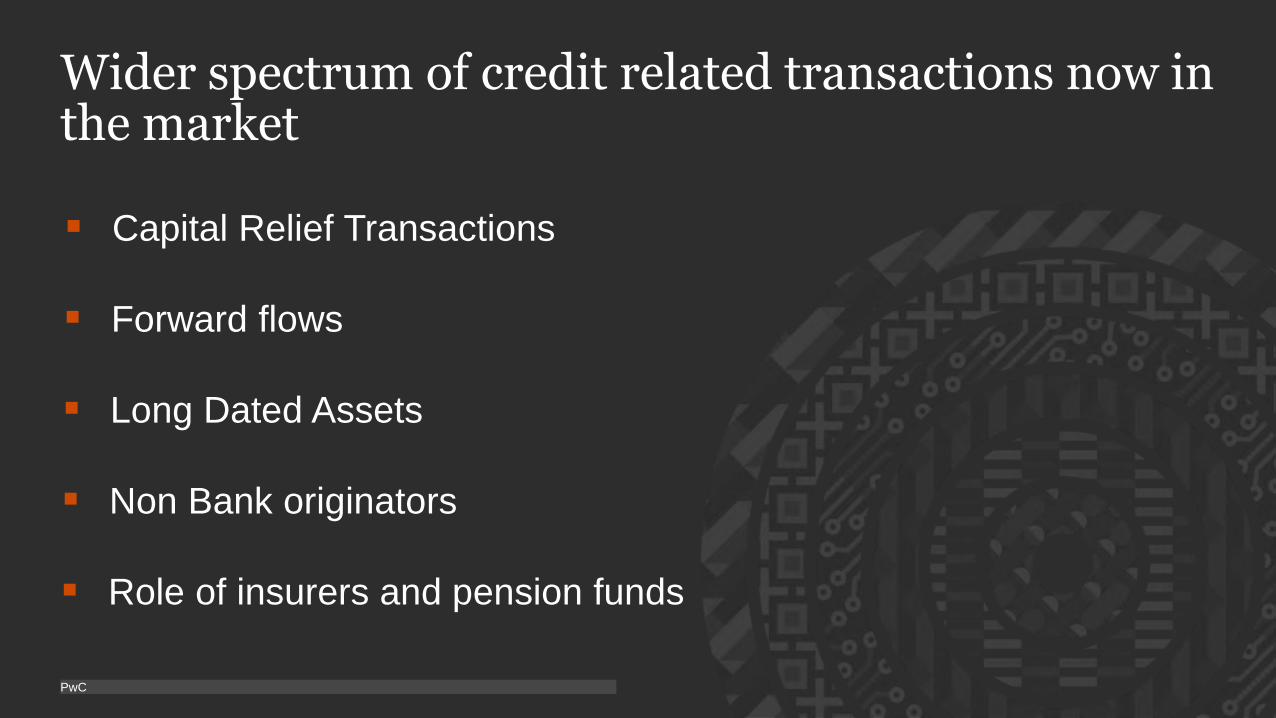
Wider spectrum of credit related transactions now in the market
Capital Relief Transactions
Forward flows
Long Dated Assets
Non Bank originators
Role of insurers and pension funds

The Future of Banking Part 4
PwC European Banking Transformation and M&A Conference
27th March 2019

The Future of Banking
Part 4
Richard Thompson
Conference Chairman
A discussion with…
James Saull
Senior Manager
Amazon Web Services - FS

Disruption Room Results
Richard Thompson
Conference ChairmanShazia Azim
Head of Strategy & COO for FS
PwC

PwCPwC
Disruption Room Results
How you have viewed disruption and disruptive influences?
% of automation now vs 5 years
Threat to established banking market
Disruption is a valuedriver for M&A
Automation is coming at pace
Big Tech is overwhelming driving change
Disruption is a value driver for M&A
Big Tech69%
40%Now60%
5 years
60%

PwCPwC
Disruption Room Results
Use of disruptive technology
Believe AI will displace more jobs than it creates
Would immediately use voice assistants for financial advice
VR to become the norm inwork & personal life
AI will have a huge impact on workforce
Voice recognition will transform finacial intelligence
Virtual reality will become mainstream in the near future
73%70%83%

PwC European BankingTransformation andM&A Conference
This publication has been prepared for general guidance on matters of interest only, and does not constitute
professional advice. You should not act upon the information contained in this publication without obtaining
specific professional advice. No representation or warranty (express or implied) is given as to the accuracy or
completeness of the information contained in this publication, and, to the extent permitted by law, PwC does
not accept or assume any liability, responsibility or duty of care for any consequences of you or anyone else
acting, or refraining to act, in reliance on the information contained in this publication or for any decision based
on it.
© 2019 PwC. All rights reserved. “PwC‘ refers to the PwC network and/or one or more of its member firms,
each of which is a separate legal entity. Please see www.pwc.com/structure for further details.

PwC European BankingTransformation andM&A Conference
Transforming the market, creating value
27 March 2019

Driving a successful FinTech deal
PwC European Banking Transformation and M&A Conference
27 March 2019

PwCPwC
PwC view on FinTech
PwC
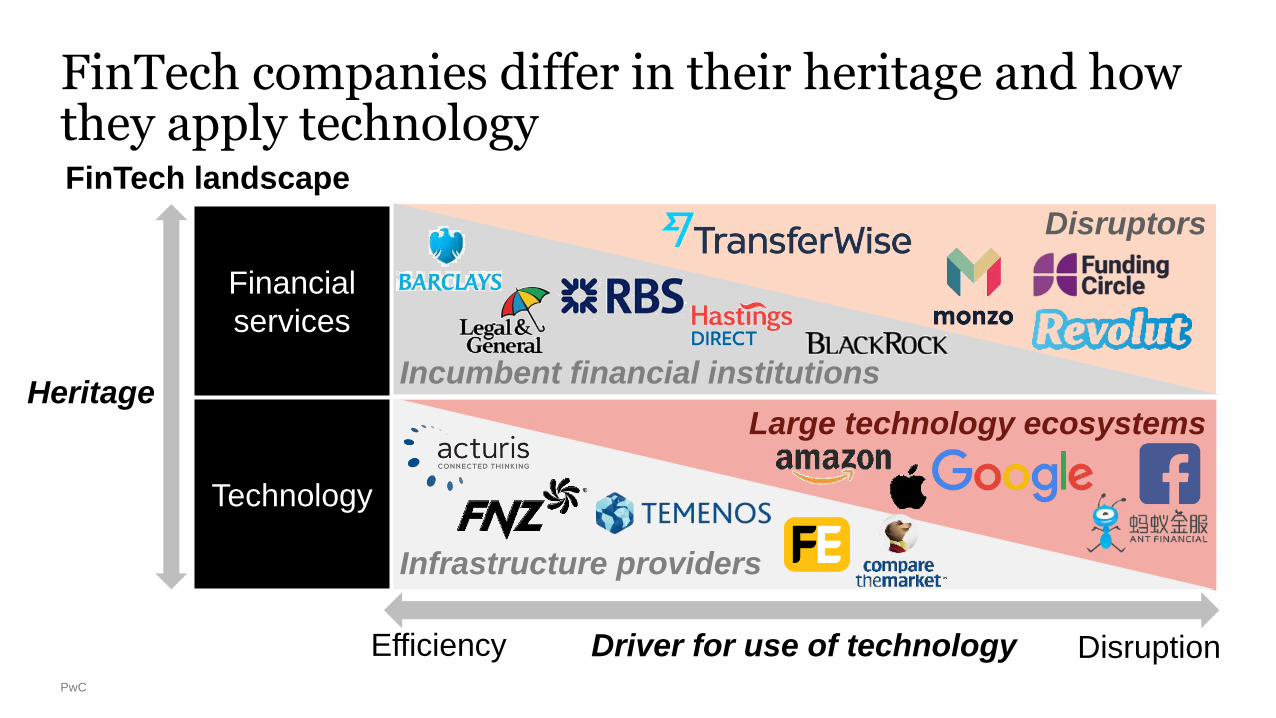
FinTech companies differ in their heritage and how they apply technology
DisruptionEfficiency
FinTech landscape
Driver for use of technology
Disruptors
Large technology ecosystems
Incumbent financial institutions
Infrastructure providers
Financial
services
Technology
Heritage

PwC
The FinTech landscape spans multiple sectors, with each experiencing hot-spots of tech-led innovationKey FinTech
sectorsHot sub-sectors Example companies
Banking &
lendingDigital banking
Alternative
lendingPOS finance Credit scoring
Capital
marketsTrading
software
Clearing &
settlement
Data
management
Capital markets
data
Insurance TelematicsInsurer
software
Aggregation
platformsBroker software
Asset/wealth
managementData
management
DFM & robo-
advisors
Wealth platform
systems
Enterprise
software
Payments FX paymentsMobile / e-
paymentsE-wallets
Payment
processing
FinTech support
services incl.
RegTech
Regulatory &
compliance
systems
Risk
management
systems
Document
production &
management
Data
management /
governance

PwC
Market trends are creating positive dynamics for FinTech companies…
Increased cost to serve - several
factors are putting pressure on
providers’ cost bases, and they are
seeking technology to reduce this
Evolving value chains with
new business models and new
ways to deliver products and
services
Evolving FS landscape with products and
services being delivered by new disruptors
challenging incumbent providers
Technology and innovation
creating both improved efficiency
& disruptive new services; user
experiences, ways to leverage
data and cloud solutions
Changing consumer
behaviour with a growing
demand for; digital distribution,
price comparison, ease of use
Waves of regulatory evolution
with implications for the business
models and operations of
incumbents and new businesses
alike
Market
trends

PwC
…who are becoming increasingly attractive to investors…
Large and growing market fuelled by
technological development and innovation
Capital light businesses with high margins
Diverse range of investable assets ranging
from start-ups to mature businesses
Highly scalable business models

PwC
…as seen in the number of FinTech deals which has been growing significantly
107
646339
2012 2016
18%
20182014
Number of FinTech M&A deals
UK Rest of Europe Rest of World
174151134
98
10%
201820142012 2016
653
446322
223
20%
2012 201820162014
We estimate that in 2018, c.10% of these deals were >£500m
and a further c.25% were £50-500m in deal value
Source: Pitchbook, PwC analysis

PwCPwC
Panel Discussion

Driving a successful FinTech deal
or investment
Neil Hampson
Partner – Strategy
PwC
Panel members
Gemma Godfrey
Founder & CEO
Moola
Ludovic Blanquet
VP, Global Product
Strategy & Portfolio
Finastra
Richard Watts
Fund Manager
Merian Global Investors
Andrew Macnab
FinTech Deals Lead
PwC

PwCPwC
Wrap up

PwC
Our FinTech Deals team spans across a range of deal areas, with some highly specialised teams
Multiple
FinTech
deals
teams…
…some
highly
specialised
teams
Cyber
Value
Creation in
Deals
SCALE
(Start-up
acceleration)
RAISE
(Fundraising)
LegalDigitalCorporate
Finance
TechnologyOperationsValuations
Data &
Analytics
Financial
& Tax
Commercial

PwC European BankingTransformation andM&A Conference
This publication has been prepared for general guidance on matters of interest only, and does not constitute
professional advice. You should not act upon the information contained in this publication without obtaining
specific professional advice. No representation or warranty (express or implied) is given as to the accuracy or
completeness of the information contained in this publication, and, to the extent permitted by law, PwC does
not accept or assume any liability, responsibility or duty of care for any consequences of you or anyone else
acting, or refraining to act, in reliance on the information contained in this publication or for any decision based
on it.
© 2019 PwC. All rights reserved. “PwC‘ refers to the PwC network and/or one or more of its member firms,
each of which is a separate legal entity. Please see www.pwc.com/structure for further details.

PwC European BankingTransformation andM&A Conference
Transforming the market, creating value
27 March 2019

Matchmaking between Banks and FinTechs
PwC European Banking Transformation and M&A Conference
27 March 2019

PwCPwC
1. Introduction and Opening Statement
2. Banking transformation
3. Currency Cloud
4. Squirrel
5. Growth Street
6. Q&A and Close
Agenda

Matchmaking between banks
and Fintechs
Panel members
Stephen Lemon
Co-founder
Currency Cloud
Greg Carter
Founder & CEO
Growth Street
Emanuel Andjelic
Chairman & Co-Founder
Squirrel
Mike Magee
FS Deals Leader
PwC
Caroline Vaughan
Head of Commercial and
Business Development
Innovate Finance
Darshan Chandarana
Technology & Change Partner
PwC

PwC
Open API Banking is creating a new ecosystem
By unlocking new opportunities and revenue streams through collaboration with 3rd parties and/or strategic partners
Open Banking enables a new distribution channel
3rd Party Ecosystem
Traditional Banking
£
£ £ £
£
£ £
Open Data API Open Data API
Own products and services
3rd party products and services £
Revenue streams
Banking Domain Today
Open Banking Domain
Direct Revenue
Distribution Channel
Marketing Channel
3rd Party Innovation
• Open new lower cost and lower risk revenue streams, opportunity to access new Digital Customers communities, lower the costs of distribution by leveraging established 3rd parties within Digital communities
• Monetise existing data sets, increase access to new and existing customer data sets, protect existing Customers and revenue
• Lower costs of marketing and ability to promote your brand within specific targeted Digital communitiese.g. Digital Marketplaces, Social media, Gaming, Messaging, Digital Real Estate, Digital Automotive etc.
• Define new business value through the ability to collaborate more easily with 3rd parties who can access targeted Digital communities, lower costs via STP automation with Customers and Partners
Opportunity for banks

PwC
Collaboration will accelerate innovation - Banking platforms need to be more adaptable
Financial Service Providers
Lifestyle Providers
On boarding Innovations
AI, Data and Analytics
Customer Management
Digital Layer
Banks own Customer-facing digital layer
Lifestyle providers
Financial product
providers
Customer Management
.
AI, Data and Analytics
Onboarding, Risk, KYC
CoreBanking engine
Open Data APIs
Cybersecurity
3rd party ecosystem

A global B2B cross-border infrastructure solution
Collections, conversions, and payments.
Confidential
Company Overview

We are unlocking the global digital economy for the next generation of financial companies and creating a better tomorrow for all

Currencycloud at a glance
(1) Monthly run-rate revenue for December 2018 converted using a GBP/USD exchange rate of 1.285 as at 24/8/2018
$1bnmonthly volume
300+customers
c.$37m2018 exit
run-rate(1)
c.65%revenue CAGR
FY2016-2019E
180FTEs
(Dec 2018)
A comprehensive B2B cross-border infrastructure
solution for collections, conversions, and payments.
Built through innovative APIs and a full-stack
technology platform.
Delivered via a SaaS model.

(1) Fintech and other pure play digital operators
(2) Financial Institutions
FY2017A FY2018E FY2022E
108.4
170.4
CAGR +9%
87%91%92%
13%
9%8%
119.0
FY2017A FY2018E FY2022E
330.8
94%96%96%
4%4%
6%
240.8221.5
CAGR +8%
Total value of cross-border B2B transactions Total revenue from cross-border B2B transactions
Traditional players(2) Non-traditional players(1)
(£ Trillion) (£ Billion)
18 millionBusinesses making
transactions in 2018
8-9%Market CAGR
2017-2022E
£10 trillionValue of non-traditional(1)
cross-border B2B
transactions
£119 trillionTotal value of
cross-border B2B
transactions in 2018
Massive and growing international B2B payments market
Sources: B2B Money Transfer, Cross-border Market Opportunities 2018-2022,
Juniper Research.
Values are shown in GBP trillion, translated from USD at the GBP/USD exchange
rate at 1.285 as of 24/8/2018

Trends driving the growth of cross-border payments
Globalization
Increasingly connected world
Increasing expectations
Customers demand speed and transparency
Controls
Stricter compliance and greater focus
on security
Uberization
New business models favor
integrated payments

Banks cannot keep up with today’s needs
Legacy technologyFix over build
Innovation takes a back seatOther priorities come first
Difficult to serve new entrants
Fragmented organizations Slow to respond to market changes

FX brokers/
remittance
companies
E-commerce
platforms
Currencycloud – disrupting the cross-border business
What we do… For whom?
Banks and
issuersAPI
Collections
Regulated activity facilitating
end-users to get paid locally
Conversions
Offering real-time wholesale
FX rates, spots and forwards
Payments
Automated, end-to-end
payments process, sending
globally to customers
Management
Provision of complete control over
accounts of customers through
state-of-the-art dashboards

Emanuel Andjelic
Co-Founder & Chairman

@asksquirrel
The problem - People are bad with money
I just can’t save any money!
Always more month than money!
Where has all my money gone?

@asksquirrel
Everything is geared to help you spend more AND easier!

@asksquirrel
Squirrel gives people control of their money!

@asksquirrel
How it works

@asksquirrel

@asksquirrel
Squirrel reviews - “Life Changing”
Squirrel Trust Pilot Page

@asksquirrel
Ranked the UK’s #1 Savings Product!
“Squirrel’s savings
product has taken over
from RBS/NatWest’s
‘Your Saving Goals’
product as the top-
ranked in the UK.”
- Fairbanking Ratings Report
@asksquirrel
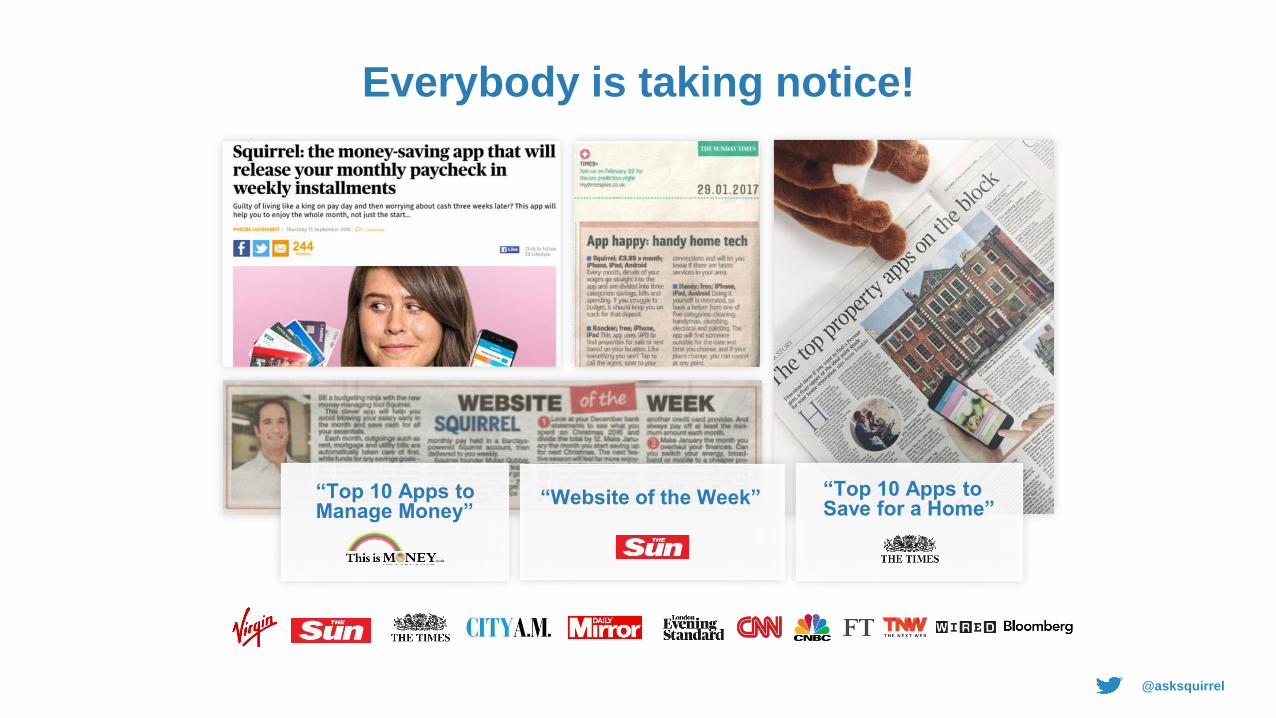
Everybody is taking notice!
“Website of the Week” “Top 10 Apps to Save for a Home”
“Top 10 Apps to Manage Money”

@asksquirrel
Squirrel’s Business Model
Subscription CommissionsWhitelabel
TODAY Future
%

@asksquirrel

PwC
Banks and FintechCollaboration and innovation
March 2019
26

PwC
GrowthLine
27
FLEXIBILITY
AM
OU
NT
Term debt
Invoice finance
Overdraft
● £420m matched on platform
● 9,718 average data points per borrower
● 2,276 live investors
● Open Banking & accounting data integrations
● GrowthLine APIs for partners

PwC
Tech & regulation driving realignment of financial services
Cloud Accounting
SME
Challenger Banks
Mainstream Banks
Who will win the battle to become the new
gateway to financial services for SMEs?

PwC
Comparative advantage can lead to win-win outcomes
29
Balance sheet &
Customer base
Innovative product
proposition & technology
Banks Fintechs
PwC European BankingTransformation andM&A Conference
This publication has been prepared for general guidance on matters of interest only, and does not constitute
professional advice. You should not act upon the information contained in this publication without obtaining
specific professional advice. No representation or warranty (express or implied) is given as to the accuracy or
completeness of the information contained in this publication, and, to the extent permitted by law, PwC does
not accept or assume any liability, responsibility or duty of care for any consequences of you or anyone else
acting, or refraining to act, in reliance on the information contained in this publication or for any decision based
on it.
© 2019 PwC. All rights reserved. “PwC‘ refers to the PwC network and/or one or more of its member firms,
each of which is a separate legal entity. Please see www.pwc.com/structure for further details.

PwC European BankingTransformation andM&A Conference
Transforming the market, creating value
27 March 2019

Value Creation in Deals –Financial Services
PwC European Banking Transformation andM&A Conference
27th March 2019

Pier Paolo Masenza
EMEA FS Leader,
Value Creation in
Deals Partner
PwC Italy
Value Creation in Deals –
Financial Services
Panel members
Anna Sargeant
Director
PwC UK

PwC
We have commissioned Global, independent research, delivering insight on what drives deal success
The M&A market is changing, a focus
on value creation has never been more
important:
• Volatility in pricing transactions
• Industry disruption
• Industry convergence
• Technological change
Global M&A research independently
conducted by:
61% of buyers believe that their last
acquisition created value, whilst in
reality…
53% of acquisitions underperformed
their industry peers.
57% of divestors underperformed their
industry peers…
Both based on Total Shareholder Value, on
average, over the 24 months following
completion of their last deal.
Those who prioritise value creation outperform peers by as much as 14%…

PwC
3,498
acquisitions
2,054
divestments
To
tal
nu
mb
er
of
de
als
co
mp
lete
d
Data period covered in our
studyData period not covered in our
study
Research methodology and background
600 C-Suite
interviews
+ more than 30 PwC Global
Deals Leaders

PwC
The buyer’s guide
90% of buyers had a creation plan in place however 53% of acquisitions failed to create value 24 months after completion…
Start with a clear M&A
strategy
80% state that more work
can be done to validate their
pre-deal hypotheses and
68% say target selection
can be improved.
Focus on value
creation from the start
90% of buyers had a
value creation plan in place
when they signed a deal,
however 83% stated that
their plans could be improved.
Focus on keeping your
best people
82% of companies that
destroyed significant deal value
had lost over 10% of the
target’s employees following
the transaction.
1: Pre-deal 2: During deal 3: Post deal

PwC
…Dealmakers state that a broader and more intense focus on Value Creation would have been needed
Value creation
Operational stability
Client/customer retention
Human capital optimization
Talent retention
Changing operating model
Rebranding
66%
34%
48%
53%
44%
35%
19%
14%
11%
8%
10%
24%
Should have been priorities
30% 40% 50% 60% 70%
30%
2%
Actual priorities
20%0% 10%
PwC
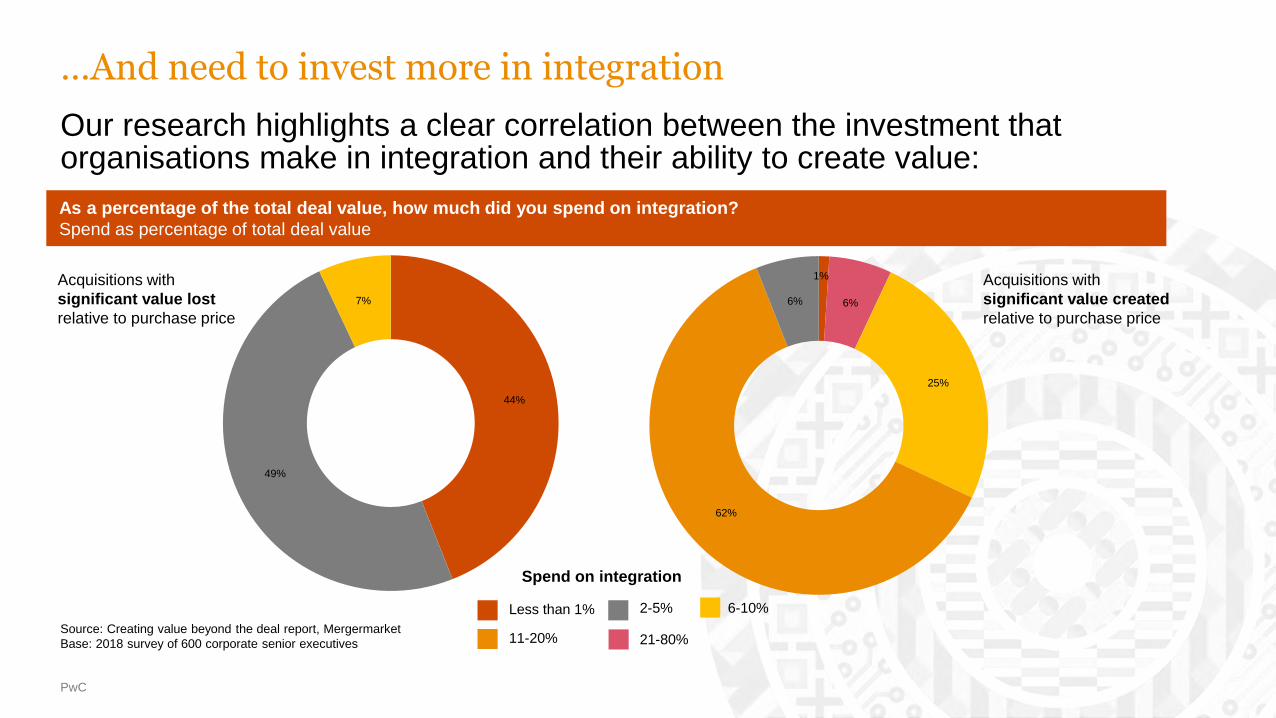
…And need to invest more in integration
Our research highlights a clear correlation between the investment that organisations make in integration and their ability to create value:
As a percentage of the total deal value, how much did you spend on integration?
Spend as percentage of total deal value
Source: Creating value beyond the deal report, Mergermarket
Base: 2018 survey of 600 corporate senior executives
Less than 1% 2-5% 6-10%
11-20% 21-80%
44%
49%
7%
1%
6%
25%
62%
6%
Acquisitions with
significant value lost
relative to purchase price
Acquisitions with
significant value created
relative to purchase price
Spend on integration

PwC
Top talent retention is one of the most effective barometers of deal success
Culture takes a long time to develop, a great deal of effort to maintain, but relatively little time to undermine. As such, early consideration is critical.
Talent retention is a key barometer of deal success, with 82% of deals that lost significant value losing 10% or more of key employees
- demonstrating that culture plays a central role, in delivering value beyond the deal
2%
16%
40% 42%
50%
31%
19%
0%
0-5% 6-10% 11-20% 21-30%
What percentage of target employees left, that you would have hoped to retain?
Acquisitions with siginifican value lost Acquisitions with siginifican value gainedAcquisitions with significant value lost Acquisitions with significant value gained

PwC
The seller’s guide
Our research shows that 57% Divestitures underperform their industry benchmark 24 months after completion...
Experience is key
65% of respondents
stating that their last
divestment lost significant
value made no divestments in
a typical year.
Your plan should be a
blueprint, not a
checklist
99% of divestments that
created significant value have
formalised methodologies in
place.
Make the most of your
people
89% believe they could
drive more sales value, by
engaging more closely with the
management team
1: Pre-deal 2: During deal 3: Post deal
PwC
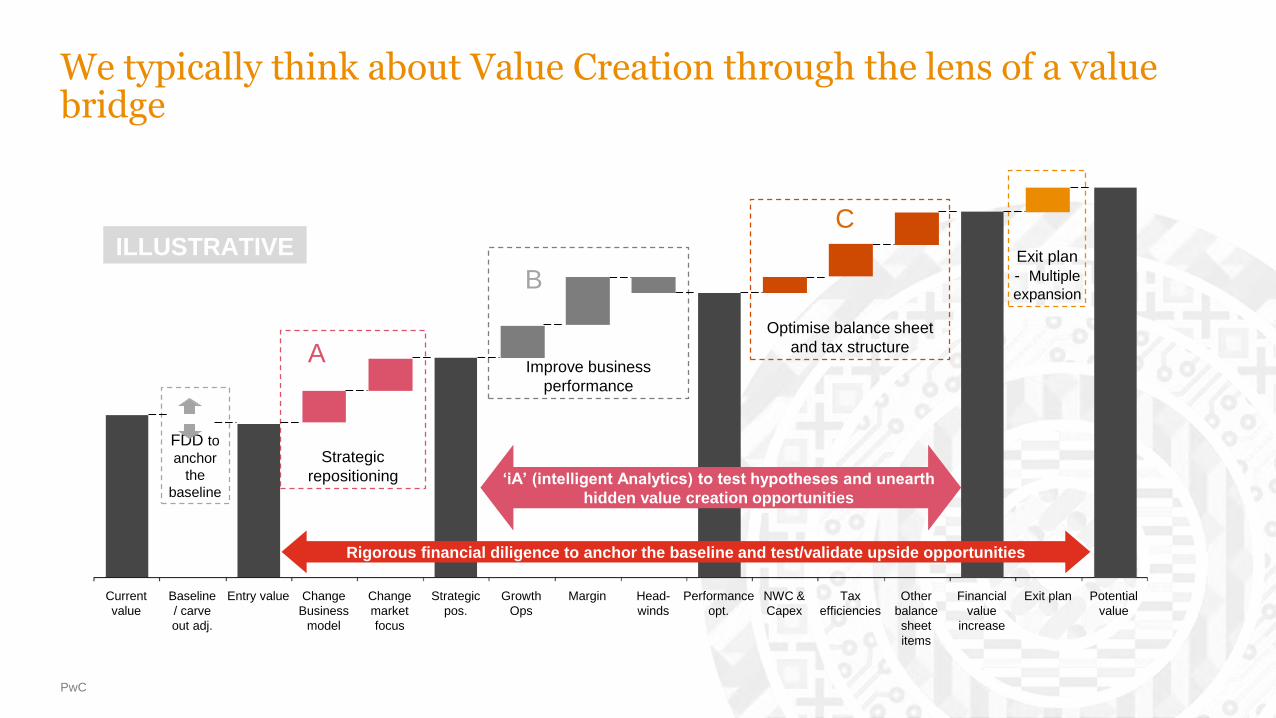
We typically think about Value Creation through the lens of a value bridge
FDD to
anchor
the
baseline
Exit plan
- Multiple
expansion
Optimise balance sheet
and tax structure
Improve business
performance
Strategic
repositioning
Potential
value
Exit planTax
efficiencies
NWC &
Capex
Head-
winds
Financial
value
increase
MarginGrowth
Ops
Other
balance
sheet
items
Performance
opt.
Strategic
pos.
Change
Business
model
Change
market
focus
Baseline
/ carve
out adj.
Entry valueCurrent
value
A
B
CILLUSTRATIVE
Rigorous financial diligence to anchor the baseline and test/validate upside opportunities
‘iA’ (intelligent Analytics) to test hypotheses and unearth
hidden value creation opportunities

PwC
Three steps to creating value beyond the deal
Stay true to the strategic
intent
It is crucial to develop a
strategy that prioritises value
at every stage of the deal: from
identifying the right target, to
planning rigorous due diligence,
ensuring key talent remain
engaged and investing
appropriately in value creation
planning and integration.
Be clear on all elements of
the value creation plan
Whether buying or selling, have a
comprehensive value creation
plan in place.
Start early, be thorough and
take every opportunity to validate
the key assumptions in the plan
through advanced analytics and
diligence. Value creation plans
should cover all aspects,
including strategic repositioning,
improving business performance,
optimising operating model, the
balance sheet and considering
the right tax structure.
Put culture at the heart of
the deal
Many organisations now rank
their people as their most
important asset. Whether buying
or selling, recognising key
skills, clear communication
and incentivising core talent to
stay engaged throughout the
deal process, is essential. Buying
a brand but losing the people
who made it so desirable, or
preparing an asset for sale, but
losing the vital people within,
can both destroy deal value.

PwC European BankingTransformation andM&A Conference
This publication has been prepared for general guidance on matters of interest only, and does not constitute
professional advice. You should not act upon the information contained in this publication without obtaining
specific professional advice. No representation or warranty (express or implied) is given as to the accuracy or
completeness of the information contained in this publication, and, to the extent permitted by law, PwC does
not accept or assume any liability, responsibility or duty of care for any consequences of you or anyone else
acting, or refraining to act, in reliance on the information contained in this publication or for any decision based
on it.
© 2019 PwC. All rights reserved. “PwC‘ refers to the PwC network and/or one or more of its member firms,
each of which is a separate legal entity. Please see www.pwc.com/structure for further details.
PwC European BankingTransformation andM&A Conference
Transforming the market, creating value
27 March 2019

Digital Banking – Creating Value with Deals
PwC European Banking Transformation andM&A Conference
27 March 2019

PwC
More banks are looking to collaborate with / invest in scale-upsProviding significant value creation opportunity at moderate risk
Tu
rn
ov
er
Scale up Exit or integrateVenture
A) Integrate
Fintech growth stages
Interesting phase to invest for banks:
Significant value creation potential and
value add with moderate (lower than
VC) risk profile
B) Exit

PwC
Value Creation bridge - value creation throughout the deal cycle Illustrative example for Fintech (enabler) investment from a Bank’s perspective
Entry Value Diminish entrepre-neurship
People/ culture loss
Potential value
BS (capital) optimi-sation
Reg. costoverlay
Efficiency (C/I) impr.
Clientexperience
New clients, exist.
services
New services
New geo-graphies
Growth levers
Performance optimisation
Potential headwinds
Strat.Pos.
Perf.Optim.
Fin. Value
increase
Consider sustainable and one-off growth opportunities
Consider sustainable banking customer experience and C/I
improvements
Consider potential headwinds (and risk mitigation) from pulling a fintech into the
banking ecosystem.
Consider potential RWA relief
Multipleuplift
Value pre-mult.
uplift
Moving towards tech multiples
i.s.o. bank multiples

Panel discussion
Manoël de Goeij
Partner
PwC Deals, Netherlands
Panel members
Jan-Willem Nieuwenhuize
Managing Director
ING Ventures
Conrad Ford
Founder & CEO
Funding Options
Dr Tim Sievers
Founder & CEO
Deposit Solutions
Sofie Simon
Sr. Manager
PwC Deals, Switzerland
Torsten Winkler
Partner at
Vitruvian Partners

PwCPwC
Prepare to vote…

PwCPwC
27th March 2019PwC European Banking Transformation and M&A Conference

PwCPwC
27th March 2019PwC European Banking Transformation and M&A Conference

PwCPwC
27th March 2019PwC European Banking Transformation and M&A Conference

PwCPwC
27th March 2019PwC European Banking Transformation and M&A Conference

Panel discussion
Manoël de Goeij
Partner
PwC Deals, Netherlands
Panel members
Jan-Willem Nieuwenhuize
Managing Director
ING Ventures
Conrad Ford
Founder & CEO
Funding Options
Dr Tim Sievers
Founder & CEO
Deposit Solutions
Sofie Simon
Sr. Manager
PwC Deals, Switzerland
Torsten Winkler
Partner at
Vitruvian Partners

PwC European BankingTransformation andM&A Conference
This publication has been prepared for general guidance on matters of interest only, and does not constitute
professional advice. You should not act upon the information contained in this publication without obtaining
specific professional advice. No representation or warranty (express or implied) is given as to the accuracy or
completeness of the information contained in this publication, and, to the extent permitted by law, PwC does
not accept or assume any liability, responsibility or duty of care for any consequences of you or anyone else
acting, or refraining to act, in reliance on the information contained in this publication or for any decision based
on it.
© 2019 PwC. All rights reserved. “PwC‘ refers to the PwC network and/or one or more of its member firms,
each of which is a separate legal entity. Please see www.pwc.com/structure for further details.
PwC European BankingTransformation andM&A Conference
Transforming the market, creating value
27 March 2019

Place Your Debts: What is the future of the debt purchase sector?
PwC European Banking Transformation and M&A Conference
27 March 2019

Place Your Debts: What is the
future of the debt purchase
sector?
Richard Thompson
Conference Chairman
Panel members
Rasmus Hannson
Director M&A and Investor
Relations – B2 Holding
Richard Roberts
Head of Corporate
Development – Arrow Global
David Schuster
Senior Manager
PwC Deals
Joshua Rozells
Senior Manager
PwC Deals

PwC
Share prices
FTSE All-Share Index
40
50
60
70
80
90
100
110
120
130
140
150
Mar-17 Jun-17 Sep-17 Dec-17 Mar-18 Jun-18 Sep-18 Dec-18 Mar-19
Note: Share prices indexed to 100 = March 2017, local currency
Source: S&P Capital IQ, Bloomberg
PwC
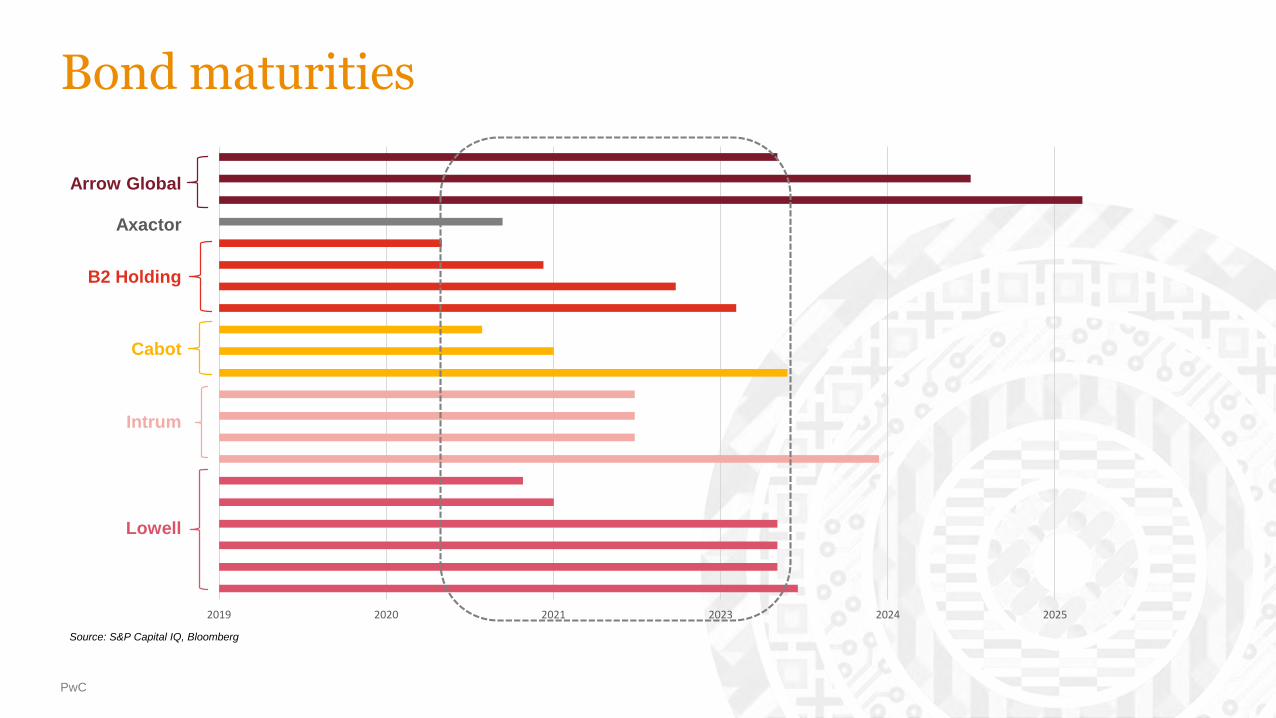
Bond maturities
Arrow Global
Axactor
B2 Holding
Cabot
Intrum
Lowell
2019 2020 2021 2023 2024 2025
Source: S&P Capital IQ, Bloomberg

PwC
Bond prices
88
90
92
94
96
98
100
102
Mar 18 May 18 Jul 18 Sep 18 Nov 18 Jan 19 Mar 19
GBP100m, 5.125%
EUR400m, 2.875%
102
103
104
105
106
107
108
Mar 18 May 18 Jul 18 Sep 18 Nov 18 Jan 19 Mar 19
EUR175m, 7.0%
EUR150m, 7.5%
86
88
90
92
94
96
98
100
Mar 18 May 18 Jul 18 Sep 18 Nov 18 Jan 19 Mar 19
EUR1.5bn, 2.75%
EUR900m, 3.125%
Source: S&P Capital IQ, Bloomberg

PwC
The US debt purchase cycle

PwC European BankingTransformation andM&A Conference
This publication has been prepared for general guidance on matters of interest only, and does not constitute
professional advice. You should not act upon the information contained in this publication without obtaining
specific professional advice. No representation or warranty (express or implied) is given as to the accuracy or
completeness of the information contained in this publication, and, to the extent permitted by law, PwC does
not accept or assume any liability, responsibility or duty of care for any consequences of you or anyone else
acting, or refraining to act, in reliance on the information contained in this publication or for any decision based
on it.
© 2019 PwC. All rights reserved. “PwC‘ refers to the PwC network and/or one or more of its member firms,
each of which is a separate legal entity. Please see www.pwc.com/structure for further details.

PwC European BankingTransformation andM&A Conference
Transforming the market, creating value
27 March 2019

The Credit Cycle
PwC European Banking Transformation and M&A Conference
27 March 2019

The Credit Cycle
A discussion with…
Edward AltmanProfessor of Finance at NYU Stern School of Business and co-founder and Board member of Wiserfunding
Joshua Rozells
Senior Manager
PwC Deals

4444
Dr. Edward Altman
NYU Stern School of Business
Wiserfunding Limited
Where Are We in the Credit
Cycle?
European Banking Transformation and M&A Conference
PwC United Kingdom
London
March 27, 2019

Size Of High-Yield Bond Market
Source: NYU Salomon Center estimates using Credit Suisse, S&P and Citi data
1978 – 2019 (Mid-year US$ billions)
US Market
Western Europe Market
Source: Credit Suisse
1994 – 2018*
*Includes non-investment grade straight corporate debt of issuers with assets located in or revenues derived from Western Europe, or the bond is denominated in a Western European currency. Floating-rate and convertible bonds and preferred stock are not included.
$1,669
$-
$200
$400
$600
$800
$1,000
$1,200
$1,400
$1,600
$1,800
1978
1979
1980
1981
1982
1983
1984
1985
1986
1987
1988
1989
1990
1991
1992
1993
1994
1995
1996
1997
1998
1999
2000
2001
2002
2003
2004
2005
2006
2007
2008
2009
2010
2011
2012
2013
2014
2015
2016
2017
2018
2019
$ (
Bil
lio
ns)
2 5 9 1427
4561
7089 84 81 80 81 77 81
108
154
208
283
370
418
468 472 465
494
0
50
100
150
200
250
300
350
400
450
500
€ (
Bil
lion
s)

Size of Corporate HY Bond Market: U.S., Europe, Emerging
Markets & Asia (ex. Japan) ($ Billions)
Source: NYU Salomon Center, Credit Suisse, LIM Advisors Ltd.
2018
*Mainly Latin America. Note: EM & Asia value as of 2017.
5
175
460*
494
1,669
2,803
0 500 1,000 1,500 2,000 2,500 3,000
Russia
Asia
EM
Europe
U.S.
Total HY Global Market
$ Billions

Size of The U.S. High-Yield and Leveraged
Loan* Markets
*Primarily Institutional Tranches. **NYU Salomon Center High-Yield Market Size as of 12/31/17 and 12/31/2018.
Source: S&P Global Market Intelligence.
$0.0
$0.2
$0.4
$0.6
$0.8
$1.0
$1.2
$1.4
$1.6
$1.8
1997 1999 2001 2003 2005 2007 2009 2011 2013 2015 2017**
$ in
Tri
llio
ns
Leveraged Loans H.Y. Bonds
1997-2018

Benign Credit Cycle: Is It Over?
Length of Benign Credit Cycles: Is the Current Cycle Over? No.
Default Rates (no), Default Forecast (no), Recovery Rates (no), Yields
(no) & Liquidity (no)
Coincidence with Recessions: U.S. & European Scenarios
Level of Non-financial Debt as a Percent of GDP
Global Debt Levels
Comparative Health of High-Yield Firms (2007 vs. 2017)
High-Yield CCC New Issuance as a Liquidity Measure
LBO Statistics and Trends
Liquidity Concerns (Market and Market-Makers)
Possible Timing of the Bubble Burst (Short-term versus Longer-term)

Benign Credit Cycle? Is It Over?
• Length of Benign Credit Cycles: Is the Current Cycle Over? No.
• Default Rates (no), but Rising
• Default Forecast (no)
• Recovery Rates (no)
• Yields (no)
•Liquidity (no)

Straight Bonds Only Excluding Defaulted Issues From Par Value Outstanding, (US$ millions), 1971 – 2019 (2/28)
Historical H.Y. Bond Default Rates
Year
Par Value
Outstandinga
($)
Par Value
Defaults
($)
Default
Rates
(%)
2018 1,664,166 28,994 1.742
2017 1,622,365 29,301 1.806
2016 1,656,176 68,066 4.110
2015 1,595,839 45,122 2.827
2014 1,496,814 31,589 2.110
2013 1,392,212 14,539 1.044
2012 1,212,362 19,647 1.621
2011 1,354,649 17,963 1.326
2010 1,221,569 13,809 1.130
2009 1,152,952 123,878 10.744
2008 1,091,000 50,763 4.653
2007 1,075,400 5,473 0.509
2006 993,600 7,559 0.761
2005 1,073,000 36,209 3.375
2004 933,100 11,657 1.249
2003 825,000 38,451 4.661
2002 757,000 96,855 12.795
2001 649,000 63,609 9.801
2000 597,200 30,295 5.073
1999 567,400 23,532 4.147
1998 465,500 7,464 1.603
1997 335,400 4,200 1.252
1996 271,000 3,336 1.231
1995 240,000 4,551 1.896
1994 235,000 3,418 1.454
1993 206,907 2,287 1.105
a Weighted by par value of amount outstanding for each year.
Year
Par Value
Outstanding*
($)
Par
Value
Defaults
($)
Default
Rates
(%)
1992 163,000 5,545 3.402
1991 183,600 18,862 10.273
1990 181,000 18,354 10.140
1989 189,258 8,110 4.285
1988 148,187 3,944 2.662
1987 129,557 7,486 5.778
1986 90.243 3,156 3.497
1985 58,088 992 1.708
1984 40,939 344 0.840
1983 27,492 301 1.095
1982 18,109 577 3.186
1981 17,115 27 0.158
1980 14,935 224 1.500
1979 10,356 20 0.193
1978 8,946 119 1.330
1977 8,157 381 4.671
1976 7,735 30 0.388
1975 7,471 204 2.731
1974 10,894 123 1.129
1973 7,824 49 0.626
1972 6,928 193 2.786
1971 6,602 82 1.242
Standard
Deviation
(%)
Arithmetic Average Default Rate (%)
1971 to 2018 3.076 2.981
1978 to 2018 3.270 3.131
1985 to 2018 3.699 3.249
Weighted Average Default Rate (%)
1971 to 2018 3.273
1978 to 2018 3.276
1985 to 2018 3.287
Median Annual Default Rate (%)
1971 to 2018 1.774
*Includes PG&E defaults in both Par Value
Outstanding and Par Value Defaults.
Source: NYU Salomon Center and
Citigroup/Credit Suisse estimates
2019 (2/28) 1,669,171 6,771 0.406
2019 (2/28)* 1,686,748 24,348 1.443

Quarterly Default Rate and Four-Quarter Moving Average
1989 – 2019 (2/28)
Source: Author’s Compilations
Default Rates on High-Yield Bonds
0.0%
2.0%
4.0%
6.0%
8.0%
10.0%
12.0%
14.0%
16.0%
0.0%
1.0%
2.0%
3.0%
4.0%
5.0%
6.0%
4 -
Qu
art
er M
ovin
g A
ver
age
Qu
art
erly
Def
au
lt R
ate
Quarterly Moving

Historical Default Rates, Benign Credit Cycles and Recession
Periods in the U.S.*
Periods of Recession: 11/73 - 3/75, 1/80 - 7/80, 7/81 - 11/82, 7/90 - 3/91, 4/01 – 12/01, 12/07 - 6/09
*Benign credit cycles are approximated.
Source: E. Altman (NYU Salomon Center) & National Bureau of Economic Research
High-Yield Bond Market (1972 – 2018)
0.0%
2.0%
4.0%
6.0%
8.0%
10.0%
12.0%
14.0%
72
74
76
78
80
82
84
86
88
90
92
94
96
98
00
02
04
06
08
10
12
14
16
18
- 5 yrs - - 7 yrs - - 7 yrs - - 4 yrs - - 8+ yrs -

Forecasting Default Rates
Mortality Rate Approach (1989)
Yield-Spread vs. Default Rate Method (2008)
Distress Ratio vs. Default Rate Method (2008)

Default and Recovery Forecasts: Summary of Forecast Models
Source: All Corporate Bond Issuance and Authors’ Estimates of Market Size in 2018 & 2019.
Model
2018 (12/31)
Default Rate
Forecast as of
12/31/2017
2019 (12/31)
Default Rate
Forecast as of
12/31/2018
2020 (2/28)
Default Rate
Forecast as of
2/28/2019
Mortality Rate 3.90% 4.20% 4.20%
Yield-Spread 1.95%a 3.91%c 2.26%e
Distress Ratio 1.75%b 2.28%d 1.76%f
Average of Models
Recovery Rates*
2.53%
45.1%
3.46%
41.3%
2.74%
44.1%
* Recovery rate based on the log Linear equation between default and recovery rates, see Altman, et al (2005) Journal of Business, November and
Slide 37. a Based on Dec. 31, 2017 yield-spread of 394.6bp. b Based on Dec. 31, 2017 Distress Ratio of 6.11%. c Based on Dec. 31, 2018 yield-
spread of 547.2bp. d Based on Dec. 31, 2018 Distress Ratio of 9.91%. d Based on Feb. 28, 2019 yield-spread of 419.4bp. d Based on Feb. 28,
2019 Distress Ratio of 6.19%.

Recovery Rates

Source: E. Altman, et. al., “The Link Between Default and Recovery Rates”, NYU Salomon Center, S-03-4.
Recovery Rate/Default Rate Association: Dollar-Weighted Average Recovery
Rates to Dollar Weighted Average Default Rates, 1982 – 2018
1982
2004
1984
1985
1986
1987
1988
1989
1990
1991
1992
1993
19941995
1996
1997
1998
1999
20002001 2002
2003
1983
2005
2006
2007
2008
2009
2010
2011
2012
2013
2014
2015
2016
2017
2018
y = -2.7181x + 0.5495R² = 0.4822
y = -0.117ln(x) + 0.0197R² = 0.586
y = 0.5522e-6.762x
R² = 0.5309y = 39.346x2 - 7.4299x + 0.6249
R² = 0.5746
10%
20%
30%
40%
50%
60%
70%
0% 2% 4% 6% 8% 10% 12% 14%
Re
co
ve
ry R
ate
Default Rate
Re
co
ve
ry R
ate
Default Rate
Re
co
ve
ry R
ate
Default Rate
Re
co
ve
ry R
ate
Re
co
ve
ry R
ate
Default Rate
Re
co
ve
ry R
ate
Re
co
ve
ry R
ate
Re
co
ve
ry R
ate
Re
co
ve
ry R
ate
Re
co
ve
ry R
ate
Re
co
ve
ry R
ate
Re
co
ve
ry R
ate
Re
co
ve
ry R
ate
Re
co
ve
ry R
ate
Re
co
ve
ry R
ate
Re
co
ve
ry R
ate

June 01, 2007 – February 28, 2019
Sources: FTSE Yield Book Index Data and Bank of America Merrill Lynch.
YTM & Option-Adjusted Spreads Between High Yield
Markets & U.S. Treasury Notes
200
400
600
800
1,000
1,200
1,400
1,600
1,800
2,000
2,200
6/1
/20
07
9/1
4/2
007
12/3
1/2
007
4/1
5/2
008
7/2
9/2
008
11/1
1/2
008
2/2
6/2
009
6/1
1/2
009
9/2
4/2
009
1/1
1/2
010
4/2
6/2
010
8/9
/20
10
11/2
2/2
010
3/7
/20
11
6/2
0/2
011
10/3
/2011
1/1
8/2
012
5/2
/20
12
8/1
5/2
012
11/2
8/2
012
3/1
5/2
013
6/2
8/2
013
10/1
1/2
013
1/2
8/2
014
5/1
3/2
014
8/2
6/2
014
12/9
/2014
3/2
6/2
015
7/9
/20
15
10/2
2/2
015
2/8
/20
16
5/2
3/2
016
9/5
/20
16
12/1
9/2
016
4/5
/20
17
7/1
9/2
017
11/1
/2017
2/1
6/2
018
6/1
/20
18
9/1
4/2
018
12/3
1/2
018
Yield Spread (YTMS) OAS Average YTMS (1981-2018) Average OAS (1981-2018)
2/28/19 (YTMS = 419bp, OAS = 392bp)
YTMS = 536bp,
OAS = 539bp
6/12/07 (YTMS = 260bp, OAS = 249bp)
12/16/08 (YTMS = 2,046bp, OAS = 2,144bp)

Annual Returns (1978 – 2018)
Yields and Spreads on 10-Year Treasury (Treas) and High Yield (HY) Bondsa
a End-of-year yields. b Lowest yield in time series. Source: FTSE’s High Yield Composite Index
Return (%) Promised Yield (%)
Year HY Treas Spread HY Treas Spread
2019 (2/28) 6.34 0.23 6.11 6.91 2.72 4.19
2018 (2.13) (0.02) (2.11) 8.16 2.69 5.47
2017 7.05 2.13 4.92 6.35 2.41 3.95
2016 17.83 (0.14) 17.96 6.55 2.43 4.12
2015 (5.56) 0.90 (6.46) 9.27 2.27 7.00
2014 1.83 10.72 (8.89) 7.17 2.17 5.00
2013 7.22 (7.85) 15.06 6.45b 3.01 3.45
2012 15.17 4.23 10.95 6.80 1.74b 5.06
2011 5.52 16.99 (11.47) 8.41 1.88 6.54
2010 14.32 8.10 6.22 7.87 3.29 4.58
2009 55.19 (9.92) 65.11 8.97 3.84 5.14
2008 (25.91) 20.30 (46.21) 19.53 2.22 17.31
2007 1.83 9.77 (7.95) 9.69 4.03 5.66
2006 11.85 1.37 10.47 7.82 4.70 3.11
2005 2.08 2.04 0.04 8.44 4.39 4.05
2004 10.79 4.87 5.92 7.35 4.21 3.14
2003 30.62 1.25 29.37 8.00 4.26 3.74
2002 (1.53) 14.66 (16.19) 12.38 3.82 8.56
2001 5.44 4.01 1.43 12.31 5.04 7.27
2000 (5.68) 14.45 (20.13) 14.56 5.12 9.44
1999 1.73 (8.41) 10.14 11.41 6.44 4.97
1998 4.04 12.77 (8.73) 10.04 4.65 5.39
1997 14.27 11.16 3.11 9.20 5.75 3.45
1996 11.24 0.04 11.20 9.58 6.42 3.16
1995 22.40 23.58 (1.18) 9.76 5.58 4.18
1994 (2.55) (8.29) 5.74 11.50 7.83 3.67
1993 18.33 12.08 6.25 9.08 5.80 3.28
1992 18.29 6.50 11.79 10.44 6.69 3.75
1991 43.23 17.18 26.05 12.56 6.70 5.86
1990 (8.46) 6.88 (15.34) 18.57 8.07 10.50
1989 1.98 16.72 (14.74) 15.17 7.93 7.24
1988 15.25 6.34 8.91 13.70 9.15 4.55
1987 4.57 (2.67) 7.24 13.89 8.83 5.06
1986 16.50 24.08 (7.58) 12.67 7.21 5.46
1985 26.08 31.54 (5.46) 13.50 8.99 4.51
1984 8.50 14.82 (6.32) 14.97 11.87 3.10
1983 21.80 2.23 19.57 15.74 10.70 5.04
1982 32.45 42.08 (9.63) 17.84 13.86 3.98
1981 7.56 0.48 7.08 15.97 12.08 3.89
1980 (1.00) (2.96) 1.96 13.46 10.23 3.23
1979 3.69 (0.86) 4.55 12.07 9.13 2.94
1978 7.57 (1.11) 8.68 10.92 8.11 2.81
Arithmetic Annual Average
1978-2018 10.08 7.37 2.72 11.17 5.99 5.19
Compound Annual Average
1978-2018 9.21 6.84 2.36

HY Annual Total Returns and Yields (2000 – 2018)European and US HY Index Total Return and Yield spreads over Govt. Bonds
Compounded Annual Growth Rate (CAGR)
EUR HY US HY
2001-2017 7,91% 7,88%
2008-2017 9,26% 7,59%
2010-2017 9,02% 7,68%
Arithmetic Average Return
EUR HY US HY
2001-2017 10,18% 9,04%
2008-2017 12,66% 9,27%
2010-2017 9,35% 7,92%
Correlation Between US & EUR HY Market
Annual Monthly
2001-2017 0,99 0,87
2008-2017 0,96 0,91
2010-2017 0,69 0,87
Source: Bloomberg Barclays Indices; ICE BOFAML
Indices; Citigroup Indices; Classis Capital
Year EUR HY US HY EUR HY US HY EUR HY US HY EUR HY US HY
2018 -0,05% -0,38% 1,32% 3,34% 3,51% 6,62% 2,86% 3,74%
2017 6,24% 7,05% 7,00% 4,92% 3,32% 6,35% 2,89% 3,95%
2016 6,48% 17,83% 2,15% 17,96% 4,13% 6,55% 3,93% 4,12%
2015 2,92% -5,56% 2,10% -6,46% 5,37% 9,27% 4,74% 7,00%
2014 7,02% 1,83% -6,37% -8,89% 4,65% 7,17% 4,10% 5,00%
2013 9,90% 7,22% 11,76% 15,06% 5,08% 6,45% 3,15% 3,45%
2012 28,49% 15,17% 21,55% 10,95% 6,63% 6,80% 5,32% 5,06%
2011 -2,39% 5,52% -15,23% -11,47% 11,74% 8,41% 9,91% 6,54%
2010 16,18% 14,32% 9,27% 6,22% 8,60% 7,87% 5,63% 4,58%
2009 86,67% 55,19% 85,05% 65,11% 10,74% 8,97% 7,35% 5,14%
2008 -34,90% -25,91% -49,86% -46,21% 26,05% 19,53% 23,10% 17,31%
2007 -2,99% 1,83% -4,65% -7,95% 9,36% 9,69% 5,05% 5,66%
2006 11,66% 11,85% 12,51% 10,47% 6,71% 7,82% 2,76% 3,11%
2005 6,71% 2,08% 0,81% 0,04% 7,79% 8,44% 4,48% 4,05%
2004 13,98% 10,79% 4,78% 5,92% 6,70% 7,35% 3,02% 3,14%
2003 28,52% 30,62% 24,20% 29,37% 7,80% 8,00% 3,51% 3,74%
2002 -3,31% -1,53% -14,59% -16,19% 14,34% 12,38% 10,14% 8,56%
2001 -8,11% 5,44% -12,46% 1,43% 17,52% 12,31% 12,52% 7,27%
2000 -11,17% -5,68% -19,97% -20,13% 16,82% 14,56% 11,97% 9,44%
Source: Bloomberg Barclays Indices; Citigroup Indices; Classis Capital
EUR HY: Bloomberg Barclays Pan-European High Yield Total Return Index
US HY: Citigroup's High Yield Composite Index
EUR Govt.Bond TR: Bloomberg Barclays Germany Govt 7 to 10 Year TR
Total Return (TR) TR spread over Govt. Bond YLD Spread over 10yr Govt. BondPromised Yield

-40.00%-30.00%-20.00%-10.00%0.00%10.00%20.00%30.00%40.00%50.00%60.00%70.00%80.00%90.00%100.00%
2018201720162015201420132012201120102009200820072006200520042003200220012000
Total Return EUR HY and US HY
EUR HY US HY
European and US HY Bond Market Return
Source: Bloomberg, Classis Capital
Source: Bloomberg, Classis Capital
- 25 50 75
100 125 150 175 200 225 250 275 300 325 350 375 400
2001 2002 2003 2004 2005 2006 2007 2008 2009 2010 2011 2012 2013 2014 2015 2016 2017 2018
Cumulative Return European & US HY Bond Market (2001 -
2017)
EUR HY US HY

Source: Bank of America Merrill Lynch
2005 – 2018
U.S. & European High-Yield Bond Market:
CCC Rated New Issuance (%)
19.3%19.2%
37.4%
21.7%
8.0%
15.3%
11.6%
17.4%
21.3%
16.7%
11.6%10.7%
15.3%13.1%
15.7%17.2%
15.8%
17.3%
11.1%
18.4%
26.4%
15.7%
29.8%
18.1%
3.0%
0.0%
11.5%
3.8%
6.8%
11.0%
15.3%
5.1% 5.2%
10.0%
12.8%
22.6%
10.3%
12.7%
8.6%
12.2%
7.4%
1.6%
26.0%
26.7%
0%
10%
20%
30%
40%
2005
2006
2007
2008
2009
2010
2011
2012
2013
2014
2015
2016
2017
1Q
17
2Q
17
3Q
17
4Q
17
2018
1Q
18
2Q
18
3Q
18
4Q
18
New
Iss
ua
nce
Ra
ted
CC
C (
%)
U.S. Europe

Some Concerns About the Benign
Credit Cycle

U.S. Corporate Leverage Surges to Almost $10 Trillion
Sources: SIFMA and NYU Salomon Center.
Outstanding Corporate Bonds, by Rating ($tn)
$4.25tn
$7.48tn
$1.08tn
$1.67tn
0
1
2
3
4
5
6
7
8
9
10
1980 1982 1984 1986 1988 1990 1992 1994 1996 1998 2000 2002 2004 2006 2008 2010 2012 2014 2016 3Q18
Investment Grade High Yield Total
(2007)(2007)
$5.33tn
$9.16tn

U.S. Non-financial Corporate Debt (Credit Market Instruments) to
GDP: Comparison to 4-Quarter Moving Average Default Rate
0%
2%
4%
6%
8%
10%
12%
14%
16%
37%
38%
39%
40%
41%
42%
43%
44%
45%
46%
47%
Jan
-87
Jan
-88
Jan
-89
Jan
-90
Jan
-91
Jan
-92
Jan
-93
Jan
-94
Jan
-95
Jan
-96
Jan
-97
Jan
-98
Jan
-99
Jan
-00
Jan
-01
Jan
-02
Jan
-03
Jan
-04
Jan
-05
Jan
-06
Jan
-07
Jan
-08
Jan
-09
Jan
-10
Jan
-11
Jan
-12
Jan
-13
Jan
-14
Jan
-15
Jan
-16
Jan
-17
Jan
-18
% NFCD to GDP (Quarterly) 4-Quarter Moving Average Default Rate
January 1, 1987 – June 30, 2018
Sources: FRED, Federal Reserve Bank of St. Louis and Altman/Kuehne High-Yield Default Rate data.

Global Sectoral Indebtedness
Sources: Chart from Independent UK using IIF, BIS, IMF and Haver data.
$22 T;
64%$19 T;
58% $14 T;
53%
$15 T;
42%
$42 T;
77%$33 T;
58%
$53 T;
86%
$34 T;
57%
$68 T;
92% $63 T;
87%$58 T;
80%
$44 T;
59%
0
10
20
30
40
50
60
70
80
Non-financial
Corporates
Government Financial sector Household
1997 2007 2017
$ Trillion; % GDP; end of each Q3
Year% of
GDP
Total $
Amt.
($ T)
1997 217% 70
2007 278% 162
2017 318% 233

Comparative Health of High-Yield
Firms (2007 vs. 2017)

Comparing Financial Strength of High-Yield Bond
Issuers in 2007& 2012/2014/2017
Year
Average Z-Score/
(BRE)*
Median Z-Score/
(BRE)*
Average Z”-Score/
(BRE)*
Median Z”-Score/
(BRE)*
2007 1.95 (B+) 1.84 (B+) 4.68 (B+) 4.82 (B+)
2012 1.76 (B) 1.73 (B) 4.54 (B) 4.63 (B)
2014 2.03 (B+) 1.85 (B+) 4.66 (B+) 4.74 (B+)
2017 2.08 (B+) 1.98 (B+) 5.08 (BB-) 5.09 (BB-)
*Bond Rating Equivalent
Source: Authors’ calculations, data from Altman and Hotchkiss (2006) and S&P Global Market Intelligence’s S&P Capital
IQ platform/Compustat database.
Number of Firms
Z-Score Z”-Score
2007 294 378
2012 396 486
2014 577 741
2017 529 583

Major Risks Going Forward
Global Economic Performance – Primarily U.S., China and Europe: Impact on
Default Rates, Credit Availability and Quality (No Current Major Concern)
Falling Oil Prices (No Current Major Concern)
Global Debt Excess and Increasing Interest Rates
High-Yield Fundamentals Still Fairly Weak
Contagion Between Markets – Risky Debt and Equity
Interest Rates and Inflation – Reduced Importance of the Search-for-Yield
LBO, Covenant-Lite and CCC New Issuance
Sovereign Debt Crisis – Asia (1997), Europe (2009-13), Emerging Markets?
Uncertainties (non-quantifiable) – e.g. Political, Trade, Other

PwC European BankingTransformation andM&A Conference
This publication has been prepared for general guidance on matters of interest only, and does not constitute
professional advice. You should not act upon the information contained in this publication without obtaining
specific professional advice. No representation or warranty (express or implied) is given as to the accuracy or
completeness of the information contained in this publication, and, to the extent permitted by law, PwC does
not accept or assume any liability, responsibility or duty of care for any consequences of you or anyone else
acting, or refraining to act, in reliance on the information contained in this publication or for any decision based
on it.
© 2019 PwC. All rights reserved. “PwC‘ refers to the PwC network and/or one or more of its member firms,
each of which is a separate legal entity. Please see www.pwc.com/structure for further details.

PwC European BankingTransformation andM&A Conference
Transforming the market, creating value
27 March 2019

Challenger Banks in Italy
PwC European Banking Transformation andM&A Conference
27 March 2019

New digital path of banks in Italy:
what are the prospective
opportunities?
Pier Paolo Masenza
Financial Services Leader
PwC Partner
Panel Members
Guido Lombardo
Chief Investment Officer
Credito Fondiario
Michele Antognoli
Head of International Markets
and Development,
BFF Group
CEO of BFF Finance Iberia
Emanuele Egidio
DDV Financial Services
PwC Associate Partner

PwCPwC
New Initiatives in the Italian market
Small and medium enterprises
Distressed assets: NPL and UtP
Working capital financing
Focus on collaboration with new innovative channels: Fintech
NPL and UTP markets are limited in terms of volumes and number of transactions
Supply chain financing throughfactoring
01 02 03
Italian Banking and Financial system is undergoing through
transition process
Specialisation is the key competitive factor with focus on servicing niche segments and
innovative digital operating model
Rise of specialty situations challenger banking model

PwCPwC
Main features of a specialty finance challenger bank
“Challenger banks” identify a new form of banking players that pursue differentiating strategies with respect to high-street
banks in terms of product/customer specialization and technological innovation
Core elements
Higher profitability
based on lower cost/income
structures and better returns on absorbed regulatory
capital
Zero legacy with traditional banking system
Key Value Levers
Option to use new financing facilities to
leverage on special lending
Capability to invest in highly – specialized
professionals by sector of interest
Availability of verticalcompetence centers
(e.g. restructuring officers)
Focused on high ROE
Built on low Cost/Income ratio
Tailor-made operating model based on
sector of interest
Focused on nichesegments
Mostly based on Digital Technology
Challenger Bank is:
1
2
3
4
523% 4%
ROE* +19pp
23bps 72bps
Traditional banks
CoR* -49bps
Specialty finance challenger banks
Traditional banks
* Data as of 2018
Specialty finance challenger banks

PwCPwC
Thank you
Q&A

PwC European BankingTransformation andM&A Conference
This publication has been prepared for general guidance on matters of interest only, and does not constitute
professional advice. You should not act upon the information contained in this publication without obtaining
specific professional advice. No representation or warranty (express or implied) is given as to the accuracy or
completeness of the information contained in this publication, and, to the extent permitted by law, PwC does
not accept or assume any liability, responsibility or duty of care for any consequences of you or anyone else
acting, or refraining to act, in reliance on the information contained in this publication or for any decision based
on it.
© 2019 PwC. All rights reserved. “PwC‘ refers to the PwC network and/or one or more of its member firms,
each of which is a separate legal entity. Please see www.pwc.com/structure for further details.

PwC European BankingTransformation andM&A Conference
Transforming the market, creating value
27 March 2019

Doing deals in China and India – Opportunities in the $1.8 trillion stressed assets marketPwC European Banking Transformation and M&A Conference
27 March 2019

Doing deals in China and India –
Opportunities in the $1.8 trillion
stressed assets market
Richard Thompson
Conference Chairman
Panel members
Ted Osborn
Partner
PwC China
Sanjeev Krishan
Partner
PwC India
James Dilley
Director
PwC China
Mahender Khandelwal
Partner
PwC India
Simin Varghese
Senior Manager
PwC Deals

PwCPwC
Creating opportunities for investors
China: a huge pool of NPLs
219 302
487
516
400
655
Dec 2016 Dec 2018
Bank – stressed loans
Bank - NPLs
AMC distressed debt
US$ 1.1 trillion
US$ 1.5 trillion
Source: PwC estimate, analysis of public information

PwC
Features of a typical Chinese NPL portfolio
China: Portfolio characteristics
Buyers have the option to “shape” portfolios
All commercial loans
Mostly to private SMEs
~70% of credits in portfolio backed by real property
Recoveries primarily from sale of collateral or loan
Very few DPOs or restructuring

PwC
China: a flow of NPL trades, pace picking up2019 expected to be a record year for NPL disposals
Closed NPL trades (2015-18) 2019 – PwC estimate
2 to 5 new entrants to close first
NPL deal
Leading foreign funds targeting 2
– 4 portfolio trades in 2019
~US$ 1.5 billion of foreign investor
capital invested
Differentiation of investor
strategies
Oaktree 6 portfolios
Lone Star 5 portfolios
Goldman Sachs 5 portfolios
PAG 4 portfolios
Bain Credit 3 portfolios
CarVal 2 portfolios
Blackstone 1 portfolio
LVF Capital 1 portfolio

PwCPwC
Dec 2015 Dec 2016 Dec 2017 Sep 2018
Public Sector Banks Private Banks
US$ 65bn
US$ 144bn
Public sector banks hold about 85% of this stock
India: large stressed asset stock
US$ 106bn
US$ 128bn $125bn
Public Sector Banks
$19bn
Private Sector Banks

PwC
Deal activity
Distressed M&A on the rise
• Risen to ~ US$ 15bn
• 10-12% of total M&A in value
• 2-3% of total M&A in volume
Steel sector in the spotlight
• Through 3 acquisitions, ~US$ 8bn in
assets have changed hands since
2017
Other distressed sectors
• Industrial products & services
• Telecommunications
• Medical industries
• Industrials
• Financial services8
2
1
7
7
7
4
3
2
1
1
1
Bhushan Steel
Essar Steel
Lanco Infratech
Bhushan Power & Steel
Alok Industries
ABG Shipyard
Amtek Auto
Electrosteel steels Ltd.
Monnet Ispat And Energy
Era Infra Engineering
Jaypee Infratech
Jyoti Structures
Ongoing Successful
Of the initial ‘Dirty Dozen’ cases, comprising USD 45bn in debt,
3 have already been successfully resolved

PwCPwC
Opportunity to investP
art
icip
ati
on
Ro
ute
s
As a Direct Bidder
for NCLT Assets
Investing in pre-
NCLT Turnaround
Cases
Through the ARC
Route
By Capitalizing
Banks / NBFC with
Stressed Asset
Exposures
1
2
3
4
Direct
Indirect
NCLT
Outside
NCLT
Equity
Structured credit
Partner needs
• Bidding partner
• Indian PE
• Indian structured credit player
• ARC JV partner
• Bank
• NBFC

PwC European BankingTransformation andM&A Conference
This publication has been prepared for general guidance on matters of interest only, and does not constitute
professional advice. You should not act upon the information contained in this publication without obtaining
specific professional advice. No representation or warranty (express or implied) is given as to the accuracy or
completeness of the information contained in this publication, and, to the extent permitted by law, PwC does
not accept or assume any liability, responsibility or duty of care for any consequences of you or anyone else
acting, or refraining to act, in reliance on the information contained in this publication or for any decision based
on it.
© 2019 PwC. All rights reserved. “PwC‘ refers to the PwC network and/or one or more of its member firms,
each of which is a separate legal entity. Please see www.pwc.com/structure for further details.