Embed Size (px)
Citation preview

PVSim and Solar Energy System Performance Modeling
by Ben Bourne2009

2
SunPower Corporation develops and maintains a custom photovoltaic (PV) simulation tool called SunPower®
PVSim for producing estimates of PV system power production (kW), energy (kWh) and yield (kWh/kWp).
Although there are sophisticated “off-the-shelf” PV simulation tools available, SunPower has chosen to invest
in developing its own custom tool to provide maximum flexibility to meet the changing modeling needs of the
company. In particular, in-house development enables us to quickly adapt the model to accurately reflect new
module and mounting products and allows us to make use of measured performance data from over 450 MW
on 600+ systems for model-level and system-level validation. The purpose of this summary is to give a brief
description of the PVSim tool and to demonstrate SunPower’s validation practices.
EXECUTIVE SUMMARY
E X E C U T I V E S U M M A R Y

3S E C T I O N 1 S E C T I O N 1
INTRODUCTION
Figure 1: Web-based PVSim graphical interface (UI).
S E C T I O N 1
The PVSim model calculates the power generated by a PV system by passing system-specific location and design
information from a user interface (Figure 1) through a set of models in the computational engine. The diagram in
Figure 2 illustrates the flow of information into and out of PVSim.
3INTRODUCT ION

4S E C T I O N 1 INTRODUCT ION
S E C T I O N 1
Figure 2: PVSim Data Flow diagram. User inputs are passed to the tool’s primary models through the PVSim UI. The tool calculates the position of the module and sun, the amount of sun on the module surface, the cell operating temperature, the DC module and inverter power, and system AC power and energy.
PVSim Engine
Balance of System Losses
External Loss FactorsPVSim
Web UI
PV Model :C ell T em p eratu re
En erg y C o n versio n
In verter
Site Location
Weather Data
System Design
Geometry :So lar Po sitio n
Mo d u le O rien tatio nIn cid en ce A n g le
Sh ad in g
Irradiance :B eam /D N I
D iffu sePlan e - o f-A rray
System Power & Energy Yield
1. Perez R., Ineichen P., Maxwell E., Seals R. and Zelenka A. (1992). Dynamic global to direct irradiance conversion models. ASHRAE Transactions Vol. 98, Part 1, 3578, pp 354-369.

5INTRODUCT ION S E C T I O N 1
PVSim has benefitted from over 20 years of development and system-level validation data from over 650 installed SunPower systems worldwide. PVSim is subject to periodic revision based on regular comparison of PVSim projections to the measured performance of existing plants. This internal validation process is called “Benchmarking”:
• In September 2007, SunPower® PVGrid v10 (PVSim predecessor desktop application) incorporated validated geometry and solar position models for both fixed-tilt and tracking systems. This validation included SunPower’s backtracking algorithm for its tracking products.
• In April 2008, SunPower’s Performance team released PVGrid v11, which incorporated the Richard Perez models for calculating beam irradiance and diffuse irradiance on a tilted plane (plane-of-the-array, or POA). This model implementation was accompanied by a complete model and system-level validation.
• In December 2008, PVGrid v11.1 was released with updated beam and diffuse angle-of-incidence modifier functions based on analytical evaluation of the anisotropic sky dome with respect to the tilted plane and the glass-laminate optical transmission properties.
• In April 2009, SunPower released PVSim 1.0. This new web-based application borrowed all of the models from PVGrid v11.1 except for the PV performance model. The existing single-diode power conversion circuit model was replaced with the empirical performance model developed by Sandia National Labs . The Sandia inverter model was also implemented in this new simulation tool, which allows PVSim to dynamically model the efficiency of any inverter tested by the California Energy Commission (CEC).
• In May 2010, SunPower released PVSim 1.1. This version of PVSim did not include any major model updates. However, it allows users the ability to run sub-hourly simulations, generates an itemized loss table as a standard output, and marks the transition from a backward-looking to a forward-looking module flash rating convention to conform to SunPower’s new -3%/+5% tolerance guarantee.
Beam irradiance is that portion of irradiance that comes directly from the sun’s disc to the module surface. Plane-of-Array irradiance is the total irradiance available to the module, including the portion of the beam irradiance normal to the module surface and the available diffuse and reflected light (Figure 3). The angle of incidence modifier functions determine how much of this available light is transmitted through the outer glass laminate of the module (i.e. how much light is available on the surface of the cell).
S E C T I O N 1
Ineichen P. and R. Perez (2002): A new airmass independent formulation for the Linke turbidity coefficient. Solar Energy 73, 151-157
Perez R., Ineichen P.,Moore K., Kmiecik M., Chain C., George R., Vignola F. (2002). A new operational model for satellite derived irradiances: description and validation. Solar Energy 73, N° 5, pp 307-317.
Ineichen P., (2007). Comparison and validation of three global-to-beam irradiance models against ground measurements (Center of Energy, University of Geneva). Accepted for publication in Solar Energy, July 2007.
2. Perez R, Seals R, Ineichen P, Menicucci D. (1987). A new simplified version of the Perez diffuse irradiance model for tilted surfaces. Solar Energy, 39(3):221–31.
3. King D.L., Boyson W.E., Kratochvil J.A., (2004). Photovoltaic Array Performance Model. SANDIA REPORT (SAND2004-3535). Unlimited Release.
4. King D.L., Gonzalez S., Galbraith G.M., and Boyson W.E. (2007). Performance Model for Grid-Connected Photovoltaic Inverters . SANDIA REPORT (SAND2007- 5036). Unlimited Release.

6S E C T I O N 1 INTRODUT ION
Each of the model changes to date (Geometry, Beam and POA Irradiance models, beam and diffuse modifier functions, and the PV performance model) was rigorously validated prior to release. The Geometry model was validated against three 3rd-party solar position models, including NREL’s SolPos , solar position calculations, against Richard Perez of the State University of New York in Albany , and against SunPower’s own tracker controller position calculator. The Beam irradiance model was validated against direct beam irradiance data measured by Sandia National Laboratories , and the POA irradiance model was validated against three cases: 2-axis tracking plane-of-array data from Albuquerque, NM (from Sandia National Labs), measured POA data from three T0 tracking sites in Bavaria, Germany , and measured POA data from several SunPower PowerGuard sites (flat). Examples of validation results may be found in the Appendix of this document.
After validating each of these sub-model changes, the PVSim tool was Benchmarked against measured system yields. The results of the Benchmarking for PVSim v1.1 are shown in Figure 4.
Figure 3: Diagram of beam, diffuse, and reflected irradiance. Beam irradiance is light that is unobstructed from the disk of the sun in the sky to the module surface. Diffuse irradiance is scattered light from the rest of the sky dome. Reflected light varies by ground reflectance.
5. SolPos was developed by the National Renewable Energy Laboratory (NREL) and calculates the apparent solar position and intensity (theoretical maximum solar energy) based on the date, time, and location on Earth. http://rredc.nrel.gov/solar/codes_algs/solpos/
6. Richard Perez is a Research Professor and Senior Research Associate at the SUNY Atmospheric Sciences Research Center (ASRC) in Albany, New York. He holds a Ph.D. in Atmospheric Science from SUNY Albany and a D.E.A. in External Geophysics from the University of Paris, France. He has published over 120 articles and reports in the fields of solar radiation, renewable energy applications and daylighting. He has been an associate Editor of the Solar Energy Journal since 1995, is a member of the Northeast, American & International Solar Energy Societies (NESEA, ASES & ISES), and is technical chair of two ASES annual conferences. In addition, he is a US expert and work group leader for the International Energy Agency (IEA).
7. Bill Boyson of the Sandia National Laboratories provided measured irradiance data from Albuquerque, NM for the year 2006 via electronic correspondence on January 11, 2008.
8. POA data in Germany measured by instruments calibrated by the Fraunhofer Institute and collected as part of the regular on-site monitoring for the Bavaria Solar 1 Project (owner: Deutsche Structured Finance).
S E C T I O N 1

7
- 5%
- 4%
- 3%
- 2%
- 1%
0%
1%
2%
3%
4%
5%PVSim System -Level Accuracy for Annual Simulations
System Accuracy
Average Accuracy
Figure 4: PVSim accuracy of annual yield estimates, based on the production of 17 installed systems across the suite of standard SunPower mounting systems (PowerGuard, T10, T0 Tracker and T20 Tracker) and climate zones. A benchmarking result less than 0% indicates that the PVSim yield estimate was lower than actual system energy production (“underprediction”), while a result greater than 0% indicates that the PVSim yield estimate was greater than actual system energy production (“overprediction”). PVSim 1.1, which represents our most accurate and reliable estimates of system performance at this time, predicts actual system performance on average to within 1.25%.
Simulations of energy yield from PVSim represent SunPower’s best approach to system energy performance projections at the time the projection was made. We strive to make the tool as accurate as possible, modifying the algorithms, component specification information and standard assumptions when new information becomes available; these changes to the model will inevitably lead to small changes in PVSim output projections. Therefore, PVSim should be viewed by users as an evolving tool that reflects our best knowledge of the time, has been validated against measured system performance, and whose projections represent the most accurate possible estimates of energy production.
INTRODUCT ION S E C T I O N 1
S E C T I O N 1

8
EXAMPLE VALIDATION RESULTS
Geometry ModelsSunPower validated its geometry models against two sources of independently-developed and implemented geometry algorithms: SolPos and Richard Perez. The model was also validated against our own tracker controller position calculator. The charts below show the results of the validation against Richard Perez’ model, and are representative of the same level of agreement found with the SolPos models.
S E C T I O N 2
APPENDIX
Figure A: Calculated Solar Azimuth Angles in Olivenza, Spain on January 17 and July 17. PVSim azimuth angles are compared to angles calculated by Richard Perez. The angles computed by the two models overlap exactly, so only one curve is visible.
Figure B: Calculated Solar Altitude Angles in Olivenza, Spain on January 17 and July 17. PVSim altitude angles are compared to angles calculated by Richard Perez.
APPENDIX S E C T I O N 2 8

9
S E C T I O N 2
Figure C: Tracker rotation angles for a T20 tracker in Olivenza, Spain on January 17 and July 17. PVSim rotation angles are compared to angles calculated by Richard Perez. These charts show four separate calculations: two by Perez and two by PVSim. The charts show the perfect alignment of the Perez and PVSim results for two cases. The first case is an ideal one in which a tracker is allowed to rotate to +/-90 degrees to follow the sun (this is represented by the lines that continue in a straight path all the way across the chart). Such tracking in a real-world application would lead to significant shading of modules in adjacent rows; to avoid this, SunPower employs a technique called Backtracking, which prevents shading of adjacent rows by limiting rotation in the early morning and afternoon to avoid shading of modules. This case is represented by the lines that curve toward the x- axis in the charts.
Figure D: Tracker rotation angles for a T20 tracker in Olivenza, Spain on October 17th. Here, angles calculated by PVSim are compared to angles calculated by SunPower’s tracker controller. The exact agreement between these angles illustrates SunPower’s ability to exactly model the positioning of our products. In this case, a 40° maximum rotation angle was a constraint.
APPENDIX S E C T I O N 2 9

10
S E C T I O N 2
Figure E: Angle of incidence between direct beam irradiance on the module surface of a T20 tracking system oriented at several azimuth angles. Once again, we see perfect agreement between PVSim and Richard Perez’ models.
Figure F: Illustrations of shading on a T20 system. These images were created using PVSyst and Google Sketch-Up, and used as visualization aids for geometry model and shading validation.
APPENDIX S E C T I O N 2 10

11
S E C T I O N 2
1. Bill Boyson of the Sandia National Laboratories provided measured irradiance data from Albuquerque, NM for the year 2006 via electronic correspondence on January 11, 2008. Perez (2002), cited previously
Irradiance Models Changes that were made to the irradiance models in the v11 release were rigorously validated using irradiance data collected at the Sandia National Laboratories and at SunPower’s own installations. The Sandia National Laboratories data was of critical importance to our Beam Irradiance model validation because it provided us with high-accuracy beam irradiance data from an Eppley Normal Incidence Pyrheliometer (NIP). Figure G illustrates the improvement to PVSim’s beam model calculations with the implementation of the Perez (2002) irradiance model.
Note, in Figure G and similar figures throughout this white paper, the straight 45 degree line represents the ideal data pattern; the degrees of scatter (root mean square error) and symmetry (mean bias error) of data around this line are the measures of quality. The Perez model incorporates two parameters in addition to the parameters used by earlier beam irradiance models such as the one in PVSim v10: Linke Turbidity and the Variability Index. Although the Perez beam model implementation did not improve overall scatter or bias in our beam estimation, it did improve the ability of PVSim to estimate beam irradiance at very high irradiance levels, which are important to the POA calculation and estimation of tracking system yield.
Figure G. Measured vs. PVSim-calculated beam irradiance before and after implementation of Perez model for Albuquerque, NM, January 1 – December 31, 2006 as measured by the Sandia National Laboratories. For the beam component, MBE and RMSE did not change appreciably, but the fit at high irradiances did improve.
APPENDIX S E C T I O N 2 11
12
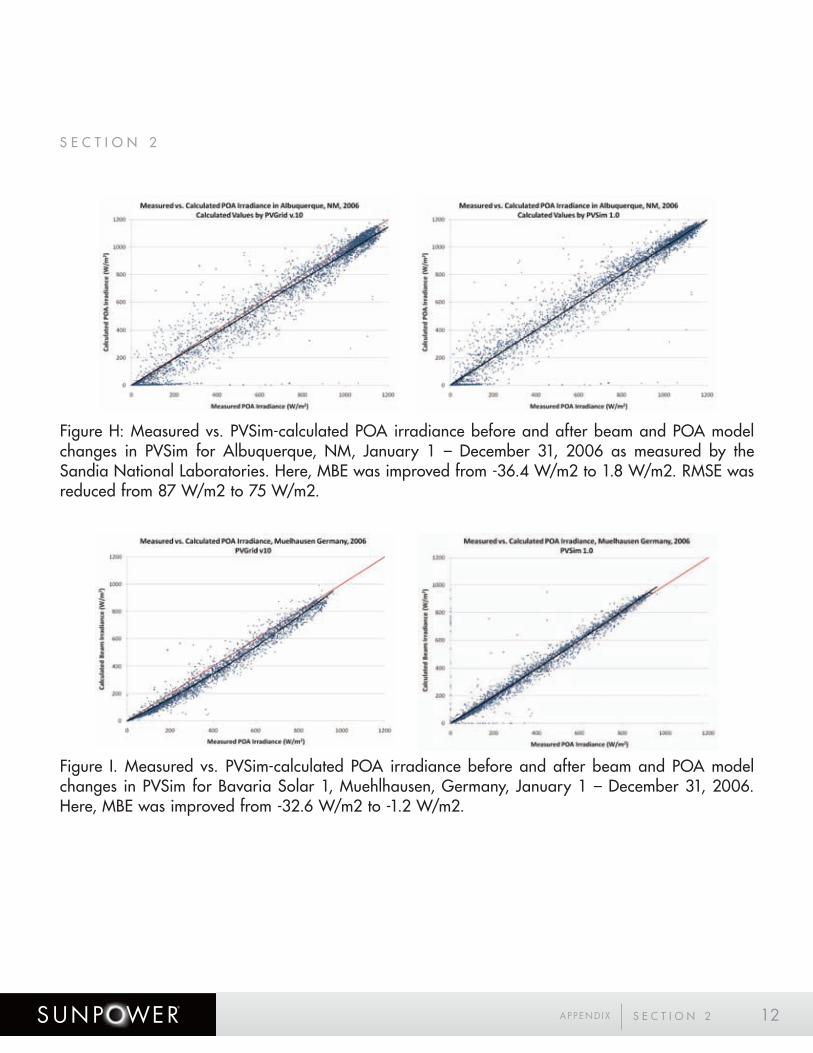
Figure H: Measured vs. PVSim-calculated POA irradiance before and after beam and POA model changes in PVSim for Albuquerque, NM, January 1 – December 31, 2006 as measured by the Sandia National Laboratories. Here, MBE was improved from -36.4 W/m2 to 1.8 W/m2. RMSE was reduced from 87 W/m2 to 75 W/m2.
Figure I. Measured vs. PVSim-calculated POA irradiance before and after beam and POA model changes in PVSim for Bavaria Solar 1, Muehlhausen, Germany, January 1 – December 31, 2006. Here, MBE was improved from -32.6 W/m2 to -1.2 W/m2.
APPENDIX S E C T I O N 2 12
S E C T I O N 2

13
SUNPOWER CORPORATION3939 North 1st StreetSan Jose, CA 95134 1.800.SUNPOWER (1.800.786.7693)sunpowercorp.com
SUNPOWER and the SUNPOWER logo are trademarks or registered trademarks of SunPower Corporation.© February 2011 SunPower Corporation. All rights reserved.

![Modeling, Simulation, and Implementation of a Solar ... · Modeling, Simulation, and Implementation of a Solar Thermoelectric Energy Harvesting System 297 absence [2]. Since solar](https://img.dokumen.tips/doc/110x75/5ed762691b0ef37b614455e1/modeling-simulation-and-implementation-of-a-solar-modeling-simulation-and.jpg)
![Modeling Of A Solar Pond For Different Insulation ... · Sakhrieh and Al-Salaymeh [3] studied both experimental and numerical parts of solar pond performance under Jordanian climate](https://img.dokumen.tips/doc/110x75/6073569726559227a83396ae/modeling-of-a-solar-pond-for-different-insulation-sakhrieh-and-al-salaymeh-3.jpg)