Embed Size (px)
Citation preview

Draft
1 Copyright © 2010 by ASME
Proceedings of ASME-PVP 2010: 2010 ASME Pressure Vessels and Piping Division Conference
July 18-22, 2010, Bellevue, WA, USA
PVP2010-25333
Analysis of JNES Seismic Tests on Degraded Piping
DISCLAIMER NOTICE - The findings and opinions expressed in this paper are those of the authors, and do not necessarily reflect the views of the U.S. Nuclear
Regulatory Commission or Brookhaven National Laboratory.
ABSTRACT Nuclear power plant safety under seismic conditions is an important consideration. The piping systems may have some defects caused by fatigue, stress corrosion cracking, etc., in aged plants. These cracks not only affect the seismic response, but may break causing loss of coolant. Therefore, an evaluation method needs to be developed to predict crack growth behavior under seismic excitation. This paper describes efforts conducted to analyze and better understand a series of degraded pipe tests under seismic loading that was conducted by Japan Nuclear Energy Safety Organization (JNES). A special “cracked-pipe element” (CPE) concept, where the element represented the global moment-rotation response due to the crack, was developed. This approach was developed to simplify the dynamic finite element analysis. In this paper, model validation was conducted by comparisons with a series of pipe tests with circumferential through-wall and surface cracks under different excitation conditions. These analyses showed that reasonably accurate predictions could be made using the ABAQUS connector element to model the complete transition of a circumferential surface crack to a through-wall crack under cyclic dynamic loading. The JNES combined-component test was analyzed in detail. The combined-component test had three crack locations and multiple applied simulated-seismic block loadings. Comparisons were also made between the ABAQUS FE analyses results to the measured displacements in the experiment. Good agreement was obtained and it was
confirmed that the simplified modeling is applicable to a seismic analysis for a cracked pipe on the basis of fracture mechanics. Pipe system leakage did occur in the JNES tests. The analysis predictions using the CPE approach did not predict leakage, suggesting that cyclic ductile tearing with large-scale plasticity was not the crack growth mode for the acceleration excitations considered here. Hence, the leakage was caused by low-cycle fatigue. The procedure used to make predictions of low-cycle fatigue crack growth was based on the Dowling ∆J procedure, which is an extension of linear-elastic fatigue crack growth methodology into the nonlinear plasticity regime. The predicted moments from the CPE approach were used using a cycle-by-cycle crack growth procedure. The predictions compare quite well with the experimental measurements. INTRODUCTION During 2004 to 2006, the Japan Nuclear Energy Safety Organization (JNES) conducted a Degraded Piping and Components Test Program to investigate the behavior of typical Nuclear Power Plant (NPP) piping systems under large seismic loads. The objectives of this multi-year program were to: (1) obtain a better understanding of the vibration characteristics and seismic strength of degraded structures and components having cracks due to aging, (2) ensure a margin of seismic design safety by considering age-related cracking, and (3) verify the JSME Rules on Fitness-for-Service for NPPs in Japan. This program included shaker-table testing of four 1/3-scale models of a primary loop recirculation piping system typical in BWRs in
T. Zhang, F. W. Brust, G. Wilkowski and D. J. Shim
Engineering Mechanics Corporation of Columbus 3518 Riverside Dr. - Suite 202 Columbus, OH 43221, USA
J. Nie and C. Hofmayer Brookhaven National Laboratory Upton, New York 11973-5000
Syed Ali US Nuclear Regular Commission
Office of Nuclear Regulatory Research Division of Engineering Rockville, MD 20852
Draft
2 Copyright © 2010 by ASME
Japan, in addition to quasi-static displacement testing of various component tests and 1/2.5 scale core shroud model tests. The shaker table tests of the 1/3-scale piping system models are also referred to as combined-component tests, to be compatible with various JNES documents[1,2,3,4]. It is difficult to analyze such a piping system under seismic loading using the conventional numerical analysis procedure based on fracture mechanics because this approach requires iterative re-meshing of the analysis model during crack growth. Moreover, it is also difficult to evaluate the seismic response of cracked pipes, because the degradation behavior is complicated compared with non-degrading behavior. Thus, predicting local crack growth and the resulting seismic responses of cracked pipes in a straightforward manner is quite difficult, requiring large meshes and excessive computer resources. A simplified modeling technique using multiple springs, sliders, break-away elements and pin elements in ANSYS was developed by Olson et al [5,6] circa 1990. This original approach seemed to work reasonably well but was rather cumbersome and time consuming to implement. In this paper, a new type of element within ABAQUS [7], a connector element, was used to simulate the elastic, plastic, and post maximum load (damage) behavior of a cracked pipe. At the crack location, a single connector element was used compared with the complicated arrangement of springs, sliders, dashpots, etc., used in [5]. Good agreement was obtained through the comparison between the numerical results to measured experimental data. It is confirmed that developed simplified modeling approach is applicable to a seismic analysis for a cracked pipe on the basis of fracture mechanics. CRACKED-PIPE-ELEMENT MODELING The “connector element” was used in this paper to simulate the crack behavior, i.e., the moment versus rotation-due-to-the-crack response at a node point where the crack is to be located. The “connector element” can be used to model complicated local behavior at a node point such as elastic behavior (linear and non-linear), plasticity, and damage (failure behavior until breakage occurs). In addition, this type of element can define admissible relative motion under crack closure conditions. This is used to simulate the closure of a crack when the crack faces come in contact under compressive loading, the pipe takes the compressive loads as if it was un-cracked. Finally, damage can be introduced which can model the crack growth behavior. Since it is a novel improvement, a thorough validation was necessary to understand the numerical behavior of the connector element before introducing it into the piping systems. In this validation effort, a series of FE analyses were conducted and the predicted results were compared with experimental measurements to thoroughly understand the elastic, plastic, and damage behavior of connector element. Validation examples were selected from past NRC/IPIRG (International Piping Integrity Research Group) programs [ 8 ]. This validation procedure included four cases with increasing complexity. Case (1) is a circumferential through-wall-cracked pipe test with straight pipe sections under quasi-static monotonic displacement controlled bending. This examined whether the loads and
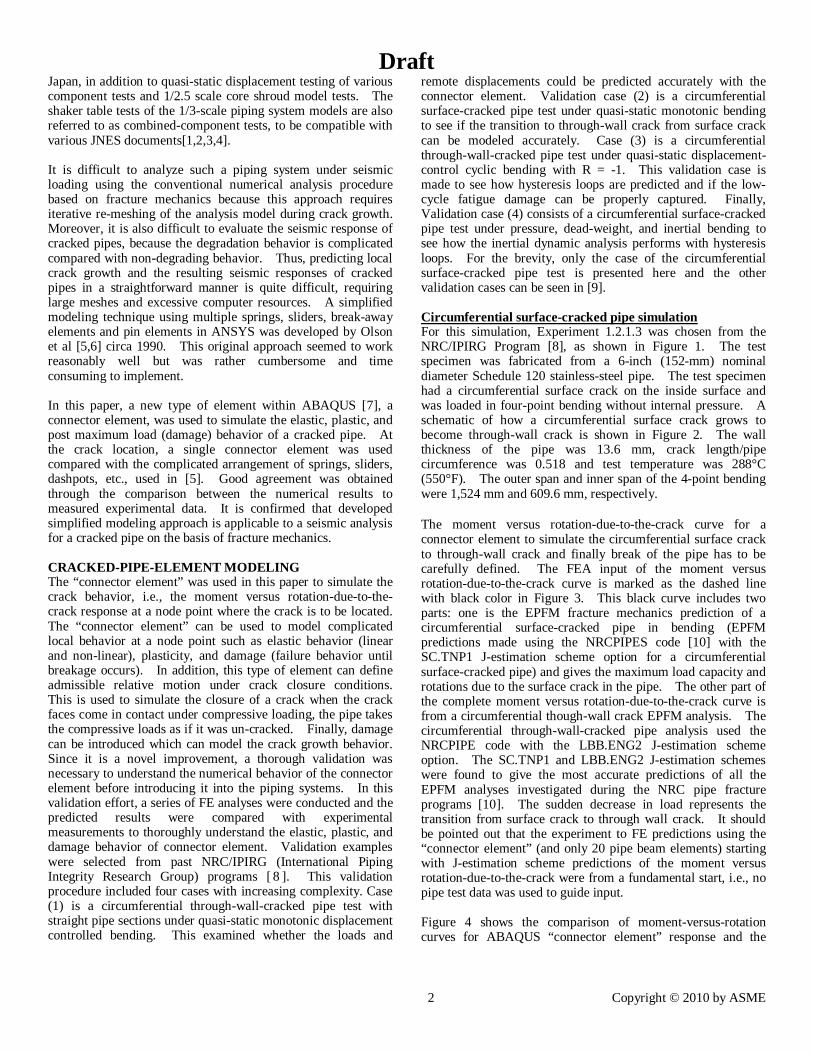
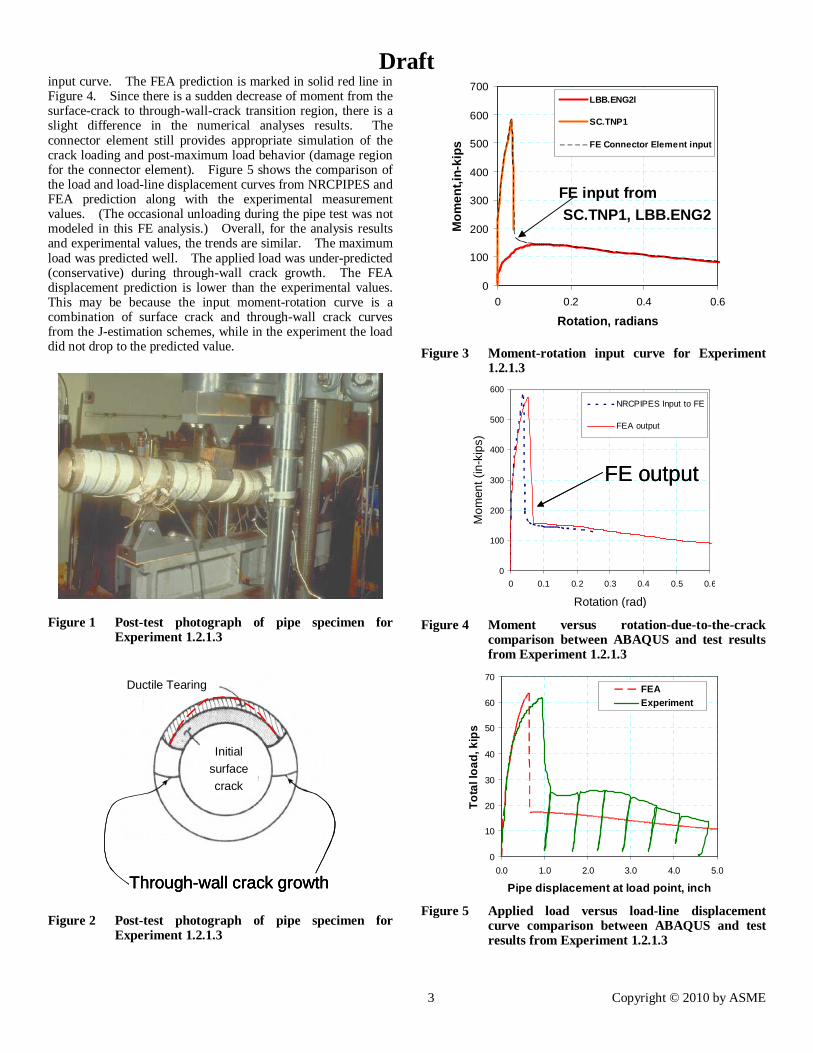
remote displacements could be predicted accurately with the connector element. Validation case (2) is a circumferential surface-cracked pipe test under quasi-static monotonic bending to see if the transition to through-wall crack from surface crack can be modeled accurately. Case (3) is a circumferential through-wall-cracked pipe test under quasi-static displacement-control cyclic bending with R = -1. This validation case is made to see how hysteresis loops are predicted and if the low-cycle fatigue damage can be properly captured. Finally, Validation case (4) consists of a circumferential surface-cracked pipe test under pressure, dead-weight, and inertial bending to see how the inertial dynamic analysis performs with hysteresis loops. For the brevity, only the case of the circumferential surface-cracked pipe test is presented here and the other validation cases can be seen in [9]. Circumferential surface-cracked pipe simulation For this simulation, Experiment 1.2.1.3 was chosen from the NRC/IPIRG Program [8], as shown in Figure 1. The test specimen was fabricated from a 6-inch (152-mm) nominal diameter Schedule 120 stainless-steel pipe. The test specimen had a circumferential surface crack on the inside surface and was loaded in four-point bending without internal pressure. A schematic of how a circumferential surface crack grows to become through-wall crack is shown in Figure 2. The wall thickness of the pipe was 13.6 mm, crack length/pipe circumference was 0.518 and test temperature was 288°C (550°F). The outer span and inner span of the 4-point bending were 1,524 mm and 609.6 mm, respectively. The moment versus rotation-due-to-the-crack curve for a connector element to simulate the circumferential surface crack to through-wall crack and finally break of the pipe has to be carefully defined. The FEA input of the moment versus rotation-due-to-the-crack curve is marked as the dashed line with black color in Figure 3. This black curve includes two parts: one is the EPFM fracture mechanics prediction of a circumferential surface-cracked pipe in bending (EPFM predictions made using the NRCPIPES code [10] with the SC.TNP1 J-estimation scheme option for a circumferential surface-cracked pipe) and gives the maximum load capacity and rotations due to the surface crack in the pipe. The other part of the complete moment versus rotation-due-to-the-crack curve is from a circumferential though-wall crack EPFM analysis. The circumferential through-wall-cracked pipe analysis used the NRCPIPE code with the LBB.ENG2 J-estimation scheme option. The SC.TNP1 and LBB.ENG2 J-estimation schemes were found to give the most accurate predictions of all the EPFM analyses investigated during the NRC pipe fracture programs [10]. The sudden decrease in load represents the transition from surface crack to through wall crack. It should be pointed out that the experiment to FE predictions using the “connector element” (and only 20 pipe beam elements) starting with J-estimation scheme predictions of the moment versus rotation-due-to-the-crack were from a fundamental start, i.e., no pipe test data was used to guide input. Figure 4 shows the comparison of moment-versus-rotation curves for ABAQUS “connector element” response and the
Draft
3 Copyright © 2010 by ASME
input curve. The FEA prediction is marked in solid red line in Figure 4. Since there is a sudden decrease of moment from the surface-crack to through-wall-crack transition region, there is a slight difference in the numerical analyses results. The connector element still provides appropriate simulation of the crack loading and post-maximum load behavior (damage region for the connector element). Figure 5 shows the comparison of the load and load-line displacement curves from NRCPIPES and FEA prediction along with the experimental measurement values. (The occasional unloading during the pipe test was not modeled in this FE analysis.) Overall, for the analysis results and experimental values, the trends are similar. The maximum load was predicted well. The applied load was under-predicted (conservative) during through-wall crack growth. The FEA displacement prediction is lower than the experimental values. This may be because the input moment-rotation curve is a combination of surface crack and through-wall crack curves from the J-estimation schemes, while in the experiment the load did not drop to the predicted value.
Figure 1 Post-test photograph of pipe specimen for Experiment 1.2.1.3
Through-wall crack growth
Initial surface crack
Ductile Tearing
Through-wall crack growthThrough-wall crack growth
Initial surface crack
Ductile Tearing
Figure 2 Post-test photograph of pipe specimen for Experiment 1.2.1.3
0
100
200
300
400
500
600
700
0 0.2 0.4 0.6
Rotation, radians
Mo
men
t,in
-kip
s
LBB.ENG2l
SC.TNP1
FE Connector Element input
FE input fromSC.TNP1, LBB.ENG2
0
100
200
300
400
500
600
700
0 0.2 0.4 0.6
Rotation, radians
Mo
men
t,in
-kip
s
LBB.ENG2l
SC.TNP1
FE Connector Element input
FE input fromSC.TNP1, LBB.ENG2
Figure 3 Moment-rotation input curve for Experiment 1.2.1.3
0
100
200
300
400
500
600
0 0.1 0.2 0.3 0.4 0.5 0.6
Rotation (rad)
Mom
ent (
in-k
ips)
NRCPIPES Input to FE
FEA output
FE output
0
100
200
300
400
500
600
0 0.1 0.2 0.3 0.4 0.5 0.6
Rotation (rad)
Mom
ent (
in-k
ips)
NRCPIPES Input to FE
FEA output
FE outputFE output
Figure 4 Moment versus rotation-due-to-the-crack comparison between ABAQUS and test results from Experiment 1.2.1.3
0
10
20
30
40
50
60
70
0.0 1.0 2.0 3.0 4.0 5.0
Pipe displacement at load point, inch
To
tal l
oad
, kip
s
FEAExperiment
Figure 5 Applied load versus load-line displacement curve comparison between ABAQUS and test results from Experiment 1.2.1.3

Draft
4 Copyright © 2010 by ASME
In summary, validation investigations lead to the conclusion that the connector element approach can reasonably simulate the crack response from elastic, plastic, and damage until pipe breakage. Numerical comparisons between FEA predictions and experimental measurements show, in general, a well-defined connector element can capture the static and dynamic behavior under monotonic and cyclic loading. Moreover, the connector element approach to represent a “cracked-pipe element” is extremely efficient (from both model development and computer) perspective, with reasonable accuracy. For the above simulation model, there are only about 20 beam/pipe elements plus one connector element, whereas full 3D simulations with sufficient mesh refinements for fracture analyses would require thousands elements per crack location. This approach to making multiple crack simulations and crack growth analyses during dynamic seismic loading is very time efficient, while a three-dimensional model including one crack is very time consuming. Multiple crack analyses (required here) would present an even greater challenge if it is not impossible. Additionally, a detailed 3D mesh refinement would require the crack to be grown and additional re-meshing requirements during the seismic loading, making the 3D FE analyses prohibitively expensive in computation time and labor hours. ANALYSIS OF JNES COMBINED PIPE SYSTEM TEST The JNES combined-component tests were a 1/3-scale model of a section of a BWR pipe main recirculation loop that was between the reactor pressure vessel and the recirculation pump. Figure 6 shows the 1/3-scale combined-component test system on the shaker table. Most of the pipe was TP316 stainless steel, but some of the branch pipe was ST410 carbon steel. The 1/3-scale size was selected to be compatible to the existing shaker table size. The first natural frequency of the 1/3 scale model was about 5 Hz, while the first natural frequency of the actual full-scale pipe was 4.1 to 9.8 Hz. Additional information on these tests is provided in References [1] and [4]. Displacement measurements were also made at several locations. These data are used later in this paper to validate the FE analyses. In the model, the nominal outer diameter of the main pipe in the 1/3-scaled PLR system is 216 mm (8.5 inch) and the thickness is 12.7 mm; the outer diameter of a branch pipe in the scaled PLR system is 114 mm and the thickness is 9 mm. The mesh and three crack locations are shown in Figure 7. The three cracks are located at a tee connection, a reducer, and an elbow. The crack orientations are shown in Figure 8 .
In order to study the growth of simulated cracks under seismic loading conditions, JNES conducted a series of experiments labeled FTP-1, FTP-2, FTP-3 and FTP-4. This study focused on the analysis of FTP-4 since this is the only test that led to a leak. The simulated seismic loading was generally up to the Japanese ~1.5*S2 level, and leakage occurred in one test (the final test of the series, FTP-4 during the 6th block of seismic loading). There are six consecutive acceleration-time histories applied to the base of the shaking table: CO-30 through CO-35 and the final case (CO-35) led to a through-wall crack and
leakage. Three of the important applied acceleration histories (CO-30, CO-33, and CO-35) are shown in Figure 9. It is seen that shaker table acceleration-time histories for CO-30 to CO-35 are almost identical. For a dynamic analysis, it is necessary to include a damping coefficient in simulations. For this study, the damping coefficient follows the Rayleigh damping model as the ASME N-1232.1 procedure. For this study of C0-30 to CO-35 series test, the calculation of the damping coefficients are α = 1.148 and β = 1.157E-04 for 2% damping As shown in previous section on the validations, in order to simulate the crack behavior, it is necessary to have a moment versus rotation-due-to-the-crack curve for each crack location. Therefore, the stress-strain curves of materials and proper fracture toughness (J-R curve) are necessary to calculate moment-rotation for the “cracked-pipe element”. Typical stress-strain curves for the pipe materials were supplied by JNES. However, no fracture toughness (J-R curve) or weld metal stress-strain curves were available. The variability of these properties was unknown, but some statistical data is available for probabilistic analyses being conducted for the NRC [ 11 ]. The moment versus rotation-due-to-the-crack curves for the flaws in the main pipe and branch pipe were obtained at room temperature in Figure 10 and 288°C (550°F) in Figure 11. These analyses will give insight into the crack response at both room temperature and high temperature. This is important since the margins might be different at actual BWR and PWR nuclear plant operating temperatures. Referring to Figure 6, there were three cracks in the JNES test piping system. Crack 1 is in the girth weld between the elbow and straight pipe region. Crack 2 is located at the reducer, and crack three is near the Tee junction in the smaller-diameter branch pipe. It turns out that Crack 2 began to leak during application of the final acceleration-time history (CO-35). From the J-tearing analysis discussed earlier concerning Figure 10, the moment-rotation due to crack curves were obtained. This moment-rotation curve was then input to the finite element model as ‘cracked-pipe element’ to model the response of the crack in a convenient albeit simple fashion. From the fracture mechanics analysis used to develop the cracked-pipe moment-rotation curve, the surface crack was predicted to initiate in the main pipe when the moment reaches a level of 0.181 MN-m However, when the load reaches 0.181 MN-m, and the crack begins to grow, the crack pipe response will show significant damage in the form of moment-rotation response. Interestingly, it will be seen that the moments produced at the crack locations from the acceleration-time histories (CO30 – CO35) have a maximum value of about 0.145 MN-m during the CO-35 spectra.

Draft
5 Copyright © 2010 by ASME
Figure 6 Illustration of JNES Pipe system (combined
component) test
Crack 1 (Elbow)
Crack 2 (Reducer)
Crack 3 (Branch)
Crack 1 (Elbow)
Crack 2 (Reducer)
Crack 3 (Branch)
Figure 7 Mesh and crack locations of the scaled PLR
system
Figure 8 Location and directions of simulated cracking of
Type A
Figure 9 Applied acceleration histories for PLR system in
Test FTP-4 (Load blocks CO-30, CO-33, and CO-35)
Room TemperatureMain Pipe System
Room TemperatureMain Pipe System
(a)
Room TemperatureBranch Pipe SystemRoom TemperatureBranch Pipe System
(b)
Figure 10 Moment versus rotation-due-to-the-crack curves for Type A flaws in the main pipe and branch pipe flaw locations at room temperature

Draft
6 Copyright © 2010 by ASME
T = 550FMain Pipe System
T = 550FMain Pipe System
(a)
T=550 FBranch Pipe System
T=550 FBranch Pipe System
(b)
Figure 11 Moment versus rotation-due-to-the-crack curves for Type A flaws in the main pipe and branch pipe flaw locations at high temperature (288°C, 550°F)
As mentioned early, displacement measurements were also made at several locations which are shown in Figure 12. For the brevity, displacement comparisons were made at the simulated pump location (D01) shown in Figure 13, which gives the overall comparison between the measured and predicted displacement results. The overall magnitude and trends are agreeable, while predicted moments are a little larger than the measurements over some time durations. This could be due to the simplified model assumptions where pipe and beam elements are used rather than full three-dimensional elements. However, the agreement between prediction and experiment is considered remarkable given the model simplicity. Since displacements are in good agreement, this validates that 2% damping assumption is reasonable. Margin Based on Maximum Moment. By using validated moment versus rotation-due-to-the-crack behavior for the “cracked-pipe element” and damping parameters, it is possible to evaluate the cracked piping system under seismic loading (CO-30 through CO-35). In addition, it is possible to predict low-cycle fatigue crack growth response if crack tearing due to the shaking does not occur. Figure 14, Figure 15 and Figure 16 are the moment versus time histories in the plane of the crack at the crack locations by the elbow, reducer, and branch pipe (respectively) at room temperature under loading blocks CO-30 through CO-35 shaking accelerations. Note that each loading block lasted for about 65 seconds. Therefore, loading block CO-30 was from time 0 to 65 seconds, loading block CO-31
was from time 65 to 130 seconds, and so on until loading block CO-35 is from about time 325 to 390 seconds. According to Figure 14, the maximum moment value over the whole history of loading at the elbow is about 0.147 MN-m, while the maximum moment at the damage point for the “cracked-pipe element” is about 0.185 MN-m, see Figure 10(a). The safety margin in terms of reaching the maximum moment is about 1.26. According to Figure 15, the maximum applied moment value over the whole history at the reducer is about 0.150 MN-m, while the maximum moment-carrying capacity of the cracked section is about 0.185 MN-m (nearly the same as elbow because these two cracks are in the main pipe with the same size). Notice that the magnitudes of the calculated moment for the elbow and reducer cracks are similar. However, the reducer crack sees more cycles of higher moments compared to the elbow (compare Figure 14 and Figure 15). Therefore, the reducer is the critical crack location as observed in the test results. According to Figure 16, the maximum applied moment over the whole time-history at the tee-to-pipe girth weld for the branch section is about 0.015 MN-m, while the maximum moment capacity [Figure 10(b)] is about 0.033 MN-m. The safety margin in terms of the applied to the maximum moment capacity is about 2.20. Additional analyses were conducted to assess what would have happened if these JNES tests were conducted at 288°C (550°F). The properties of the piping and the “cracked-pipe-elements” were changed to represent operating condition at 288°C (550°F), and then the FTP-4 CO-35 loading block was applied again. Figure 17, Figure 18 and Figure 19 are the crack moment histories at elbow, reducer, and branch pipe at high temperature. The margins of the applied moments to the maximum moment-capacity at the reducer was 1.19 at 288°C (550°F). Again, the margins are calculated for moment by comparing the maximum predicted moment with the input maximum moment capacity at high temperature in Figure 11. It is clear that more damage is predicted at high temperature compared with the low temperature results, which is expected since the strength and toughness of stainless steel drops with increasing temperature.

Draft
7 Copyright © 2010 by ASME
Figure 12 Displacement measurement locations DO1 and DO4 for FTP-4 test system
Figure 13 Comparison of displacement history between the
measured and predicted values at Location DO1
Figure 14 Calculated applied moment (MN-m) at elbow
crack location at room temperature for loading block CO-35
Figure 15 Calculated applied moment (MN-m) at reducer crack location at room temperature for loading block CO-35
Figure 16 Calculated applied moment (KN-m) at branch
connection crack at room temperature for loading block CO-35
Figure 17 Calculated moment (MN-m) at elbow crack location at high temperature (288°C) using loading block CO-35

Draft
8 Copyright © 2010 by ASME
Figure 18 Calculated moment (MN-m) at reducer crack location at high temperature (288°C) using loading block CO-35
Figure 19 Line plots of axial stresses in surge nozzle along ID
It is clear that the nonlinear damage and crack growth introduced by the seismic-load histories applied with the FTP-4 test spectrum at room temperature is negligible and mainly elastic perhaps with some local small-scale plasticity. The margin on predicted maximum moment capacity to the maximum applied moment that can be accommodated by the crack element is 1.26. The margin calculated using the moment (compared to the moment causing crack growth) is very conservative since the pipe system can still perform past maximum load and to get to this maximum moment the damping of the un-cracked part of the pipe system should increase. However, after pipe pressure is lost the system probably cannot perform its cooling function. After the surface crack breaks through the pipe wall, the crack will begin to leak, but the through-wall crack may not completely tear into two pipe pieces (e.g., double-end break) for some additional number of cycles. Also, it may simply remain a leaking pipe, which does not break fully. This behavior can be predicted using the methodology presented here. It is also clear that at higher temperature, the margins are lower (in the range of 1.19 on the maximum moment capacity compared to the applied moments). Margin Based on Spectrum. The following analyses consider another measure of the margins in the JNES tests, i.e., the margins on the applied acceleration amplitude to the multiplier needed on the acceleration amplitude to get the pipe to break. The margins created by applying a factor to the seismic acceleration block (CO-30 to CO-035) are examined. This is perhaps a more important measure of the margins as it directly addresses the main objective of this program. In order to accomplish this evaluation, sensitivity analyses were conducted to determine the increase in the seismic amplitude needed to “break” the pipe. In this series of analyses, the scaled amplitudes were only applied on a single block of seismic
excitation (CO-35 level) to obtain the surface crack penetration in one seismic event by ductile tearing rather than high-cycle or low-cycle fatigue with small-scale yielding. The procedure for determining the margin on seismic loading follows. A factor of 2 was applied to the applied acceleration versus time history shown in Figure 9. The analysis was performed, and it was determined if any of the surface cracks became through-wall cracks and then completely broke. If the surface crack did not grow to a through-wall crack, then the multiplier was increased to three and the analysis performed again, and crack failure was again checked. This procedure was continued until one of the cracks failed. This procedure is not strictly valid since the damping requirements are likely a function of the applied acceleration versus time history, but will give conservative bounds. Ideally, the damping ratio for the un-cracked pipe would increase with the increasing applied loads, or one could keep the viscous damping and allow the entire pipe system to experience cyclic plasticity. All elbows are allowed to deform plastically. Again, pressurized water at 8.1 MPa was included in the piping system. Figure 20 shows the FE model with the calculated pipe break location from the room temperature loading analyses, and Figure 21 is the calculated pipe break FE model from the high temperature (288°C, 550°F) loading. The scale factor on the amplitude of the CO-35 acceleration time-history to break the pipe at room temperature was 5, and the scale factor for amplitude of the CO-35 acceleration to break pipe at high temperature was 3. It was found that the reducer failed first and once the reducer fails, the tee crack (branch pipe) fails, and then the elbow crack fails for the room temperature case. Interestingly, once the reducer crack fails, the model predicts that the entire piping system fails within about 5 seconds of additional loading. This may be an important result that should be examined further since typically only one pipe break is considered in pipe flaw evaluations. However, the issue of progressive failures may not be important from a safety standpoint since the first break may lose the cooling function of the pipe. Note that when the entire system was intact, the branch connection crack had a much lower crack-driving force than the other cracks; but once the crack at the reducer broke, then the crack-driving force at the branch connection increased significantly.

Draft
9 Copyright © 2010 by ASME
Figure 20 Broken FTP-4 combined-component system at
room temperature
Figure 21 Broken FTP-4 combined-component system at
high temperature
LOW-CYCLE FATIGUE CRACK GROWTH ASSESSMENT The excitation for the FTP-4 pipe system produced moments and forces at the crack locations which were not high enough to produce tearing or large-scale plasticity at the crack locations. Tearing of a crack can only occur if the applied loads are high enough to cause the driving force J-integral value (crack-tip severity parameter) to be higher than the JIc value (material property determining crack initiation). Here, the maximum moment predicted at the reducer crack location for all of the excitation cases was about 0.15 MN-m. The moment required to produce crack initiation was 0.181 MN-m (this value came from the J-Tearing analysis used to produce Figures 10 and 11) and the maximum moment for the surface crack in the reducer and elbow was 0.185 MN-m. Hence, based on elastic-plastic fracture mechanics analysis, the crack will not grow by ductile tearing, as was seen in the analyses discussed above. Hence, a separate low-cycle-fatigue crack-growth assessment was made to determine if the crack would grow. Equation 1 lists the classical Paris fatigue law. This law is usually applied
when linear elastic conditions (except very close to the crack tip) prevail. da/dN = C(∆K)m (1) where, a = crack length N = number of cycles C = an empirically measured constant m = an experimentally measured parameter K = stress intensity factor = F*σa0.5
σ = far field stress F = a geometric function related to the crack size,
loading direction, and geometry of the component (from stress intensity handbook solutions)
The stress intensity factor can also be determined from finite element analysis. Here, for the FTP-4 piping system, the loads are much higher than would typically occur in a system that is dominated by elastic crack tip conditions and corresponding fatigue crack growth response. For this case Dowling developed a method to predict low-cycle fatigue crack growth. To use this method, one calculates a ∆J value, and converts this into ∆K using J = K2/E’ (where E’ = E/(1-ν2) for plane strain (plane strain dominates for the deep point of a surface crack as exists near the reducer and elbow). The technique for using this method is described fully by Wilkowski, and Mohan [12] for a circumferential through-wall-cracked pipe evaluation. Here the assessment is made for the reducer circumferential surface crack only since this is the critical crack location. The main difficulty in applying this method is determining ∆J. The J-integral parameter is theoretically valid under proportional load conditions with the load monotonically increasing. During cyclic loading, especially if plasticity occurs, J-theory breaks down. Despite this theoretical limitation, J-Theory has been used as a practical ductile fracture mechanics predictive tool in the nuclear industry for thirty years with success. The value of ∆J was estimated by using the SC.TNP J-estimation scheme. This is the estimation scheme used to obtain the cracked-pipe moment-rotation curve discussed as part of the “cracked-pipe element” analysis, and was statistically validated against many pipe fracture tests during various NRC research programs [2]. Since crack closure can play a role in low-cycle fatigue crack growth, it must be accounted for. From Reference [11] it was shown that one may write ∆J = βJ, where β is a factor that accounts for crack closure effects and is between 1 and 2. Crack closure occurs when the crack faces contact during the negative loading portion of the cycle, producing compressive crack tip stresses. For β = 1, J = ∆J, and crack closure effects are not important (this is the case for the minimum, Mmin to maximum Mmax load is defined by R ≥ 0 where R = Mmin/Mmax loads). For full reversed loading, and no crack closure (i.e., a large notch where the crack faces cannot touch during the unload step (Mmin = - Mmax) and R = - 1, β = 2. For the JNES pipe system cracks, it is difficult to estimate the crack closure effect. Based on circumferential through-wall-cracked pipe tests analyzed by Wilkowski [11], it is estimated

Draft
10 Copyright © 2010 by ASME
that β can range between 1.3 and 1.4. Here, the crack growth calculations were made for values of β of 1, 1.3, 1.4, and 2. For the JNES tests, since the notch for the surface flaw was introduced using an EDM procedure, the notch opening is about 0.7 mm. Prior to crack growth, the crack faces do not touch during the compressive portion of the cycle. After the crack begins to grow, the crack faces over the crack growth portion of the crack faces will contact, and crack closure is important. Hence, the experimental procedures used induced a change in the crack closure conditions as the crack growth occurs. The procedure used to perform the low-cycle fatigue crack growth calculations is given in the below seven steps.
1. Determine the crack growth constants for Equation (1). For crack growth in meters and stress intensity factor, K, in MPa-m1/2, the constant ‘C’ is 2.75E-12 and ‘m’ is 3.3. This correlation came is in the ASME code, Section C 8410 of Appendix C to Section XI, and is used for austenitic stainless steels fatigued in air at room temperature. These material constants are very close to those used by Wilkowski [11], for TP304 stainless steel base metal and should provide reasonable fatigue-crack-growth predictions.
2. Place the moment spectrum from load cases CO-30 to
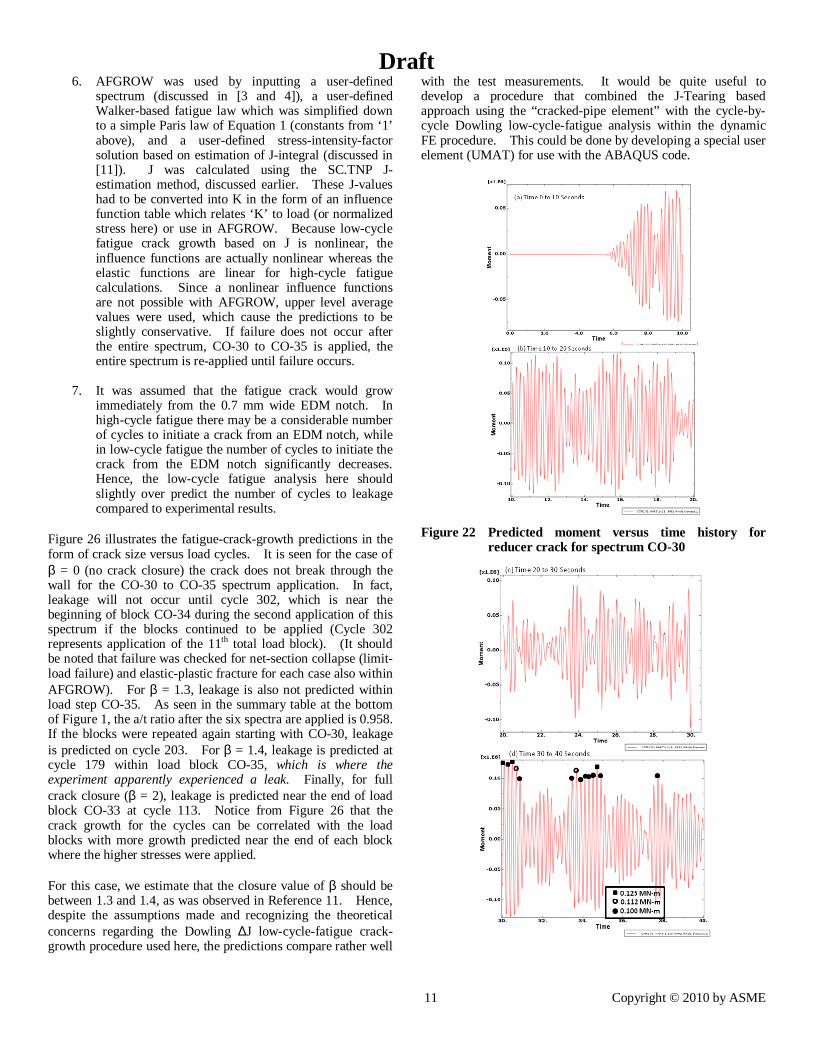
CO-35 into ‘load segments’. The moment load spectrum for CO-30 is shown in Figure 22, Figure 23 and Figure 24(a-f) as an example. Figure 22(a) shows the predicted moments at the reducer section for time 0 to 10 seconds. It is seen that the maximum moment over this time period is about 0.7 MN-m. This level produces a ∆J value that is so low that the crack growth for all of these cycles can be ignored. It turns out that, for these material constants of TP316 stainless steel, crack growth can be neglected for practical purposes for moment values below about 0.95 MN-m since there are not enough cycles (this value was determined by including a lower load in the load segment initially (0.825 MN-m) and determining that the additional crack growth from this level is small). Figure 23 and Figure 24(b-f) shows the predicted moments for time between 10-20, 20-30, 30-40, 40-50, and 50-65 seconds, respectively. It is seen that moments higher than 0.95 MN-m occur for the time period from 10 to 40 seconds only, all other moments can be neglected since the amount of crack growth per cycle is very small and there are not many cycles of those magnitude.
3. Place the load cycles into ‘bins’ for analysis purposes. For instance, the loads for the time periods 30 to 40 seconds [Figure 23(d)] are binned into 0.1375, 0.125, 0.112, and 0.1 MN-m moment cycles for fatigue spectrum analysis. The determination of the load bin levels is somewhat arbitrary but made to be conservative. However, one tries to determine levels where an equal number of loads are above and below the range. Moreover, when picking the levels, we
conservatively place a moment in the upper ‘bin level’ if there is any question as to where it should be placed. From Figure 23(d), it can be seen that there are 4 x (0.125 MN-m), 2 x (0.112 MN-m), and 8 x (0.1 MN-m) cycle bins that are part of the spectrum for CO-30. This same procedure was used for all six load sets. In general, load sets CO-30 to CO-33 are similar, and CO-34 and CO-35 have higher moments that are important for low-cycle fatigue crack growth. Figure 25 shows a plot of the binned load spectra (converted to stress) that were applied for the low-cycle fatigue assessment in the AFGROW code (discussed in Step 5 below). The lines represent each important cycle within each of the blocks. The stress was simply defined as the nominal bending stress (this normalization is irrelevant as this is just used to interpolate K-values in AFGROW with user defined values) in the reducer pipe at the mid thickness based on the moment loads that were predicted, i.e., σ = (M Rmean/)/I, where M is the moment. Rmean is the mean radius of 0.1017 m, and I = 4.274E-5 m4 (here the thickness is 0.01294 at the pipe reducer section of the crack – which is slightly larger than the nominal .0127m). Note that CO-34 is more severe compared with CO-30 to CO-33, and CO-35 is the worst case.
4. The binned moment cycles are placed into spectral blocks. For this analysis, CO-30 to CO-33 are represented by one block that is applied 4 times, and the CO-34 and CO-35, which have larger moments, represents the final two blocks, with CO-35 the worst contribution to fatigue crack growth. The blocks in Figure 25 has each spectrum applying the lower loads first followed by the larger loads for each of the six spectra. If we reverse the order, with the larger loads first followed by the lower loads, the results are not affected much (this was done here). In reality, for each spectrum, the lower loads are experienced first as seen in Figure 25. The stress levels are represented by the different colors. The plot, which is output from AFGROW (see step 5), is somewhat deceiving in that only 4 total load levels were applied, 3 for CO-30 to CO-33, and 4 for CO-34 and CO-35. The mixed colors are an artifact of the AFGROW plotting routine.
5. The Air Force fatigue analysis code, AFGROW (Version 4), which uses a Vroman crack growth integration scheme to march through the low-cycle fatigue crack growth analysis, was used for all predictions. AFGROW is a very powerful fatigue-life estimation code used throughout the US Air Force and other US agencies that manage fleets of planes, and it is used in many other industries as well. This code can handle very complicated load spectra, has five different fatigue laws, numerous crack growth libraries, and a large material database and has been validated extensively.
Draft
11 Copyright © 2010 by ASME
6. AFGROW was used by inputting a user-defined spectrum (discussed in [3 and 4]), a user-defined Walker-based fatigue law which was simplified down to a simple Paris law of Equation 1 (constants from ‘1’ above), and a user-defined stress-intensity-factor solution based on estimation of J-integral (discussed in [11]). J was calculated using the SC.TNP J-estimation method, discussed earlier. These J-values had to be converted into K in the form of an influence function table which relates ‘K’ to load (or normalized stress here) or use in AFGROW. Because low-cycle fatigue crack growth based on J is nonlinear, the influence functions are actually nonlinear whereas the elastic functions are linear for high-cycle fatigue calculations. Since a nonlinear influence functions are not possible with AFGROW, upper level average values were used, which cause the predictions to be slightly conservative. If failure does not occur after the entire spectrum, CO-30 to CO-35 is applied, the entire spectrum is re-applied until failure occurs.
7. It was assumed that the fatigue crack would grow
immediately from the 0.7 mm wide EDM notch. In high-cycle fatigue there may be a considerable number of cycles to initiate a crack from an EDM notch, while in low-cycle fatigue the number of cycles to initiate the crack from the EDM notch significantly decreases. Hence, the low-cycle fatigue analysis here should slightly over predict the number of cycles to leakage compared to experimental results.
Figure 26 illustrates the fatigue-crack-growth predictions in the form of crack size versus load cycles. It is seen for the case of β = 0 (no crack closure) the crack does not break through the wall for the CO-30 to CO-35 spectrum application. In fact, leakage will not occur until cycle 302, which is near the beginning of block CO-34 during the second application of this spectrum if the blocks continued to be applied (Cycle 302 represents application of the 11th total load block). (It should be noted that failure was checked for net-section collapse (limit-load failure) and elastic-plastic fracture for each case also within AFGROW). For β = 1.3, leakage is also not predicted within load step CO-35. As seen in the summary table at the bottom of Figure 1, the a/t ratio after the six spectra are applied is 0.958. If the blocks were repeated again starting with CO-30, leakage is predicted on cycle 203. For β = 1.4, leakage is predicted at cycle 179 within load block CO-35, which is where the experiment apparently experienced a leak. Finally, for full crack closure (β = 2), leakage is predicted near the end of load block CO-33 at cycle 113. Notice from Figure 26 that the crack growth for the cycles can be correlated with the load blocks with more growth predicted near the end of each block where the higher stresses were applied. For this case, we estimate that the closure value of β should be between 1.3 and 1.4, as was observed in Reference 11. Hence, despite the assumptions made and recognizing the theoretical concerns regarding the Dowling ∆J low-cycle-fatigue crack-growth procedure used here, the predictions compare rather well
with the test measurements. It would be quite useful to develop a procedure that combined the J-Tearing based approach using the “cracked-pipe element” with the cycle-by-cycle Dowling low-cycle-fatigue analysis within the dynamic FE procedure. This could be done by developing a special user element (UMAT) for use with the ABAQUS code.
Figure 22 Predicted moment versus time history for
reducer crack for spectrum CO-30

Draft
12 Copyright © 2010 by ASME
Figure 23 (continued) Predicted moment versus time history for reducer crack for spectrum CO-30
Figure 24 (continued) Predicted moment versus time
history for reducer crack for spectrum CO-30
Figure 25 Binned Stress cycles calculated from the
predicted moments for all spectra (CO-30 to CO-35). σσσσ = 138 MPa corresponds to a moment of 0.1 MN-m, σσσσ = 155 MPa corresponds to a moment of 0.112 MN-m, σσσσ = 173 MPa corresponds to a moment of 0.125 MN-m, and σσσσ = 189 MPa corresponds to a moment of 0.1375 MN-m. Each ‘line’ represents a cycle applied
Figure 26 Low-cycle fatigue-crack-growth predictions
SUMMARY AND CONCLUSION The connector element has been introduced to the fracture analysis in piping systems to represent a “cracked-pipe element” (CPE). The static and dynamic behaviors were thoroughly studied and validated against a large variety of pipe experiments. This connector element can be used to simulate and automatically calculate the low-cycle fatigue crack growth during large-scale plasticity and ultimate failure under static and dynamic loading with much less computation time than full 3D FE modeling. The procedure used to make predictions of low-cycle fatigue crack growth was based on the Dowling ∆J procedure together with experience from circumferential through-wall-cracked pipe low-cycle-fatigue analysis. The predictions using this approach compare quite well with the experimental measurements where leakage occurred during the 6th load block when using the recommendations of the β factor of 1.3 to 1.4 for converting deformation plasticity J to the Dowling ∆J. Margins on the applied moment to the maximum moment capacity, as well as the acceleration amplitude applied relative to the acceleration amplitude needed to fail the pipe, were determined. For room temperature, the margin was calculated to be 1.26 for the applied moments in FTP-4 versus the maximum moment capacity of the cracked pipe. The calculated maximum acceleration level to cause a full pipe break in the FTP-4 combined-component test system was 5 times the CO-35 acceleration level. At BWR operating temperatures [288°C, (550°F], the calculated margin on the applied moment to the maximum moment capacity was 1.19, while the calculated margin on the applied acceleration to the acceleration needed to break the pipe was 3. The margins on acceleration to cause failure are lower bounding since the damping factor for the entire system may increase above the 2% damping value used in these analyses.
Draft
13 Copyright © 2010 by ASME
Other issues that deserve further study include the effect of cyclic loading on crack initiation, the constraint effects on ductile tearing, and constraint effects on fatigue low-cycle fatigue crack growth. When plasticity at the crack tip is important, voids that develop in front of the blunted crack (prior to initiation) may sharpen and cause initiation to occur at a lower value of J. It is known that constraint effects are important for surface cracks in pipe during elastic-plastic fracture. Improvement of the J-estimation schemes and developing a factor to apply compact tension J-R curves to make them more appropriate for use in surface-cracked pipe is needed. Finally, constraint effect on fatigue is a topic of interest in the elastic high-cycle fatigue field at present. It may be even more important for low-cycle fatigue since plasticity is more important. ACKNOWLEDGEMENTS The authors would like to thank US NRC and Brookhaven National Laboratory for their support of this work. REFERENCE 1 K. Suzuki and H. Kawauchi, “Test Programs for Degraded
Core Shroud and PLR System Piping (Seismic Test Results and Discussion on JSME Rules Application,” 2008 ASME PVP conferences, July 27-31, Chicago, IL.
2 Wilkowski, G. M., Olson, R. J., and Scott, P. M., “State-of-the-Art Report on Piping Fracture Mechanics,” U.S. Nuclear Regulatory Commission report, NUREG/CR-6540, BMI-2196, February 1998.
3 Chokshi, N.C., Shaukat, S.K., Hiser, A.L., DeGrassi, G., Wilkowski, G., Olson, R., and Johnson, J.J., “Seismic Considerations for the Transition Break Size,” NUREG-1903, February 2008.
4 Suzuki, K., Kawauchi, H., and Abe, H., “Test Programs For Degraded Core Shroud and BWR Piping (Simulated Crack Models And Input Seismic Waves For Shaking Test),” Proceedings of PVP2006-ICPVT-11, July 23-27, 2006, paper # PVP2006-ICPVT-11-93118.
5 Olson, R., Scott, P. and Wilkowski, G., 1992, “Application of a Nonlinear-Spring Element to Analysis of Circumferentially Cracked Pipe Under Dynamic Loading,” ASME PVP Conference, 233, pp. 279-291.
6 Olson, R., Wolterman, R., Scott, P., Krishnaswamy, P. and Wilkowski, G., 1994, “The Next Generation Analysis Methodology for Cracked Pipe Systems Subjected to Dynamic Loads,” ASME PVP Conference, 275-1, pp. 159-172.
7 ABAQUS 6.8, Dassault Systemes Simulia Corp. 8 Wilkowski, G., and others, “International Piping Integrity
Research Group (IPIRG) Program, Final Report,” NUREG/CR-6233 Vol. 4, June 1997.
9 Zhang, T., Brust, F. W., Shim, D. J., Wilkowski, G, Nie, J., and Hofmayer, C., NRC NUREG/CR report, to be published in 2010.
10 Wilkowski, G. M., Olson, R. J., and Scott, P. M., “State-of-the-Art Report on Piping Fracture Mechanics,” U.S. Nuclear
Regulatory Commission report, NUREG/CR-6540, BMI-2196, February 1998.
11 Ghadiali, N., and Wilkowski, G. M., “Fracture Mechanics Database for Nuclear Piping Materials (PIFRAC),” in Fatigue and Fracture - 1996 - Volume 2, PVP - Vol. 324, July 1996, pp. 77-84.
12 Wilkowski, G., Rahman, S., and Mohan, R., “Low-Cycle Fatigue Crack Growth Considerations in Pipe Fracture Analyses,” ASME PVP Vol. 280, June 1994, pp. 281-298..


