Embed Size (px)
DESCRIPTION
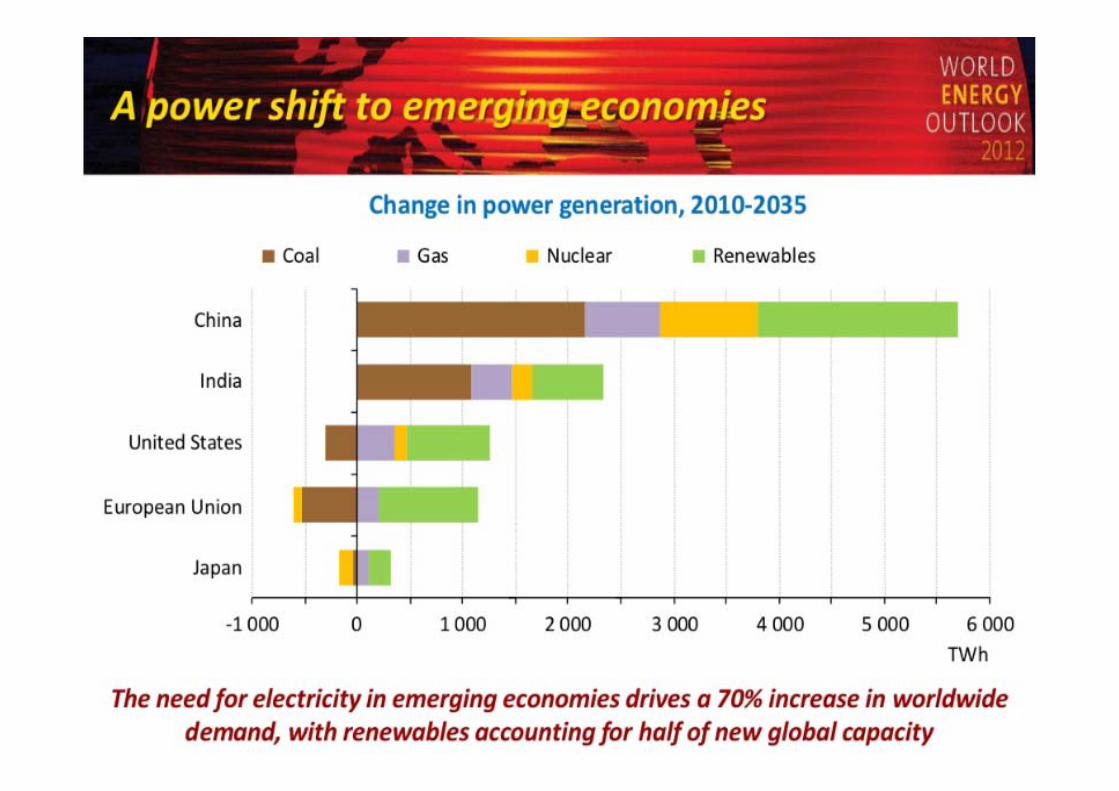
Market trends and projections to 2017
Citation preview

© OECD/IEA 2012
PV in IEA Medium‐term Market Forecast and Long‐term Scenarios
Roberto VIGOTTIVice Chair RE Working Party

© OECD/IEA 2012
E’ uscito l’ultimo rapporto della WB
© OECD/IEA 2012
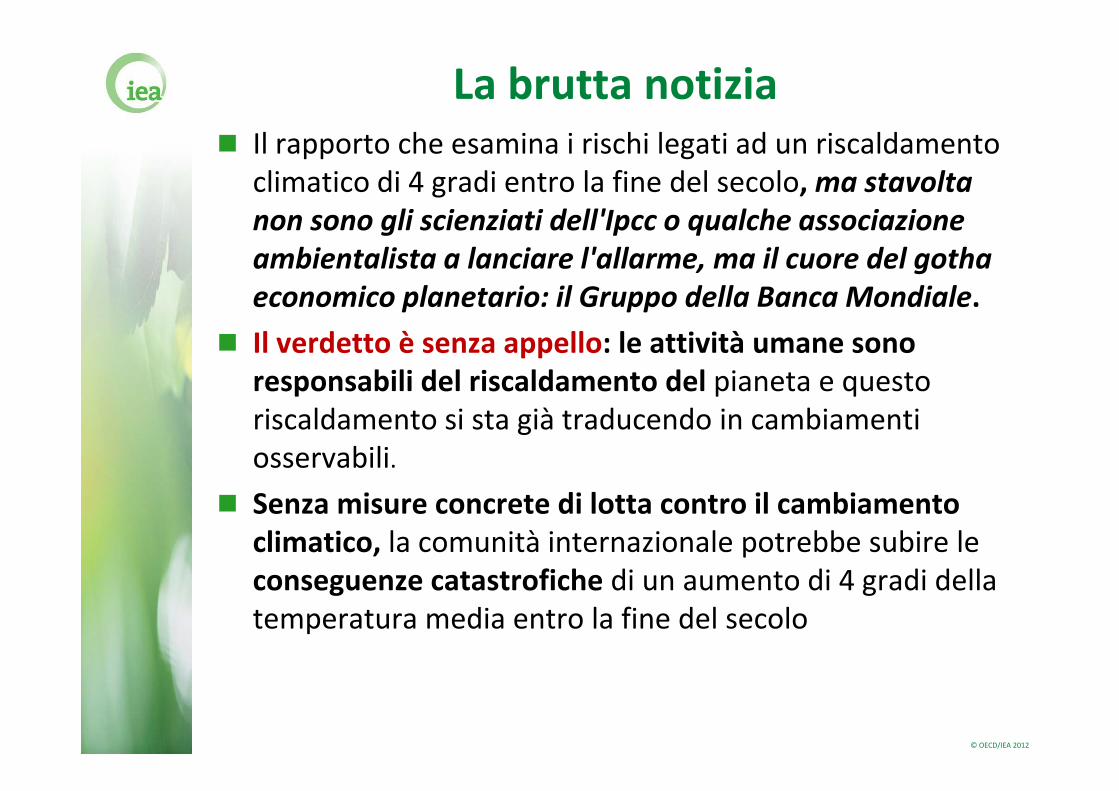
La brutta notizia Il rapporto che esamina i rischi legati ad un riscaldamento
climatico di 4 gradi entro la fine del secolo, ma stavolta non sono gli scienziati dell'Ipcc o qualche associazione ambientalista a lanciare l'allarme, ma il cuore del gotha economico planetario: il Gruppo della Banca Mondiale.
Il verdetto è senza appello: le attività umane sono responsabili del riscaldamento del pianeta e questo riscaldamento si sta già traducendo in cambiamenti osservabili.
Senza misure concrete di lotta contro il cambiamento climatico, la comunità internazionale potrebbe subire le conseguenze catastrofiche di un aumento di 4 gradi della temperatura media entro la fine del secolo

© OECD/IEA 2012
La raccomandazione della Banca L'adozione di politiche di sviluppo sostenibile potrebbero in
effetti permetterci di limitare il riscaldamento planetario a meno di 2 gradi,
Un utilizzo più efficace e più intelligente dell'energia e delle risorse naturali potrebbe permetterci di ridurre radicalmente l'impatto dello sviluppo sul clima, senza per questo rallentare gli sforzi della lotta contro la povertà o la crescita economica.
Ogni Paese sceglierà metodi differenti per realizzare una crescita più ecologica,ma in ognuno di essi esistono delle occasioni di crescita verde da sfruttare.
Conclude il rapporto: «La previsione di 4° C di riscaldamento semplicemente non deve essere permesso che si verifichi, questo “caldo” deve essere respinto. Solo azioni a scala internazionali possono farsì che questo accada».

© OECD/IEA 2012
© OECD/IEA 2012
© OECD/IEA 2012

© OECD/IEA 2012
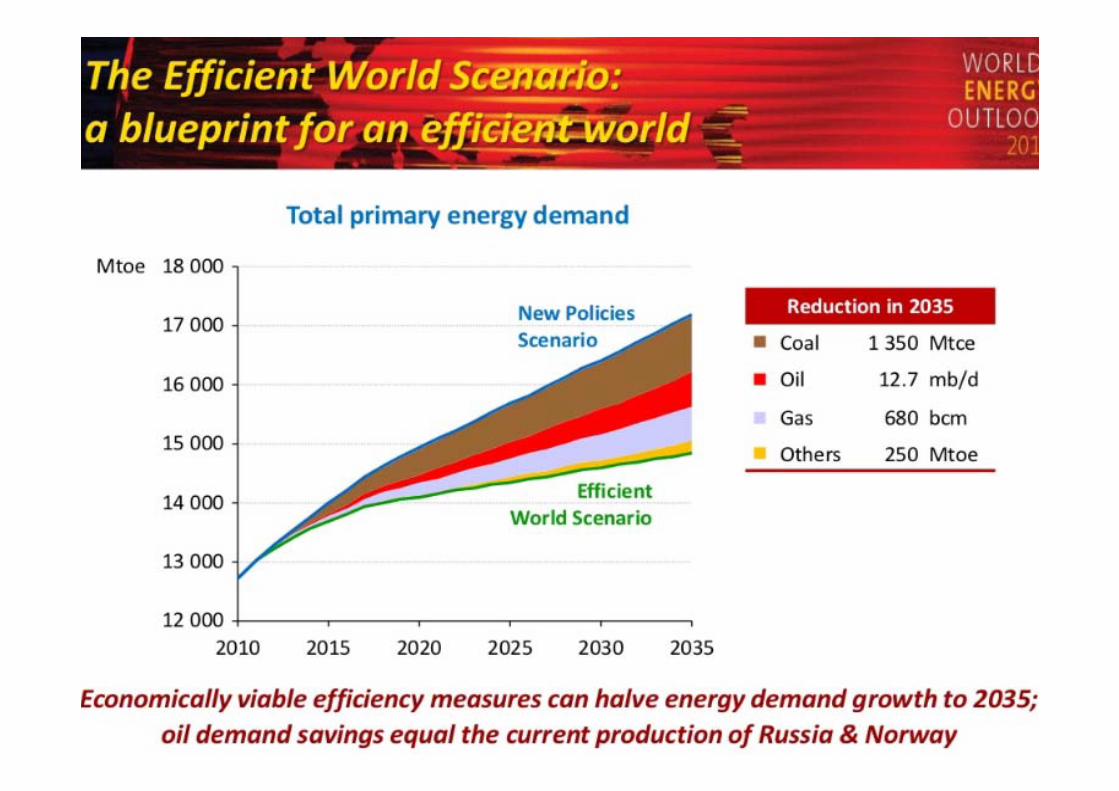
Renewables take their place in the sun
Re make up an increasing share of primary energy use in all scenarios, thanks to government support, falling costs, CO2 pricing in some regions and rising fossil fuel prices in the longer term.
By 2035, electricity from renewables triples, and will account for almost one‐third of total electricity output. Solar grows more rapidly – 26 times !!‐ than any other renewable technology, and will provide 7,5% of all RE based generation. Wind almost ¼.
Renewables become the world’s second‐largest source of power generation by 2015 (roughly half that of coal) and, by 2035, they approach coal as the primary source of global electricity

© OECD/IEA 2012
RE capacity additions per year
A total of 3000 GW of Re capacity –including replacements – is built 2012‐2035, more than half of total gross capacity additions in the power sector

© OECD/IEA 2012
Cumulative investment in RE‐basedelectricity generation in NPS
Cumulative investments of 6 trillion $ required by 2035, with annual investmentsup to 300 billion $ in 2035. RE accounts 62% of total investement in power
generation
© OECD/IEA 2012
IEA and its key publications on RE

© OECD/IEA 2012
The Medium Term RE Market Report The IEA is publishing its first medium‐term
report focused on renewable energy Bottom‐up, global renewable forecast of renewable
electricity capacity and generation over the next 5 years
Detailed analysis of 12 OECD countries (Austria, Denmark, France, Germany, Italy, Japan, Norway, Spain, Sweden, Turkey, UK, US) and China, India, Brazil (~80% of world renewable electricity)
For 2012 edition, focus on 8 technologies in power sector
Completes slate of IEA MT forecasts: oil, gas, coal

© OECD/IEA 2012
Key trends As a portfolio of renewable technologies matures, global
renewable power generation is forecast to rise 40% Supported by policy/market frameworks and economic
attractiveness in increasing range of countries and circumstances Technology cost developments, grid/system integration,
cost/availability of financing also weigh as key variables High level of economic/policy uncertainty in some countries
This projected growth is an acceleration vs previous period Growth is 60% higher over 2011‐17 versus 2005‐11
Renewable deployment is projected to spread out geographically, with increased activity in emerging markets Deployment spurring economies of scale in some technologies ‐
virtuous cycle of improved competition and cost reductions
© OECD/IEA 2012
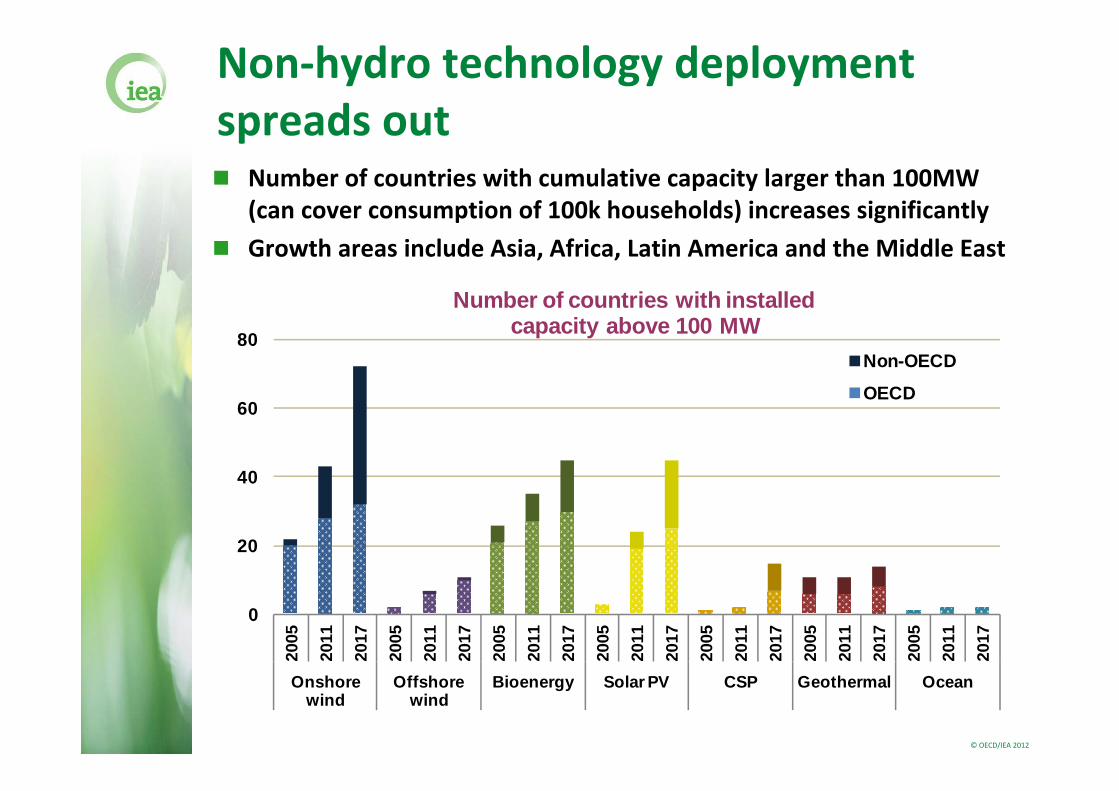
Non‐hydro technology deployment spreads out Number of countries with cumulative capacity larger than 100MW
(can cover consumption of 100k households) increases significantly Growth areas include Asia, Africa, Latin America and the Middle East
0
20
40
60
80
2005
2011
2017
2005
2011
2017
2005
2011
2017
2005
2011
2017
2005
2011
2017
2005
2011
2017
2005
2011
2017
Onshore wind
Offshore wind
Bioenergy Solar PV CSP Geothermal Ocean
Number of countries with installedcapacity above 100 MW
Non-OECD
OECD

© OECD/IEA 2012
Generation additions over 2011‐17 differ across regions and technology portfolios
OECD Americas (+179 TWh)
Wind onshore
Bioenergy
Solar PV
Other technologies
OECD Asia‐Oceania (+77 TWh)
Wind onshore
Bioenergy
Solar PV
Other technologies
OECD Europe (+365 TWh)
Hydropower
Wind onshore
Bioenergy
Solar PV
Other technologies
Non‐OECD (+1 220 TWh)
Hydropower
Wind onshore
Bioenergy
Solar PV
Other technologies

© OECD/IEA 2012
Medium‐term solar PV outlook
Global capacity to top 230 GW in 2017 (baseline) Markets quickly changing due to changing policy environment
(China, Japan, Germany, Italy, etc.) and falling costs Market shifting to good resource areas that don’t need subsidies
0
50
100
150
200
250
2011 2012 2013 2014 2015 2016 2017
GW Global solar PV capacity forecast
Germany China US Japan Italy RoW

© OECD/IEA 2012
Outlook uncertainty significant Germany and Italy’s projections already challenged EPIA’s range in 2016: 208GW – 343GW
0
50
100
150
200
250
300
350
2011 2016 IEA baseline
2016 IEA enhanced
2016 EPIA Moderate
2016 EPIA policy-driven
GW Global solar PV capacity forecasts comparison
Germany China US Japan Italy RoW

© OECD/IEA 2012
Penetration shares
GW2017
enhanced case2010/11
power system Benchmark %
China 48.1 1050 5%
Germany 47.7 157 30%
USA 33.0 1040 3%
Japan 28.4 287 10%
Italy 26.8 105 25%
European countries like Germany and Italy could be reaching high PV penetration shares by 2017
Emerging economies but also the US represent much larger potential markets
© OECD/IEA 2012
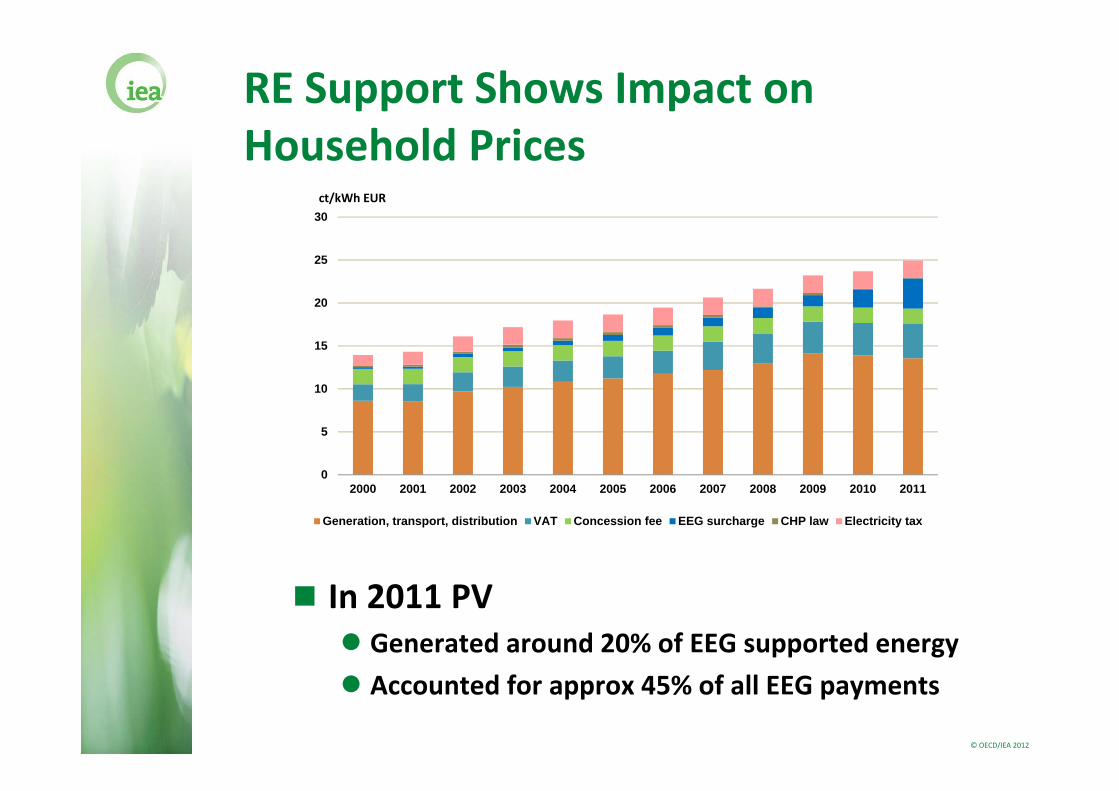
RE Support Shows Impact on Household Prices
In 2011 PV Generated around 20% of EEG supported energy Accounted for approx 45% of all EEG payments
0
5
10
15
20
25
30
2000 2001 2002 2003 2004 2005 2006 2007 2008 2009 2010 2011
ct/kWh EUR
Generation, transport, distribution VAT Concession fee EEG surcharge CHP law Electricity tax

© OECD/IEA 2012
PV Generation Impacting Spot Markets
0,010,020,030,040,050,060,070,080,0
0 1 2 3 4 5 6 7 8 9 1011121314151617181920212223
GW
hr
Conventional Wind PV
Power generation in Germany, 14 May 2012
Source: Top, EEX Transparency Platform; Bottom EEX cited as in http://www.agora‐energiewende.de/fileadmin/downloads/Agora_Energiewende_Impulse_Kapazitaetsmarkte.pdf
2007 2008 2009 2010 2011Phelix Base [EUR/MWh]
37.99 66.76 38.85 44.49 51.12
Phelix Peak [EUR/MWh]
56.16 88.07 51.15 55.02 58.95
Spread [%] 149 134 132 124 115

© OECD/IEA 2012
Medium‐term solar PV manufacturing outlook
Amid overcapacity, solar PV industry undergoing major restructuring Selling at zero margins or loss to keep market share Chinese companies taking larger market share Upheaval likely to persist for several years
Companies locating manufacturing closer to emerging markets Sunnier countries with high demand growth more attractive (e.g.
Asia and Middle East) Capital less costly, more accessible in Asia
Chinese companies increasingly produce for large, domestic market
© OECD/IEA 2012
Conclusions
Massive improvements in recent years IEA forecasts PV world capacity to increase x 3‐4 times over next 5 years
However, system and market integration issues emerging in specific countries market reforms needed
Moving to new countries and competitive market segments is key
Huge long‐term potential

© OECD/IEA 2012
For further insights and analysis…
The Medium‐Term Renewable Energy Market Report 2012 online at:
www.iea.org
Thank you for your attention!

© OECD/IEA 2012
Le conseguenze
Innalzamento del livello del mare l'agricoltura, le risorse idriche, la salute umana, la biodiversità saranno verosimilmente gravemente colpiti. Queste ripercussioni potrebbero produrre vasti spostamenti di popolazioni, ridurre la sicurezza e perturbare i sistemi economici ed il commercio.
Ondate di calore Acidificazione degli oceani Calo delle rese agricole. in tutto il mondo, con gravi
rischi per la sicurezza alimentare futura I rischi per i servizi eco‐sistemi agli esseri umani, rischi
gravi per le incidenze negative sulla disponibilità di acqua

© OECD/IEA 2012
Share RE by category and scenario

© OECD/IEA 2012
Growth in renewable power is forecast to accelerate Hydropower remains the main renewable power source (+3.1% p.a.) Non‐hydro renewable sources grow at double‐digit annual
percentage rates (+14.3% p.a.)
0
1 000
2 000
3 000
4 000
5 000
6 000
7 000
2005 2006 2007 2008 2009 2010 2011 2012 2013 2014 2015 2016 2017
Global renewable electricity production and forecast
Hydropower Wind onshore Bioenergy Solar PV
Geothermal Wind offshore CSP Ocean
TWh
© OECD/IEA 2012
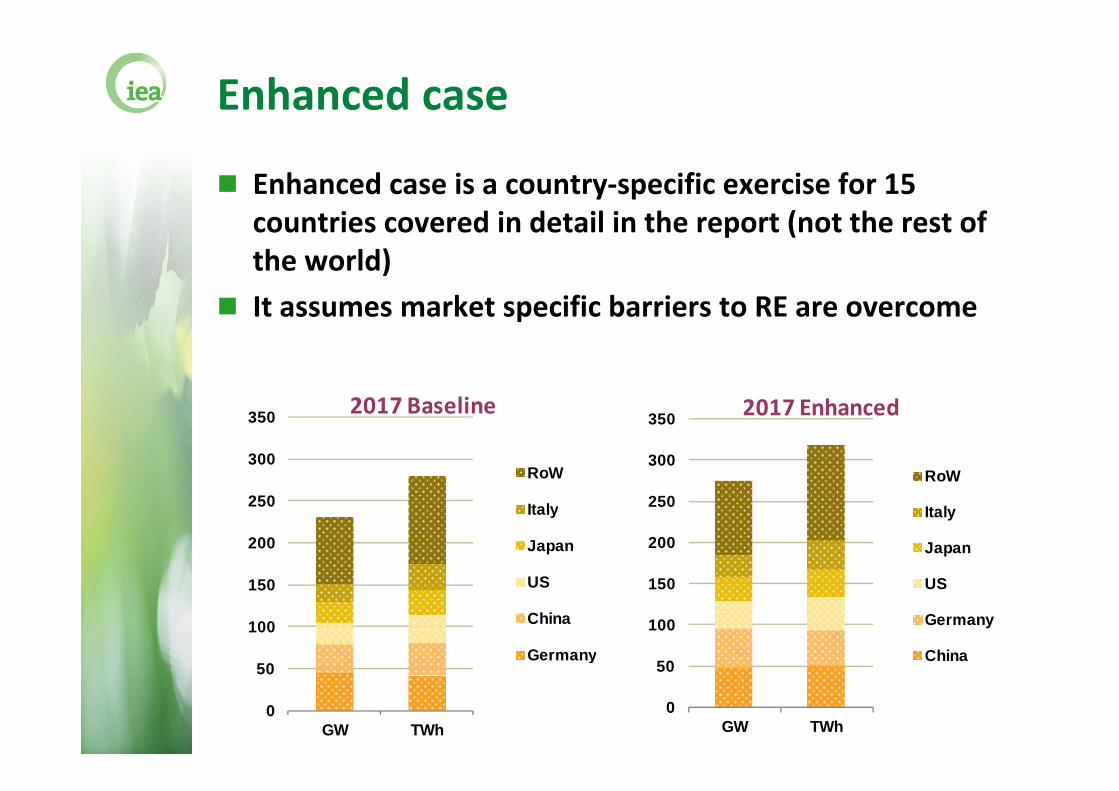
Enhanced case
Enhanced case is a country‐specific exercise for 15 countries covered in detail in the report (not the rest of the world)
It assumes market specific barriers to RE are overcome
0
50
100
150
200
250
300
350
GW TWh
2017 Baseline
RoW
Italy
Japan
US
China
Germany
0
50
100
150
200
250
300
350
GW TWh
2017 Enhanced
RoW
Italy
Japan
US
Germany
China
© OECD/IEA 2012
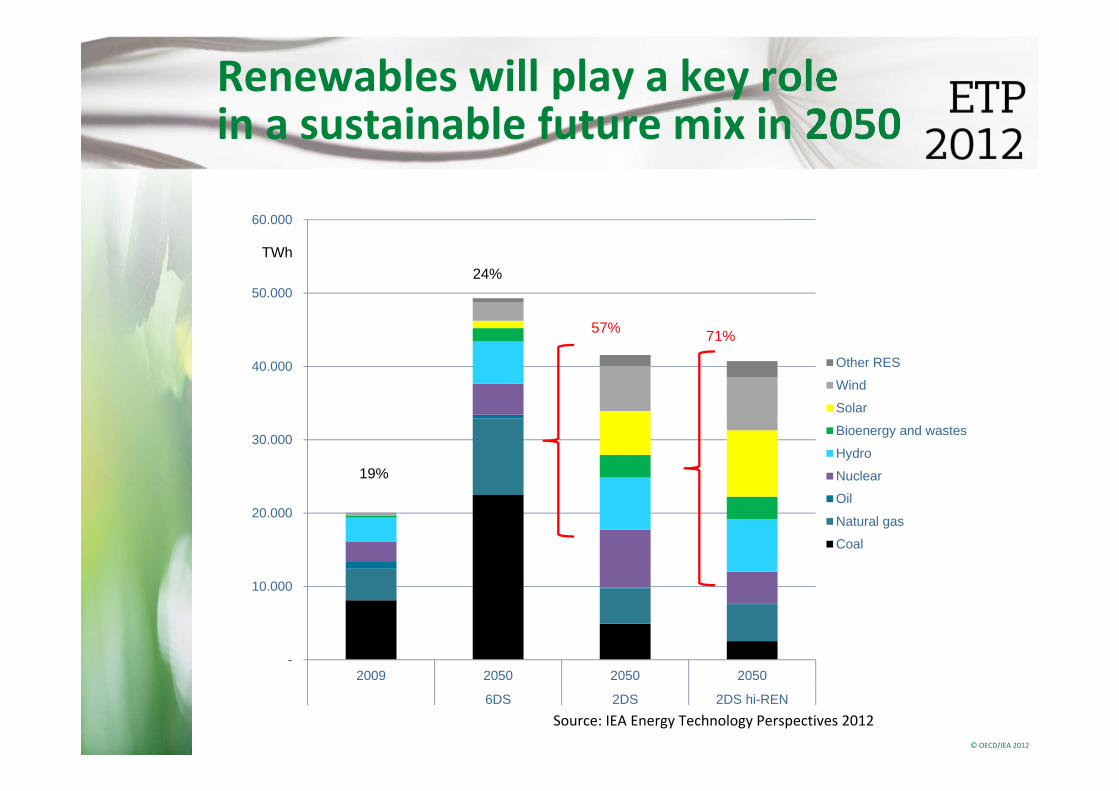
Renewables will play a key rolein a sustainable future mix in 2050
-
10.000
20.000
30.000
40.000
50.000
60.000
2009 2050 2050 2050
6DS 2DS 2DS hi-REN
Other RES
Wind
Solar
Bioenergy and wastes
Hydro
Nuclear
Oil
Natural gas
Coal
19%
24%
57% 71%
TWh
Source: IEA Energy Technology Perspectives 2012