Embed Size (px)
Citation preview

1
Putting geographic variation in surgical procedures on the map:
Geographic variation in coronary artery bypass and hip and knee replacement
surgeries in the Maritime provinces
FINAL REPORT
Strategy for Patient-Oriented Research
Putting Patients First Le patient d’abord
Stratégie de recherche axée sur le patient

2
PROJECT INFOPROJECT TITLE
Putting geographic variation in surgical procedures on the map: Geographic variation in coronary artery bypass surgery and hip and knee replacement surgeries in the Maritime Provinces
PRINCIPAL INVESTIGATORS
Adrian Levy, Professor and Department Head, Department of Community Health and Epidemiology, Dalhousie University; Nominated Principal Investigator, Maritime SPOR SUPPORT UnitJames Ted McDonald, Professor, Department of Economics, the University of New Brunswick; co-Principal Investigator for the Maritime SPOR SUPPORT UnitJuergen Krause, Professor and Dean of Faculty of Business, University of Prince Edward Island; co-Principal Investigator for the Maritime SPOR SUPPORT Unit
RESEARCH TEAM
This project is a collaboration between the Maritime SPOR SUPPORT Unit nodes in New Brunswick, Nova Scotia, and Prince Edward Island.
Co-Investigators:Philip Leonard, Research AssociateDavid Stock, Senior Health Services Researcher
FUNDINGThe Maritime SPOR SUPPORT Unit is funded by the Canadian Institutes for Health Research, the governments of New Brunswick, Nova Scotia, and Prince Edward Island, and the New Brunswick Health Research Foundation and the Nova Scotia Health Research Foundation.
ACKNOWLEDGEMENTSThe Maritime SPOR SUPPORT Unit acknowledges Dalhousie University, Health Data Nova Scotia, the University of New Brunswick, the New Brunswick Institute for Research, Data and Training, the University of Prince Edward Island, the New Brunswick Department of Health, the Nova Scotia Department of Health and Wellness, Health PEI, and the New Brunswick and the Nova Scotia Health Research Foundations for their important role in this research.
HOW TO CITE THIS REPORTLevy A, McDonald JT, Krause J, Leonard P, Stock D for the Maritime SPOR SUPPORT Unit (2016). Putting geographic variation in surgical procedures on the map: Geographic variation in coronary artery bypass surgery and hip and knee replacement surgeries in the Maritime Provinces. Maritime SPOR SUPPORT Unit. Halifax, Nova Scotia.
Contributors:Sarah Campbell-McNamara, Research Coordinator Mary-Ann MacSwain, Data AnalystMichelle Patterson, Research Manager Bryn Robinson, Clinical Research Manager

3
regionalization can affect cost, quality, and access, key aspects of any health care system.
There are many considerations when planning the optimal organization of health care delivery. The policy of regionalization of health services - the provision of care at a limited number of sites - can affect cost, quality, and access, key aspects of any health care system. A potential consequence of regionalization is variation in service utilization across regions, which may be a reflection of insufficient access to care in some areas and over-provision in others. While variations are not necessarily undesirable if varying health requirements are being met, describing the extent of that variation is an important first step in understanding any potential adverse health implications.
Across the Maritime provinces, there are different models governing the provision of surgical care. Cardiac surgery, for example, is provided at two facilities, one in Halifax, Nova Scotia (NS) and the other in Saint John, New Brunswick (NB), while major orthopaedic procedures are performed at more hospitals across NS, NB , and the Queen Elizabeth Hospital in Charlottetown, Prince Edward Island (PEI). In this report, we describe rates of coronary artery bypass graft surgery (CABG), and hip and knee replacement surgeries across geographic regions in NB, NS, and PEI. Changes in these rates over time are also described.
EXECUTIVESUMMARY

4
DR. ADRIAN LEVY, PHD Adrian R. Levy PhD is Professor and Head of the
Department of Epidemiology and Community Health at Dalhousie University and a District Chief in the Nova Scotia
Health Authority. He is the nominated principal investigator for the Maritime Strategy for Patient-Oriented
Research SUPPORT Unit and the co-principal investigator and Nova Scotia Database team leader on the Canadian
Network of Observational Drug Effect Studies. He is author of over 130 peer reviewed publications and is the co-editor
on the Springer Handbook of Health Services Research volumes on Comparative Effectiveness Research and on Data and Measures. His academic interests lie in health
services research including measurement and valuation, health technology assessment, pharmacoepidemiology,
quality of life, and access to care.
I am extraordinarily pleased - and proud - to see this report coming into production. The report’s genesis was the application for funding submitted to the Canadian Institutes of Health Research (CIHR), entitled A Strategy for a Patient-Oriented Research SUPPORT Unit in the Maritime Provinces. In anticipation of a request from the peer-review committee adjudicating the final application, CIHR requested that the business case include plans for a “Demonstration Project” to demonstrate the functioning of the Unit1.
The phenomenon of small area rate variations in health services was first demonstrated some 85 years ago when Glover (1938) revealed striking eightfold differences in the rates of tonsillectomy among British schoolchildren based on where they lived. Since then, rate variations in health services delivery have generated many hypotheses for improvements in health care. A key element of the rationale behind the 2010 United States Affordable Care Act was small area rate variations demonstrated by the Dartmouth Atlas.
In the current Report, we look at smaller area variations in three surgical procedures, coronary artery bypass surgery and hip and knee replacement, in Canada’s Maritime provinces of New Brunswick (NB), Nova Scotia (NS), and Prince Edward Island (PEI). Coronary artery bypass
1 The feedback from CIHR was as follows: “Demonstrating how the SUPPORT Unit will be used to bring about transformation
• The business plans generally explain clearly how the Unit will function at a high level or in theory in terms of its activities. However, we believe the adjudication panel will want to see a clear demonstration of how the SUPPORT Unit’s activities will feed into specific projects to achieve transformational outcomes.
• This will likely evolve considerably over the life of the Unit, but having a clearer sense of the storyline at this point through a demonstration project will help bring the concepts to life.
• Areas to cover here would include how projects will get launched; who will initiate and drive these and what are the likely results.”
Nominated Principal InvestigatorMESSAGE FROM THE MSSU

5
Adrian
surgery is performed only in Saint John, NB, and Halifax, NS, and residents of PEI must travel to one of those two locations to undergo the operation. When this occurs, two-way transport by ambulance is typically required. In contrast, hip and knee replacement are less centralized, being performed in eight hospitals in NB, five in NS, and one in PEI. The Maritimes are a particularly insightful place to study small area rate variations due to:
• small population size, which means that services are necessarily centralized; • geography, which means that all areas of the Maritimes are accessible through ground transportation and large proportions of the populations live near a provincial border; • administrative disaggregation of health provision by health authorities with understandings between provinces for the delivery of care to residents of other provinces; • a single medical school around which tertiary care services are organized; and • a variety of service models for delivering different types of operations.
As such, much useful information and knowledge can be gleaned by study of geographic variations in these three procedures across the Maritimes. This Report presents baseline information to which investigators planning new analytic and intervention studies can refer back.
Beyond addressing a substantive question of regionalization and interprovincial provision of care, the Demonstration Project was designed to highlight the following five elements in the functioning of the Unit:
• addressing a question of relevance to the NB Department of Health and the NS and PEI Departments of Health and Wellness; • demonstrating data access in all three provinces; • creating standardized analytic data sets; • interprovincial sharing of study context, methods and results; and • interprovincial collaboration on developing a protocol to be followed in each province.
This report is tangible evidence that the project was successful in demonstrating each of these elements.

66
MAIN FINDINGSAge- and sex-standardized rates of CABG declined between 2001 and 2012 in NS, while rates stayed relatively constant in NB until 2008 and then declined thereafter. This decreasing trend is consistent with national studies and likely reflects greater use of percutaneous coronary interventions. In contrast, age- and sex-standardized rates for both hip and knee replacements increased over the study period for all three Maritime provinces. This also mirrors national trends and is likely related to an aging population, rising obesity and a growing recognition of the effectiveness of these procedures.
there are within-province geographic variations of surgical rates by region
rates of cardiac surgery showed small declines over the period, while rates of orthopaedic procedures increased steadily
rates of cardiac surgery were higher for men, while those of orthopaedic surgeries were higher for women
In general, age-adjusted CABG rates were higher for men than for women, in both NB and NS. The opposite was observed for hip and knee surgery rates, with women having higher rates across all three Maritime provinces, though this was less consistent in PEI.
There were observed differences across regions of residence in age/sex-adjusted rates over the 2001-2012 period for each of the Maritime provinces. These included variations between northern and southern NB, and between NS’s Cumberland region (which borders the Moncton health region in NB). Hip and knee surgery rates for patients living in rural regions of PEI were higher during some portions of the study period. These differences reflect interesting implications for access to health care and patient satisfaction.
7
INTRODUCTIONDEMONSTRATION REPORT
there are within-province geographic variations of surgical rates by region
While regionalization can result in lower costs and improved quality of care, these benefits must be weighed against the potential for reduced access to care when evaluating overall impact on patient outcomes. Having to travel further for a service or rely on limited treatment options from local providers can impose barriers to appropriate care, evident in geographic variations in rates of service.7 Geographic variations in surgical care have been studied extensively in Canada and internationally,21–25 with some focusing on specific surgery types (e.g., cardiac,26,27 orthopaedic28–30) while others show comparisons across a broad range of surgical categories.23,25,31 It is important to note that not all variation is necessarily bad,23 as particular circumstances of each health care system must be considered. It is clear, though, that the large body of research on the subject reflects, in part, the crucial policy implications of variations in care, including resource allocation decisions.
Regionalization, or centralization, of health services is the provision of health care at a limited number of provider sites;1 by concentrating resources at fewer locations, it is believed that the health care system can reduce waiting, increase quality and realize cost savings by avoiding duplication of capital resources and highly trained personnel.2,3 By allowing a few sites to specialize in a health care service, coordination of care can improve4 and provider experience can increase,5,6 arguably leading to better health care system quality and health outcomes for patients. For example, regionalization can be particularly beneficial in the area of surgical care. Specialized equipment and highly trained personnel requirements indicate that surgery is potentially well-suited to realize gains in performance and efficiency through regionalization. In an early study, Luft et al.5 hypothesized that the quality of care improves with experience across a range of surgical procedures. Results suggested a link between increased regionalization and lower mortality rates. Since this seminal work, researchers have undertaken in-depth studies of specific types of surgeries including cardiac,6–9 cancer,10–12 vascular,13,14 neurosurgery,15 and orthopaedics.16–20
STUDY OBJECTIVE: COMPARING MODELS OF SURGICAL CARE IN THE MARITIMES To date, variation in surgery types has not been studied in NS or PEI, and few studies have examined variation in surgery rates in NB. While the three provinces are close in geography, each offers slightly different models in the provision of surgical care. Small geography, an aging population, and a reliance on interprovincial resources to provide services to patients present a unique opportunity to study variation in surgical rates in the Maritimes. The objective of this descriptive study was to, within each province, compare rates across geography and over time of a regionalized surgical service – coronary artery bypass graft or CABG – with those of major orthopaedic surgeries (i.e., hip and knee replacements), which are offered at numerous hospitals across the Maritime provinces. Each of the three types of surgery selected for this research have been categorized as “clinically effective”23 and are all procedures targeted by Canada’s first ministers as wait-time reduction priorities.32

8 8 8
GEOGRAPHICAL REGIONS AND HOSPITAL LOCATIONS IN THE MARITIME PROVINCES
New Brunswick is the eighth most populous (756,800 in 2012),33 as well as the eight largest by landmass, of Canadian provinces. The NB health care system is organized into seven Health Zones that correspond to the larger population centres of the province and surrounding areas, and two regional health authorities (RHAs) serving communities of anglophone and francophone majority. Cardiac surgical care is centralized at one location: the New Brunswick Heart Centre located in the Saint John Regional Hospital (SJRH). Hip and knee replacement surgeries are offered at ten hospitals in NB, including the SJRH and the Moncton Hospital.
Nova Scotia is the seventh most populous Canadian province (944,500 in 2012)33 and ninth in landmass. For the period under study, the health care system was organized into nine geographic District Health Authorities (DHAs), along with the IWK Health Centre for women and children. (This changed on April 1, 2015 with the amalgamation of the nine geographic DHAs). While the provincial government was ultimately responsible for overall administration (including resource allocation and maintaining provincial standards), prior to the amalgamation in 2015, each DHA provided region-specific policies and governance in the administration of health services and population health interventions. In NS, CABG is offered in one location, at the Queen Elizabeth II Health Centre (QEII) in Halifax. Hip and knee replacement surgeries are undertaken at the QEII and in hospitals in Dartmouth, Sydney, New Glasgow, Kentville, and Halifax.
Prince Edward Island is the smallest province in Canada in terms of population (145,300 in 2012)33 and landmass. It has seven acute care hospitals administered by Health PEI since 2010. In 2005, administration was transferred from four district health authorities to the Department of Health. Hip and knee replacement surgeries are provided at the Queen Elizabeth Hospital in Charlottetown, the only site offering these services in the province.

9
THE STUDYSTUDY POPULATION AND TIMEFRAME The Canadian Institute for Health Information (CIHI) Discharge Abstract Database (DAD) was utilized to identify adults aged 18 years and older who had a CABG or hip/knee replacement surgery with a hospital discharge between April 1, 2001 and March 31, 2013.
ESTABLISHED DEFINITIONSSurgery types were determined using the Canadian Classification of Health Interventions procedure codes (CCI) as developed by CIHI34; CABG was coded as 1.IJ.76.xx, hip replacement as 1.VA.53.xx and knee replacement as 1.VG.53.xx. Annual population data stratified by age and sex were obtained from Statistics Canada.35 – 37
POPULATION ESTIMATES FOR GEOGRAPHIC AREASThe forward sortation area, the first three letters of postal codes, was used to determine patient region of residence. To provide meaningful geographical units of variation, regions were divided into Health Zones for NB and District Health Authorities for NS. As PEI’s separate health authorities were dissolved in 2005, geography was divided into two urban and two rural regions corresponding to Summerside and Charlottetown areas, and Prince and Queens/Kings areas, respectively. Region-, age- and sex-specific population estimates for NB and NS were obtained directly from Statistics Canada36 and estimated from published Statistics Canada census tables for PEI.
ANALYSISFor each the three types of surgery, counts were obtained for the entire adult population of each province for each year, region, age and sex stratum. Direct standardization was used to adjust overall and sex-specific annual rates of each surgery (per 1000) to the age and sex distribution of the 2011 total Maritime population36. Provincial age- and sex-adjusted rates were plotted over time by surgical procedure. For each province, these rates were aggregated over four-year intervals by provincial region and mapped using geographic information system software.

10
FINDINGScare). In general, procedures with the highest degree of variation are those that are the most discretionary (i.e., have the most disagreement among health care professionals regarding their indication for treatment31,45). Of procedures studied, the smallest net change in provincial surgical utilization rates between 2001 and 2012 were for hip surgeries in NS and PEI, and CABG in NB.
2) Rates of cardiac surgery were higher for men, while those of orthopaedic surgeries were higher for women.
In general, age-adjusted CABG rates were more than three- to five-times higher for men than for women in both NB and NS. The reverse was mostly true, though, when looking at hip and knee surgery rates, with women having higher rates across all three Maritime provinces. Hip replacement rates were approximately 50% higher for NB and NS women. The same trend was observed for knee replacement surgeries though the difference between men and women was not as large. In PEI, hip replacement surgery rates were roughly equal for men and women in 2005 and those for knee surgeries for men were equal to or higher than those for women in 2001, 2003, 2005, and 2010. Sex differences in cardiac and orthopaedic surgery rates are not unique to Maritime provinces. During the study period, Canadian men were more likely to be hospitalized for cardiovascular disease, and rates of CABG for these patients were comparably higher across all provinces.46 In addition to lower rates, women tend to manifest more severe cardiovascular disease later in life, perhaps reducing their candidacy for surgery relative to younger men.47 From 2006 through 2011, national rates of hip and knee replacement surgeries were found to be just over 15% and 30% higher for women, respectively.48 This may be attributed to increased rates of arthritis in women versus men49, resulting in sex-related differences in aging that necessitate more joint replacement surgeries for women.
1) Rates of cardiac surgery were fairly stable over time, while those of orthopaedic surgeries have increased steadily.
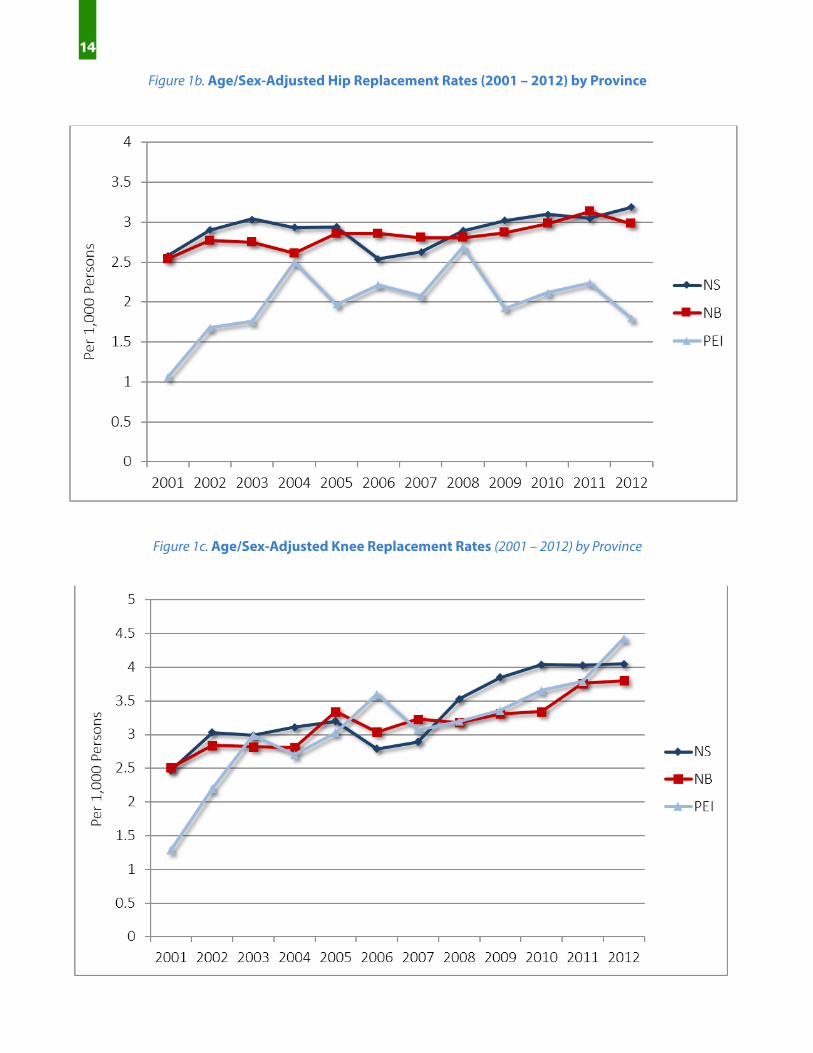
Tables 1a - 1c (see pages 11) present the total counts of each surgery type by province, from 2001 to 2012 fiscal years, inclusive. The number of CABG surgeries has remained steady or declined slightly over time, while the orthopaedic surgery numbers rose over the same timeframe. Overall and sex-specific adjusted rates per 1,000 people are presented in Table 2a (CABG)(see page 12), Table 2b (hip replacement) (see page 12), and Table 2c (knee replacement) (see page 13). Linear trends in overall adjusted rates by region are presented in Figure 1a (CABG) (see page 13), Figure 1b (hip replacement) (see page 14) and Figure 1c (knee replacement) (see page 14).
Age-standardized rates of CABG declined over the period in NS, while rates in NB stayed relatively constant until 2008 and then declined thereafter. This decreasing trend is consistent with national studies38,39 and likely reflects greater use of percutaneous coronary interventions.40 In contrast, age-standardized rates for both hip and knee replacements increased over the study period for all three provinces. (As Figures 1b and 1c show (see page 11), PEI appears to follow similar trends over time to those for NS and NB, though the smaller number of surgeries results in greater year-over-year variation.) These trends reflect similar increases in joint replacements seen in Canada39 and around the world41 and are likely attributable to an aging population, rising obesity and a growing recognition of the effectiveness of these procedures.41–44
There are multiple factors that may determine the degree to which rates of surgical procedures fluctuate over time. One possibility is that the indications for CABG are less open to interpretation and therefore less discretionary than those for hip and knee procedures (criteria for discretionary status consist of the degree of necessity, the level of agreement about indicators, and number of alternative options for

Table 1a. Total Counts of Selected Surgeries Performed in NS (2001 - 2012)
Table 1b. Total Counts of Selected Surgeries Performed in NB (2001 – 2012)
11
Cardiac SurgeryYear CABG Hip Replacement Knee Replacement2001 1050 967 8812002 1032 1103 10952003 1092 1192 11172004 887 1184 11972005 838 1215 12602006 791 1080 11242007 770 1109 11782008 696 1252 14722009 665 1342 16542010 622 1406 17702011 635 1398 18162012 673 1499 1872Total 9751 14747 16436
Orthopaedic Surgeries
Note: Individuals may be counted more than once
Cardiac Surgery
Year CABG Hip Replacement Knee Replacement2001 556 806 7532002 557 889 8682003 579 914 8852004 539 888 9102005 549 972 11002006 536 993 10152007 546 997 11032008 612 1025 11342009 609 1040 11872010 582 1134 12312011 551 1197 14372012 540 1174 1497
Total 6756 12029 13120Note: Individuals may be counted more than once
Orthopaedic Surgeries
Table 1c. Total Counts of Selected Surgeries Performed in PEI (2001 – 2012)
Year Hip Replacement Knee Replacement2001 60 712002 100 1242003 111 1702004 140 1612005 120 1892006 141 2312007 142 1972008 167 2142009 130 2182010 139 2542011 158 2542012 174 309
Total 1582 2395
Orthopaedic Surgeries
Note: Individuals may be counted more than once

12
Table 2b. Age/Sex-Adjusted Hip Replacement Rates (2001 – 2012) by Province
Year Overall¥ Female£ Male£ Overall¥ Female£ Male£ Overall¥ Female£ Male£
2001 2.58 3.12 1.97 2.54 2.96 2.07 1.06 1.16 0.952002 2.90 3.57 2.17 2.77 3.25 2.23 1.68 1.85 1.492003 3.04 3.63 2.39 2.75 3.37 2.08 1.76 1.89 1.612004 2.93 3.46 2.33 2.61 3.00 2.19 2.50 2.57 2.422005 2.94 3.49 2.34 2.86 3.42 2.25 1.97 1.96 1.972006 2.54 3.05 1.98 2.86 3.39 2.27 2.21 2.48 1.922007 2.63 2.96 2.26 2.80 3.24 2.32 2.08 2.34 1.802008 2.89 3.29 2.44 2.80 3.31 2.23 2.69 2.98 2.382009 3.02 3.60 2.38 2.87 3.36 2.34 1.92 2.14 1.682010 3.10 3.50 2.66 2.98 3.48 2.42 2.12 2.14 2.092011 3.05 3.46 2.60 3.13 3.73 2.48 2.24 2.55 1.902012 3.19 3.64 2.70 2.98 3.41 2.51 1.79 1.84 1.74
£Age-standardized, 2011 Maritime population
Nova Scotia New Brunswick Prince Edward Island
≥45 years, per 1,000 population¥Age and sex-standardized, 2011 Maritime population
Table 2a. Age/Sex-Adjusted CABG Rates (2001 – 2012) by Province
Year Overall¥ Female£ Male£ Overall¥ Female£ Male£
2001 2.92 1.28 4.72 1.77 0.71 2.842002 2.78 1.39 4.30 1.67 0.60 2.792003 2.89 1.32 4.63 1.75 0.60 2.932004 2.30 0.99 3.74 1.72 0.65 2.802005 2.13 0.79 3.61 1.74 0.70 2.762006 1.95 0.77 3.24 1.64 0.65 2.662007 1.87 0.81 3.05 1.61 0.69 2.542008 1.65 0.81 2.57 1.78 0.61 2.962009 1.53 0.61 2.56 1.70 0.71 2.712010 1.40 0.64 2.23 1.59 0.53 2.632011 1.41 0.53 2.39 1.44 0.56 2.322012 1.45 0.65 2.33 1.35 0.44 2.22
£Age-standardized, 2011 Maritime population
Nova Scotia New Brunswick
≥45 years, per 1,000 population¥Age and sex-standardized, 2011 Maritime

13
Table 2c. Age/Sex-Adjusted Knee Replacement Rates (2001 – 2012) by Province
Year Overall¥ Female£ Male£ Overall¥ Female£ Male£ Overall¥ Female£ Male£
2001 2.47 2.67 2.17 2.51 2.71 2.28 1.29 1.27 1.322002 3.03 3.29 2.68 2.84 3.05 2.62 2.20 2.32 2.082003 2.99 3.20 2.70 2.82 3.10 2.51 2.99 2.87 3.132004 3.11 3.37 2.78 2.81 3.02 2.57 2.70 3.06 2.312005 3.20 3.47 2.87 3.34 3.67 2.97 3.03 2.87 3.212006 2.79 3.17 2.32 3.04 3.35 2.69 3.60 4.08 3.082007 2.89 3.02 2.70 3.23 3.59 2.83 3.07 3.18 2.942008 3.53 3.81 3.16 3.18 3.50 2.83 3.20 3.92 2.412009 3.85 4.16 3.47 3.31 3.74 2.84 3.36 3.96 2.692010 4.04 4.32 3.68 3.34 3.76 2.89 3.66 3.25 4.102011 4.03 4.45 3.50 3.76 4.47 2.98 3.79 4.85 2.622012 4.05 4.59 3.39 3.80 4.40 3.14 4.43 5.03 3.76
Prince Edward Island
£Age-standardized, 2011 Maritime population
≥45 years, per 1,000 population¥Age and sex-standardized, 2011 Maritime population
Nova Scotia New Brunswick
Figure 1a. Age/Sex-Adjusted CABG Rates (2001 – 2012) by Province
14
Figure 1c. Age/Sex-Adjusted Knee Replacement Rates (2001 – 2012) by Province
Figure 1b. Age/Sex-Adjusted Hip Replacement Rates (2001 – 2012) by Province

15
3) There are within-province differences in the variation of surgical rates by region
Figures 2a – 2c (see on page 15 and 16) present the variation in rates across the NS DHAs calculated for three intervals (2001-2004; 2005-2008; and 2009-2012) over the study period. Over time, CABG showed the least amount of variation across regions, while knee replacement had the highest. One region, Cumberland DHA, had very low rates of both hip and knee replacement surgeries for the entire study period. Cumberland is unique in that it is the only DHA in NS which shares a land border with another province (NB).
Figure 2a.CABG Rates for Nova Scotia over time Figure 2b.Hip Replacement Rates for Nova Scotia over time

16
Adjusted rates by geographical region are similarly presented in Figures 2d – 2f (see figures on page 17) for NB. Variation was quite pronounced across the seven Health Zones. For CABG, there was indication of markedly lower rates for patients living in Edmundston (and to a lesser extent, Campbellton); this may be attributed to a similar scenario seen with the Cumberland NS DHA – that some northern NB patients opted for surgery in Quebec rather than in NB.
Overall, rates of hip surgeries were less variable across the province relative to those for knee. Despite the presence of local hospitals that perform hip and knee surgeries in all NB DHAs, northern-most regions still had lower rates of these procedures, suggesting the possibility that, like CABG, some northern NB residents receive the joint replacement surgery in Quebec. Saint John and Fredericton were observed to have the highest rates of knee replacement surgery, while Edmundston and Bathurst had the lowest. Similarly, Saint John and Fredericton consistently had the highest rates of hip surgery, while Bathurst had the lowest rates behind Campbelton and Edmundston.
Figure 2c.Knee Replacement Rates for Nova Scotia over time

17
Figure 2d. CABG Rates for New Brunswick over time Figure 2e. Hip Replacement Rates for New Brunswick over time
Figure 2f. Knee Replacement Rates for New Brunswick over time
18
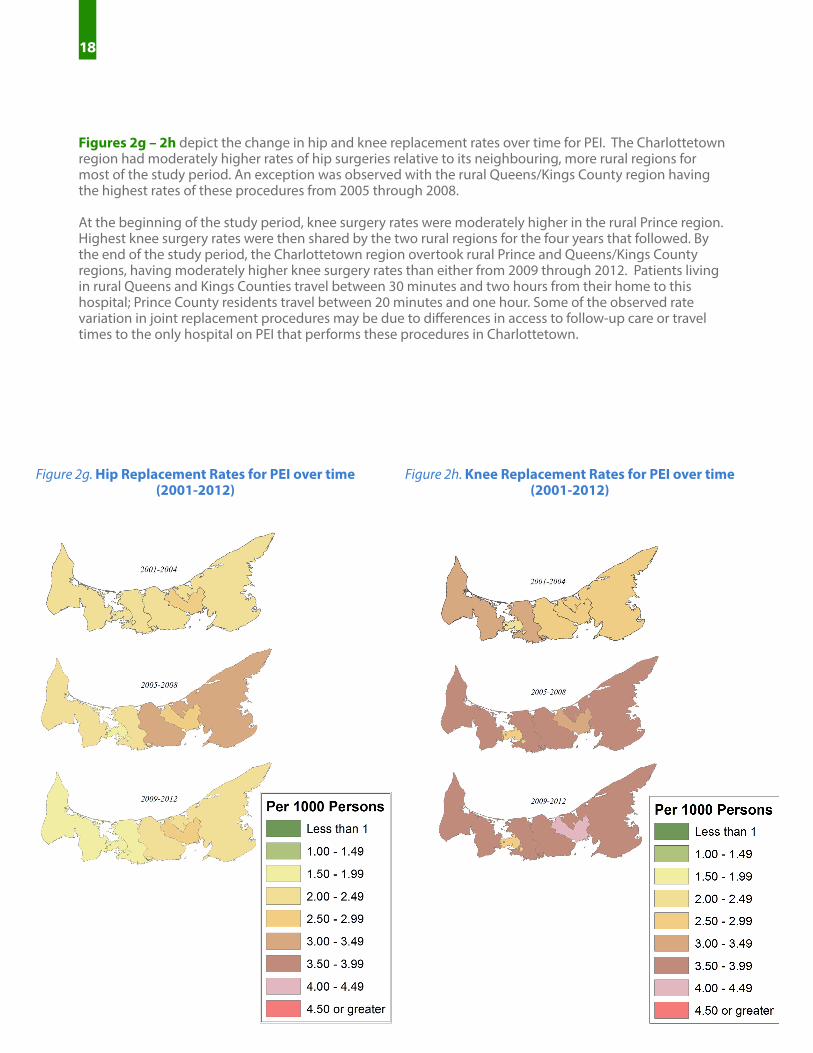
Figures 2g – 2h depict the change in hip and knee replacement rates over time for PEI. The Charlottetown region had moderately higher rates of hip surgeries relative to its neighbouring, more rural regions for most of the study period. An exception was observed with the rural Queens/Kings County region having the highest rates of these procedures from 2005 through 2008.
At the beginning of the study period, knee surgery rates were moderately higher in the rural Prince region. Highest knee surgery rates were then shared by the two rural regions for the four years that followed. By the end of the study period, the Charlottetown region overtook rural Prince and Queens/Kings County regions, having moderately higher knee surgery rates than either from 2009 through 2012. Patients living in rural Queens and Kings Counties travel between 30 minutes and two hours from their home to this hospital; Prince County residents travel between 20 minutes and one hour. Some of the observed rate variation in joint replacement procedures may be due to differences in access to follow-up care or travel times to the only hospital on PEI that performs these procedures in Charlottetown.
Figure 2g. Hip Replacement Rates for PEI over time (2001-2012)
Figure 2h. Knee Replacement Rates for PEI over time(2001-2012)

19
This report describes regional variation in the utilization of three surgical procedures and demonstrates the potential for highly relevant, coordinated interprovincial Maritime-driven health services research. As such, it meets the expectations established at the outset of the project. There are important limitations. First, we were unable to obtain yearly age- and sex-specific population estimates by PEI region. These were interpolated from 2001, 2006 and 2011 Statistics Canada data. Increased random variation from a smaller number of surgeries combined with less accurate population estimates may have reduced the precision of age- and sex-adjusted rates for PEI, relative to the other two provinces. Second, while analyses were grounded in small area rate variation methodology, no statistical tests or measures of variation were reported. There are numerous statistics of variation recommended in the literature, yet most do not intuitively convey area-based differences. Of the most intuitive that directly compare rates, the extremal quotient –rate from the region with highest utilization divided by the rate from that of the lowest– is relatively insensitive in discerning degree of variability. Furthermore, the visual comparison afforded by the geographical maps in Figure 4 provide an accessible as well as impactful means of demonstrating intraprovincial variation in Maritime surgery utilization. Third, surgery utilization of patients residing in neighboring provinces was not considered. As such we were unable to include CABG utilization statistics for PEI. In addition, including regional utilization data from southern Quebec regions would have provided greater insight into the finding of lower surgery rates in bordering NB regions. Interprovincial health services utilization will be considered for future projects.
LIMITATIONS

20
Some of the types of factors known to affect health care provision include need for the service, supply (i.e., amount and allocation of resources, hospital locations50, number of physicians51-53) and provider decision-making.54 Provider decision-making has been frequently cited as having the most influence on systematic variation of heath care service.55-57 Uncertainty in health care leads to differing opinions as to the best course of treatment even within set guidelines23,58 (though the implementation of practice guidelines continues to provide updated, effective tools in reducing variation across regions22,59).
Centralizing services and the resulting differences in distance to care, for example, has been shown to affect care provision.28,42,60 The Maritime provinces are a particularly interesting region to study this issue because: 1) interprovincial transport is common, particularly from PEI to NB or NS. PEI ambulances spend much time off the island in this activity, slowing emergency response times; 2) in contrast to other provinces, all residents have road access to a hospital; and 3) there are a relatively small number of tertiary care service providers.
It is essential to understand how patients are affected by the geographical organization of surgical care. Centralization of services can affect a quality/access tradeoff whereby increased specialization may result in improved outcomes while also increasing the distance to care for some. This study additionally found indications of Maritime patients seeking surgical care out of province, even when the procedure was offered in their province of residence. Research has indicated patients requiring surgeries prefer a hospital closer to home61-63 even if that choice leads to a longer wait.60 The potential for Maritime residents to opt for surgical procedures in a facility closer to home, even if in another province, warrants further investigation of localized interprovincial transfer fiscal sustainability and the impact of such care models on patient outcomes.
NEXT STEPSThis descriptive study of three surgery types – CABG, hip replacement, and knee replacement – indicates that there were systematic differences in age/sex-adjusted rates over the 2001-2012 period within each of the Maritime provinces based on the geographic regions where individuals lived.
21
1. Gordon TA, Burleyson GP, Tielsch JM, Cameron JL. The effects of regionalization on cost and outcome for one general high-risk surgical procedure. Ann Surg. 1995;221(1):43-49.
2. Menke TJ, Wray NP. When does regionalization of expensive medical care save money? Health Serv Manage Res. 2001;14(2):116-124. doi:10.1258/0951484011912618.
3. Porter ME, Teisberg EO. Redefining Health Care: Creating Value-based Competition on Results. Harvard Business Press; 2006.
4. Lorch SA, Myers S, Carr B. The Regionalization of Pediatric Health Care. Pediatrics. 2010;126(6):1182-1190. doi:10.1542/peds.2010-1119.
5. Luft H, Bunker J, Enthoven A. Should operations be regionalized? The empirical relation between surgical volume and mortality. N Engl J Med. 1979;301(25):1364-1369.
6. Hemmelgarn BR, Ghali WA, Quan H. A case study of hospital closure and centralization of coronary revascularization procedures. Can Med Assoc J. 2001;164(10):1431-1435.
7. Grumbach K, Anderson GM, Luft HS, Roos LL, Brook R. Regionalization of cardiac surgery in the united states and canada: Geographic access, choice, and outcomes. JAMA. 1995;274(16):1282-1288. doi:10.1001/jama.1995.03530160034030.
8. Nozohoor S, Gustafsson R, Kallonen J, Sjögren J. Midterm Results of Surgery for Adults with Congenital Heart Disease Centralized to a Swedish Cardiothoracic Center. Congenit Heart Dis. 2013;8(4):273–280. doi:10.1111/chd.12000.
9. Trogdon JG. Demand for and Regulation of Cardiac Services*. Int Econ Rev. 2009;50(4):1183–1204. doi:10.1111/j.1468-2354.2009.00565.x.
10. Lowrance WT. Surgical Margins Following Urological Cancer Surgery and Clinical Outcomes—Does the United States Need Regional Centralization of Cancer Care? J Urol. 2010;183(6):2126–2127.
11. Stitzenberg KB, Sigurdson ER, Egleston BL, Starkey RB, Meropol NJ. Centralization of Cancer Surgery: Implications for Patient Access to Optimal Care. J Clin Oncol. 2009;27(28):4671-4678. doi:10.1200/ JCO.2008.20.1715.
12. Learn PA, Bach PB. A decade of mortality reductions in major oncologic surgery: the impact of centralization and quality improvement. Med Care. 2010;48(12):1041–1049.
13. Thompson M, Holt P, Loftus I. Part one: All major arterial interventions should now be performed in high volume centres–abdominal aortic aneurysms. Eur J Vasc Endovasc Surg. 2011;42(4):411–414.
14. Forbes TL. Part two: the case against centralisation of abdominal aortic aneurysm surgery in higher volume centers. Eur J Vasc Endovasc Surg. 2011;42(4):414–417.
15. Barker FG, Curry WT, Carter BS. Surgery for primary supratentorial brain tumors in the United States, 1988 to 2000: The effect of provider caseload and centralization of care. Neuro-Oncol. 2005;7(1):49-63. doi:10.1215/S1152851704000146.
REFERENCES

22
17. Solomon DH, Chibnik LB, Losina E, et al. Development of a preliminary index that predicts adverse events after total knee replacement. Arthritis Rheum. 2006;54(5):1536–1542.
18. Norton EC, Garfinkel SA, McQuay LJ, et al. The effect of hospital volume on the in-hospital complication rate in knee replacement patients. Health Serv Res. 1998;33(5 Pt 1):1191-1210.
19. Roos NP, Lyttle D. The centralization of operations and access to treatment: total hip replacement in Manitoba. Am J Public Health. 1985;75(2):130–133.
20. Marlow NE, Barraclough B, Collier NA, et al. Centralization and the relationship between volume and outcome in knee arthroplasty procedures. ANZ J Surg. 2010;80(4):234–241.
21. Blais R. Variations in surgical rates in Quebec: Does access to teaching hospitals make a difference? CMAJ Can Med Assoc J. 1993;148(10):1729.
22. Reames BN, Shubeck SP, Birkmeyer JD. Strategies for Reducing Regional Variation in the Use of Surgery: A Systematic Review. Ann Surg April 2014. 2014;259(4):616-627. doi:10.1097/SLA.0000000000000248.
23. Appleby, J, Raleigh, V, Frosini, F, Bevan, B, Gao,H, Lyscum, T. Variations in health care The good, the bad and the inexplicable. 2011. Available at: http://www.kingsfund.org.uk/publications/variations-health- care.
24. Urbach DR. Closing in on Surgical Practice Variations. Ann Surg. 2014;259(4):628–629.
25. Ibáñez B, Librero J, Bernal-Delgado E, et al. Is there much variation in variation? Revisiting statistics of \small area variation in health services research. BMC Health Serv Res. 2009;9(1):60.
26. Dartmouth Atlas. Dartmouth Atlas of Health Care: Studies of Surgical Variation. Cardiac Surgery Report. 2007. Available at: http://www.dartmouthatlas.org/downloads/reports/Cardiac_report_2005.pdf.
27. Stover PE, Siegel LC, Parks R, et al. Variability in Transfusion Practice for Coronary Artery Bypass Surgery Persists Despite National Consensus Guidelines: A 24-Institution Study. Anesthesiology. 1998;88(2):327– 333.
28. Dartmouth Atlas. Dartmouth Atlas Project: Preference-Sensitive Care. 2007. Available at: www.dartmouthatlas.org.
29. Judge A, Welton NJ, Sandhu J, Ben-Shlomo Y. Geographical variation in the provision of elective primary hip and knee replacement: the role of socio-demographic, hospital and distance variables. J Public Health. 2009;31(3):413–422.
30. Coyte PC, Hawker G, Wright JG. Variations in knee replacement utilization rates and the supply of health professionals in Ontario, Canada. J Rheumatol. 1996;23(7):1214.
31. Gentleman J, Vayda E, Parsons GF, Walsh MN. Surgical rates in subprovincial areas across Canada: rankings of 39 procedures in order of variation. Can J Surg. 1996;39(5):361–367.
32. Canadian Institute for Health Information. Wait Times in Canada - A Comparison by Province, 2011. 2011.
33. Statistics Canada. Population by year, by province and territory. (CANSIM Table 051-0001). Available at: http://www.statcan.gc.ca/tables-tableaux/sum-som/l01/cst01/demo02a-eng.htm. Accessed June 13, 2016.
23
34. Canadian Institute for Health Information. Classification and Coding. 2014. Available at: http:// www.cihi.ca/cihi-ext-portal/internet/en/tabbedcontent/standards+and+data+submission/standards/ classification+and+coding/cihi010689.
35. Province of Nova Scotia. Community Counts Nova Scotia. 2010. Available at: http://www.novascotia.ca/ finance/communitycounts/. Accessed March 27, 2014.
36. Statistics Canada. Estimates of population (2011 Census and administrative data), by age group and sex for July 1st, Canada, provinces, territories, health regions (2013 boundaries) and peer groups. (CANSIM Table 109-5335). Available at: http://www5.statcan.gc.ca/cansim/a26?lang=eng&retrLang=eng&id=1095 335&&pattern=&stByVal=1&p1=1&p2=-1&tabMode=dataTable&csid=
37. Statistics Canada Census of Canada Data for PEI (“2001 Census. Catalogue Number 95F0300XCB2001005; 2006 Census. Catalogue Number 97-551-XCB2006010; Statistics Canada - 2011 Census. Catalogue Number 98-311-XCB2011022.)
38. Sibbald B. Declining CABG rate means fewer jobs for surgeons. Can Med Assoc J. 2005;173(6):583–584.
39. Canadian Institute for Health Information. Health Indicators Interactive Tool. 2014. Available at: http:// www.cihi.ca/hirpt/?language=en.
40. Hassan A, Newman A, Ko DT, et al. Increasing rates of angioplasty versus bypass surgery in Canada, 1994- 2005. Am Heart J. 2010;160(5):958–965.
41. Kurtz SM, Ong KL, Lau E, et al. International survey of primary and revision total knee replacement. Int Orthop. 2011;35(12):1783–1789.
42. Judge A, Welton NJ, Sandhu J, Ben-Shlomo Y. Equity in access to total joint replacement of the hip and knee in England: cross sectional study. BMJ. 2010;341. Available at: http://www.ncbi.nlm.nih.gov/pmc/ articles/PMC2920379/. Accessed March 27, 2014.
43. Kurtz S, Mowat F, Ong K, Chan N, Lau E, Halpern M. Prevalence of primary and revision total hip and knee arthroplasty in the United States from 1990 through 2002. J Bone Jt Surg. 2005;87(7):1487–1497.
44. Carr AJ, Robertsson O, Graves S, et al. Knee replacement. The Lancet. 2012;379(9823):1331–1340.
45. Birkmeyer JD, Sharp SM, Finlayson SR, Fisher ES, Wennberg JE. Variation profiles of common surgical procedures. Surgery. 1998;124(5):917–923.
46. Public Health Agency of Canada. Tracking heart disease and stroke in Canada. 2009. Retrieved from: http://www.phac-aspc.gc.ca/publicat/2009/cvd-avc/index-eng.php
47. Statistics Canada. Revascularization and heart attack outcomes. Health Reports. 2002 Jan; 13(2).
48. Canadian Institute for Health Information. Hip and Knee Replacements in Canada: Canadian Joint Replacement Registry 2013 Annual Report. Ottawa, ON: CIHI; 2013.
49. The Arthritis Society. Arthritis Facts and Figures. (2016). Retrieved from: http://arthritis.ca/understand- arthritis/arthritis-facts-figures
50. Lin G, Allan DE, Penning MJ. Examining distance effects on hospitalizations using GIS: a study of three health regions in British Columbia, Canada. Environ Plan A. 2002;34(11):2037–2054.

24
51. Alter DA, Naylor CD, Austin PC, Chan BT, Tu JV. Geography and service supply do not explain socioeconomic gradients in angiography use after acute myocardial infarction. Can Med Assoc J. 2003;168(3):261–264.
52. Wijeysundera HC, Stukel TA, Chong A, Natarajan MK, Alter DA. Impact of clinical urgency, physician supply and procedural capacity on regional variations in wait times for coronary angiography. BMC Health Serv Res. 2010;10(1):5. Replacement Registry 2013 Annual Report. Ottawa, ON: CIHI; 2013.
53. Fisher ES, Wennberg JE. Health care quality, geographic variations, and the challenge of supply-sensitive care. Perspect Biol Med. 2003;46(1):69–79.
54. Ham C. Health care variations. Assessing the evidence. 1988.
55. McPherson K, Downing A, Buirski D. Systematic variation in surgical procedures and hospital admission rates. PHP Dep Publ. 1996.
56. Davis P, Gribben B, Scott A, Lay-Yee R. The “supply hypothesis” and medical practice variation in primary care: testing economic and clinical models of inter-practitioner variation. Soc Sci Med. 2000;50(3):407– 418.
57. Bevan G, Hollinghurst S, Benton P, Spark V, Sanderson H, Franklin D. Using information on variation in rates of supply to question professional discretion in public services. Financ Account Manag. 2004;20(1):1–17.
58. Wennberg DE. Variation in the delivery of health care: the stakes are high. Ann Intern Med. 1998;128(10):866–868.
59. Taggart DP. CABG in 2012: Evidence, practice and the evolution of guidelines. Glob Cardiol Sci Pract. 2012;2012(2). Available at: http://search.ebscohost.com/login.
60. Birk HO, Henriksen LO. Why do not all hip-and knee patients facing long waiting times accept re-referral to hospitals with short waiting time?: Questionnaire study. Health Policy. 2006;77(3):318–325.
61. Finlayson M, Lix L, Finlayson GS, Fong T. Trends in the Utilization of Specific Health Care Services among Older Manitobans: 1985 to 2000. Can J Aging Rev Can Vieil. 2005;24(Supplement S1):15-27. doi:10.1353/ cja.2005.0046.
62. FitzGerald JD, Soohoo NF, Losina E, Katz JN. Potential impact on patient residence to hospital travel distance and access to care under a policy of preferential referral to high-volume knee replacement hospitals. Arthritis Care Res. 2012;64(6):890–897.
63. Vrangbæk K, Østergren K, Birk HO, Winblad U. Patient reactions to hospital choice in Norway, Denmark, and Sweden. Health Econ Policy Law. 2007;2(02):125-152. doi:10.1017/

25
The Maritime SPOR SUPPORT Unit (MSSU) is one of several SUPPORT Units across Canada, bringing health research findings to life by helping to integrate them into patient care.
We engage with patients from across New Brunswick, Nova Scotia, and Prince Edward Island, and collaborate with the research community on governance, priority setting, and the planning and conducting of research. Through this meaningful and active collaboration, we contribute to an enhanced health system, engaged health research, and improved health outcomes. We are dedicated to supporting patient-oriented research and decision-making that will reflect the needs and values of Maritime patients.
The MSSU and other Support for People and Patient-Oriented Research and Trials (SUPPORT) Units across Canada are administered by SPOR, the Strategy for Patient-Oriented Research. SPOR, a Canadian Institutes of Health Research (CIHR) initiative, is focused on integrating health research more effectively into care.
WWW.MSSU.CA
@MARITIMESPOR