Embed Size (px)
Citation preview

PutnamVariable TrustSemiannual report 6 | 30 | 17
Putnam VT Investors Fund

Message from the TrusteesAugust 11, 2017
Dear Shareholder:
A fair amount of investor optimism has helped to fuel financial markets in 2017, and global stock and bond markets have generally fared well. At the same time, however, a number of macroeconomic and political risks around the world could disrupt the positive momentum.
While calm markets are generally welcome, we believe investors should continue to remember time-tested strategies: maintain a well-diversified portfolio, keep a long-term view, and speak regularly with your financial advisor. In the following pages, you will find a summary of your fund’s performance for the reporting period.
We would like to take this opportunity to announce some changes to your fund’s Board of Trustees. First, we are pleased to welcome the arrival of Catharine Bond Hill and Manoj P. Singh, who bring extensive professional and directorship experience to their new roles as Putnam Trustees. In addition, we would like to extend our appreciation and best wishes to Robert J. Darretta, John A. Hill, and W. Thomas Stephens, who retired from the Board, effective June 30, 2017. We are grateful for their years of work on behalf of you and your fellow shareholders, and we wish them well in their future endeavors.
Thank you for investing with Putnam.
Respectfully yours,
Robert L. ReynoldsPresident and Chief Executive OfficerPutnam Investments
Jameson A. BaxterChair, Board of Trustees
The views expressed in this report are exclusively those of Putnam Management and are subject to change. They are not meant as investment advice. Please note that the holdings discussed in this report may not have been held by the fund for the entire period. Portfolio composition is subject to review in accordance with the fund’s investment strategy and may vary in the future.
Consider these risks before investing: Growth stocks may be more susceptible to earnings disappointments, and value stocks may fail to rebound. Stock prices may fall or fail to rise over time for several reasons, including general financial market conditions and factors related to a specific issuer or industry. You can lose money by investing in the fund.

Putnam VT Investors Fund 1
Portfolio composition
Allocations are shown as a percentage of the fund’s net assets. Cash and net other assets, if any, represent the market value weights of cash, derivatives, short-term securities, and other unclassified assets in the portfolio. Summary information may differ from the portfolio schedule included in the financial statements due to the inclusion of derivative securities, any interest accruals, the exclusion of as-of trades, if any, the use of different classifications of securi-ties for presentation purposes, and rounding. Holdings and allocations may vary over time.
13.4% Consumer discretionary
9.1% Industrials
2.7% Materials
7.0% Consumer staples
22.9% Information technology
18.2% Financials
6.0% Energy
2IO Investors Fund
2.1% Telecommunication services
14.1% Health care
2.0% Real estate
0.5% Cash and net other assets
2.0% Utilities
Performance summary (as of 6/30/17)
Investment objectiveLong-term growth of capital and any increased income that results from this growth
Net asset value June 30, 2017
Class IA: $18.00 Class IB: $17.94
Total return at net asset value
(as of 6/30/17) Class IA shares* Class IB shares*S&P 500Index
6 months 7.71% 7.57% 9.34%
1 year 21.02 20.69 17.90
5 years 97.11 94.63 97.92
Annualized 14.54 14.25 14.63
10 years 76.51 72.16 100.08
Annualized 5.85 5.58 7.18
Life 137.49 127.08 212.96
Annualized 4.62 4.37 6.13
For a portion of the periods, the fund had expense limitations, without which returns would have been lower.
* Class inception date: April 30, 1998.
The S&P 500 Index is an unmanaged index of common stock performance.
Data represent past performance. Past performance does not guarantee future results. More recent returns may be less or more than those shown. Investment return and principal value will fluctuate, and you may have a gain or a loss when you sell your shares. Performance information does not reflect any deduction for taxes a shareholder may owe on fund distributions or on the redemption of fund shares. All total return figures are at net asset value and exclude contract charges and expenses, which are added to the variable annuity contracts to determine total return at unit value. Had these charges and expenses been reflected, performance would have been lower. For more recent performance, contact your variable annuity provider who can provide you with performance that reflects the charges and expenses at your contract level.

2 Putnam VT Investors Fund
Understanding your fund’s expenses
As an investor in a variable annuity product that invests in a registered investment company, you pay ongoing expenses, such as manage-ment fees, distribution fees (12b-1 fees), and other expenses. Using the following information, you can estimate how these expenses affect your investment and compare them with the expenses of other funds. You may also pay one-time transaction expenses, which are not shown in this section and would result in higher total expenses. Charges and expenses at the insurance company separate account level are not reflected. For more information, see your fund’s prospectus or talk to your financial representative.
Review your fund’s expensesThe two left-hand columns of the Expenses per $1,000 table show the expenses you would have paid on a $1,000 investment in your fund from 1/1/17 to 6/30/17. They also show how much a $1,000 invest-ment would be worth at the close of the period, assuming actual returns and expenses. To estimate the ongoing expenses you paid over the period, divide your account value by $1,000, then multiply the result by the number in the first line for the class of shares you own.
Compare your fund’s expenses with those of other fundsThe two right-hand columns of the Expenses per $1,000 table show your fund’s expenses based on a $1,000 investment, assuming a hypothetical 5% annualized return. You can use this information to compare the ongoing expenses (but not transaction expenses or total costs) of investing in the fund with those of other funds. All shareholder reports of mutual funds and funds serving as variable annuity vehicles will provide this information to help you make this comparison. Please note that you cannot use this information to esti-mate your actual ending account balance and expenses paid during the period.
Expense ratiosClass IA Class IB
Total annual operating expenses for the fiscal year ended 12/31/16 0.69% 0.94%
Annualized expense ratio for the six-month period ended 6/30/17 0.69% 0.94%
Fiscal-year expense information in this table is taken from the most recent prospectus, is subject to change, and may differ from that shown for the annualized expense ratio and in the financial highlights of this report.
Expenses are shown as a percentage of average net assets.
Expenses per $1,000
Expenses and value for a $1,000 investment, assuming actual returns for the 6 months ended 6/30/17
Expenses and value for a $1,000 investment, assuming a hypothetical 5% annualized return for the 6 months ended 6/30/17
Class IA Class IB Class IA Class IB
Expenses paid per $1,000*† $3.55 $4.84 $3.46 $4.71
Ending value (after expenses) $1,077.10 $1,075.70 $1,021.37 $1,020.13
* Expenses for each share class are calculated using the fund’s annualized expense ratio for each class, which represents the ongoing expenses as a percentage of average net assets for the six months ended 6/30/17. The expense ratio may differ for each share class.
† Expenses based on actual returns are calculated by multiplying the expense ratio by the average account value for the period; then multiplying the result by the number of days in the period; and then dividing that result by the number of days in the year. Expenses based on a hypothetical 5% return are calculated by multi-plying the expense ratio by the average account value for the six-month period; then multiplying the result by the number of days in the six-month period; and then dividing that result by the number of days in the year.
Your fund’s managerPortfolio Manager Gerard P. Sullivan joined Putnam in 2008 and has been in the investment industry since 1982
Your fund’s manager also manages other accounts advised by Putnam Management or an affiliate, including retail mutual fund counterparts to the funds in Putnam Variable Trust.
Putnam VT Investors Fund 3
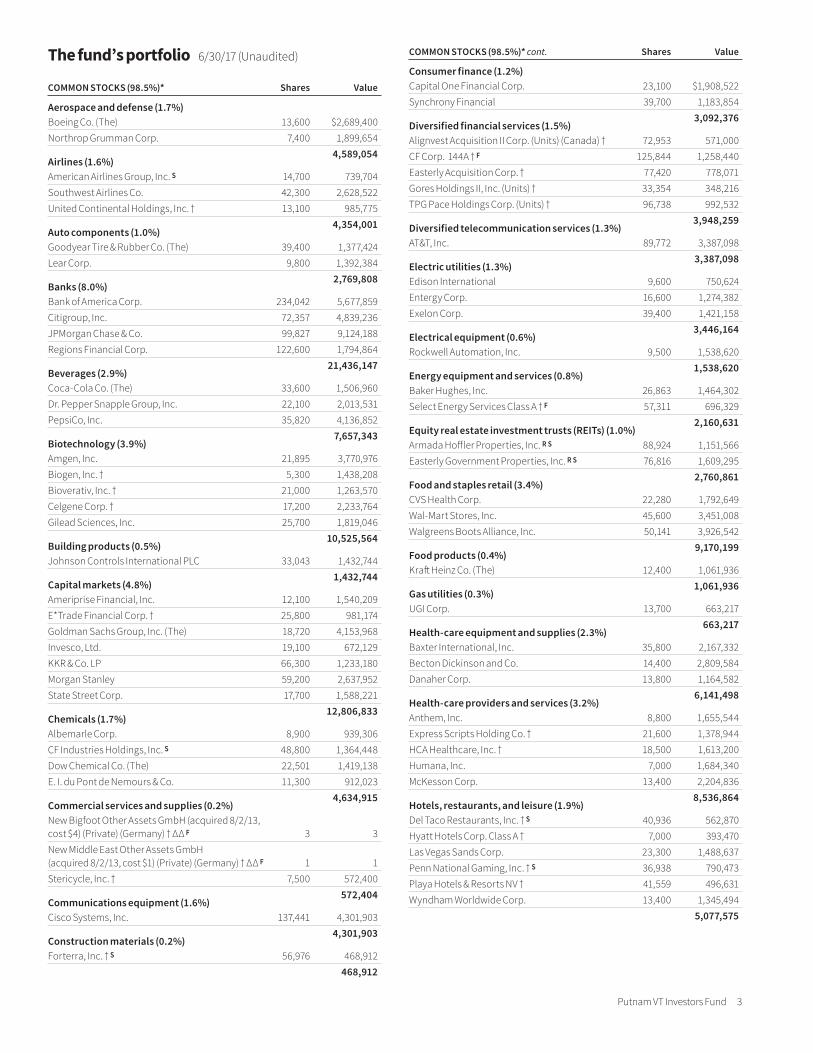
COMMON STOCKS (98.5%)* Shares Value
Aerospace and defense (1.7%)Boeing Co. (The) 13,600 $2,689,400Northrop Grumman Corp. 7,400 1,899,654 4,589,054Airlines (1.6%)American Airlines Group, Inc. S 14,700 739,704Southwest Airlines Co. 42,300 2,628,522United Continental Holdings, Inc. † 13,100 985,775 4,354,001Auto components (1.0%)Goodyear Tire & Rubber Co. (The) 39,400 1,377,424Lear Corp. 9,800 1,392,384 2,769,808Banks (8.0%)Bank of America Corp. 234,042 5,677,859Citigroup, Inc. 72,357 4,839,236JPMorgan Chase & Co. 99,827 9,124,188Regions Financial Corp. 122,600 1,794,864 21,436,147Beverages (2.9%)Coca-Cola Co. (The) 33,600 1,506,960Dr. Pepper Snapple Group, Inc. 22,100 2,013,531PepsiCo, Inc. 35,820 4,136,852 7,657,343Biotechnology (3.9%)Amgen, Inc. 21,895 3,770,976Biogen, Inc. † 5,300 1,438,208Bioverativ, Inc. † 21,000 1,263,570Celgene Corp. † 17,200 2,233,764Gilead Sciences, Inc. 25,700 1,819,046 10,525,564Building products (0.5%)Johnson Controls International PLC 33,043 1,432,744 1,432,744Capital markets (4.8%)Ameriprise Financial, Inc. 12,100 1,540,209E*Trade Financial Corp. † 25,800 981,174Goldman Sachs Group, Inc. (The) 18,720 4,153,968Invesco, Ltd. 19,100 672,129KKR & Co. LP 66,300 1,233,180Morgan Stanley 59,200 2,637,952State Street Corp. 17,700 1,588,221 12,806,833Chemicals (1.7%)Albemarle Corp. 8,900 939,306CF Industries Holdings, Inc. S 48,800 1,364,448Dow Chemical Co. (The) 22,501 1,419,138E. I. du Pont de Nemours & Co. 11,300 912,023 4,634,915Commercial services and supplies (0.2%)New Bigfoot Other Assets GmbH (acquired 8/2/13, cost $4) (Private) (Germany) † ∆∆ F 3 3New Middle East Other Assets GmbH (acquired 8/2/13, cost $1) (Private) (Germany) † ∆∆ F 1 1Stericycle, Inc. † 7,500 572,400 572,404Communications equipment (1.6%)Cisco Systems, Inc. 137,441 4,301,903 4,301,903Construction materials (0.2%)Forterra, Inc. † S 56,976 468,912 468,912
Consumer finance (1.2%)Capital One Financial Corp. 23,100 $1,908,522Synchrony Financial 39,700 1,183,854 3,092,376Diversified financial services (1.5%)Alignvest Acquisition II Corp. (Units) (Canada) † 72,953 571,000CF Corp. 144A † F 125,844 1,258,440Easterly Acquisition Corp. † 77,420 778,071Gores Holdings II, Inc. (Units) † 33,354 348,216TPG Pace Holdings Corp. (Units) † 96,738 992,532 3,948,259Diversified telecommunication services (1.3%)AT&T, Inc. 89,772 3,387,098 3,387,098Electric utilities (1.3%)Edison International 9,600 750,624Entergy Corp. 16,600 1,274,382Exelon Corp. 39,400 1,421,158 3,446,164Electrical equipment (0.6%)Rockwell Automation, Inc. 9,500 1,538,620 1,538,620Energy equipment and services (0.8%)Baker Hughes, Inc. 26,863 1,464,302Select Energy Services Class A † F 57,311 696,329 2,160,631Equity real estate investment trusts (REITs) (1.0%)Armada Hoffler Properties, Inc. R S 88,924 1,151,566Easterly Government Properties, Inc. R S 76,816 1,609,295 2,760,861Food and staples retail (3.4%)CVS Health Corp. 22,280 1,792,649Wal-Mart Stores, Inc. 45,600 3,451,008Walgreens Boots Alliance, Inc. 50,141 3,926,542 9,170,199Food products (0.4%)Kraft Heinz Co. (The) 12,400 1,061,936 1,061,936Gas utilities (0.3%)UGI Corp. 13,700 663,217 663,217Health-care equipment and supplies (2.3%)Baxter International, Inc. 35,800 2,167,332Becton Dickinson and Co. 14,400 2,809,584Danaher Corp. 13,800 1,164,582 6,141,498Health-care providers and services (3.2%)Anthem, Inc. 8,800 1,655,544Express Scripts Holding Co. † 21,600 1,378,944HCA Healthcare, Inc. † 18,500 1,613,200Humana, Inc. 7,000 1,684,340McKesson Corp. 13,400 2,204,836 8,536,864Hotels, restaurants, and leisure (1.9%)Del Taco Restaurants, Inc. † S 40,936 562,870Hyatt Hotels Corp. Class A † 7,000 393,470Las Vegas Sands Corp. 23,300 1,488,637Penn National Gaming, Inc. † S 36,938 790,473Playa Hotels & Resorts NV † 41,559 496,631Wyndham Worldwide Corp. 13,400 1,345,494 5,077,575
COMMON STOCKS (98.5%)* cont. Shares ValueThe fund’s portfolio 6/30/17 (Unaudited)

4 Putnam VT Investors Fund
Household durables (0.8%)FabFurnish GmbH (acquired 8/2/13, cost $4) (Private) (Germany) † ∆∆ F 6 $5New Home Co., Inc. (The) † 28,892 331,391PulteGroup, Inc. S 70,800 1,736,724 2,068,120Independent power and renewable electricity producers (0.5%)NRG Energy, Inc. 70,300 1,210,566 1,210,566Industrial conglomerates (0.8%)Honeywell International, Inc. 15,700 2,092,653 2,092,653Insurance (2.4%)American International Group, Inc. 21,833 1,364,999Assured Guaranty, Ltd. 27,800 1,160,372Hartford Financial Services Group, Inc. (The) 20,700 1,088,199Lincoln National Corp. 22,100 1,493,518Prudential Financial, Inc. 11,300 1,221,982 6,329,070Internet and direct marketing retail (1.8%)Amazon.com, Inc. † 3,365 3,257,320Delivery Hero Holding GmbH (Germany) † 30,474 967,603Expedia, Inc. 3,800 566,010Global Fashion Group SA (acquired 8/2/13, cost $219,415) (Private) (Luxembourg) † ∆∆ F 5,179 48,522 4,839,455Internet software and services (5.0%)Alibaba Group Holding, Ltd. ADR (China) † S 5,542 780,868Alphabet, Inc. Class A † 2,700 2,510,136Alphabet, Inc. Class C † 7,318 6,650,086Cision, Ltd. † 18,239 187,679Facebook, Inc. Class A † 21,400 3,230,972 13,359,741IT Services (2.3%)Conduent, Inc. † 30,360 483,938DXC Technology Co. † 27,602 2,117,625IBM Corp. 11,680 1,796,734MasterCard, Inc. Class A 13,800 1,676,010 6,074,307Machinery (2.0%)Caterpillar, Inc. 14,600 1,568,916Cummins, Inc. 8,500 1,378,870Ingersoll-Rand PLC 18,500 1,690,715Komatsu, Ltd. (Japan) 26,700 677,619 5,316,120Media (3.5%)CBS Corp. Class B (non-voting shares) 24,200 1,543,476Charter Communications, Inc. Class A † 1,856 625,194Comcast Corp. Class A 110,640 4,306,109DISH Network Corp. Class A † 20,800 1,305,408Live Nation Entertainment, Inc. † 45,300 1,578,705 9,358,892Metals and mining (0.8%)Alcoa Corp. 24,400 796,660Freeport-McMoRan, Inc. (Indonesia) † 119,800 1,438,798 2,235,458Mortgage real estate investment trusts (REITs) (0.3%)Hannon Armstrong Sustainable Infrastructure Capital, Inc. R S 31,039 709,862 709,862Multiline retail (0.5%)Target Corp. 23,500 1,228,815 1,228,815
Oil, gas, and consumable fuels (5.1%)ConocoPhillips 48,700 $2,140,852Enterprise Products Partners LP 54,400 1,473,152EOG Resources, Inc. 7,600 687,952Exxon Mobil Corp. 24,505 1,978,289Kimbell Royalty Partners LP 38,113 641,442Marathon Oil Corp. 67,900 804,615Plains GP Holdings LP Class A 26,111 683,064Royal Dutch Shell PLC ADR Class A (United Kingdom) 50,523 2,687,318Suncor Energy, Inc. (Canada) 37,800 1,103,760Valero Energy Corp. 19,800 1,335,708 13,536,152Pharmaceuticals (4.5%)Jazz Pharmaceuticals PLC † 8,356 1,299,358Johnson & Johnson 44,030 5,824,729Merck & Co., Inc. 36,700 2,352,103Pfizer, Inc. 74,186 2,491,908 11,968,098Professional services (0.3%)ManpowerGroup, Inc. 7,600 848,540 848,540Real estate management and development (0.7%)CBRE Group, Inc. Class A † 28,800 1,048,320Kennedy-Wilson Holdings, Inc. S 41,400 788,670 1,836,990Road and rail (0.7%)Norfolk Southern Corp. 15,600 1,898,520 1,898,520Semiconductors and semiconductor equipment (3.6%)Applied Materials, Inc. 50,600 2,090,286Intel Corp. 62,020 2,092,555Lam Research Corp. 13,900 1,965,877Qualcomm, Inc. 35,900 1,982,398Texas Instruments, Inc. 20,900 1,607,837 9,738,953Software (5.3%)Dell Technologies, Inc. Class V † 26,073 1,593,321Microsoft Corp. 149,550 10,308,482Oracle Corp. 44,658 2,239,152 14,140,955Specialty retail (3.2%)Best Buy Co., Inc. S 30,500 1,748,565Gap, Inc. (The) S 34,200 752,058Home Depot, Inc. (The) 19,800 3,037,320Lowe’s Cos., Inc. 24,300 1,883,979Ross Stores, Inc. 19,600 1,131,508 8,553,430Technology hardware, storage, and peripherals (5.3%)Apple, Inc. 73,083 10,525,411Hewlett Packard Enterprise Co. 65,916 1,093,546HP, Inc. 75,116 1,313,028NCR Corp. † 12,600 514,584Xerox Corp. 26,050 748,417 14,194,986Textiles, apparel, and luxury goods (0.5%)Hanesbrands, Inc. S 59,600 1,380,336 1,380,336Tobacco (0.3%)Reynolds American, Inc. 13,200 858,528 858,528Trading companies and distributors (0.4%)United Rentals, Inc. † 9,900 1,115,829 1,115,829
COMMON STOCKS (98.5%)* cont. Shares Value COMMON STOCKS (98.5%)* cont. Shares Value

Putnam VT Investors Fund 5
Wireless telecommunication services (0.6%)T-Mobile US, Inc. † 27,400 $1,660,988 1,660,988
Total common stocks (cost $208,774,456) $263,090,290
CONVERTIBLE PREFERRED STOCKS (0.6%)* Shares Value
American Tower Corp. $5.50 cv. pfd. R 5,321 $641,513Becton Dickinson and Co. Ser. A, $3.063 cv. pfd. † 8,869 485,844Iridium Communications, Inc. 7.00% cv. pfd. 3,770 457,113Total convertible preferred stocks (cost $1,356,567) $1,584,470
CONVERTIBLE BONDS AND NOTES (0.2%)* Principal amount Value
DISH Network Corp. 144A cv. sr. unsec. bonds 3.375%, 8/15/26 $383,000 $464,388Total convertible bonds and notes (cost $383,000) $464,388
Expiration WARRANTS (—%)* † date Strike price Warrants Value
Cision, Ltd. 6/22/20 $11.50 9,120 $20,051Easterly Acquisition Corp. 7/29/20 11.50 38,710 32,904
Total warrants (cost $40,119) $52,955
SHORT-TERM INVESTMENTS (6.1%)* Shares Value
Putnam Cash Collateral Pool, LLC 1.24% d 12,761,350 $12,761,350Putnam Short Term Investment Fund 1.07% L 3,524,826 3,524,826Total short-term investments (cost $16,286,176) $16,286,176
Total investments (cost $226,840,318) $281,478,279
Key to holding’s abbreviations ADR American Depository Receipts: represents ownership of foreign
securities on deposit with a custodian bank
Notes to the fund’s portfolio Unless noted otherwise, the notes to the fund’s portfolio are for the close of
the fund’s reporting period, which ran from January 1, 2017 through June 30, 2017 (the reporting period). Within the following notes to the portfolio, refer-ences to “ASC 820” represent Accounting Standards Codification 820 Fair Value Measurements and Disclosures, references to “Putnam Management” represent Putnam Investment Management, LLC, the fund’s manager, an indirect wholly-owned subsidiary of Putnam Investments, LLC and references to “OTC”, if any, represent over-the-counter.
* Percentages indicated are based on net assets of $267,145,885.
† This security is non-income-producing.
∆∆ This security is restricted with regard to public resale. The total fair value of this security and any other restricted securities (excluding 144A securities), if any, held at the close of the reporting period was $48,531, or less than 0.1% of net assets.
d Affiliated company. See Notes 1 and 5 to the financial statements regarding securities lending. The rate quoted in the security description is the annualized 7-day yield of the fund at the close of the reporting period.
F This security is valued by Putnam Management at fair value following proce-dures approved by the Trustees. Securities may be classified as Level 2 or Level 3 for ASC 820 based on the securities’ valuation inputs (Note 1).
L Affiliated company (Note 5). The rate quoted in the security description is the annualized 7-day yield of the fund at the close of the reporting period.
R Real Estate Investment Trust.S Security on loan, in part or in entirety, at the close of the reporting period
(Note 1).
At the close of the reporting period, the fund maintained liquid assets totaling $1,258,440 to cover the settlement of certain securities.
Debt obligations are considered secured unless otherwise indicated.
144A after the name of an issuer represents securities exempt from registration under Rule 144A of the Securities Act of 1933, as amended. These securities may be resold in transactions exempt from registration, normally to qualified institutional buyers.
The dates shown on debt obligations are the original maturity dates.
COMMON STOCKS (98.5%)* cont. Shares Value

6 Putnam VT Investors Fund
ASC 820 establishes a three-level hierarchy for disclosure of fair value measurements. The valuation hierarchy is based upon the transparency of inputs to the valuation of the fund’s investments. The three levels are defined as follows:
Level 1: Valuations based on quoted prices for identical securities in active markets.
Level 2: Valuations based on quoted prices in markets that are not active or for which all significant inputs are observable, either directly or indirectly.
Level 3: Valuations based on inputs that are unobservable and significant to the fair value measurement.
The following is a summary of the inputs used to value the fund’s net assets as of the close of the reporting period:
Valuation inputsInvestments in securities: Level 1 Level 2 Level 3Common stocks*:
Consumer discretionary $35,227,904 $— $48,527Consumer staples 18,748,006 — — Energy 15,000,454 696,329 — Financials 47,064,107 1,258,440 — Health care 37,172,024 — — Industrials 23,758,481 — 4 Information technology 61,810,845 — — Materials 7,339,285 — — Real estate 4,597,851 — — Telecommunication services 5,048,086 — — Utilities 5,319,947 — —
Total common stocks 261,086,990 1,954,769 48,531Convertible bonds and notes — 464,388 — Convertible preferred stocks 485,844 1,098,626 — Warrants 52,955 — — Short-term investments 3,524,826 12,761,350 — Totals by level $265,150,615 $16,279,133 $48,531
* Common stock classifications are presented at the sector level, which may differ from the fund’s portfolio presentation.During the reporting period, transfers within the fair value hierarchy, if any (other than certain transfers involving non-U.S. equity securities as described in Note 1 ), did not represent, in the aggregate, more than 1% of the fund’s net assets measured as of the end of the period. Transfers are accounted for using the end of period pricing valuation method.At the start and close of the reporting period, Level 3 investments in securities represented less than 1% of the fund’s net assets and were not considered a significant portion of the fund’s portfolio.
The accompanying notes are an integral part of these financial statements.

Putnam VT Investors Fund 7
The accompanying notes are an integral part of these financial statements.
Statement of assets and liabilities6/30/17 (Unaudited)
Assets
Investment in securities, at value, including $12,518,739 of securities on loan (Note 1):Unaffiliated issuers (identified cost $210,554,142) $265,192,103 Affiliated issuers (identified cost $16,286,176) (Notes 1 and 5) 16,286,176
Cash 18 Foreign currency (cost $22) (Note 1) 22 Dividends, interest and other receivables 354,950 Receivable for shares of the fund sold 14,250 Receivable for investments sold 2,034,154 Total assets 283,881,673
Liabilities
Payable for investments purchased 3,341,730 Payable for shares of the fund repurchased 226,238 Payable for compensation of Manager (Note 2) 122,421 Payable for custodian fees (Note 2) 11,781 Payable for investor servicing fees (Note 2) 25,617 Payable for Trustee compensation and expenses (Note 2) 151,492 Payable for administrative services (Note 2) 1,070 Payable for distribution fees (Note 2) 41,341 Collateral on securities loaned, at value (Note 1) 12,761,350 Other accrued expenses 52,748 Total liabilities 16,735,788
Net assets $267,145,885
Represented by
Paid-in capital (Unlimited shares authorized) (Notes 1 and 4) $198,421,781 Undistributed net investment income (Note 1) 1,243,434 Accumulated net realized gain on investments and foreign currency transactions (Note 1) 12,842,677 Net unrealized appreciation of investments and assets and liabilities in foreign currencies 54,637,993 Total — Representing net assets applicable to capital shares outstanding $267,145,885
Computation of net asset value Class IA
Net assets $66,378,302 Number of shares outstanding 3,688,048 Net asset value, offering price and redemption price per share (net assets divided by number of shares outstanding) $18.00
Computation of net asset value Class IB
Net assets $200,767,583 Number of shares outstanding 11,189,113 Net asset value, offering price and redemption price per share (net assets divided by number of shares outstanding) $17.94

8 Putnam VT Investors Fund
Statement of operationsSix months ended 6/30/17 (Unaudited)
Investment income
Dividends (net of foreign tax of $8,783) $2,568,905 Interest (including interest income of $15,739 from investments in affiliated issuers) (Note 5) 22,039 Securities lending (net of expenses) (Notes 1 and 5) 12,288 Total investment income 2,603,232
Expenses
Compensation of Manager (Note 2) 741,509 Investor servicing fees (Note 2) 94,275 Custodian fees (Note 2) 7,900 Trustee compensation and expenses (Note 2) 9,777 Distribution fees (Note 2) 250,468 Administrative services (Note 2) 3,208 Other 62,031 Total expenses 1,169,168
Expense reduction (Note 2) (6,560)Net expenses 1,162,608
Net investment income 1,440,624
Net realized gain on securities from unaffiliated issuers (Notes 1 and 3) 14,327,863 Net realized loss on foreign currency transactions (Note 1) (1,636)Net unrealized appreciation of assets and liabilities in foreign currencies during the period 44 Net unrealized appreciation of securities in unaffiliated issuers during the period 3,969,079
Net gain on investments 18,295,350
Net increase in net assets resulting from operations $19,735,974
Statement of changes in net assets Six months ended
6/30/17*Year ended
12/31/16Increase (decrease) in net assetsOperations:Net investment income $1,440,624 $3,270,364 Net realized gain on investments and foreign currency transactions 14,326,227 14,660,066 Net unrealized appreciation of investments and assets and liabilities in foreign currencies 3,969,123 12,446,127 Net increase in net assets resulting from operations 19,735,974 30,376,557 Distributions to shareholders (Note 1):
From ordinary incomeNet investment income
Class IA (883,274) (1,000,486)Class IB (2,232,563) (1,601,787)
From net realized long-term gain on investmentsClass IA (3,651,105) (2,278,450)Class IB (10,958,880) (4,303,419)
Increase (decrease) from capital share transactions (Note 4) (2,161,565) 57,876,287
Total increase (decrease) in net assets (151,413) 79,068,702 Net assets:Beginning of period 267,297,298 188,228,596 End of period (including undistributed net investment income of $1,243,434 and $2,918,647, respectively) $267,145,885 $267,297,298 * Unaudited.
The accompanying notes are an integral part of these financial statements.

Putnam VT Investors Fund 9
The accompanying notes are an integral part of these financial statements.
* Not annualized.
† Unaudited.a Per share net investment income (loss) has been determined on the basis of the weighted average number of shares outstanding during the period.b The charges and expenses at the insurance company separate account level are not reflected.c Total return assumes dividend reinvestment.d Includes amounts paid through expense offset and/or brokerage/service arrangements, if any (Note 2). Also excludes acquired fund fees and expenses, if any.e Reflects a voluntary waiver of certain fund expenses in effect during the period. As a result of such waiver, the expenses of each class reflect a reduction of less than 0.01%
as a percentage of average net assets.
Financial highlights (For a common share outstanding throughout the period)
INVESTMENT OPERATIONS: LESS DISTRIBUTIONS: RATIOS AND SUPPLEMENTAL DATA:
Period ended Net
ass
et va
lue,
beg
inni
ng o
f per
iod
Ne
t in
vest
me
nt i
nco
me
(lo
ss ) a
Ne
t re
ali
zed
an
d u
nre
ali
zed
ga
in (l
oss
)
on
inve
stm
en
ts
Tota
l fro
m in
vest
men
t ope
ratio
ns
Fro
m n
et i
nve
stm
en
t in
com
e
Fro
m n
et r
ea
lize
d g
ain
on
inve
stm
en
ts
Tota
l dis
tri b
u tio
ns
Net
ass
et va
lue,
end
of p
erio
d
Tota
l ret
urn
at n
et a
sset
valu
e (%
) b,c
Net
ass
ets,
end
of p
erio
d (in
thou
sand
s )
Ra
tio
of e
xpe
nse
s to
ave
rag
e
ne
t a
sse
ts (%
) b,d
Ra
tio
of n
et i
nve
stm
en
t in
com
e (l
oss
)
to a
vera
ge
ne
t a
sse
ts (%
)
Po
rtfo
lio
tu
rno
ver
(% )
Class IA
6/30/17 † $17.91 .11 1.25 1.36 (.25 ) (1.02 ) (1.27 ) $18.00 7.71 * $66,378 .34 * .63 * 31 *
12/31/16 16.79 .25 1.71 1.96 (.26 ) (.58 ) (.84 ) 17.91 12.34 66,173 .69 e 1.52 e 50
12/31/15 17.37 .28 (.61 ) (.33 ) (.25 ) — (.25 ) 16.79 (1.96 ) 67,928 .69 1.60 47
12/31/14 15.43 .22 1.95 2.17 (.23 ) — (.23 ) 17.37 14.25 81,862 .72 1.39 50
12/31/13 11.59 .19 3.88 4.07 (.23 ) — (.23 ) 15.43 35.52 86,433 .73 1.39 83
12/31/12 10.05 .19 1.52 1.71 (.17 ) — (.17 ) 11.59 17.06 75,932 .74 1.76 60
Class IB
6/30/17 † $17.84 .09 1.24 1.33 (.21 ) (1.02 ) (1.23 ) $17.94 7.57 * $200,768 .47 * .50 * 31 *
12/31/16 16.73 .22 1.69 1.91 (.22 ) (.58 ) (.80 ) 17.84 12.05 201,125 .94 e 1.37 e 50
12/31/15 17.30 .24 (.61 ) (.37 ) (.20 ) — (.20 ) 16.73 (2.18 ) 120,301 .94 1.39 47
12/31/14 15.37 .18 1.94 2.12 (.19 ) — (.19 ) 17.30 13.91 117,335 .97 1.14 50
12/31/13 11.55 .15 3.86 4.01 (.19 ) — (.19 ) 15.37 35.12 127,742 .98 1.15 83
12/31/12 10.01 .17 1.51 1.68 (.14 ) — (.14 ) 11.55 16.83 143,525 .99 1.50 60

10 Putnam VT Investors Fund
Notes to financial statements 6/30/17 (Unaudited)
Within the following Notes to financial statements, references to “State Street” represent State Street Bank and Trust Company, references to “the SEC” represent the Securities and Exchange Commission, references to “Putnam Management” represent Putnam Investment Management, LLC, the fund’s manager, an indirect wholly-owned subsidiary of Putnam Investments, LLC and references to “OTC”, if any, represent over-the-counter. Unless otherwise noted, the “reporting period” represents the period from January 1, 2017 through June 30, 2017.
Putnam VT Investors Fund (the fund) is a diversified series of Putnam Variable Trust (the Trust), a Massachusetts business trust registered under the Investment Company Act of 1940, as amended, as an open-end management invest-ment company. The goal of the fund is to seek long-term growth of capital and any increased income that results from this growth. The fund invests mainly in common stocks (growth or value stocks or both) of large U.S. companies that Putnam Management believes have favorable investment potential. For example, the fund may purchase stocks of companies with stock prices that reflect a value lower than that which Putnam Management places on the company. Putnam Management may also consider other factors Putnam Management believes will cause the stock price to rise and may consider, among other factors, a company’s valuation, financial strength, growth potential, competitive position in its industry, projected future earnings, cash flows and dividends when deciding whether to buy or sell investments.
The fund offers class IA and class IB shares of beneficial interest. Class IA shares are offered at net asset value and are not subject to a distribution fee. Class IB shares are offered at net asset value and pay an ongoing distribution fee, which is identified in Note 2.
In the normal course of business, the fund enters into contracts that may include agreements to indemnify another party under given circumstances. The fund’s maximum exposure under these arrangements is unknown as this would involve future claims that may be, but have not yet been, made against the fund. However, the fund’s management team expects the risk of material loss to be remote.
The fund has entered into contractual arrangements with an investment adviser, administrator, distributor, shareholder servicing agent and custodian, who each provide services to the fund. Unless expressly stated otherwise, shareholders are not parties to, or intended beneficiaries of these contractual arrangements, and these contractual arrangements are not intended to create any shareholder right to enforce them against the service providers or to seek any remedy under them against the service providers, either directly or on behalf of the fund.
Under the fund’s Declaration of Trust, any claims asserted against or on behalf of the Putnam Funds, including claims against Trustees and Officers, must be brought in state and federal courts located within the Commonwealth of Massachusetts.
Note 1 — Significant accounting policiesThe following is a summary of significant accounting policies consistently followed by the fund in the preparation of its financial statements. The preparation of finan-cial statements is in conformity with accounting principles generally accepted in the United States of America and requires management to make estimates and assumptions that affect the reported amounts of assets and liabilities in the finan-cial statements and the reported amounts of increases and decreases in net assets from operations. Actual results could differ from those estimates. Subsequent events after the Statement of assets and liabilities date through the date that the financial statements were issued have been evaluated in the preparation of the financial statements.
Investment income, realized and unrealized gains and losses and expenses of the fund are borne pro-rata based on the relative net assets of each class to the total net assets of the fund, except that each class bears expenses unique to that class (including the distribution fees applicable to such classes). Each class votes as a class only with respect to its own distribution plan or other matters on which a class vote is required by law or determined by the Trustees. If the fund were liqui-dated, shares of each class would receive their pro-rata share of the net assets of the fund. In addition, the Trustees declare separate dividends on each class of shares.
Security valuation Portfolio securities and other investments are valued using policies and procedures adopted by the Board of Trustees. The Trustees have formed a Pricing Committee to oversee the implementation of these procedures and have delegated responsibility for valuing the fund’s assets in accordance with these procedures to Putnam Management. Putnam Management has established an internal Valuation Committee that is responsible for making fair value
determinations, evaluating the effectiveness of the pricing policies of the fund and reporting to the Pricing Committee.
Investments for which market quotations are readily available are valued at the last reported sales price on their principal exchange, or official closing price for certain markets, and are classified as Level 1 securities under Accounting Standards Codification 820 Fair Value Measurements and Disclosures (ASC 820). If no sales are reported, as in the case of some securities that are traded OTC, a security is valued at its last reported bid price and is generally categorized as a Level 2 security.
Investments in open-end investment companies (excluding exchange-traded funds), if any, which can be classified as Level 1 or Level 2 securities, are valued based on their net asset value. The net asset value of such investment companies equals the total value of their assets less their liabilities and divided by the number of their outstanding shares.
Many securities markets and exchanges outside the U.S. close prior to the sched-uled close of the New York Stock Exchange and therefore the closing prices for securities in such markets or on such exchanges may not fully reflect events that occur after such close but before the scheduled close of the New York Stock Exchange. Accordingly, on certain days, the fund will fair value certain foreign equity securities taking into account multiple factors including movements in the U.S. securities markets, currency valuations and comparisons to the valuation of American Depository Receipts, exchange-traded funds and futures contracts. The foreign equity securities, which would generally be classified as Level 1 securities, will be transferred to Level 2 of the fair value hierarchy when they are valued at fair value. The number of days on which fair value prices will be used will depend on market activity and it is possible that fair value prices will be used by the fund to a significant extent. Securities quoted in foreign currencies, if any, are translated into U.S. dollars at the current exchange rate. Short-term securities with remaining maturities of 60 days or less are valued using an independent pricing service approved by the Trustees, and are classified as Level 2 securities.
To the extent a pricing service or dealer is unable to value a security or provides a valuation that Putnam Management does not believe accurately reflects the secu-rity’s fair value, the security will be valued at fair value by Putnam Management in accordance with policies and procedures approved by the Trustees. Certain investments, including certain restricted and illiquid securities and derivatives, are also valued at fair value following procedures approved by the Trustees. These valuations consider such factors as significant market or specific security events such as interest rate or credit quality changes, various relationships with other securities, discount rates, U.S. Treasury, U.S. swap and credit yields, index levels, convexity exposures, recovery rates, sales and other multiples and resale restrictions. These securities are classified as Level 2 or as Level 3 depending on the priority of the significant inputs.
To assess the continuing appropriateness of fair valuations, the Valuation Committee reviews and affirms the reasonableness of such valuations on a regular basis after considering all relevant information that is reasonably available. Such valuations and procedures are reviewed periodically by the Trustees. The fair value of securities is generally determined as the amount that the fund could reasonably expect to realize from an orderly disposition of such securities over a reasonable period of time. By its nature, a fair value price is a good faith estimate of the value of a security in a current sale and does not reflect an actual market price, which may be different by a material amount.
Security transactions and related investment income Security transactions are recorded on the trade date (the date the order to buy or sell is executed). Gains or losses on securities sold are determined on the identified cost basis.
Interest income, net of any applicable withholding taxes, is recorded on the accrual basis. Dividend income, net of any applicable withholding taxes, is recog-nized on the ex-dividend date except that certain dividends from foreign securi-ties, if any, are recognized as soon as the fund is informed of the ex-dividend date. Non-cash dividends, if any, are recorded at the fair value of the securities received. Dividends representing a return of capital or capital gains, if any, are reflected as a reduction of cost and/or as a realized gain.
Foreign currency translation The accounting records of the fund are maintained in U.S. dollars. The fair value of foreign securities, currency holdings, and other assets and liabilities is recorded in the books and records of the fund after trans-lation to U.S. dollars based on the exchange rates on that day. The cost of each security is determined using historical exchange rates. Income and withholding taxes are translated at prevailing exchange rates when earned or incurred. The fund does not isolate that portion of realized or unrealized gains or losses resulting

Putnam VT Investors Fund 11
from changes in the foreign exchange rate on investments from fluctuations arising from changes in the market prices of the securities. Such gains and losses are included with the net realized and unrealized gain or loss on investments. Net realized gains and losses on foreign currency transactions represent net realized exchange gains or losses on disposition of foreign currencies, currency gains and losses realized between the trade and settlement dates on securities transac-tions and the difference between the amount of investment income and foreign withholding taxes recorded on the fund’s books and the U.S. dollar equivalent amounts actually received or paid. Net unrealized appreciation and deprecia-tion of assets and liabilities in foreign currencies arise from changes in the value of assets and liabilities other than investments at the period end, resulting from changes in the exchange rate.
Securities lending The fund may lend securities, through its agent, to qualified borrowers in order to earn additional income. The loans are collateralized by cash in an amount at least equal to the fair value of the securities loaned. The fair value of securities loaned is determined daily and any additional required collateral is allocated to the fund on the next business day. The remaining maturities of the securities lending transactions are considered overnight and continuous. The risk of borrower default will be borne by the fund’s agent; the fund will bear the risk of loss with respect to the investment of the cash collateral. Income from securi-ties lending, net of expenses, is included in investment income on the Statement of operations. Cash collateral is invested in Putnam Cash Collateral Pool, LLC, a limited liability company managed by an affiliate of Putnam Management. Investments in Putnam Cash Collateral Pool, LLC are valued at its closing net asset value each business day. There are no management fees charged to Putnam Cash Collateral Pool, LLC. At the close of the reporting period, the fund received cash collateral of $12,761,350 and the value of securities loaned amounted to $12,518,739.
Interfund lending The fund, along with other Putnam funds, may participate in an interfund lending program pursuant to an exemptive order issued by the SEC. This program allows the fund to borrow from or lend to other Putnam funds that permit such transactions. Interfund lending transactions are subject to each fund’s investment policies and borrowing and lending limits. Interest earned or paid on the interfund lending transaction will be based on the average of certain current market rates. During the reporting period, the fund did not utilize the program.
Lines of credit The fund participates, along with other Putnam funds, in a $317.5 million unsecured committed line of credit and a $235.5 million unsecured uncommitted line of credit, both provided by State Street. Borrowings may be made for temporary or emergency purposes, including the funding of shareholder redemption requests and trade settlements. Interest is charged to the fund based on the fund’s borrowing at a rate equal to the higher of (1) the Federal Funds rate and (2) the overnight LIBOR plus 1.25% for the committed line of credit and the Federal Funds rate plus 1.30% for the uncommitted line of credit. A closing fee equal to 0.04% of the committed line of credit plus a $25,000 flat fee and 0.04% of the uncommitted line of credit has been paid by the participating funds. In addition, a commitment fee of 0.21% per annum on any unutilized portion of the committed line of credit is allocated to the participating funds based on their rela-tive net assets and paid quarterly. During the reporting period, the fund had no borrowings against these arrangements.
Federal taxes It is the policy of the fund to distribute all of its taxable income within the prescribed time period and otherwise comply with the provisions of the Internal Revenue Code of 1986, as amended (the Code), applicable to regulated investment companies.
The fund is subject to the provisions of Accounting Standards Codification 740 Income Taxes (ASC 740). ASC 740 sets forth a minimum threshold for financial statement recognition of the benefit of a tax position taken or expected to be taken in a tax return. The fund did not have a liability to record for any unrecognized tax benefits in the accompanying financial statements. No provision has been made for federal taxes on income, capital gains or unrealized appreciation on securi-ties held nor for excise tax on income and capital gains. Each of the fund’s federal tax returns for the prior three fiscal years remains subject to examination by the Internal Revenue Service.
The fund may also be subject to taxes imposed by governments of countries in which it invests. Such taxes are generally based on either income or gains earned or repatriated. The fund accrues and applies such taxes to net investment income, net realized gains and net unrealized gains as income and/or capital gains are earned. In some cases, the fund may be entitled to reclaim all or a portion of such taxes, and such reclaim amounts, if any, are reflected as an asset on the fund’s books. In many cases, however, the fund may not receive such amounts for an extended period of time, depending on the country of investment.
The aggregate identified cost on a tax basis is $228,187,736, resulting in gross unre-alized appreciation and depreciation of $58,894,337 and $5,603,794, respectively, or net unrealized appreciation of $53,290,543.
Distributions to shareholders Distributions to shareholders from net invest-ment income are recorded by the fund on the ex-dividend date. Distributions from capital gains, if any, are recorded on the ex-dividend date and paid at least annu-ally. The amount and character of income and gains to be distributed are deter-mined in accordance with income tax regulations, which may differ from generally accepted accounting principles. Dividend sources are estimated at the time of declaration. Actual results may vary. Any non-taxable return of capital cannot be determined until final tax calculations are completed after the end of the fund’s fiscal year. Reclassifications are made to the fund’s capital accounts to reflect income and gains available for distribution (or available capital loss carryovers) under income tax regulations.
Expenses of the Trust Expenses directly charged or attributable to any fund will be paid from the assets of that fund. Generally, expenses of the Trust will be allo-cated among and charged to the assets of each fund on a basis that the Trustees deem fair and equitable, which may be based on the relative assets of each fund or the nature of the services performed and relative applicability to each fund.
Beneficial interest At the close of the reporting period, insurance companies or their separate accounts were record owners of all but a de minimis number of the shares of the fund. Approximately 43.2% of the fund is owned by accounts of one insurance company.
Note 2 — Management fee, administrative services and other transactionsThe fund pays Putnam Management a management fee (based on the fund’s average net assets and computed and paid monthly) at annual rates that may vary based on the average of the aggregate net assets of all open-end mutual funds sponsored by Putnam Management (excluding net assets of funds that are invested in, or that are invested in by, other Putnam funds to the extent necessary to avoid “double counting” of those assets). Such annual rates may vary as follows:
0.710% of the first $5 billion,0.660% of the next $5 billion,0.610% of the next $10 billion,0.560% of the next $10 billion,0.510% of the next $50 billion,0.490% of the next $50 billion,0.480% of the next $100 billion and0.475% of any excess thereafter.
For the reporting period, the management fee represented an effective rate (excluding the impact from any expense waivers in effect) of 0.275% of the fund’s average net assets.
Putnam Management has contractually agreed, through April 30, 2019, to waive fees or reimburse the fund’s expenses to the extent necessary to limit the cumu-lative expenses of the fund, exclusive of brokerage, interest, taxes, investment-related expenses, extraordinary expenses, acquired fund fees and expenses and payments under the fund’s investor servicing contract, investment management contract and distribution plans, on a fiscal year-to-date basis to an annual rate of 0.20% of the fund’s average net assets over such fiscal year-to-date period. During the reporting period, the fund’s expenses were not reduced as a result of this limit.
Putnam Investments Limited (PIL), an affiliate of Putnam Management, is autho-rized by the Trustees to manage a separate portion of the assets of the fund as determined by Putnam Management from time to time. PIL did not manage any portion of the assets of the fund during the reporting period. If Putnam Management were to engage the services of PIL, Putnam Management would pay a quarterly sub-management fee to PIL for its services at an annual rate of 0.35% of the average net assets of the portion of the fund managed by PIL.
The fund reimburses Putnam Management an allocated amount for the compen-sation and related expenses of certain officers of the fund and their staff who provide administrative services to the fund. The aggregate amount of all such reimbursements is determined annually by the Trustees.
Custodial functions for the fund’s assets are provided by State Street. Custody fees are based on the fund’s asset level, the number of its security holdings and transaction volumes.
Putnam Investor Services, Inc., an affiliate of Putnam Management, provides investor servicing agent functions to the fund. Putnam Investor Services, Inc. was paid a monthly fee for investor servicing at an annual rate of 0.07% of the fund’s
12 Putnam VT Investors Fund
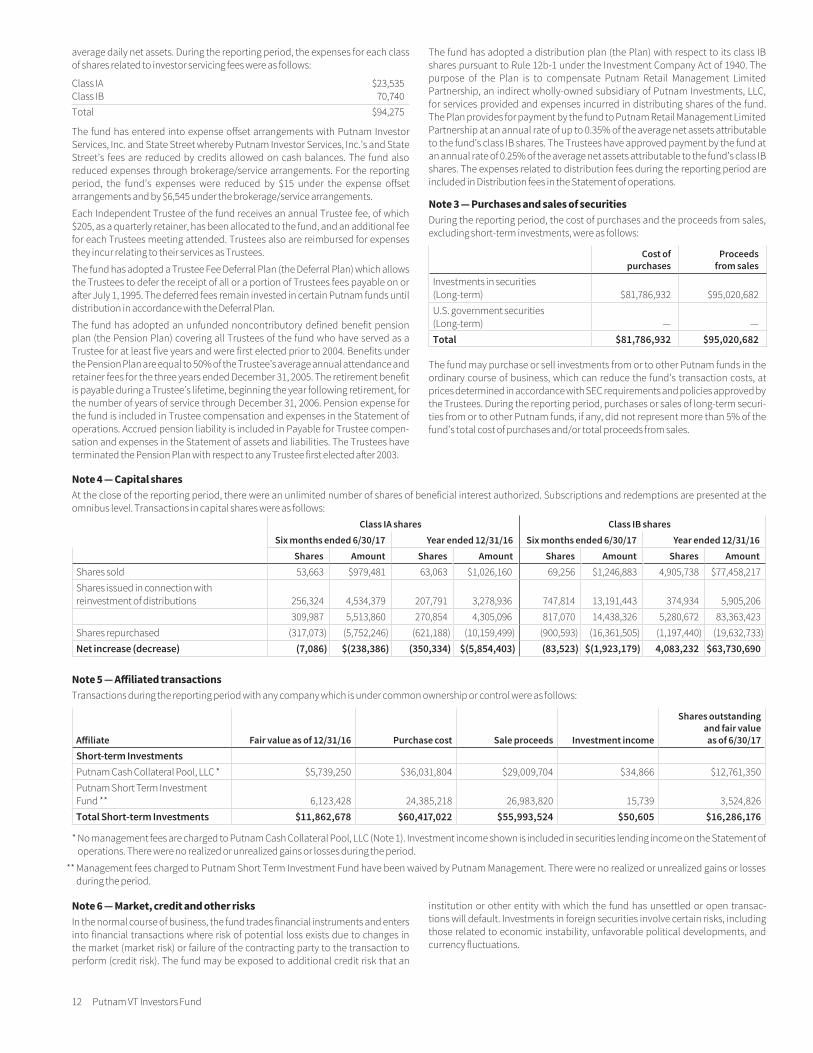
average daily net assets. During the reporting period, the expenses for each class of shares related to investor servicing fees were as follows:
Class IA $23,535Class IB 70,740Total $94,275
The fund has entered into expense offset arrangements with Putnam Investor Services, Inc. and State Street whereby Putnam Investor Services, Inc.’s and State Street’s fees are reduced by credits allowed on cash balances. The fund also reduced expenses through brokerage/service arrangements. For the reporting period, the fund’s expenses were reduced by $15 under the expense offset arrangements and by $6,545 under the brokerage/service arrangements.
Each Independent Trustee of the fund receives an annual Trustee fee, of which $205, as a quarterly retainer, has been allocated to the fund, and an additional fee for each Trustees meeting attended. Trustees also are reimbursed for expenses they incur relating to their services as Trustees.
The fund has adopted a Trustee Fee Deferral Plan (the Deferral Plan) which allows the Trustees to defer the receipt of all or a portion of Trustees fees payable on or after July 1, 1995. The deferred fees remain invested in certain Putnam funds until distribution in accordance with the Deferral Plan.
The fund has adopted an unfunded noncontributory defined benefit pension plan (the Pension Plan) covering all Trustees of the fund who have served as a Trustee for at least five years and were first elected prior to 2004. Benefits under the Pension Plan are equal to 50% of the Trustee’s average annual attendance and retainer fees for the three years ended December 31, 2005. The retirement benefit is payable during a Trustee’s lifetime, beginning the year following retirement, for the number of years of service through December 31, 2006. Pension expense for the fund is included in Trustee compensation and expenses in the Statement of operations. Accrued pension liability is included in Payable for Trustee compen-sation and expenses in the Statement of assets and liabilities. The Trustees have terminated the Pension Plan with respect to any Trustee first elected after 2003.
The fund has adopted a distribution plan (the Plan) with respect to its class IB shares pursuant to Rule 12b-1 under the Investment Company Act of 1940. The purpose of the Plan is to compensate Putnam Retail Management Limited Partnership, an indirect wholly-owned subsidiary of Putnam Investments, LLC, for services provided and expenses incurred in distributing shares of the fund. The Plan provides for payment by the fund to Putnam Retail Management Limited Partnership at an annual rate of up to 0.35% of the average net assets attributable to the fund’s class IB shares. The Trustees have approved payment by the fund at an annual rate of 0.25% of the average net assets attributable to the fund’s class IB shares. The expenses related to distribution fees during the reporting period are included in Distribution fees in the Statement of operations.
Note 3 — Purchases and sales of securitiesDuring the reporting period, the cost of purchases and the proceeds from sales, excluding short-term investments, were as follows:
Cost of
purchasesProceeds
from salesInvestments in securities (Long-term) $81,786,932 $95,020,682 U.S. government securities (Long-term) — —Total $81,786,932 $95,020,682
The fund may purchase or sell investments from or to other Putnam funds in the ordinary course of business, which can reduce the fund’s transaction costs, at prices determined in accordance with SEC requirements and policies approved by the Trustees. During the reporting period, purchases or sales of long-term securi-ties from or to other Putnam funds, if any, did not represent more than 5% of the fund’s total cost of purchases and/or total proceeds from sales.
Note 4 — Capital sharesAt the close of the reporting period, there were an unlimited number of shares of beneficial interest authorized. Subscriptions and redemptions are presented at the omnibus level. Transactions in capital shares were as follows:
Class IA shares Class IB sharesSix months ended 6/30/17 Year ended 12/31/16 Six months ended 6/30/17 Year ended 12/31/16
Shares Amount Shares Amount Shares Amount Shares AmountShares sold 53,663 $979,481 63,063 $1,026,160 69,256 $1,246,883 4,905,738 $77,458,217 Shares issued in connection with reinvestment of distributions 256,324 4,534,379 207,791 3,278,936 747,814 13,191,443 374,934 5,905,206
309,987 5,513,860 270,854 4,305,096 817,070 14,438,326 5,280,672 83,363,423 Shares repurchased (317,073) (5,752,246) (621,188) (10,159,499) (900,593) (16,361,505) (1,197,440) (19,632,733)Net increase (decrease) (7,086) $(238,386) (350,334) $(5,854,403) (83,523) $(1,923,179) 4,083,232 $63,730,690
Note 5 — Affiliated transactionsTransactions during the reporting period with any company which is under common ownership or control were as follows:
Affiliate Fair value as of 12/31/16 Purchase cost Sale proceeds Investment income
Shares outstanding and fair value as of 6/30/17
Short-term InvestmentsPutnam Cash Collateral Pool, LLC * $5,739,250 $36,031,804 $29,009,704 $34,866 $12,761,350 Putnam Short Term Investment Fund ** 6,123,428 24,385,218 26,983,820 15,739 3,524,826 Total Short-term Investments $11,862,678 $60,417,022 $55,993,524 $50,605 $16,286,176
* No management fees are charged to Putnam Cash Collateral Pool, LLC (Note 1). Investment income shown is included in securities lending income on the Statement of operations. There were no realized or unrealized gains or losses during the period.
** Management fees charged to Putnam Short Term Investment Fund have been waived by Putnam Management. There were no realized or unrealized gains or losses during the period.
Note 6 — Market, credit and other risksIn the normal course of business, the fund trades financial instruments and enters into financial transactions where risk of potential loss exists due to changes in the market (market risk) or failure of the contracting party to the transaction to perform (credit risk). The fund may be exposed to additional credit risk that an
institution or other entity with which the fund has unsettled or open transac-tions will default. Investments in foreign securities involve certain risks, including those related to economic instability, unfavorable political developments, and currency fluctuations.

Putnam VT Investors Fund 13
Note 7 — Summary of derivative activityThe volume of activity for the reporting period for any derivative type that was held during the period is listed below and was based on an average of the holdings at the end of each fiscal quarter:
Warrants (number of warrants) 60,000
The following is a summary of the fair value of derivative instruments as of the close of the reporting period:
Fair value of derivative instruments as of the close of the reporting period
Asset derivatives Liability derivativesDerivatives not accounted for as hedging instruments under ASC 815
Statement of assets and liabilities location Fair value
Statement of assets and liabilities location Fair value
Equity contracts Investments $52,955 Payables $— Total $52,955 $—
The following is a summary of change in unrealized gains or losses of derivative instruments on the Statement of operations for the reporting period (Note 1) (there were no realized gains or losses on derivative instruments):
Change in unrealized appreciation or (depreciation) on derivatives recognized in net gain or (loss) on investments
Derivatives not accounted for as hedging instruments under ASC 815 Warrants Total
Equity contracts $(40,000) $(40,000)
Total $(40,000) $(40,000)
Note 8 — New pronouncementsIn October 2016, the SEC adopted amendments to rules under the Investment Company Act of 1940 (“final rules”) intended to modernize the reporting and disclosure of information by registered investment companies. The final rules amend Regulation S-X and require funds to provide standardized, enhanced derivative disclosure in fund financial statements in a format designed for
individual investors. The amendments to Regulation S-X also update the disclo-sures for other investments and investments in and advances to affiliates and amend the rules regarding the general form and content of fund financial state-ments. The compliance date for the amendments to Regulation S-X is August 1, 2017. Putnam Management has evaluated the amendments and its adoption will have no effect on the fund’s net assets or results of operations.

14 Putnam VT Investors Fund
General conclusionsThe Board of Trustees of The Putnam Funds oversees the management of each fund and, as required by law, determines annually whether to approve the continuance of your fund’s management contract with Putnam Investment Management, LLC (“Putnam Management”) and the sub-management contract with respect to your fund between Putnam Management and its affiliate, Putnam Investments Limited (“PIL”). The Board, with the assistance of its Contract Committee, requests and evaluates all information it deems reasonably neces-sary under the circumstances in connection with its annual contract review. The Contract Committee consists solely of Trustees who are not “interested persons” (as this term is defined in the Investment Company Act of 1940, as amended (the “1940 Act”)) of The Putnam Funds (“Independent Trustees”).
At the outset of the review process, members of the Board’s independent staff and independent legal counsel discussed with representatives of Putnam Management the annual contract review materials furnished to the Contract Committee during the course of the previous year’s review, identifying possible changes in these materials that might be necessary or desirable for the coming year. Following these discussions and in consultation with the Contract Committee, the Independent Trustees’ independent legal counsel requested that Putnam Management and its affiliates furnish specified information, together with any additional infor-mation that Putnam Management considered relevant, to the Contract Committee. Over the course of several months ending in June 2017, the Contract Committee met on a number of occasions with representatives of Putnam Management, and separately in executive session, to consider the information that Putnam Management provided. Throughout this process, the Contract Committee was assisted by the members of the Board’s independent staff and by independent legal counsel for The Putnam Funds and the Independent Trustees.
In May 2017, the Contract Committee met in executive session to discuss and consider its recommendations with respect to the continuance of the contracts. At the Trustees’ June 2017 meeting, the Contract Committee met in executive session with the other Independent Trustees to review a summary of the key financial, performance and other data that the Contract Committee considered in the course of its review. The Contract Committee then presented its written report, which summarized the key factors that the Committee had considered and set forth its recommen-dations. The Contract Committee recommended, and the Independent Trustees approved, the continuance of your fund’s management and sub-management contracts, effective July 1, 2017. (Because PIL is an affiliate of Putnam Management and Putnam Management remains fully responsible for all services provided by PIL, the Trustees have not attempted to evaluate PIL as a separate entity, and all subsequent refer-ences to Putnam Management below should be deemed to include reference to PIL as necessary or appropriate in the context.)
The Independent Trustees’ approval was based on the following conclusions:
• That the fee schedule in effect for your fund represented reasonable compensation in light of the nature and quality of the services being provided to the fund, the fees paid by competitive funds, the costs incurred by Putnam Management in providing services to the fund, and the continued application of certain reductions and waivers noted below; and
• That the fee schedule in effect for your fund represented an appropriate sharing between fund shareholders and Putnam Management of such economies of scale as may exist in the management of the fund at current asset levels.
These conclusions were based on a comprehensive consideration of all information provided to the Trustees and were not the result of any single factor. Some of the factors that figured particularly in the Trustees’ delib-erations and how the Trustees considered these factors are described below, although individual Trustees may have evaluated the informa-tion presented differently, giving different weights to various factors. It is also important to recognize that the management arrangements for your fund and the other Putnam funds are the result of many years of review and discussion between the Independent Trustees and Putnam Management, that some aspects of the arrangements may receive greater scrutiny in some years than others, and that the Trustees’ conclu-sions may be based, in part, on their consideration of fee arrangements in previous years. For example, with some minor exceptions, the funds’ current fee arrangements under the management contracts were first implemented at the beginning of 2010 following extensive review by the Contract Committee and discussions with representatives of Putnam Management, as well as approval by shareholders.
Management fee schedules and total expensesThe Trustees reviewed the management fee schedules in effect for all Putnam funds, including fee levels and breakpoints. The Trustees also reviewed the total expenses of each Putnam fund, recognizing that in most cases management fees represented the major, but not the sole, determinant of total costs to fund shareholders. (In a few instances, funds have implemented so-called “all-in” management fees covering substantially all routine fund operating costs.)
In reviewing fees and expenses, the Trustees generally focus their atten-tion on material changes in circumstances — for example, changes in assets under management, changes in a fund’s investment strategy, changes in Putnam Management’s operating costs or profitability, or changes in competitive practices in the mutual fund industry — that suggest that consideration of fee changes might be warranted. The Trustees concluded that the circumstances did not indicate that changes to the management fee structure for your fund would be appropriate at this time.
Under its management contract, your fund has the benefit of break-points in its management fee schedule that provide shareholders with economies of scale in the form of reduced fee rates as assets under management in the Putnam family of funds increase. The Trustees concluded that the fee schedule in effect for your fund represented an appropriate sharing of economies of scale between fund shareholders and Putnam Management.
As in the past, the Trustees also focused on the competitiveness of each fund’s total expense ratio. In order to support the effort to have fund expenses meet competitive standards, the Trustees and Putnam Management have implemented a contractual expense limitation appli-cable to specified open-end funds, including your fund, of 20 basis points on so-called “other expenses” (i.e., all expenses exclusive of manage-ment fees, distribution fees, investor servicing fees, investment-related expenses, interest, taxes, brokerage commissions, acquired fund fees and expenses and extraordinary expenses). This expense limitation attempts to maintain competitive expense levels for the funds. Most funds,
Trustee approval of management contract

Putnam VT Investors Fund 15
including your fund, had sufficiently low expenses that this expense limi-tation was not operative during their fiscal years ending in 2016. Putnam Management has agreed to maintain this expense limitation until at least April 30, 2019 and has agreed to implement a contractual expense limitation applicable to specified retail open-end funds, including your fund, of 25 basis points on investor servicing fees and expenses until at least August 31, 2018. Putnam Management’s support for these expense limitation arrangements was an important factor in the Trustees’ deci-sion to approve the continuance of your fund’s management and sub-management contracts.
The Trustees reviewed comparative fee and expense information for a custom group of competitive funds selected by Broadridge Financial Solutions, Inc. (“Broadridge”). This comparative information included your fund’s percentile ranking for effective management fees and total expenses (excluding any applicable 12b-1 fee), which provides a general indication of your fund’s relative standing. In the custom peer group, your fund ranked in the second quintile in effective management fees (determined for your fund and the other funds in the custom peer group based on fund asset size and the applicable contractual management fee schedule) and in the second quintile in total expenses (excluding any applicable 12b-1 fees) as of December 31, 2016. The first quintile represents the least expensive funds and the fifth quintile the most expensive funds. The fee and expense data reported by Broadridge as of December 31, 2016 reflected the most recent fiscal year-end data available in Broadridge’s database at that time.
In connection with their review of fund management fees and total expenses, the Trustees also reviewed the costs of the services provided and the profits realized by Putnam Management and its affiliates from their contractual relationships with the funds. This information included trends in revenues, expenses and profitability of Putnam Manage-ment and its affiliates relating to the investment management, investor servicing and distribution services provided to the funds. In this regard, the Trustees also reviewed an analysis of Putnam Management’s reve-nues, expenses and profitability, allocated on a fund-by-fund basis, with respect to the funds’ management, distribution, and investor servicing contracts. For each fund, the analysis presented information about reve-nues, expenses and profitability for each of the agreements separately and for the agreements taken together on a combined basis. The Trustees concluded that, at current asset levels, the fee schedules in place repre-sented reasonable compensation for the services being provided and represented an appropriate sharing between fund shareholders and Putnam Management of such economies of scale as may exist in the management of the Putnam funds at that time.
The information examined by the Trustees in connection with their annual contract review for the Putnam funds included information regarding fees charged by Putnam Management and its affiliates to institutional clients, including defined benefit pension and profit-sharing plans, chari-ties, college endowments, foundations, sub-advised third-party mutual funds, state, local and non-U.S. government entities, and corporations. This information included, in cases where an institutional product’s investment strategy corresponds with a fund’s strategy, comparisons of those fees with fees charged to the Putnam funds, as well as an assess-ment of the differences in the services provided to these different types of clients as compared to the services provided to the Putnam Funds. The Trustees observed that the differences in fee rates between these clients and the Putnam funds are by no means uniform when examined by individual asset sectors, suggesting that differences in the pricing of investment management services to these types of clients may reflect,
among other things, historical competitive forces operating in separate markets. The Trustees considered the fact that in many cases fee rates across different asset classes are higher on average for mutual funds than for institutional clients, as well as the differences between the services that Putnam Management provides to the Putnam funds and those that it provides to its other clients. The Trustees did not rely on these compari-sons to any significant extent in concluding that the management fees paid by your fund are reasonable.
Investment performanceThe quality of the investment process provided by Putnam Management represented a major factor in the Trustees’ evaluation of the quality of services provided by Putnam Management under your fund’s manage-ment contract. The Trustees were assisted in their review of the Putnam funds’ investment process and performance by the work of the invest-ment oversight committees of the Trustees, which meet on a regular basis with the funds’ portfolio teams and with the Chief Investment Offi-cers and other senior members of Putnam Management’s Investment Division throughout the year. In addition, in response to a request from the Independent Trustees, Putnam Management provided the Trustees with in-depth presentations regarding each of the equity and fixed income investment teams, including the operation of the teams and their investment approaches. The Trustees concluded that Putnam Manage-ment generally provides a high-quality investment process — based on the experience and skills of the individuals assigned to the manage-ment of fund portfolios, the resources made available to them, and in general Putnam Management’s ability to attract and retain high-quality personnel — but also recognized that this does not guarantee favorable investment results for every fund in every time period.
The Trustees considered that 2016 was a challenging year for the perfor-mance of the Putnam funds, with generally disappointing results for the international and global equity funds and taxable fixed income funds, mixed results for small-cap equity, Spectrum, global asset alloca-tion, equity research and tax exempt fixed income funds, but generally strong results for U.S. equity funds. The Trustees noted, however, that they were encouraged by the positive performance trend since mid-year 2016 across most Putnam Funds. In particular, from May 1, 2016 through April 30, 2017, 51% of Putnam Fund assets were in the top quartile and 87% were above the median of the Putnam Funds’ competitive industry rankings. They noted that the longer-term performance of the Putnam funds generally continued to be strong, exemplified by the fact that the Putnam funds were ranked by the Barron’s/Lipper Fund Families survey as the 5th-best performing mutual fund complex out of 54 complexes for the five-year period ended December 31, 2016. In addition, while the survey ranked the Putnam Funds 52nd out of 61 mutual fund complexes for the one-year period ended 2016, the Putnam Funds have ranked 1st or 2nd in the survey for the one-year period three times since 2009 (most recently in 2013). They also noted, however, the disappointing invest-ment performance of some funds for periods ended December 31, 2016 and considered information provided by Putnam Management regarding the factors contributing to the underperformance and actions being taken to improve the performance of these particular funds. The Trustees indicated their intention to continue to monitor closely the performance of those funds, including the effectiveness of any efforts Putnam Manage-ment has undertaken to address underperformance and whether additional actions to address areas of underperformance are warranted.
For purposes of the Trustees’ evaluation of the Putnam Funds’ investment performance, the Trustees generally focus on a competitive industry ranking of each fund’s total net return over a one-year, three-year and

16 Putnam VT Investors Fund
five-year period. For a number of Putnam funds with relatively unique investment mandates for which Putnam Management informed the Trustees that meaningful competitive performance rankings are not considered to be available, the Trustees evaluated performance based on their total gross and net returns and, in most cases, comparisons of those returns with the returns of selected investment benchmarks. In the case of your fund, the Trustees considered that its class IA share cumulative total return performance at net asset value was in the following quartiles of its Lipper Inc. (“Lipper”) peer group (Lipper VP (Underlying Funds) — Large-Cap Core Funds) for the one-year, three-year and five-year periods ended December 31, 2016 (the first quartile representing the best-performing funds and the fourth quartile the worst-performing funds):
One-year period Three-year period Five-year period
1st 2nd 1st
Over the one-year, three-year and five-year periods ended December 31, 2016, there were 184, 176 and 166 funds, respectively, in your fund’s Lipper peer group. (When considering performance information, share-holders should be mindful that past performance is not a guarantee of future results.)
The Trustees also considered Putnam Management’s continued efforts to support fund performance through initiatives including structuring compensation for portfolio managers and research analysts to enhance accountability for fund performance, emphasizing accountability in the portfolio management process, and affirming its commitment to a fundamental-driven approach to investing. The Trustees noted further that Putnam Management continued to strengthen its fundamental research capabilities by adding new investment personnel.
Brokerage and soft-dollar allocations; investor servicingThe Trustees considered various potential benefits that Putnam Manage-ment may receive in connection with the services it provides under the management contract with your fund. These include benefits related to brokerage allocation and the use of soft dollars, whereby a portion of
the commissions paid by a fund for brokerage may be used to acquire research services that are expected to be useful to Putnam Manage-ment in managing the assets of the fund and of other clients. Subject to policies established by the Trustees, soft dollars generated by these means are used predominantly to acquire brokerage and research services (including third-party research and market data) that enhance Putnam Management’s investment capabilities and supplement Putnam Management’s internal research efforts. However, the Trustees noted that a portion of available soft dollars continues to be used to pay fund expenses. The Trustees indicated their continued intent to monitor regu-latory and industry developments in this area with the assistance of their Brokerage Committee, including any developments with respect to the European Union’s updated Markets in Financial Instruments Directive and its potential impact on PIL’s use of client commissions to obtain investment research. The Trustees also indicated their continued intent to monitor the allocation of the Putnam funds’ brokerage in order to ensure that the principle of seeking best price and execution remains paramount in the portfolio trading process.
Putnam Management may also receive benefits from payments that the funds make to Putnam Management’s affiliates for investor or distri-bution services. In conjunction with the annual review of your fund’s management and sub-management contracts, the Trustees reviewed your fund’s investor servicing agreement with Putnam Investor Services, Inc. (“PSERV”) and its distributor’s contracts and distribution plans with Putnam Retail Management Limited Partnership (“PRM”), both of which are affiliates of Putnam Management. The Trustees concluded that the fees payable by the funds to PSERV and PRM, as applicable, for such services are fair and reasonable in relation to the nature and quality of such services, the fees paid by competitive funds, and the costs incurred by PSERV and PRM, as applicable, in providing such services. Further-more, the Trustees believed that the services provided were required for the operation of the funds, and that they were of a quality at least equal to those provided by other providers.

Putnam VT Investors Fund 17
Investment ManagerPutnam Investment Management, LLCOne Post Office SquareBoston, MA 02109
Investment Sub-AdvisorPutnam Investments Limited57–59 St James’s StreetLondon, England SW1A 1LD
Marketing ServicesPutnam Retail ManagementOne Post Office SquareBoston, MA 02109
Investor Servicing AgentPutnam Investor Services, Inc.Mailing address:P.O. Box 8383Boston, MA 02266-83831-800-225-1581
CustodianState Street Bank and Trust Company
Legal CounselRopes & Gray LLP
TrusteesJameson A. Baxter, ChairKenneth R. Leibler, Vice ChairLiaquat AhamedRavi AkhouryBarbara M. BaumannKatinka DomotorffyCatharine Bond HillPaul L. JoskowRobert E. PattersonGeorge Putnam, IIIRobert L. ReynoldsManoj P. Singh
Other important informationProxy votingPutnam is committed to managing our mutual funds in the best interests of our shareholders. The Putnam funds’ proxy voting guidelines and proce-dures, as well as information regarding how your fund voted proxies relating to portfolio securities during the 12-month period ended June 30, 2017, are available in the Individual Investors section of putnam.com and on the Securities and Exchange Commission’s [SEC] website, www.sec.gov. If you have questions about finding forms on the SEC’s website, you may call the SEC at 1-800-SEC-0330. You may also obtain the Putnam funds’ proxy voting guidelines and procedures at no charge by calling Putnam’s Shareholder Services at 1-800-225-1581.
Fund portfolio holdingsEach Putnam VT fund will file a complete schedule of its portfolio holdings with the SEC for the first and third quarters of each fiscal year on Form N-Q. Shareholders may obtain the fund’s Form N-Q on the SEC’s website at www.sec.gov. In addition, the fund’s Form N-Q may be reviewed and copied at the SEC’s Public Reference Room in Washington, D.C. You may call the SEC at 1-800-SEC-0330 for information about the SEC’s website or the operation of the Public Reference Room.
Fund information
The fund’s Statement of Additional Information contains additional information about the fund’s Trustees and is available without charge upon request by calling 1-800-225-1581.

This report has been prepared for the shareholders of Putnam VT Investors Fund.
H516
VTSA012 306778 8/17