Embed Size (px)
Citation preview

arX
iv:1
302.
3724
v1 [
phys
ics.
atom
-ph]
15
Feb
2013
Coherent Population Trapping Resonances in Buffer Gas-filled Cs Vapor Cells with
Push-Pull Optical Pumping
Xiaochi Liu1, Jean-Marc Merolla1, Stephane Guerandel2,
Christophe Gorecki1, Emeric de Clercq2 and Rodolphe Boudot11FEMTO-ST, CNRS, 32 avenue de l’observatoire 25044 Besancon Cedex, France
2LNE-SYRTE, Observatoire de Paris, CNRS, UPMC,
61 avenue de l’Observatoire, 75014 Paris, France
(Dated: February 18, 2013)
We report on a theoretical study and experimental characterization of coherent population trap-ping (CPT) resonances in buffer gas-filled vapor cells with push-pull optical pumping (PPOP) onCs D1 line. We point out that the push-pull interaction scheme is identical to the so-called lin⊥lin
polarization scheme. Expressions of the relevant dark states, as well as of absorption, are reported.The experimental setup is based on the combination of a distributed feedback (DFB) diode laser, apigtailed intensity Mach-Zehnder electro-optic modulator (MZ EOM) for optical sidebands genera-tion and a Michelson-like interferometer. A microwave technique to stabilize the transfer functionoperating point of the MZ EOM is implemented for proper operation. A CPT resonance contrastas high as 78 % is reported in a cm-scale cell for the magnetic-field insensitive clock transition.The impact of the laser intensity on the CPT clock signal key parameters (linewidth - contrast -linewidth/contrast ratio) is reported for three different cells with various dimensions and buffer gascontents. The potential of the PPOP technique for the development of high-performance atomicvapor cell clocks is discussed.
PACS numbers: 42.50.Gy, 32.80.Qk, 06.30.Ft
I. INTRODUCTION
In Coherent Population Trapping (CPT) physics [1, 2], atoms are trapped through a destructive quantuminterference process into a non-interacting coherent superposition of two long-lived ground state hyperfine levels.Under ideal conditions (isolated three-level scheme, no ground-state decoherence), this so-called dark state, obtainedby simultaneous action of two resonant optical fields exactly frequency-split by the atomic ground state hyperfinefrequency, is fully decoupled from the excited state. In this particular state is observed through electromagneticallyinduced transparency (EIT) [3] a narrow peak in optical transmission. The CPT resonance linewidth is limitedby the atom-light interaction time and can be measured to be of a few tens to hundreds of Hz [4, 5]. CPTresonance lineshapes and properties have been widely investigated for precision sensing in view of applications inhigh-resolution spectroscopy, magnetometers [6, 7], laser cooling [8], slow light [9] or quantum frequency standards [10].
The short-term frequency stability σy(τ) of an atomic clock, described by the Allan deviation [11], is given by:
σy(τ) =∆ν
ν0
1
SNRτ−1/2 (1)
where ν0 is the clock frequency (9.192 631 770 GHz for the unperturbed Cs atom), ∆ν is the clock resonance full-width at half maximum (FWHM), SNR is the clock resonance signal-to-noise ratio in a 1 Hz bandwidth and τ is theaveraging time of the measurement. We define as the clock resonance contrast C the ratio between the CPT signalheight and the CPT signal background. A simplified expression of the signal to noise ratio, where photon shot noiseis the only noise source considered, is given in [12] by:
SNR = C
√Pout
2hν(2)
where Pout is the optical power at the output the cell and hν is the energy of a single photon.
The development of a high-frequency stability atomic clock requires to detect a narrow atomic resonance with thehighest signal to noise ratio. In traditional vapor cell clocks based on CPT, atoms are probed using two circularlypolarized optical fields as shown on Fig. 1(a). This interaction scheme leads numerous atoms to be concentrated atthe extreme Zeeman magnetic sub-levels with the highest angular momentum mF [13]. Consequently, only a smallfraction of atoms participate to the magnetic field insensitive clock transition resulting in CPT resonances with verylow contrast of about 1 %. Higher contrasts on the clock transition are achieved by increased laser power but at the

2
expense of laser power broadening. Therefore, traditional CPT clocks typically operate with low laser intensities tominimize the linewidth-SNR ratio and to optimize the clock frequency stability.
Different optimized CPT pumping schemes were proposed to optically pump the maximum number of atoms intothe dark state out of any other trap state and consequently increase dramatically the CPT resonance contrast. Y.Jau et al. proposed the push-pull optical pumping (PPOP) scheme (see Fig. 1(b)) where atoms interact with a D1
line resonant bi-chromatic optical field separated into right and left circularly polarized sub-beams, with a sub-beamdelayed with respect to the other by a half period of the hyperfine transition [14]. The resulting light beam canbe seen as alternating between the states of right and left circular polarization. The two frequencies differ by theground state hyperfine splitting. This scheme, called a double Λ scheme, prevents the pumping of the atoms in anextreme Zeeman sub-level trapping state. These experiments were done on a Rb vapor cell and contrasts up to 30 %were reported. Push-pull optical pumping was later used in an elegant mode-locked laser atomic oscillator where a Kvapor cell, inserted in the external cavity of a semiconductor diode laser, acts as an optical modulator and causes thelaser to be self-modulated at the clock transition frequency of the atoms [15]. Recently, Zhang et al. reported resultsobtained with PPOP using an original experimental set-up [16]. In 2005, T. Zanon et al. demonstrated the detectionof increased CPT resonance contrasts in Cs vapor with a so-called lin⊥lin double Λ interaction scheme using twolinear orthogonally polarized optical lines [17] (see Fig. 1(b)). CPT contrasts higher than 50 % were obtained usingthis technique [18], allowing by combination with a Ramsey-type pulsed sequence to reach a CPT clock frequencystability better than 7× 10⁻¹³ at 1 s [19]. Recently, efforts have been done in different groups to realize this lin⊥lin
interaction scheme with a single laser source and simplified set-ups [20–22].Another optimized CPT pumping method based on the use of a σ+ − σ− configuration of polarized counterprop-
agating waves resonant with D1 line of alkali metal atoms in small-size cells was proposed in [23]. This scheme isequivalent to the PPOP, but the phase condition between both beams requires a particular place of the cell alongthe beams and a cell length small compared to the microwave wavelength. The same group proposed the lin||lininteraction scheme, using bichromatic linearly polarized light, in order to increase significantly the contrast of darkresonances on the D1 line of alkali atoms with nuclear spin I = 3/2 [24]. A prototype atomic clock based on thisconfiguration in Rb atomic vapor was developed in [25, 26]. The method was also implemented with alkali atoms oflarge nuclear spin (Cs atom: I = 7/2) and demonstrated a CPT constrast of about 10 % [27]. However the lin||linconfiguration does not create a dark state between mF = 0 Zeeman sublevels, but between mF = ±1 sublevels ofboth hyperfine levels (see section II B 3).
This paper reports detailed characterization of CPT resonances in buffer gas-filled Cs vapor cells using Push-PullOptical Pumping. While most of the above-cited literature is mainly focused on the CPT clock resonance contrast,further investigations are reported here on the clock signal key parameters including linewidth, contrast and linewidth-contrast ratio for three different cells. Section II reports a basic theoretical analysis on the push-pull optical pumpingprocess. The equivalence between the phase delay between two bi-chromatic circularly polarized beams and the anglebetween the polarization vectors of two monochromatic linearly polarized beams is shown. It is demonstrated thatPPOP and lin⊥lin schemes are similar processes. Details on the dark states and absorption equations are described.Section III describes the experimental set-up used to detect CPT resonances with PPOP on the Cs D1 line at 895nm. The key component for the generation of CPT optical sidebands is an external LiNbO3 pigtailed intensityMach-Zehnder electro-optic modulator (MZ EOM). An original microwave stabilization technique of the MZ EOMtransfer function operating point is implemented and described. Section IV reports experimental results includingmain characteristics of the CPT resonance lineshape for three different cells versus the laser intensity. Contrasts up to78 % are reported in a centimetre-sized Cs vapor cell. Section V discusses about the potential of the PPOP techniquefor the development of high-performance CPT atomic clocks.
II. THEORETICAL ANALYSIS
A. Pumping waves
The principle of push-pull CPT interaction is shown on Fig. 1(b). Push-pull interaction scheme uses two setsof circularly polarized fields, rotating in opposite directions, propagating along the z axis. Each set contains twofrequencies ω1 and ω2; one set is phase delayed with respect to the other one. The right-handed circularly polarized
beam,−→Er, and the left-handed circularly polarized one
−→El, can be written using the Jones vectors [28]:

3
−→Er(t) =
(Erx(t)Ery(t)
)=
E1
2ei(k1z−ω1t)
(1−i
)+
E2
2ei(k2z−ω2t+η)
(1−i
),
−→El(t) =
E1
2ei(k1z−ω1t+ϕ)
(1+i
)+
E2
2ei(k2z−ω2t+η+ϕ′)
(1+i
),
(3)
where E1, E2 are the amplitudes of the rotating fields, k1 (k2) is the wave number of the field E1 (E2) and η is thephase difference between the two fields. ϕ, ϕ′ are the phase shifts due to the optical path difference ∆z between theEl and the Er fields such as:
ϕ = k1∆z, ϕ′ = k2∆z. (4)
As the two optical frequencies ω1, ω2 are very close, a beat-note occurs for each beam. For the sake of simplicitythe calculation is performed in the case of equal amplitudes E2 = E1. Equations (3),(4) can be rewritten as :
−→Er(t) = E1e
i2[(k1+k2)z−(ω1+ω2)t+η]) cos
[(k1 − k2)z − (ω1 − ω2)t− η
2
](1−i
),
−→El(t) = E1e
i2 [(k1+k2)z−(ω1+ω2)t+η+ϕ+ϕ′]) cos
[(k1 − k2)z − (ω1 − ω2)t− η + ϕ− ϕ′
2
](1+i
).
(5)
The two sets of circularly polarized waves exhibit a beat note at the angular frequency (ω1 − ω2)/2, phase shiftedrelative to each-other by:
θ =ϕ− ϕ′
2=
(k1 − k2)∆z
2= π
∆z
λmw, (6)
with λmw the wavelength of the microwave wave of angular frequency (ω1 − ω2).
When the terms of same frequency are grouped together, we get:
−→E1 =
E1
2ei(k1z−ω1t)
[(1−i
)+ eiϕ
(1+i
)]= E1e
i(k1z−ω1t+ϕ2)
(cos(ϕ2 )− sin(ϕ2 )
),
−→E2 =
E2
2ei(k2z−ω2t+η)
[(1−i
)+ e+iϕ′
(1+i
)]= E2e
i(k2z−ω2t+η+ϕ′
2)
(cos(ϕ
′
2 )
− sin(ϕ′
2 )
).
(7)
Equations (7) represent linearly polarized waves of angle −ϕ/2 and −ϕ′/2, respectively, with the x axis. The anglebetween both polarization vectors is:
θ =−ϕ′ + ϕ
2= (k1 − k2)
∆z
2. (8)
Then
θ = 0 when ∆z = 2pλmw,
θ =π
2when ∆z =
(2p+
1
2
)λmw,
(9)
with p an integer.
Here, we demonstrate that the push-pull scheme is identical to two linearly polarized waves of angular frequenciesω1 and ω2 respectively. Their polarization vectors form an angle θ = π∆z/λmw, depending on the path difference∆z. If the path difference is realized in a Michelson interferometer like in [14], it is worth to note that a displacementδz of a mirror in one arm of the interferometer yields a path difference 2δz. Then, the angle between polarizationvectors increases from 0 to π/2 for a displacement δz = λmw/4. This angle is equal to the phase shift between thetwo beat-notes of eq. (5), which are in phase and in quadrature when θ = 0 and θ = π/2, respectively. Finally, wepoint out that the push-pull scheme is identical to the lin⊥lin scheme of [17] when θ = π/2.

4
B. Dark States
1. Interaction Hamiltonian
As the push-pull scheme is equivalent to two linear polarized fields with an angle θ between them, we considernow this last case. The same calculation can be performed with circular polarizations. Let’s assume two waves
copropagating along the z axis,−→E1 parallel to x axis, and
−→E2 forming an angle θ with the x axis.
−→E1(t) = E1(t)ex =
E1(t)√2
(e− − e+),
−→E2(t) = E2(t) (cos(θ)ex + sin(θ)ey) =
E2(t)√2
[eiθe− − e−iθ e+
],
(10)
with E1(t) = E1(e−iω1t + eiω1t)/2, E2(t) = E2(e
−i(ω2t−η) + ei(ω2t−η))/2. We used the standard basis, defined as:
e± = ∓(ex ± iey)/√2, e0 = ez. The interaction Hamiltonian between the atoms and the electromagnetic fields is the
dipole interaction Hamiltonian:
V = −−→D ·
(−→E1(t) +
−→E2(t)
)= V1 + V2, (11)
where−→D is the electric dipole operator. The operators V1, V2 are equal to:
V1 =E1(t)√
2(D+ −D−) ,
V2 =E2(t)√
2
(D+e
−iθ −D−eiθ).
(12)
where D+ and D− are the standard components of D such as: D+ = −(Dx + iDy)/√2, D− = (Dx − iDy)/
√2.
We consider a four-level atom, two hyperfine levels of the ground state with quantum magnetic number m = 0,|1〉 and |2〉, and two Zeeman sublevels |3〉 and |4〉 in the excited state, with m = −1 and m = +1 respectively (see
Fig.1(b)). The field−→E1(t) is resonant with the transitions |1〉 − |3〉 and |1〉 − |4〉, −→E2(t) with the transitions |2〉 − |3〉
and |2〉 − |4〉. The V2 term can be written:
V2 =dE2(t)√
2
[e−iθ (c42|4〉〈2| − c32|2〉〈3|)− eiθ (c32|3〉〈2| − c42|2〉〈4|)
], (13)
with d = 〈Je||D||Jg〉/√2Je + 1, Je, Jg the total electronic angular momentum quantum numbers of the excited and
ground states, respectively. The cij coefficients are the Clebsch-Gordan coefficients such that 〈i|D|j〉 = dij = cijd;
their values for alkali-metal atoms are given in appendix 4E of [29]. In the rotating frame V2 becomes V2 [30] :
V2 = T (t)V2T†(t), (14)
with:T (t) = e−iS(t),
S(t) = ω2t|2〉〈2|.(15)
In the rotating wave approximation we get:
V2 =dE2
2√2
ei(η−θ)c42|4〉〈2| − ei(η+θ)c32|3〉〈2|+ e−i(η−θ)c42|2〉〈4| − e−i(η+θ)c32|2〉〈3|
. (16)
The same calculation leads to:
V1 =dE1
2√2c41|4〉〈1| − c31|3〉〈1|+ c41|1〉〈4| − c31|1〉〈3| . (17)

5
2. Dark States
The dark state, when it exists, is a linear superposition of the two ground states: |dark〉 = a|1〉 + b|2〉. It mustsatisfy:
(V1 + V2)|dark〉 = 0. (18)
Substituting V1 and V2 by their expression in (17), (16), it comes:
b
a= −c31
c32
E1
E2e−i(η+θ),
b
a= −c41
c42
E1
E2e−i(η−θ),
(19)
where the first (second) equation holds for coupling with the |3〉 (|4〉) excited state, respectively. A dark state commonto the two Λ schemes exists when the following condition is satisfied:
ei2θ =c42c41
c31c32
. (20)
We consider the Cs D1 line. The |1〉 and |2〉 states are the ground states |F = 3,m = 0〉 and |F = 4,m = 0〉,respectively, with F the hyperfine quantum number. The states |3〉 and |4〉 are the states |F ′,m = −1〉 and |F ′,m =+1〉, respectively of the 62P1/2 excited state hyperfine level F ′ (F ′ = 3 or F ′ = 4). The Clebsch-Gordan coefficientsare such that:
F ′ = 4 : c42 = −c41 c32 = c31 = c41
F ′ = 3 : c42 = −c41 c32 = c31 = −c41.(21)
These relations are valid for theD1 line of all alkali-metal atoms, but not for theD2 line. The dark states correspondingto the transitions towards |3〉 and towards |4〉 are:
|dark3〉 =1√
E21 + E2
2
(E2|1〉 − E1e−i(η+θ)|2〉)
|dark4〉 =1√
E21 + E2
2
(E2|1〉+ E1e−i(η−θ)|2〉).
(22)
Note that when θ = 0 and E1 = E2 the dark state |dark3〉 for the transitions with |3〉 is the bright state for thetransitions with |4〉, and vice-versa. In this case, no CPT effect occurs. According to (20) and (21) a common darkstate exists when ei2θ = −1, i. e.:
θ =π
2+ kπ, (23)
where k is an integer. The common dark state is then:
|dark+〉 =1√
E21 + E2
2
(E2|1〉+ iE1e−iη|2〉) when θ =
π
2+ 2kπ,
|dark−〉 =1√
E21 + E2
2
(E2|1〉 − iE1e−iη|2〉) when θ = −π
2+ 2kπ,
i.e.,
|dark〉 = 1√E2
1 + E22
(E2|1〉+ E1eiθe−iη|2〉) when θ =
π
2+ kπ.
(24)
It is worth to note that, according to relations (21), this dark state is also common to transitions involving the twoexcited levels of the D1 line of alkali-metal atoms, of hyperfine number (F ′ = I − 1/2) and (F ′ = I + 1/2) with Ithe nuclear spin quantum number, as already reported in [31]. This means that in a vapor cell where the opticaltransitions are broadened by Doppler effect and buffer gas collisions, the dark state built with an optical transition isnot destroyed by the coupling with the other hyperfine excited level.

6
3. ∆m = 2 transitions
Double Λ schemes as PPOP or lin⊥lin induce two single Λ transitions corresponding to ∆m = 2 [19, 32]. Thesetransitions are enabled by the coexistence of σ+ and σ− polarized light. They are those created in lin||lin configuration[24]. One transition couples the states |F = I − 1/2,m− 1〉 and |F = I + 1/2,m+ 1〉, and the other one the states|F = I + 1/2,m − 1〉 and |F = I − 1/2,m + 1〉. For simplification, these states are labeled |1′〉, |2′′〉, |2′〉, |1′′〉,respectively. Calculations lead to the dark states expressions:
|dark1′2′′〉 =1√
c201′E21 + c202′′E
22
(c02′′E2|1′〉+ c01′E1e−i(η+θ)|2′′〉)
|dark2′1′′〉 =1√
c202′E21 + c201′′E
22
(c01′′E1|2′〉+ c02′E2e−i(η−θ)|1′′〉),
(25)
where the cij coefficients are the Clebsch-Gordan coefficients defined above. These dark states are independent andexist whatever the value of θ. The corresponding CPT resonances split by increasing the magnetic field value. Unlikeprevious dark states, these dark states are not common to both excited hyperfine levels of the D1 line. Cs atoms inthese states are not fully uncoupled from the laser field because the transitions towards other excited Zeeman sublevelsremain.
C. Absorption
An analytical calculation of the light propagation in a medium of four-level atoms in a double Λ configuration hasbeen performed by Korsunsky and Kosachiov [33]. This was realized in the particular case corresponding to the D1
line of an alkali-metal atom with E1 = E2, at resonance. Following their calculation it is more convenient to use Rabifrequencies rather than field amplitudes, with Ωij = |dijEij |/~, where Eij is the amplitude of the field componentcoupling the atomic states |i〉 and |j〉. At the steady-state the absorption of the Rabi frequency along the cell lengthz is governed by:
dΩij
dz= − nd
ε0c~ωij |dij |2Im(ρij), (26)
where nd is the density of involved atoms, ωij is the Bohr angular frequency between |i〉 and |j〉, ρij is the opticalcoherence in the rotating frame, ε0 is the vacuum permittivity, c the speed of light and ~ the Plank constant dividedby 2π.From the expression of the steady-state optical coherences density matrix elements imaginary part established in
[33], it can be shown that the absorption phenomenon along z can be described at low saturation Ωij ≪ Γij by:
dΩij
dz≃ − nd
8ε0c~ωij |dij |2
Ω2ij (1− cos(Φ)) + 2Γijγ2
ΩijΓij, (27)
with Γij the relaxation rate of the population |i〉 towards |j〉, γ2 the hyperfine coherence decay rate and dij = |dij |eiηij .Φ is a relative phase given by:
Φ = (β31 − β32)− (β41 − β42), (28)
with βij = ϕij + ηij the sum of the laser phase ϕij and the phase of the atomic dipole moment ηij . Using Eq. (3),(4), and (28) it comes:
(ϕ31 − ϕ32)− (ϕ41 − ϕ42) = (k1 − k2)∆z. (29)
According to (21) the phases ηij are equal to 0 or π, so that (η31 − η32)− (η41 − η42) = π. From (28) and (8) we get:
Φ = (k1 − k2)∆z + π = 2π∆z
λmw+ π = 2θ + π, (30)
dΩij
dz≃ − nd
4ε0c~ωij |dij |2
Ω2ij cos
2(θ) + Γijγ2
ΩijΓij. (31)
7
For the D1 line of alkali-metal atoms, the |dij | (and the Γij) coefficients are equal for the different involved atomicstates. We note Γ1 = Γij . With a good approximation, we consider that ω31 = ω41 = ω32 = ω42 = ωeg because theoptical angular frequencies ωij are very close. Consequently, we define the same absorption coefficient αd for the fourlaser fields such as:
αd =nd
2ε0c~
ωeg|dij |2Γ1
. (32)
In a Cs vapor cell, most atoms are not involved in the CPT resonance because of the presence of other Zeemansublevels for which the Raman detuning is too large. However, these atoms contribute to the laser light absorptionbecause the related optical transitions remain at resonance. In order to take into account this additional absorptionwe add an absorption coefficient αij , corresponding to the absorption of the laser beam of intensity Iij , related to Ωij
by Iij = ǫ0c~2Ω2
ij/2d2. Iij corresponds to an angular frequency ω1 or ω2 and a polarization σ− or σ+. Using Iij , αd,
αij the equation (31) becomes:
dIijdz
≃ −(αd cos
2(θ) + αij
)Iij −
nd
4~ωegγ2. (33)
The last term of (33) is the linear absorption expected for a closed system in a dark state (αij = 0, cos(θ) = 0)[33, 34]. The solution of (33) is:
Iij(z) ≃(Iij(0) +
(nd/4)~ωegγ2αij + αd cos2(θ)
)e−(αij+αd cos2(θ))z − (nd/4)~ωegγ2
αij + αd cos2(θ), (34)
where Iij(0) is the beam intensity at the cell input (z = 0), we recall that we have assumed that all the partialintensities are equal, Iij(0) = I0/4 with I0 the full laser intensity at the cell input.For reasons of symmetry the absorption coefficients αij of the beams σ+ and σ+ are equal. However, the absorptioncoefficients are different for the beams of angular frequencies ω1 and ω2, depending on the ground state hyperfinelevel involved. The full transmitted laser intensity is given by the sum of the four intensities: It =
∑Iij . In the
usual conditions of an alkali-metal vapour cell filled with buffer gas and for usual laser intensities, we assume that γ2is sufficiently weak (Ω2
ij ≫ Γijγ2) and the transmitted total laser intensity can be simplified as follows:
It(z) ≃I02e−αd cos2(θ)z
(e−α1z + e−α2z
), (35)
where the subscript 1, 2 holds for the angular frequencies ω1, ω2. When cos(θ) = 0, atoms involved in the dark statebecome fully transparent and eq. (35) reduces to the well-known Beer-Lambert law.Note that the model of [33] is valid for a four-level atom and equal laser intensities. Here we have many levels and,even if the laser intensities are equal at the input of the cell, as the absorption coefficients due to other levels aredifferent for the two frequencies, the laser intensities equality will not be valid after propagation inside the cell.
III. EXPERIMENTAL SET-UP
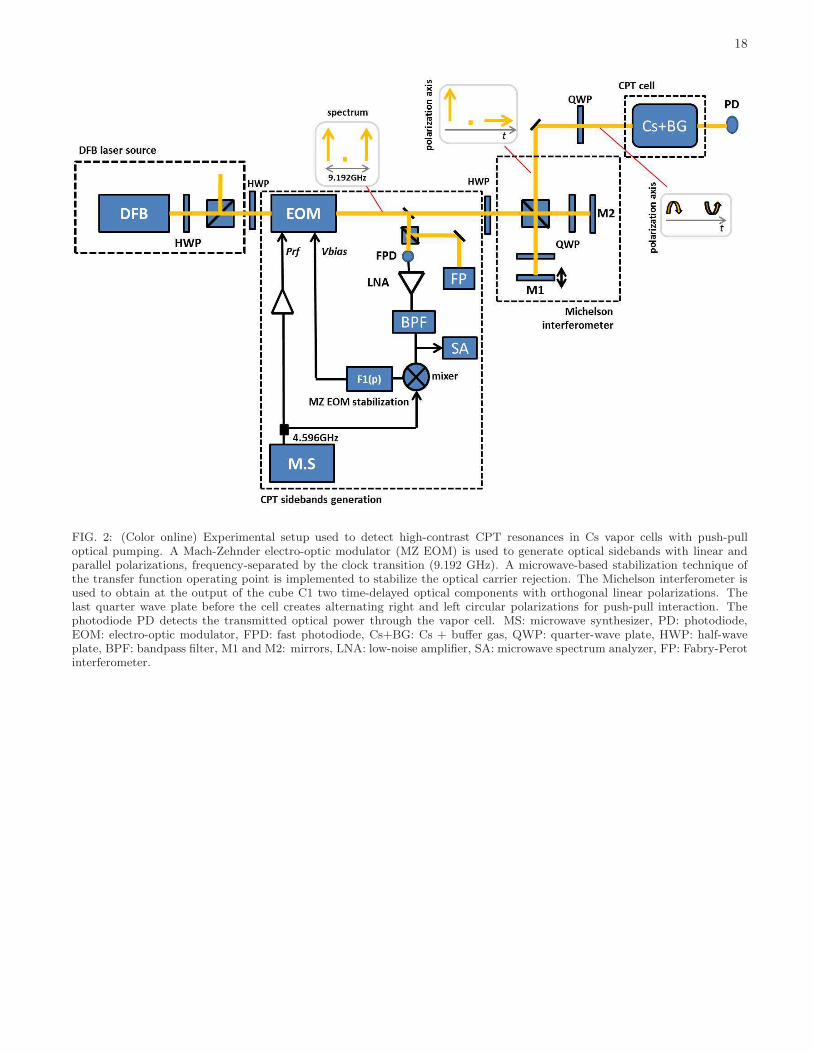
Fig. 2 shows the experimental set-up used to detect high-contrast CPT resonances in Cs vapor cells using Push-PullOptical Pumping. The setup is divided in four main basic blocks defined as the laser source, the optical sidebandsgeneration, a Michelson interferometer to produce two orthogonally polarized beams with a phase-delay betweenthem [14] and the Cs vapor cell physics package. These blocks are described in detail in the following.
The laser source is a 1MHz-linewidth DFB diode laser (Eagleyard EYP-DFB-0895) tuned on the Cs D1 line at894.6 nm [35]. The laser frequency is shited fro Cs atom resonance by about 4.596 GHz. The laser light is injectedinto a 20 GHz bandwidth polarization maintaining (PM) pigtailed Mach-Zehnder electro-optic modulator (MZ EOM,Photline NIR-MX800-LN). CPT sidebands are created by driving the EOM with a low noise 4.596 GHz microwavesignal generated by frequency division from a 9.192 GHz frequency synthesizer [36]. The 4.596 GHz signal power isactively stabilized by detecting a fraction of the microwave power with a Schottky diode detector and comparingthe resulting output voltage to a ultra-stable voltage reference (LM399). An error signal is generated and processedin a PI controller to send a correction voltage to a voltage-controlled attenuator at the output of the synthesizer.In the locked regime, microwave power fractional fluctuations are measured to be 1 × 10⁻³ at 1 s integration timeand better than 1 × 10⁻⁵ at 10000 s. Absolute phase noise performances of the synthesizer at 9.192 GHz weremeasured to be − 65 dBc/Hz and − 113 dBc/Hz at 1 Hz and 2 kHz offset frequency respectively, in good agreement
8
with performances of frequency-multiplied state-of-the-art quartz oscillators [37]. No phase noise degradation wasobserved between the 9.192 GHz optically carried signal at the output of the EOM and the synthesizer direct outputfor Fourier frequencies f < 1 kHz.The transfer function operating point of a MZ EOM is known to drift because of temperature variations, photore-fractive effects [38, 39] and aging. In our experiment, the EOM is stabilized at the mK level using a temperaturecontroller described in [40] to a value where the EOM power transmission sensitivity to temperature variations iscanceled at the first-order [41]. Moreover, we implemented an original microwave technique to stabilize the operatingpoint of the MZ EOM at the exact dark point where the optical carrier is suppressed. This method is based, as shownon Fig. 2, on the photodetection of the optically carried 4.6 GHz microwave signal, subsequent synchronous detectionwith a microwave mixer and active feedback control applied to the EOM dc electrode bias voltage Vbias. Fig. 3shows versus the voltage Vbias the first-order optical sidebands power (measured with a Fabry-Perot interferometer),the power of the 4.596 GHz optically carried signal detected at the output of the EOM with a fast photodiode, thevoltage Vm at the output of the mixer and the CPT signal height. For Vbias ≃ 3.1 V, the first-order optical sidebandspower (a) is maximized while the optical carrier power is minimized. It is then clearly observed that the mixeroutput voltage (c) exhibits a sharp zero-crossing point that can be used for EOM stabilization. In real experience,a microwave mixer with a ultra-low intrinsic offset output voltage is finely selected to prevent to be slightly shiftedfrom the exact dark point. For Vbias ≃ 3.1 V, the CPT signal height (d) is maximized while the CPT signal dcbackground is minimized, maximizing the CPT resonance contrast. Note that we observe that the mixer outputvoltage is also nulled in case where the optical sidebands power is minimum while the optical carrier is maximized.In this configuration (Vbias ≃ 6 V in this example), the CPT signal and contrast is greatly reduced. These lastresults confirm the necessity to stabilize actively the EOM bias point to the exact dark point for this application.Additionally, the presence of the optical carrier could also induce in clock applications other critical issues such aslight shift phenomena [42–45]. Fig. 4 reports the 4.6 GHz optical beatnote power versus time in respective caseswhere the servo loop is activated or not. In the free-running regime, the carrier suppression is degraded by about17 dB in 3000 s. In the stabilized regime, the relative carrier power fluctuations are less than 5 × 10⁻³ after 1000 sintegration time. Relative power fluctuations at the output of the EOM are reduced by a factor 100 in the stabilizedregime.
At the output of the EOM, the modulated light beam of fixed linear polarization passes through a half-wave plate.The incident beam is divided in two sub-beams in the two arms of a Michelson interferometer. A quarter-wave plateis placed in each arm. A fine adjustment of both quarter-wave plates and the half-wave plate allows to obtain atthe output of the polarizing cube two superimposed beams of equal intensity, linearly polarized at right angle, anddiffering by a phase delay. A mirror, mounted on a micrometric translation stage, allows to tune the time-delay. Adisplacement of the mirror of λ0/4, one quarter of the clock transition wavelength, induces a differential optical path∆ℓ = λ0/2, and shifts the intensity peaks of the beat-note on one beam by half a hyperfine period with respect to thepeaks of the other beam. A last quarter-wave plate ensures that the output beams are circularly polarized, rotatingin opposite directions.
The laser beam passes through a Cs vapor cell. The cell is temperature-stabilized at the mK level and surrounded bya static magnetic field parallel to the laser beam direction in order to lift the Zeeman degeneracy. The cell is isolatedfrom external electromagnetic perturbations with a double-layer mu metal shield. Three different cells, named Cell1, Cell 2 and Cell 3, were tested. Their main characteristics are reported in Table I. The temperature of each cellis set in order to maximize the CPT signal (see Table I). The cell 1 is microfabricated cell realized according to theprocess described in [46] and studied in [47] whereas cells 2 and 3 are glass-blown cm-scale pyrex vapor cells. Thetransmitted optical power through the cell is detected by a low noise photodiode.
IV. CPT RESONANCES
A. Push-pull CPT signal
Fig. 5 displays the light power transmitted through the cell 3 as a function of the position of the mirror of onearm of the Michelson interferometer. The squares are the experimental data. The dotted line is the light powerfar from CPT resonance for a large Raman detuning. The distance between two maxima is 16 mm which is halfthe wavelength of the clock transition. The optical path difference between both arms of the interferometer can bewritten ∆ℓ = 2(x − x0), where x is the mirror position and x0 the position where the optical path difference is nullor a multiple of λ0 (32.6 mm).

9
The theoretical signal, given by Eq. (35) with θ = 2π(x− x0)/λ0, can be written:
S = Smaxe−αd cos2(2π x−x0
λ0)L, (36)
with S is the transmitted power, Smax the signal at CPT resonance maximum and L the cell length. The dashedcurve is a fit of experimental data with αd and x0 the adjustable parameters. The agreement is not good. The solidline on Fig. 5 is a fit of Eq. (36) with an additional background. Surprisingly, the agreement is found to be very good.Nevertheless, the fitted value of the background is significant and very close of the off-CPT resonance signal. We haveno explanation for this and Eq.(36) with a background added can be considered as a phenomenological model.In our experimental conditions, the last term of Eq (34) is negligible and can not explain the disagreement between thetheoretical expression and experimental data. At the opposite, the latter could be explained by an oversimplificationof our model developed in section II C. Indeed, our model is based on analytical expressions from [33] calculated fora closed four level scheme whereas in our experience, atoms can circulate on the 16 Zeeman sublevels of the groundstate. At CPT resonance (θ = π/2), a significant part of the atoms are pumped in the dark state. When θ deviatesfrom π/2, a growing part of these atoms leaks towards other sublevels by absorption and spontaneous emission. Then,the atomic population of the states involved in the dark state decreases. This implies that the absorption coefficientsαd, α1, α2 of Eq. (34) are not constant but θ dependent. This could explain that experimental peaks are sharper thanin the theoretical case. For further study, a complete analytical calculation does not seem possible. A full numericalcalculation taking into account all the sublevels and all the optical transitions is required. The leak of the (m = 0)clock level populations when θ deviates from π/2 corresponds to an increase of the hyperfine coherence relaxation γ2,and consequently of the width of the CPT resonance. This is confirmed by the measurement of the resonance widthas a function of θ, shown by white dots curve on Fig. 5. It is clearly seen that the CPT width and the signal are inopposite phase.On Fig. 5, the difference between minimum experimental values and the off-CPT resonance signal (dashed line) can
be explained by the presence of neighboring ∆m= 2 CPT resonances close to the clock transition (see section II B 3).For illustration, Fig. 6 shows typical CPT spectra observed in the cell 3 for various static magnetic fields. ∆m= 2transitions connecting on Fig. 1 levels 2′ → 0 → 1′′ and 2′′ → 0 → 1′ are noted on Fig. 6 (1) and (2) respectively.For low static magnetic fields, adjacent peaks from ∆m= 2 transitions are not resolved. When the static magneticfield is increased, resonances (1) and (2) move apart the clock transition with opposite directions. We measured asensitivity of − 1141 Hz/G + 26 Hz/G2 and + 1125 Hz/G + 24 Hz/G2 for the frequency splitting ν(1) − ν0 and
ν(2) − ν0 respectively, that is in reasonable agreement with theoretical values ν = ±1116.5 Hz/G +27 Hz/G2. Asexpected by calculations, we observed that the amplitude of the neighboring ∆m= 2 transitions resonances does notchange with the mirror position. Compared to the clock transition, the relative amplitude of the ∆m= 2 transitionswas measured to be 6% in the experimental conditions of Fig. 5. Note that the presence of these ∆m= 2 transitionsinduces a broadening of the CPT clock resonance and can cause a supplemental sensitivity to the static magnetic field.
Figs 7(a) and 7(b) show a Zeeman spectrum obtained in the cell 2 with classical circular polarization and PPOP,respectively, for identical total incident laser intensity. It is clear that most of the atoms are lost in extreme Zeemansublevels with circular polarization. At the opposite, the number of atoms that participate to the central clocktransition is greatly favored with push-pull optical pumping. In this case, the Zeeman spectrum is found to be wellsymmetrical and the clock resonance contrast is here 5.5 %. Fig. 8 shows that extremely high contrasts can beobtained in the cell 3 by operating with high laser intensity. In this case, a CPT resonance with a contrast of 78% is detected with a laser beam diameter of 6 mm. To our knowledge, this value is among the best contrasts evermeasured on a CPT resonance.
B. PPOP potential for atomic clocks
This section is devoted to report the characterization of CPT resonances with PPOP in view of application tofrequency standards. From [14], it is noted that push-pull optical pumping operates correctly only if alternatingpolarizations are used and if the time-averaged optical pumping rate Γp greatly exceeds the ground-state relaxationrate γ2. This condition is fulfilled for the three cells of different size shown in Table I.Figures 9, 10, 11 display the linewidth, contrast and linewitdh-contrast ratio versus the laser intensity for the cells 1,2 and 3 respectively. As expected and already observed for single Λ schemes [48], the linewidth increases with higherlaser intensity. For all the cells, the CPT linewidth-laser intensity dependence is well fitted by a linear function and ismeasured to be (0.21 I+ 1.32) kHz, (0.19 I+ 0.59) kHz and (0.058 I+ 0.42) kHz for the cells 1, 2 and 3 respectively (Iis the laser intensity in µW/mm2). The resonance contrast increases with higher laser intensity because of increasedoptical pumping rate. This behavior is similar to the one reported in [14]. For a laser intensity of 30 µW/mm2, the

10
contrast is measured to be 4.7 %, 10.2 % and 45 % for the cells 1, 2 and 3 respectively. For the cell 1 (microcell), themaximum contrast is measured to be about 6 %. This value is only 2-3 times higher than the contrast obtained withclassical circular polarization. The linewidth-to-contrast ratio is minimized for laser intensities of about 3, 5 and 30µW/mm2 for cells 1, 2 and 3 respectively.The experimental values of the linewidth-to-contrast ratios allow us, by combining Equations (1) and (2), to foreseethe corresponding shot-noise limited short term frequency stability of an atomic clock. Results are shown on Fig. 12as a function of the laser intensity for the different cells. Clock resonance key parameters (∆ν, C, Pout) are extractedfrom experimental data. We note for all cells an improvement of the clock frequency stability with increased laserintensity until a plateau after which the clock stability slightly degrades. The optimum laser intensity Iopt for beststability performances is measured to be 1-2, 10 and 33 µW/mm2 for the cells 1, 2 and 3 respectively. For the longestcell (cell 3), only taking into account photon shot noise, the expected clock short-term frequency stability is close to2 × 10−14 for a laser intensity of 33 µW/mm2. This value is about one order of magnitude better than frequencystability performances of state-of-the-art vapor cell frequency standards [49].
V. DISCUSSION
CPT physics is typically of relevant interest for the development of low power consumption chip-scale atomicclocks [50]. Such miniature clocks are based on microfabricated alkali vapor cells (similar to the cell 1 for example)that need to be filled with a high buffer gas pressure to obtain narrow resonances through the Dicke effect [51]. Inthis study, a poor efficiency gain of the PPOP technique to detect high-contrast CPT resonances was obtained in themicrofabricated cell (cell 1). PPOP was found to be more efficient to obtain high contrasts when the cell dimensionsare increased. This can be mainly related to two parameters. At CPT resonance, according to Eq. (34), the signaldecreases with increased hyperfine relaxation rate γ2, which is one order of magnitude larger in mm-sized cells. Outof CPT resonance, the background signal is governed by the absorption coefficient which varies as the inverse of Γ,the width of the optical transition, which is also larger in small cells due to a higher buffer gas pressure. We canthen expect for small cells, a smaller signal at resonance and a higher background signal out of resonance, whichleads to a comparatively smaller contrast. Nevertheless a full numerical calculation would be needed to explain thisbehavior. In other words, this study suggests that optimized CPT pumping schemes such as PPOP or lin ⊥ lin
can not be used efficiently to improve the performances of chip-scale atomic clocks, but are very promising for moreconventional atomic clocks using cm-sized cells. Similarly to the use of circularly polarized light, we measured withPPOP that high contrasts are achieved by increased laser power at the expense of laser power broadening of the clocktransition. To circumvent this issue, PPOP could be associated with a pulsed Ramsey-type interaction [18, 19, 52, 53].
To summarize, we reported a basic theoretical analysis on push-pull optical pumping in Cs vapor cells. Analogiesbetween the PPOP and the lin ⊥ lin technique were pointed out. Conditions of dark states existence and absorptioncalculations were reported and detailed. We developed an experimental system combining a single diode laser, anexternal Mach-Zehnder electro-optic modulator and a Michelson interferometer to detect high-contrast CPT reso-nances in Cs vapor cells filled with buffer gas. We compared Zeeman spectra detected in a buffer gas-filled Cs vaporcell using standard circular polarization and PPOP to verify that the latter allows to pump an increased number ofatoms in the 0-0 clock transition. We evaluated the impact on the CPT 0-0 resonance of the laser intensity for threedifferent cells, including a microfabricated cell. Contrasts up to 78 % were achieved in a 5 cm-long and 2 cm-diameterCs-N2-Ar cell. We pointed out that the efficiency of the PPOP technique to detect high-contrast CPT resonances isgreatly reduced when the cell dimensions are strongly reduced. We proposed the combination of PPOP with pulsedCPT interaction for the development of high-frequency stability atomic clocks.
Acknowledgments
This work was mainly done in the frame of a scientific program contract with Laboratoire National de Metrologieet d’Essais (LNE-DRST 10-3-005). A part of the study was done thanks to Agence Nationale de la Recherche(ANR ISIMAC project, ANR-11-ASTR-0004) and Delegation Generale de l’Armement (DGA). X. Liu is financiallysupported by Region de Franche-Comte. The authors thank C. Rocher and P. Abbe (FEMTO-ST) for technicalsupport and electronics design and M. Hasegawa for the realization of the microfabricated cell.

11
[1] G. Alzetta, A. Gozzini, L. Moi and G. Orriols, Nuovo Cimento B 36, 5 (1976).[2] E. Arimondo, Prog. Opt., 35, 257 (1996).[3] M. Fleischhauer, A. Imamoglu, and J. P. Marangos, Rev. Mod. Phys. 77, 633 (2005).[4] R. Wynands and A. Nagel, Appl. Phys. B, 20, 1-25 (1999).[5] M. Merimaa, T. Lindvall, I. Tittonnen and E. Ikonen, J. Opt. Soc. Am. B 20 , 273-279 (2003).[6] A. Nagel, L. Graf, A. Naumov, E. Mariott, V. Biancalna, D. Meschede and R. Wynands, Europhys. Lett. 44, 31-36 (1998).[7] P. D. D. Schwindt, S. Knappe, V. Shah, L. Hollberg and J. Kitching, Appl. Phys. Lett. 85, 26, 6409-6411 (2004).[8] A. Aspect, E. Arimondo, R. Kaizer, N. Vansteenkiste and C. Cohen-Tannoudji, J. Opt. Soc. Am. B 6, 2112-2124 (1989).[9] M. Bajcsy, A. S. Zibrov and M. D. Lukin, Nature 426, 638-641 (2003).
[10] J. Vanier, Appl. Phys. B Lasers Opt., 81421-442 (2005).[11] J. Rutman and F. L. Walls, Proc. of the IEEE 79, 953-960 (1991).[12] V. Shah and J. Kitching ”Advances in Coherent Population Trapping for Atomic Clocks,” Advances in Atomic, Molecular
and Optical Physics, Elsevier, 59, Chapter 2 (2010).[13] Y.-Y. Jau, A. B. Post, N. N. Kuzma, A.M. Braun, M.V. Romalis, and W. Happer, Phys. Rev. Lett. 92, (11) 110801
(2004).[14] Y. Y. Jau, E. Miron, A. B. Post, N. N. Kuzma and W. Happer, Phys. Rev. Lett. 93, (16) 160802 (2004).[15] Y. Y. Jau and W. Happer, Phys. Rev. Lett. 99, 223001 (2007).[16] Y. Zhang, S. Qu and S. Gu, Opt. Exp. 20, 6, 6400-6405 (2012).[17] T. Zanon, S. Guerandel, E. de Clercq, D. Holleville, N. Dimarcq and A. Clairon, Phys. Rev. Lett. 94, 193002 (2005).[18] N. Castagna, R. Boudot, S. Guerandel, E. De Clercq, N. Dimarcq and A. Clairon, IEEE Trans. Ultrason. Ferroelec. Freq.
Contr. 56, (2), 246-253 (2009).[19] R. Boudot, S. Guerandel, E. De Clercq, N. Dimarcq and A. Clairon, IEEE Trans. Instr. Meas. 58, (4), 1217-1222 (2009).[20] S. H. Yim, T. H. Youn and D. Cho, Rev. Sci. Instr. 79, 126104 (2008).[21] P. Yun, B. Tan, W. Deng and S. Gu, Rev. Sci. Instr. 82, 123104 (2011).[22] P. Yun, B. Tan, W. Deng, J. Yang and S. Gu, Rev. Sci. Instr. 83, 093111 (2012).[23] A. V. Taichenachev, V. I. Yudin, V. L. Velichanslky, S. V. Kargapoltsev, R. Wynands, J. Kitching and L. Hollberg, JETP
Lett. 80, 477-481 (2004).[24] A. V. Taichenachev, V. I. Yudin, V. L. Velichanslky and S. A. Zibrov, JETP Lett. 82, 398-403 (2005).[25] E. E. Mikhailov, T. Horrom, N. Belcher, and I. Novikova, J. Opt. Soc. Am. B 27, 417-422 (2010).[26] S. A. Zibrov, I. Novikova, D. F. Phillips, R. L. Walsworth, A. S. Zibrov, V. L. Velichansky, A. V. Taichenachev, and V. I.
Yudin, Phys. Rev. A 81, 013833 (2010).[27] K. Watabe, T. Ikegami, A. Takamizawa, S. Yanagimachi, S. Ohshima and S. Knappe, Appl. Opt. 48, (6) 1098-1103 (2009).[28] Er is right-handed circularly polarized from the detector point of view, left-handed circularly polarized from the source
point of view. We note σ− when−→B is oriented along Oz, σ+ for the opposite direction. All senses are inverted for El.
[29] J. Vanier and C. Audoin, ”The quantum physics of atomic frequency standards”, Adam Hilger, Bristol (1989).[30] C. Cohen-Tanoudji, Cours College de France, 1991-1992, http://www.phys.ens.fr/cours/college-de-france/1991-92/cours4/cours4.pdf.[31] M. Stahler, R. Wynands, S. Knappe, J. Kitching, L. Hollberg, A. Taichenachev, and V. Yudin, Opt. Lett., 27, 1472 (2002).[32] S. Knappe, W Kemp, C. Affolderbach, A; Nagel, and R. Wynands, Phys. Rev. A, 61, 12508 (2000).[33] E. A. Korsunsky and D. V. Kosachiov, Phys. Rev. A, 60, 4996, (1999).[34] M. B. Gornyi, B. G. Matisov and Yu. V. Rozhdestvenskii, Sov. Phys. JETP, 68, 728, (1989).[35] X. Liu and R. Boudot, IEEE Trans. Instr. Meas. 61, 10, 2852-2855 (2012).[36] R. Boudot, S. Guerandel, E. De Clercq, N. Dimarcq and A. Clairon, IEEE Trans. Instr. Meas. 58, 3659-3665 (2009).[37] E. Rubiola and V. Giordano, IEEE Ultrason. Ferroelec. Freq. Contr., 54, 1, 15-22 (2007).[38] R. A. Becker and R. C. Williamson, Appl. Phys. Lett. 47, 1024-1026 (1985).[39] G. T. Harvey, Journ. Light. Tech. 6, 872-876 (1998).[40] R. Boudot, C. Rocher, N. Bazin, S. Galliou and V. Giordano, Rev. Sci. Instr., 76, 095110 (2005).[41] F. Liu, C. Wang, L. Li, L. Chen, Opt. Laser Tech., 45, 775 (2012).[42] M. Zhu and L. S. Cutler, Proc. 32th Annual Precise Time and Time Interval (PTTI) Meeting, Reston, VA, USA, pp.
311-323 (2000).[43] V. Shah, V. Gerginov, P. D. D. Schwindt, S. Knappe, L. Hollberg and J. Kitching, Appl. Phys. Lett. 89, 151124 (2006).[44] B. H. McGuyer, Y. Y. Jau and W. Happer, Appl. Phys. Lett. 94, 251110 (2009).[45] D. Miletic, C. Affolderbach, M. Hasegawa, R. Boudot, C. Gorecki and G. Mileti, Appl. Phys. B 109, 89 (2012).[46] M. Hasegawa, R. K. Chutani, C. Gorecki, R. Boudot, P. Dziuban, V. Giordano, S. Clatot, L. Mauri, Sensors Actuat. A:
Phys. 167, 594 (2011).[47] R. Boudot, P. Dziuban, M. Hasegawa, R. K. Chutani, S. Galliou, V. Giordano and C. Gorecki, Journ. Appl. Phys. 109,
014912 (2011).[48] S. Knappe, R. Wynands, J. Kitching, H. G. Robinson and L. Hollberg, Journ. Opt. Soc. Am. B 18, 1545-1553 (2001).[49] S. Micalizio, C. Calosso, A. Godone and F. Levi, Metrologia 49, 425-436 (2012).

12
[50] S. Knappe, MEMS Atomic Clocks, Comprehensive Microsystems, Elsevier B.V 3 , 571-612 (2010).[51] R. H. Dicke, Phys. Rev. 89, 472-473 (1953).[52] T. Zanon, E. De Clercq and E. Arimondo, Phys. Rev. A 84, 062502 (2011).[53] P. Yun, Y. Zhang, G. Liu, W. Dang, L. Yu, S. Gu, EPL 97, 63004 (2012).
13
List of Table Captions
Tab. 1. Characteristics of tested buffer gas filled cells and relevant parameters. For buffer gas mixtures, r isdefined as the ratio PAr/PN2
between Ar and N2 partial pressures. The experimental data are the features of thecell, the buffer gases, the laser beam, the contrast and the CPT linewidth. All other data are calculated values.

14
List of Figure Captions
Fig. 1. (Color online) CPT interaction schemes. Both ground state levels are represented by 3 Zeeman sublevels(1’, 1, 1” and 2’, 2, 2”). The clock transition is the 1 ↔ 2 transition. The excited state is represented by 3 Zeemansublevels (3, 0, 4). The laser fields of amplitude E1 (E2) and of angular frequency ω1 (ω2) are represented by arrowsissued from the (1)((2)) levels, respectively. δ = (ω1−ω2)−ω0 is the Raman detuning, with ω0 the angular frequencyof the clock transition. (a): Λ scheme with circularly polarized beams (σ+), (b): double Λ scheme with push-pull orlin ⊥ lin interaction. Push-pull interaction uses two bi-chromatic laser fields circularly polarized in opposite direction(σ− and σ+), one beam is phase delayed with respect to the other. In lin⊥lin interaction, the two monochromaticbeams are linearly polarized (σ) at right angle. Dotted lines represent two single Λ built by ∆m =2 transitionsinduced by the double Λ scheme.
Fig. 2. (Color online) Experimental setup used to detect high-contrast CPT resonances in Cs vapor cells withpush-pull optical pumping. A Mach-Zehnder electro-optic modulator (MZ EOM) is used to generate optical sidebandswith linear and parallel polarizations, frequency-separated by the clock transition (9.192 GHz). A microwave-basedstabilization technique of the transfer function operating point is implemented to stabilize the optical carrier rejection.The Michelson interferometer is used to obtain at the output of the cube C1 two time-delayed optical componentswith orthogonal linear polarizations. The last quarter wave plate before the cell creates right and left circularpolarizations for push-pull interaction. The photodiode PD detects the transmitted optical power through the vaporcell. MS: microwave synthesizer, PD: photodiode, EOM: electro-optic modulator, FPD: fast photodiode, Cs+BG: Cs+ buffer gas, QWP: quarter-wave plate, HWP: half-wave plate, BPF: bandpass filter, M1 and M2: mirrors, LNA:low-noise amplifier, SA: microwave spectrum analyzer, FP: Fabry-Perot interferometer.
Fig. 3. (Color online) Impact of the EOM bias voltage Vbias on experimental signals. The laser beam diameter is2 cm. The cell 3 is used. (a): Optical sidebands power. (b): Power of the optically carried 4.596 GHz signal at theoutput of the EOM. This signal is detected by the fast photodiode and analyzed with a spectrum analyser. (c): dcsignal at the output of the microwave mixer. (d): CPT signal height.
Fig. 4. (Color online) Power of the 4.596 GHz optically carried signal at the EOM output versus time: servo loopON or OFF.
Fig. 5. (Color online) Transmitted light power through cell 3 and linewidth of the CPT resonance versus theposition of the mirror of one arm of the interferometer. Squares: measured light power, dotted line: light power farfrom CPT resonance (large Raman detuning). The dashed line is a fit of Eq. 36. The solid line is a fit of Eq. (36)with an additional background. White dots: CPT resonance width.
Fig. 6. (Color online) CPT spectra for various static magnetic fields: (a): 45 mG, (b): 1.335 G, (c):2.07 G, (d): 2.531 G. Neighboring single Λ ∆m = 2 transitions close to the central clock transition are noted (1)and (2). For clarity of the figure, the Zeeman frequency shift of the clock transition is compensated for each value of B.
Fig. 7. (Color online) Zeeman spectrum detected in the cell 2. The total laser power is 1.05 mW. The beamdiameter is 1 cm. The static magnetic field is not the same for both curves (without consequence on the CPT signal).(a): Circular polarization (b): Push-pull optical pumping.
Fig. 8. (Color online) CPT resonance detected in the cell 3. The laser power is 3 mW. The beam diameter is 6mm. The contrast is 78 %.
Fig. 9. (Color online) CPT resonance linewidth (a), CPT resonance contrast (b) and linewidth/contrast ratio (c)versus laser intensity for the cell 1. The laser beam diameter is 2 mm.
Fig. 10. (Color online) CPT resonance linewidth (a), CPT resonance contrast (b) and linewidth/contrast ratio (c)versus laser intensity for the cell 2. The laser beam diameter is 6 mm.
Fig. 11. (Color online) CPT resonance linewidth (a), CPT resonance contrast (b) and linewidth/contrast ratio (c)versus laser intensity for the cell 3. The laser beam diameter is 6 mm.
Fig. 12. (Color online) Estimated shot-noise limited clock short-term frequency stability at 1 s for the differentcells with PPOP interaction. The combination of Eq. 1 and Eq. 2 is used for the calculation. The laser beam

15
diameter is 2 mm for the cell 1 and 6 mm for cells 2 and 3. (a): Cell 1, (b): Cell 2, (c): Cell 3.

16
TABLE I: Characteristics of tested buffer gas filled cells and relevant parameters. For buffer gas mixtures, r is defined as theratio PAr/PN2
between Ar and N2 partial pressures. The experimental data are the features of the cell, the buffer gases, thelaser beam, the contrast and the CPT linewidth. All other data are calculated values.
Cell 1 2 3Buffer gas Ne N2-Ar N2-ArBuffer gas total pressure P (Torr) 75 15 15Buffer gas ratio r - 0.4 0.4Cell length L (cm) 0.14 1 5Cell diameter D (cm) 0.2 1 2Cell temperature Tcell (
C) 80 38 32Cs atomic density nCs (at/cm3) 4.0 × 10¹² 1.6 × 10¹¹ 9.0 × 10¹⁰
Cs-wall collisions relaxation rate γw (rad/s) 2470 442 374Cs-Buffer gas relaxation rate γbg (rad/s) 16 19.4 19.2Spin-exchange relaxation rate γse (rad/s) 2040 73 42Ground-state relaxation rate γ2 (rad/s) 4520 534 435CPT linewidth FWHM (kHz) 1.4 0.17 0.14Laser power PL (mW) 0.5 0.5 0.5Laser diameter (cm) 0.2 0.6 0.6Rabi Frequency Ω (rad/s) 2.9 × 10⁷ 9.5 × 10⁶ 9.5 × 10⁶
Excited level relaxation rate Γ⋆ (rad/s) 5.9 × 10⁹ 1.8 × 10⁹ 1.8 × 10⁹
Optical transition width Γ⋆/2π (MHz) 937 292 292Optical transition shift (MHz) -155 -136 -131Number of Cs atoms in the laser beam 1.8 × 10¹⁰ 4.5 × 10¹⁰ 13 × 1010
Experimental contrast (%) 6 10.5 50Experimental CPT linewidth (kHz) 1.32 0.59 0.42

17
FIG. 1: (Color online) CPT interaction schemes. Both ground state levels are represented by 3 Zeeman sublevels (1’, 1, 1” and2’, 2, 2”). The clock transition is the 1 ↔ 2 transition. The excited state is represented by 3 Zeeman sublevels (3, 0, 4). Thelaser fields of amplitude E1 (E2) and of angular frequency ω1 (ω2) are represented by arrows issued from the (1)((2)) levels,respectively. δ = (ω1 − ω2)− ω0 is the Raman detuning, with ω0 the angular frequency of the clock transition. (a): Λ schemewith circularly polarized beams (σ+), (b): double Λ scheme with push-pull or lin ⊥ lin interaction. Push-pull interaction usestwo bi-chromatic laser fields circularly polarized in opposite direction (σ− and σ+), one beam is phase delayed with respect tothe other. In lin⊥lin interaction, the two monochromatic beams are linearly polarized (σ) at right angle. Dotted lines representtwo single Λ built by ∆m =2 transitions induced by the double Λ scheme.
18
FIG. 2: (Color online) Experimental setup used to detect high-contrast CPT resonances in Cs vapor cells with push-pulloptical pumping. A Mach-Zehnder electro-optic modulator (MZ EOM) is used to generate optical sidebands with linear andparallel polarizations, frequency-separated by the clock transition (9.192 GHz). A microwave-based stabilization technique ofthe transfer function operating point is implemented to stabilize the optical carrier rejection. The Michelson interferometer isused to obtain at the output of the cube C1 two time-delayed optical components with orthogonal linear polarizations. Thelast quarter wave plate before the cell creates alternating right and left circular polarizations for push-pull interaction. Thephotodiode PD detects the transmitted optical power through the vapor cell. MS: microwave synthesizer, PD: photodiode,EOM: electro-optic modulator, FPD: fast photodiode, Cs+BG: Cs + buffer gas, QWP: quarter-wave plate, HWP: half-waveplate, BPF: bandpass filter, M1 and M2: mirrors, LNA: low-noise amplifier, SA: microwave spectrum analyzer, FP: Fabry-Perotinterferometer.

19
1 2 3 4 5 6-45
-40
-35
-30
-25
-20
-15
-10
-5
(d)
(c)
(b)
Vbias (V)
4.6
GH
z op
tical
bea
t-not
e po
wer
(dB
m)
(a)
-0.2
-0.1
0.0
0.1
0.2
0.3
0.4
0.5V
oltage (a. u)
FIG. 3: (Color online) Impact of the EOM bias voltage Vbias on experimental signals. The laser beam diameter is 2 cm. Thecell 3 is used. (a): Optical sidebands power. (b): Power of the optically carried 4.596 GHz signal at the output of the EOM.This signal is detected by the fast photodiode and analyzed with a spectrum analyser. (c): dc signal at the output of themicrowave mixer. (d): CPT signal height.

20
0 1000 2000 3000 4000 5000 6000 7000 8000 9000-45
-40
-35
-30
-25
-204.
6 G
Hz
optic
al b
eat-n
ote
pow
er (d
Bm
)
servo OFF
servo ON
t (s)
FIG. 4: (Color online) Power of the 4.596 GHz optically carried signal at the EOM output versus time: servo loop ON or OFF.

21
10 20 300.68
0.70
0.72
0.74
0.76
0.78
0.80
0.82
0.84
1.0
1.5
2.0
2.5
3.0
3.5
CP
T lin
ewid
th (
kHz)
Tran
smitt
ed p
ower
(a.
u)
Mirror position (mm)
0 / 2
FIG. 5: (Color online) Transmitted light power through cell 3 and linewidth of the CPT resonance versus the position of themirror of one arm of the interferometer. Squares: measured light power, dotted line: light power far from CPT resonance (largeRaman detuning). The dashed line is a fit of Eq. 36. The solid line is a fit of Eq. (36) with an additional background. Whitedots: CPT resonance width.

22
-6 -4 -2 0 2 4 61.60
1.65
1.70
1.75
1.80
1.85
1.90
(d)(c)
(b)
(0-0)
(1)
CP
T si
gnal
(a. u
)
Raman detuning (kHz)
(2)
(a)
FIG. 6: (Color online) CPT spectra for various static magnetic fields: (a): 45 mG, (b): 1.335 G, (c): 2.07 G, (d): 2.531 G.Neighboring single Λ ∆m = 2 transitions close to the central clock transition are noted (1) and (2). For clarity of the figure,the Zeeman frequency shift of the clock transition is compensated for each value of B.

23
-600 -400 -200 0 200 400 600-0.5
0.0
0.5
1.0
1.5
2.0
2.5
0-0C
ontra
st (%
)
Raman detuning (kHz)
(a)
-600 -400 -200 0 200 400 600-0.50.00.51.01.52.02.53.03.54.04.55.05.56.0
Con
trast
(%)
Raman detuning (kHz)
0-0
(b)
FIG. 7: (Color online) Zeeman spectrum detected in the cell 2. The total laser power is 1.05 mW. The beam diameter is 1 cm.The static magnetic field is not the same for both curves (without consequence on the CPT signal). (a): Circular polarization(b): Push-pull optical pumping.

24
-15 -10 -5 0 5 10 151.6
1.8
2.0
2.2
2.4
2.6
2.8
3.0
3.2C
PT
sign
al (a
. u)
Raman detuning (kHz)
FIG. 8: (Color online) CPT resonance detected in the cell 3. The laser power is 3 mW. The beam diameter is 6 mm. Thecontrast is 78 %.

25
0 20 40 60 800
5
10
15
20
FWH
M (k
Hz)
Total laser intensity ( W/mm2)
(a)
0 20 40 60 80
2
3
4
5
6
Con
trast
(%)
Total laser intensity ( W/mm2)
(b)
0 20 40 60 800.5
1.0
1.5
2.0
2.5
3.0
FWH
M/C
ontra
st (a
. u)
Total laser intensity ( W/mm2)
(c)
FIG. 9: (Color online) CPT resonance linewidth (a), CPT resonance contrast (b) and linewidth/contrast ratio (c) versus laserintensity for the cell 1. The laser beam diameter is 2 mm.

26
0 5 10 15 20 25 30 350
2
4
6
8
FWH
M (k
Hz)
Total laser intensity ( W/mm2)
(a)
0 5 10 15 20 25 30 35
2
4
6
8
10
12C
ontra
st (%
)
Total laser intensity ( W/mm2)
(b)
0 5 10 15 20 25 30 350.30
0.35
0.40
0.45
0.50
0.55
0.60
0.65
0.70
FWH
M/C
ontra
st (a
. u)
Total laser intensity ( W/mm2)
(c)
FIG. 10: (Color online) CPT resonance linewidth (a), CPT resonance contrast (b) and linewidth/contrast ratio (c) versus laserintensity for the cell 2. The laser beam diameter is 6 mm.

27
0 20 40 60 80 1000
1
2
3
4
5
6
7
FWHM(kHz)
Total laser intensity ( W/mm2)
(a)
0 20 40 60 80 1000
20
40
60
80
Con
trast
(%)
Total laser intensity ( W/mm2)
(b)
0 20 40 60 80 1000.04
0.06
0.08
0.10
0.12
0.14
FWH
M/C
ontra
st (a
. u)
Total laser intensity ( W/mm2)
(c)
FIG. 11: (Color online) CPT resonance linewidth (a), CPT resonance contrast (b) and linewidth/contrast ratio (c) versus laserintensity for the cell 3. The laser beam diameter is 6 mm.

28
0 20 40 60 80 100
10-12
10-13
(c): Cell 3
(b): Cell 2
Clo
ck re
lativ
e fre
quen
cy s
tabi
lity
at 1
s
Total laser intensity ( W/mm2)
(a): Cell 1
10-14
FIG. 12: (Color online) Estimated shot-noise limited clock short-term frequency stability at 1 s for the different cells withPPOP interaction. The combination of Eq. 1 and Eq. 2 is used for the calculation. The laser beam diameter is 2 mm for thecell 1 and 6 mm for cells 2 and 3. (a): Cell 1, (b): Cell 2, (c): Cell 3.