Embed Size (px)
Citation preview

The Pennsylvania State University
The Graduate School
Department of Chemical Engineering
PURIFICATION OF PLASMID DNA USING ULTRAFILTRATION MEMBRANES
A Dissertation in
Chemical Engineering
by
Ying Li
© 2017 Ying Li
Submitted in Partial Fulfillment
of the Requirements
for the Degree of
Doctor of Philosophy
August 2017

ii
The dissertation of Ying Li was reviewed and approved* by the following:
Andrew L. Zydney
Distinguished Professor of Chemical Engineering
Dissertation Advisor
Chair of Committee
Manish Kumar
Associate Professor of Chemical Engineering
Janna Maranas
Professor of Chemical Engineering Graduate Program Coordinator of the Department of Chemical Engineering
William Hancock
Professor of Bioengineering and Biomedical Engineering
*Signatures are on file in the Graduate School

iii
ABSTRACT
Previous studies have demonstrated that plasmid transmission through ultrafiltration
membranes can be controlled by adjusting the filtrate flux thereby controlling the extent of
plasmid elongation. This phenomenon can be used for the separation of different plasmid
isoforms by exploiting the differences in flexibility of the supercoiled, linear, and open-circular
isoforms. However, there are a number of critical challenges that still need to be overcome in
order to apply these novel membrane-based processes for commercial scale manufacture of DNA
for gene therapy applications and for use as DNA-based vaccines. The overall objectives of this
dissertation are to develop novel strategies to enhance the separation resolution during
ultrafiltration of different plasmid isoforms and control membrane fouling during ultrafiltration
of concentrated DNA solutions.
This work first focused on developing the strategy of pre-conditioning, accomplished by
pre-elongating the DNA by passage through a region with large pore size, to minimize fouling
and enhance DNA separations. Data were obtained using both asymmetric hollow fiber
membranes, with flow in either the normal or reverse orientation, and with composite membrane
structures made by placing a larger pore size flat sheet microfiltration membrane in series with
an ultrafiltration membrane. In all cases, flow through the larger pore size region pre-stretched
the plasmid, leading to an increase in plasmid transmission and a significant reduction in fouling.
This pre-conditioning also provided a significant increase in selectivity for separation of the
linear and supercoiled isoforms. The performance of composite membrane system can be
optimized by controlling the pore size and morphology of the microfiltration membranes.

iv
This work also examined the effects of ionic conditions (including solution ionic strength
and ion type) on separation of the different plasmid isoforms. The transmission of the linear and
open-circular isoforms slightly increased with increasing solution ionic strength (NaCl or MgCl2
concentration) due to shielding of intramolecular electrostatic interactions. The effect of ionic
strength was greatest for the supercoiled plasmid due to changes in its plectonemic structure,
providing opportunities for enhanced purification of this therapeutically active isoform.
Polycation spermine was found to induce DNA condensation at a threshold concentration, above
which transmission of the plasmid DNA dropped rapidly with the membranes becoming nearly
completely retentive to the plasmid. DNA condensation was reduced in the presence of high
concentrations of monovalent salts, potentially providing an opportunity to “tune” the
transmission of the DNA isoforms by proper of addition of spermine and NaCl to the solutions.
Solution conditions also have a significant effect on the fouling characteristics of
supercoiled plasmid DNA isoforms with different numbers of base pairs. Sieving coefficient and
filtrate flux data were analyzed using a model based on the partial blockage of the membrane
pores by trapped plasmids. Fouling increased dramatically at low ionic strength, with the flux
decline parameter for the 3.0 kbp plasmid in a 1 mM NaCl solution being an order of magnitude
greater than that in a 10 mM solution. Fouling was also most pronounced for the larger 16.8 kbp
plasmid, consistent with the greater probability of plasmid trapping at the pore entrance.
Ultrafiltration membranes also have the potential to separate supercoiled plasmids based
on differences in their size (i.e., number of base pairs). An up to 30-fold selectivity between 3.0
and 16.8 kbp plasmids was achieved using commercial ultrafiltration membranes. The reduction
in transmission of the supercoiled plasmids with increasing chain length was a direct result of the
morphology of the supercoiled isoform; no significant affect of plasmid size was seen during

v
ultrafiltration of linear versions of the same plasmids. The supercoiled isoforms adopt a branched
structure due to the under-twisting of the DNA, with the number of branches increasing, and the
DNA transmission decreasing, with increasing chain length.
It is anticipated that the results from this study will provide important information needed
for successfully implementing UF processes into commercial systems for the large-scale
manufacture of therapeutic DNA products.

vi
TABLE OF CONCENTS
LIST OF FIGURES ..................................................................................................................... ix
LIST OF TABLES ..................................................................................................................... xiv
ACKNOWLEDGEMENTS ....................................................................................................... xv
Chapter 1 Introduction................................................................................................................. 1
1.1 DNA therapeutics and plasmid DNA .................................................................................... 1
1.2 Downstream processing of plasmid DNA ............................................................................. 8
1.3 Purification of plasmid DNA using membrane processes .................................................. 11
1.4 Challenges in membrane ultrafiltration of plasmid DNA ................................................... 15
1.5 Dissertation outline ............................................................................................................. 16
Chapter 2 Materials and Methods............................................................................................. 19
2.1 Plasmid DNA ...................................................................................................................... 19
2.1.1 Supercoiled plasmids .................................................................................................... 19
2.1.2 Plasmid isoforms .......................................................................................................... 20
2.2 Buffers ................................................................................................................................. 21
2.3 DNA characterization .......................................................................................................... 23
2.3.1 Agarose gel electrophoresis .......................................................................................... 23
2.3.2 PicoGreen Assay........................................................................................................... 24
2.3.3 NanoDrop Spectrophotometry ...................................................................................... 25
2.4 Membranes .......................................................................................................................... 26
2.5 Membrane characterization ................................................................................................. 32
2.5.1 Membrane hydraulic permeability ................................................................................ 32
2.5.2 Scanning electron microscopy (SEM) .......................................................................... 32
2.6 Sieving experiments ............................................................................................................ 33
2.6.1 Normal flow filtration ................................................................................................... 33
2.6.2 Tangential flow filtration .............................................................................................. 34
2.7 Diafiltration ......................................................................................................................... 35
Chapter 3 Use of Pre-conditioning to Control Membrane Fouling and Enhance Membrane
Performance .......................................................................................................................... 37

vii
3.1 Introduction ......................................................................................................................... 37
3.2 Materials and methods ........................................................................................................ 39
3.3. Results and discussion ........................................................................................................ 40
3.3.1 Membrane Orientation .................................................................................................. 40
3.3.2 Effects of plasmid and membrane pore size ................................................................. 47
3.3.3 Isoform separation ...................................................................................................... 49
3.4 Conclusion ........................................................................................................................... 51
Chapter 4 Preconditioning with Multilayer Composite Membranes..................................... 53
4.1 Introduction ......................................................................................................................... 53
4.2 Materials and methods ........................................................................................................ 56
4.3 Results and Discussions ...................................................................................................... 59
4.3.1 Multilayer composite membrane .................................................................................. 59
4.3.2 Effects of upper layer structure .................................................................................... 61
4.3.3 Physical model .............................................................................................................. 69
4.4 Conclusions and recommendations ..................................................................................... 74
Chapter 5 Enhanced Plasmid DNA Purification by Exploiting Ionic Strength Effects ....... 76
5.1 Introduction ......................................................................................................................... 76
5.2 Materials and Methods ........................................................................................................ 78
5.3 Results and Discussion ........................................................................................................ 78
5.3.1 Linear plasmid .............................................................................................................. 78
5.3.2 Open-circular plasmid ................................................................................................. 81
5.3.3 Isoform separation ....................................................................................................... 83
5.3.4 Physical Interpretation ................................................................................................. 89
5.4 Conclusions ........................................................................................................................ 91
Chapter 6 Effects of Multivalent Salts on Plasmid DNA Ultrafiltration ............................... 92
6.1 Introduction ......................................................................................................................... 92
6.2 Materials and methods ........................................................................................................ 95
6.3 Results and Discussions ...................................................................................................... 95
6.3.1 Supercoiled isoform ...................................................................................................... 95
6.3.2 Effects of monovalent salts ........................................................................................... 98
6.3.3 Isoform separation ...................................................................................................... 101

viii
6.4 Conclusions and recommendations ................................................................................... 104
Chapter 7 Effect of Ionic Strength on Membrane Fouling During Ultrafiltration of Plasmid
DNA ...................................................................................................................................... 107
7.1 Introduction ....................................................................................................................... 107
7.2 Materials and methods ...................................................................................................... 109
7.3 Results and discussions ..................................................................................................... 110
7.3.1 Fouling experiments ................................................................................................... 110
7.3.2 Fouling model ............................................................................................................. 114
7.3.3 Effects of plasmid size ................................................................................................ 117
7.3.4 Effects of membrane pore size ................................................................................... 121
7.4 Conclusions ....................................................................................................................... 125
Chapter 8 Size-based Separation of Supercoiled Plasmid DNA using Ultrafiltration ....... 127
8.1 Introduction ....................................................................................................................... 127
8.2 Materials and methods ...................................................................................................... 130
8.3 Results and discussion ....................................................................................................... 130
8.3.1 Supercoiled plasmids ................................................................................................. 130
8.3.2 Linear plasmids........................................................................................................... 137
8.3.3 Physical interpretation ................................................................................................ 138
8.4 Conclusions ....................................................................................................................... 142
Chapter 9 Conclusions and Recommendations for Future Work ........................................ 144
9.1 Conclusions ....................................................................................................................... 144
9.2 Future recommendations ................................................................................................... 149
Bibiography ............................................................................................................................... 153

ix
LIST OF FIGURES
Figure 1.1: Electron microscopy image of different plasmid DNA isoforms (adopted from
https://commons.wikimedia.org/wiki/File%3APlasmid_emEN.jpg) ............................................. 4
Figure 1.2: Structure of supercoiled plasmid DNAs (reproduced from17) ........................................... 7
Figure 1.3: A) The impurity content in bacteria cell lysate, B) final product purity requirement
specified by guidelines from FDA .................................................................................................. 9
Figure 1.4: Typical industrial scale pDNA purification process ....................................................... 10
Figure 2.1: Molecular structure and physical properties of Tris-HCl and EDTA ............................. 23
Figure 2.2: AGE image for plasmid with different sizes (left panel) and isoforms (right panel) ...... 24
Figure 2.3: SEM of the cross section of A) UltracelTM composite regenerated cellulose and B)
BiomaxTM polyethersulfone membranes (both from MilliporeSigma) and C) modified
polyethersulfone hollow fiber membrane (from Spectrum Labs). Images taken from
manufacturers’ websites................................................................................................................ 28
Figure 2.4: Molecular structure of polysulfone, polyethersulfone, and regenerated cellulose .......... 29
Figure 2.5: Schematic of stirred cell set-up used for ultrafiltration (adopted from Latulippe, 2010)
....................................................................................................................................................... 34
Figure 2.6: Schematic of hollow fiber setup for tangential flow filtration ........................................ 35
Figure 3.1: Use of microfluidic devices to pre-condition DNA.A) Stretching by shear flow
(reproduced from Perkins et al., 2007)73; B) Pre-stretching using obstacle arrays (reproduced
from Chan et al., 2004)74; C) Pre-stretching by conical-shaped microchannel (adopted from
Larson et al., 2006)70 ..................................................................................................................... 38
Figure 3.2: Observed sieving coefficient of the supercoiled 16.8 kbp supercoiled plasmid through
a 500 kDa and 50 kDa hollow fiber membrane in normal orientation. Data were obtained at
a feed flow rate of 100 mL/min using a plasmid concentration of 0.25 µg/mL ........................... 41
Figure 3.3: Observed sieving coefficients (upper panel) and filtrate flux (lower panel) during
constant pressure ultrafiltration of a 3 µg/mL solution of the supercoiled 16.8 kbp plasmid
through a 500 kDa hollow fiber membrane in both the lumen-to-shell (forward) and shell-to-
lumen (reverse) orientations ......................................................................................................... 43
Figure 3.4: Observed sieving coefficient of the supercoiled 16.8 kbp supercoiled plasmid through
a 500 kDa hollow fiber membrane in the reverse and forward orientations. Data were obtained
at a feed flow rate of 100 mL/min using a plasmid concentration of 0.25 µg/mL ....................... 45

x
Figure 3.5: Schematic diagram of plasmid transmission through an asymmetric membrane in the
(A) forward and (B) reverse orientations. ..................................................................................... 47
Figure 3.6: Observed sieving coefficients of the supercoiled 3.0 kbp (p-EMP) and 16.8 kbp (p-
FDY) plasmids through the 500 kDa and 50 kDa PS hollow fiber membranes in the reverse
orientation. .................................................................................................................................... 49
Figure 3.7: Observed sieving coefficients for the linear and supercoiled isoforms of the 3.0 kbp
plasmid through the 50 kDa hollow fiber membrane in the reverse (left panel) and forward
(right panel) orientations ............................................................................................................... 50
Figure 3.8: Agarose gel electrophoresis image of the feed and filtrate samples during
ultrafiltration of a binary mixture of the linear and supercoiled isoforms of the 3.0 kbp plasmid.
Lane 1 - linear 1 kbp DNA ladder; Lane 2 - feed sample; Lane 3 - filtrate sample at Jv = 10
μm/s; Lane 4 - filtrate sample at Jv = 20 μm/s............................................................................... 51
Figure 4.1: Comparison of A) isotropic B) anisotropic and C) composite membrane structure in
sterile filters (reproduced from 79) ................................................................................................ 54
Figure 4.2: Scanning electron microscopy images of the upper surface of the Durapore, Mixed
Cellulose Ester (compiled from https://www.emdmillipore.com/US/en/product/MF-
Millipore), and Nuclepore membranes ......................................................................................... 57
Figure 4.3: Schematic of etching apparatus for preparation of polycarbonate membranes with
conical shape pores ....................................................................................................................... 59
Figure 4.4: Effects of pre-conditioning with different pore size Durapore microfiltration
membranes (upper layers) on transmission of the supercoiled 3.0 kbp plasmid through the
composite membranes. Experiments were performed in TE buffer containing 100 mM NaCl,
with an UltracelTM 100 kDa membrane as the bottom layer ......................................................... 62
Figure 4.5: Sieving coefficient for the supercoiled 3.0 kbp plasmid through composite
membranes as a function of the pore size of the upper layer Durapore microfiltration
membranes at filtrate flux of 40, 60 and 80 µm/s ......................................................................... 63
Figure 4.6: Effects of pre-conditioning with different pore sizes of mixed cellulose ester (MF)
microfiltration membranes on the transmission of the supercoiled 3.0 kbp plasmid through the
composite membranes. .................................................................................................................. 64
Figure 4.7: Effects of pre-conditioning with different pore size Nuclepore microfiltration
membranes on transmission of the supercoiled 3.0 kbp plasmid through the composite
membranes .................................................................................................................................... 65
Figure 4.8: Effects of pre-conditioning with different pore size upper (Durapore) membranes on
transmission of the supercoiled 9.8 kbp plasmid through the composite membranes .................. 68

xi
Figure 4.9: Selectivity of supercoiled 3.0 kbp plasmid over open-circular plasmid through
different composite membranes. Experiments were performed in TE buffer containing 100
mM NaCl, with UltracelTM 100 kDa membrane as bottom layer ................................................. 69
Figure 4.10: Physical model for DNA transport through different pore morphologies A) conical
shape B) gradual transition funnel shape and C) sudden onset funnel shape ............................... 70
Figure 4.11: SEM images of 0.015 µm Nuclepore membranes etched for A) 20 B) 30 and C)
40min. Images show membrane surfaces in the etching solution ............................................... 701
Figure 5.1: Effect of NaCl concentration on the observed sieving coefficients for ultrafiltration
of the linear 3.0 kbp plasmid through the UltracelTM 100 kDa membrane ................................... 79
Figure 5.2: Effect of ion valence and concentration on the observed sieving coefficient for
ultrafiltration of the linear 3.0 kbp plasmid through the UltracelTM 100 kDa membrane ............ 81
Figure 5.3: Transmission of the open circular isoform of the 3.0 kbp plasmid through the
UltracelTM 100 kDa membrane in the presence of 10, 150, or 300 mM NaCl ............................. 82
Figure 5.4: Effect of solution ionic strength on transmission of the open circular 3.0 kbp plasmid
through the UltracelTM 100 kDa membrane at a filtrate flux of 140 ± 5 μm/s. ............................. 83
Figure 5.5: Effect of solution ionic strength on transmission of the linear, open-circular, and
supercoiled 3.0 kbp plasmid through the UltracelTM 100 kDa membrane at a filtrate flux of
140 µm/s ....................................................................................................................................... 84
Figure 5.6: Selectivity between the linear and supercoiled isoforms (top panel) and between the
supercoiled and open-circular isoforms (bottom panel) of the 3.0 kbp plasmid using the
Ultracel™100 kDa membrane ...................................................................................................... 86
Figure 5.7: Agarose gel electrophoresis showing the separation of a binary mixture of the linear
and supercoiled isoforms in TE buffer containing 10 mM NaCl. Lane 1: linear 1 kbp DNA
ladder. Lane 3: feed sample. Lanes 2 and 4: filtrate samples collected using the Ultracel 100
kDa membrane at a filtrate flux of 80 μm/s .................................................................................. 88
Figure 5.8: Agarose gel electrophoresis showing the separation of a binary mixture of the open-
circular and supercoiled isoforms in TE buffer containing 150 mM NaCl. Lane 4: linear 1 kbp
DNA ladder. Lane 1: feed sample. Lanes 2: filtrate samples collected at filtrate flux of 100
μm/s. Lanes 3: filtrate samples collected at filtrate flux of 125 μm/s. .......................................... 89
Figure 6.1: Chemical structure of spermidine and spermine. The basic amino (NH2) groups bind
protons at physiological pH to become positively charged .......................................................... 93
Figure 6.2: Observed sieving coefficients for the supercoiled 9.8 kbp plasmid through a 300 kDa
Biomax membrane as a function of filtrate flux for experiments performed with 0, 2, 10, 15,
and 30 µM spermine in TE buffer containing 10 mM NaCl. ....................................................... 97
xii
Figure 6.3: Effect of spermine concentration on the observed sieving coefficients for the
supercoiled 9.8 kbp plasmid through 300 kDa Biomax membranes at a filtrate flux of 50 µm/s.
Data obtained in TE buffer containing 10 mM NaCl. .................................................................. 98
Figure 6.4: Observed sieving coefficients for the supercoiled 9.8 kbp plasmid through a 300 kDa
Biomax membrane as a function of the filtrate flux for experiments performed with various
concentrations of spermine added to TE buffer containing 100 mM (upper panel) a and 1 mM
(lower panel) NaCl ...................................................................................................................... 100
Figure 6.5: Observed sieving coefficients for the supercoiled 9.8 kbp plasmid through a 300 kDa
Biomax membrane as a function of the filtrate flux for experiments performed with 10 µM
spermine added to TE buffer containing 1, 10 and 100 mM NaCl. ............................................ 101
Figure 6.6: Observed sieving coefficients for the linear 9.8 kbp plasmid through a 300 kDa
Biomax membrane as a function of the filtrate flux for experiments performed with 0, 2, 6,
10, 15 µM spermine added to TE buffer containing 10 mM NaCl. ............................................ 103
Figure 6.7: Observed sieving coefficients for the open-circular 9.8 kbp plasmid through a 300
kDa Biomax membrane as a function of the filtrate flux for experiments performed with
various concentrations of spermine added to TE buffer. Left - solutions contained 10 mM
NaCl, Right - solutions contained 100 mM NaCl ....................................................................... 104
Figure 6.8: Selectivity for separation of the supercoiled and open-circular 9.8 kbp plasmids
through a 300 kDa Biomax membrane as a function of spermine concentration for experiments
performed at filtrate flux of 50 µm/s in TE buffer containing 10 and 100 mM NaCl. ............... 104
Figure 7.1: Effect of solution ionic conditions on the sieving coefficients (top panel) and filtrate
flux (bottom panel) during ultrafiltration of solutions of the 16.8 kbp supercoiled plasmid
through 300 kDa Biomax membranes. Data were obtained at plasmid concentrations of 3×10-
3 kg/m3 using TE buffer with 1, 10 or 500 mM NaCl. Dashed curves are model calculations
using parameter values given in Table 7.1.................................................................................. 111
Figure 7.2: Ultrafiltration of a 3×10⁻³ kg/m3 solution of the 16.8 kbp linear plasmid through a 300
kDa Biomax membrane in 1 mM NaCl TE buffer. .................................................................... 114
Figure 7.3: Effect of solution ionic strength on the sieving coefficient (top) and filtrate flux
(bottom) of different size supercoiled plasmids through 300 kDa Biomax membranes. Data
were obtained with 3×10⁻³ kg/m3 solutions of the 16.8, 9.8 and 3.0 kbp plasmid wi ith 3×10⁻³
kg/m3 solutions of the 16.8, 9.8 and 3.0 kbp plasmid with 1 and 10 mM NaCl in TE buffer.
Dashed curves are model calculations using parameter values specified in Table 7.1.
118
Figure 7.4: Fouling rate constant k plotted versus radius of gyration of plasmid DNA. Data
include 3.0 and 9.8 kbp supercoiled plasmids in TE buffer containing 1 and 10 mM NaCl, and
16.8 kbp supercoiled plasmids in TE buffer containing 1, 10, and 500 mM NaCl. Fouling
xiii
experiments were performed with Biomax 300 kDa membranes. Error bars are within the size
of the symbols ............................................................................................................................. 120
Figure 7.5: Effect of solution ionic strength on the sieving coefficient (top) and filtrate flux
(bottom) of the supercoiled plasmid through membranes with different MWCO. Data obtained
with 5x10⁻³ kg/m3 solutions of the 16.8 kbp plasmid with 1 and 10 mM NaCl in TE buffer
using Biomax 300 and 1000 kDa membranes. Dashed curves are model calculations using
parameter values in Table 7.1 ..................................................................................................... 123
Figure 8.1: Observed sieving coefficients of the 3.0, 9.8, and 16.8 kbp supercoiled plasmids
through the 100 kDa Biomax membrane in TE buffer with 300 mM NaCl. .............................. 131
Figure 8.2: Selectivity between the 3.0 and 16.8 kbp supercoiled plasmids as a function of filtrate
flux. Ultrafiltration experiments were performed using 100 kDa Biomax membranes in TE
buffer containing 300 mM NaCl. ................................................................................................ 133
Figure 8.3: Selectivity between the 3.0 and 16.8 kbp supercoiled plasmids as a function of
membrane MWCO. Only the optimal Ψ values were plotted. Ultrafiltration experiments were
conducted in TE buffer containing 300 mM NaCl. The optimal Ψ values were obtained at
filtrate flux of 110, 70, and 5.2 µm/s for the 50, 100, and 300 kDa membranes, respectively .. 134
Figure 8.4: Observed sieving coefficients of the 3.0, 9.8, and 16.8 kbp supercoiled plasmids
through the 100 kDa Ultracel membrane in TE buffer with 500 mM NaCl. .............................. 135
Figure 8.5: Agarose gel electrophoresis (AGE) showing the separation of a binary mixture of the
3.0 and 16.8 kbp supercoiled plasmids using an UltracelTM 100 kDa membrane in TE buffer
containing 500 mM NaCl. Lane 1: linear 1 kbp DNA ladder. Lane 2: filtrate sample collected
at a filtrate flux of 70 µm/s. Lane 3: feed sample. Lane 4: purified 3.0 kbp supercoiled plasmid.
Lane 5: purified 16.8 kbp supercoiled plasmid ........................................................................... 137
Figure 8.6: Observed sieving coefficients of the 3.0, 9.8, and 16.8 kbp linear plasmids through
(a) the Ultracel 100 kDa membrane in TE buffer with 150 mM NaCl and (b) the Biomax 100
kDa membrane in TE buffer with 10 mM NaCl. ........................................................................ 138

xiv
LIST OF TABLES
Table 2.1: Specification of plasmid DNA stock solution............................................................. 20
Table 2.2: Digestion conditions for plasmid DNA ...................................................................... 21
Table 2.3: Detection limit and reproducibility of NanoDrop Spectrophotometry ....................... 26
Table 2.4: Average hydraulic permeability and estimated mean pore radius of various UF
membranes used in this study ....................................................................................................... 31
Table 4.1: Specifications of microfiltration membranes used in this study ................................. 57
Table 4.2: Comparison of observed sieving coefficients of a 3.0 kbp supercoiled plasmid
through an Ultracel 100 kDa membrane with the skin-side up, the skin-side down, and in a
composite structure with a 0.22 µm Durapore membrane ............................................................ 60
Table 4.3: Dimensions of membranes with conical shape pores created by anisotropic chemical
etching of 0.015 µm Nuclepore membranes ................................................................................. 71
Table 7.1: Best fit values of β and k for plasmid ultrafiltration experiments shown in Figs. 7.1–
7.5................................................................................................................................................ 117
xv
ACKNOWLEDGEMENTS
First and foremost, I would like to thank my advisor, Dr. Andrew L. Zydney. I am deeply
grateful for the guidance, encouragement and the time he spent training me as a scientist. His
enthusiasm, insights and dedication to science have made these five years a very rewarding
experience. I cherish the freedom in research he has allowed me, and appreciate all the support
and opportunities he has provided me with during the pursuit of my Ph.D. I would also like to
express my sincere gratitude to the members of my Dissertation committee, Dr. Manish Kumar,
Dr. Janna Maranas and Dr. William Hancock, for their valuable advice and feedback.
My grateful thanks also to the former and current members of the Zydney research group:
Ehsan Espah Borujeni, Achyuta Teella, Elaheh Binabaji, Mahsa Hadidi, Shudipto Dishari,
Youngbin Baek, Ivan Manzano, Zhao Li, Parinaz Emami, Fatemeh Fallahianbijan and Hadi
Nazem-Bokaee, with whom I shared this wonderful experience. Special thanks to Ehsan and
Achyuta for teaching me basic lab skills and Dr. David Latulippe, from whose Ph.D work I
gained a lot of inspiration.
I want to extend my gratitude to a group of talented and diligent undergraduates who
have worked with me for the past five years, including David Currie, Rachel Bolten, Neil Butler,
Kuangzheng Zhu, Weiru Luo and Anirudh Nambiar. I feel happy to have had the chance to
mentor them and I am thankful for their contribution and company in the lab.
I am indebted to the Walter L. Robb Family Chair, the National Science Foundation, and
the Air Products & Chemicals Graduate Fellowship program for providing funding for my Ph.D
study. I wish to thank Dr. Henry C. Foley and Maryam Peer for guiding me to start independent
scientific research; Air Products & Chemicals and the ACS Green Chemistry Institute for giving

xvi
me the opportunities to conduct research projects that are closely related to industrial processes.
Although these works are not included in this thesis, the experiences were certainly influential
for my growth.
I owe sincere appreciation to all of my friends for being part of my life over the past
several years. Special thanks goes to Pengfei Zhan, Xin Lu and Zifeng Li for always being there
to share my happiness and sadness. I would like to specially thank Xiao-Guang Yang, whose
love and support have been an essential part of this journey. I feel lucky to have met you.
Most importantly, I would like to thank my parents for their infinite and unconditional
love. Thanks for providing me with such a warm, supportive and open-minded family. Thanks
for always encouraging me to be positive, reflective and persistent. You have shaped who I am
today.
I hope I am now strong enough to embrace the many possibilities in my future life
journey.

1
Chapter 1
Introduction
1.1 DNA therapeutics and plasmid DNA
The past few decades have witnessed the advent and rapid development of DNA
therapeutics, including gene therapy and DNA vaccines. The concept of gene therapy was first
introduced in the 1960s, with the idea of inserting corrective genetic material to replace defective
genes that are responsible for human disease 1. Instead of tackling only the symptoms, as is the
case with most conventional drugs, DNA-based drugs are designed to directly treat or eliminate
the root cause of the disease. Because of their selective production of a given protein or enzyme,
gene therapy has the potential for enhanced therapeutic effects, lower toxicity and side effects, as
well as prolonged duration of action. Moreover, gene therapy has the potential to bring the
ultimate solution for diseases that are presently untreatable or poorly managed 2.
DNA vaccination first sparked the interests of the scientific community in the early 1990s
when it was discovered that plasmid DNA could induce an immune response to the plasmid-
encoded antigen (Wolff et al., 1990). In contrast to recombinant protein-based vaccines, DNA
vaccines can effectively engage both the cellular and humoral arms of the immune response and
therefore induce more prolonged immunity. At the same time, DNA vaccines can circumvent
many problems and risks associated with recombinant virus vaccines, such as pre-existing
immunity, loss of attenuation, or spread of inadvertent infection3.
A number of studies have demonstrated the potential of DNA therapeutics for treatment
of inherited diseases such as cystic fibrosis and hemophilia, various types of cancer, neurological
diseases such as Alzheimer’s and Parkinson’s, cardiovascular disorders and infectious diseases

2
such as AIDS 4. As of 2016, there were over 2400 DNA therapeutics being studied in clinical
trials worldwide, with over three-quarters in Phase I or I/II (Gene Therapy Clinical Trials
Worldwide). Glybera, the first gene therapy drug, was approved by the European Medicine
Agency and launched in Germany in 2015. It treats lipoprotein lipase deficiency (LPLD), a rare
genetic disorder affecting about 1-2 persons per million people that causes fat to build-up in the
blood leading to cardiovascular disease, diabetes, and life-threatening recurrent bouts of
pancreatitis. Glybera contains engineered adeno-associated viral vectors harboring correct copies
of the lipoprotein lipase gene to restore the LPL enzyme activity, offering a long-term cure for
six years or more 5.
In 2016, the second gene therapy product, Strimvelis, was granted authorization in
Europe. Strimvelis treats an extremely rare, life threatening genetic disorder named adenosine
deaminase severe combined immunodeficiency syndrome (ADA-SCID). Children born with this
single genetic defect are extremely susceptible to everyday infections and must live in plastic,
germ-free chambers. Strimvelis works by infusion of hematopoietic stem cells extracted from the
patient and transduced with gammaretrovirus containing the human adenosine deaminase gene 6.
Although the U.S. Food and Drug Administration (FDA) has not yet approved any human gene
therapy products, it is expected that several DNA therapeutics are on track for approval in the
U.S. in the near future. For example, SPK-RPE 65, a gene therapy agent developed by Sparks
Therapeutics for treating inherited retinal dystrophies, has completed a Phase III clinical trial and
is likely to hit the market by the end of 2017. In addition, the full elucidation of the human
genome and the advancement of CRISPR/Cas9 gene editing technology should provide exciting
new advances in the development of DNA therapeutics.

3
Successful application of gene therapy and DNA based vaccines depends on the
development of a vector that can safely and effectively deliver the gene of interest to the target
cells followed by sustainable expression of the gene product in vivo. There are two main
categories of delivery vehicles, viral and non-viral. Various types of viruses have been developed
as vectors, taking advantage of the natural ability of viruses to deliver genetic materials to cells.
Among the most advanced viral vectors are retrovirus, adenovirus, and adeno-associated virus
(AAV). Viruses generally have high transfection efficiency in a wide variety of cells with
prolonged expression of the desired gene product. The major disadvantages of virus vectors
include insert-size limitations, immunogenicity, and manufacturing challenges7-8. According to
statistics from the Gene Therapy Clinical Trials Worldwide in 2016, 60.3% of clinical trials of
DNA therapeutics are conducted using various virus vectors (percentages of Adenovirus,
Retrovirus and AAV are 21%, 18% and 7%, respectively).
In comparison, non-viral vectors have less efficient transfection and often provide only
transient expression in vivo. However, non-virial delivery systems continue to be a promising
alternative to viral vectors due to safety concerns regarding the use of viruses in humans. Non-
viral delivery is particularly attractive in terms of the lack of immune response, wide range of
insert-gene size, and convenience in large-scale production 9. Non-viral vectors can be delivered
in the form of naked/plasmid DNA or DNA complexed with cationic lipids or polymers 10. There
has been significant interest in using naked plasmid DNA (pDNA) for direct gene transfer due to
its simplicity. Enhanced transfection efficiency of naked pDNA can be obtained using
electroporation and the “gene gun”. These physical approaches allow DNA to directly penetrate
the cell membrane, avoiding enzymatic degradation of DNA molecules by bypassing the
endosome/lysosome 11-12.

4
Plasmid DNA is a double-stranded, circular, extrachromosomal DNA molecule found in
bacteria. Plasmids are able to replicate independently and can be artificially constructed as
recombinant DNA for protein production, as vectors in genetic engineering for cloning, and as
DNA therapeutics. The size of naturally occurring plasmids can vary from very small mini-
plasmids of less than 1 kilobase pairs (1 kbp) to very large megaplasmids that are several
megabase pairs (Mbp) in size 13. The typical plasmid size for DNA therapeutics is 3 to 20 kbp.
Plasmid DNA can exist in three different topological conformations (isoforms) as shown
in Figure 1.1:
Supercoiled (covalently closed-circular) DNA is the natural, intact
conformation that results from the coiling of the axis of the DNA double helix.
Nicked open-circular DNA has one strand cut
Linear DNA has free ends and is formed by a breakage in both strands
Figure 1.1: Electron microscopy image of different plasmid DNA isoforms (adopted from
https://commons.wikimedia.org/wiki/File%3APlasmid_emEN.jpg)

5
DNA supercoiling is numerically described by the linking number (Lk), which is the
number of times the two strands of the DNA double helix are intertwined. The linking number
equals the sum of Tw, the number of ‘twists’ or turns of the double helix, and Wr, the number of
coils or ‘writhes’ (Equation 1.1).
𝐿𝑘 = 𝑇𝑤 + 𝑊𝑟 (1.1)
Lk is a constant and can only be changed by breaking the DNA backbone. However, there can
by complementary changes in Tw and Wr at a fixed Lk.. For biological circular DNA, Wr is
typically negative (Lk < Tw) and the DNA is described as being “underwound”. The linking
number difference, ∆Lk, is the difference between the actual number of turns in a plasmid, Lk,
and the number of turns in a relaxed plasmid Lk0 of the same size:
∆𝐿𝑘 = 𝐿𝑘 − 𝐿𝑘0 (1.2)
where Lk0 is determined by dividing the total base pairs of the molecule by the number of bp per
turn as:
𝐿𝑘0 = 𝑏𝑝/10.4 (1.3)
To facilitate comparison between plasmids with different size, specific linking deficits or
superhelical density is usually expressed in terms of the parameter σ, which represents the level
of supercoiling of the molecule independent of its size:
𝜎 = ∆𝐿𝑘/𝐿𝑘0 (1.4)
Linking deficits typically range from -0.05 to -0.07 for natural supercoiled plasmid DNA isolated
from bacteria, and it is dependent on a number of conditions such as solution ionic strength and
temperature.

6
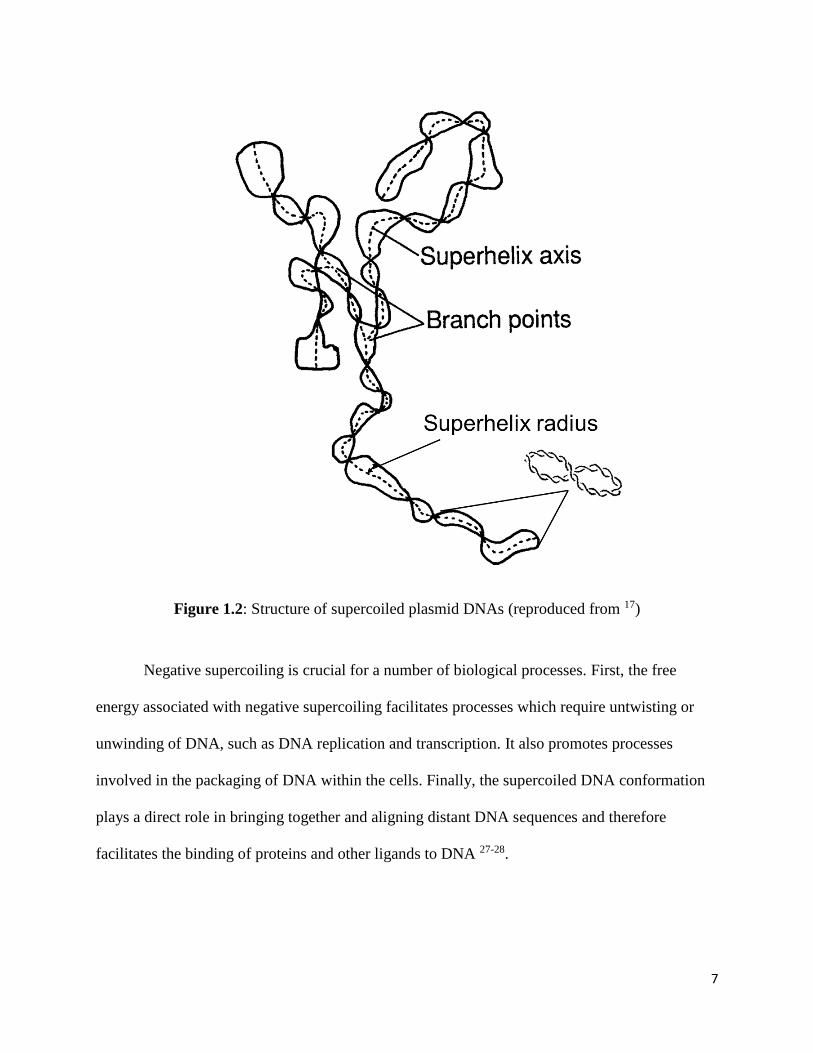
Figure 1.2 illustrates the supercoiling structure of DNA. The supercoiled DNA adopts
interwound or plectonemic conformations as determined by electron microscopy 14-18, atomic
force microscopy 19-20, Monte Carlo simulations 21-23, neutron scattering 24, and analysis from
sedimentation 25 and the products of topoisomerases 26. The supercoiled shape of the DNA
minimizes the unfavorable free energy associated with decreasing Lk from the preferred value of
the relaxed state by changing Wr and Tw. The Waston-Crick twist is referred to as ‘secondary’
winding, with the formation of superhelices referred to as ‘tertiary’ winding. The point at which
two DNA helices cross in projection are called nodes; the superhelix axis is defined as the curve
that passes through the nodes and bisects the area enclosed by the DNA between adjacent nodes.
Electron microscopy studies indicated that the average superhelix winding angle is about 60° and
does not depend on σ 16-17. Most supercoiled DNA displays a branched structure, with the
branching point defined as the intersection of the superhelixes of three or more plectonemic
segments. For example, the molecule shown in Figure 1.2 has 2 branching point, 5 plectonemic
segments and 25 nodes.
7
Figure 1.2: Structure of supercoiled plasmid DNAs (reproduced from 17)
Negative supercoiling is crucial for a number of biological processes. First, the free
energy associated with negative supercoiling facilitates processes which require untwisting or
unwinding of DNA, such as DNA replication and transcription. It also promotes processes
involved in the packaging of DNA within the cells. Finally, the supercoiled DNA conformation
plays a direct role in bringing together and aligning distant DNA sequences and therefore
facilitates the binding of proteins and other ligands to DNA 27-28.

8
1.2 Downstream processing of plasmid DNA
Relatively large amounts of DNA are required for administration (up to several
milligrams per dose in humans) in order to generate a strong therapeutic effect for gene therapy
or a strong immune response for a DNA vaccine. The large dose needed for DNA therapeutics
requires development of large scale processes able to fill the ultimate market demand (on the
order of many kilograms per year for many vaccines). Plasmids are usually produced in a
recombinant Escherichia coli (E. coli) host by fermentation and represent around 3% by mass of
the cell lysate 29. Similar to the case of protein therapeutics, process development for
manufacturing plasmid DNA (pDNA) generally begins with the construction and selection of
appropriate expression vectors and strain selection, followed by optimization of the fermentation
conditions (upstream processing), cell growth, and finally a series of purification steps
(downstream processing). The different stages of pDNA production are integrated and require
concomitant optimization. The downstream purification is significantly affected by the
contaminants generated during the fermentation. For example, the judicious selection of plasmid
vector and host strain, combined with growth-condition optimization, can increase plasmid yield
from 5-40 mg/L to as high as 220 mg/L with a 40% reduction in the RNA content during cell
lysis 30-31.
In general, the purification of biological products is difficult since most products are
labile and therefore require relatively mild operating conditions. In particular, the structure and
physical properties of pDNA (including its size, shape and conformation, and rheological
properties), as well as the diversity of biomolecules present in pDNA containing extracts, impose
additional challenges for establishing efficient purification schemes 32. Figure 1.3 shows the
impurity content in bacterial cell lysates and the final product purity requirement currently
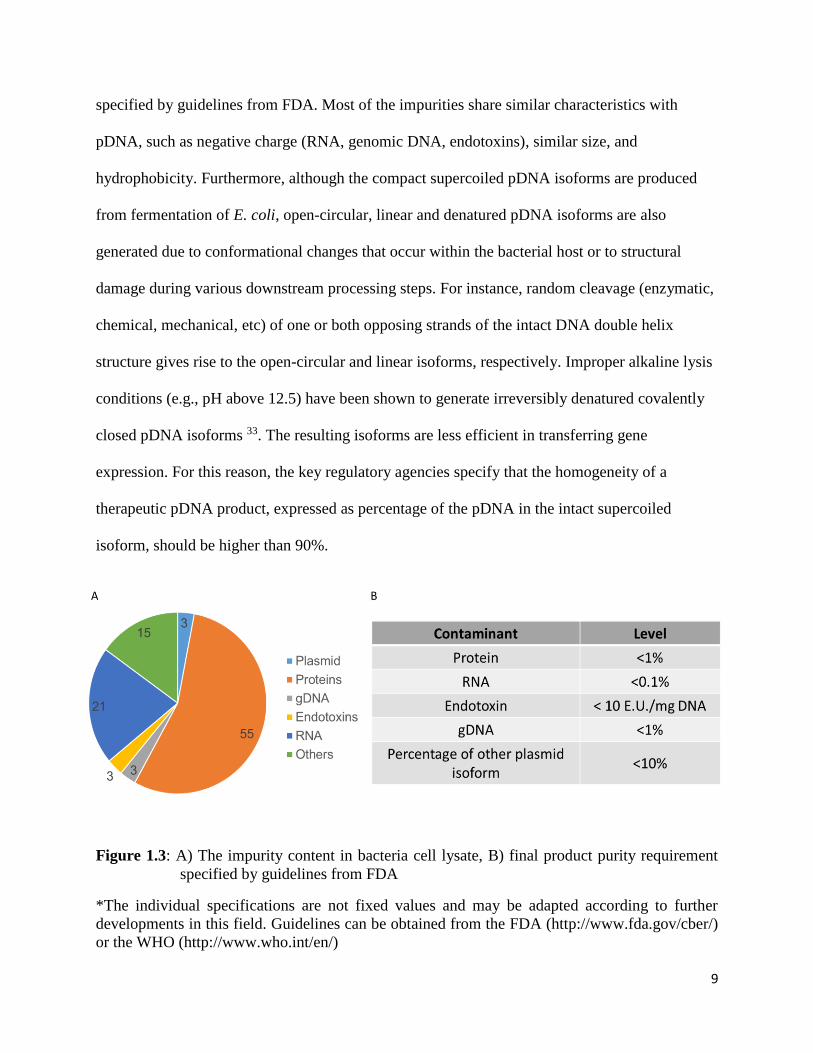
9
specified by guidelines from FDA. Most of the impurities share similar characteristics with
pDNA, such as negative charge (RNA, genomic DNA, endotoxins), similar size, and
hydrophobicity. Furthermore, although the compact supercoiled pDNA isoforms are produced
from fermentation of E. coli, open-circular, linear and denatured pDNA isoforms are also
generated due to conformational changes that occur within the bacterial host or to structural
damage during various downstream processing steps. For instance, random cleavage (enzymatic,
chemical, mechanical, etc) of one or both opposing strands of the intact DNA double helix
structure gives rise to the open-circular and linear isoforms, respectively. Improper alkaline lysis
conditions (e.g., pH above 12.5) have been shown to generate irreversibly denatured covalently
closed pDNA isoforms 33. The resulting isoforms are less efficient in transferring gene
expression. For this reason, the key regulatory agencies specify that the homogeneity of a
therapeutic pDNA product, expressed as percentage of the pDNA in the intact supercoiled
isoform, should be higher than 90%.
Figure 1.3: A) The impurity content in bacteria cell lysate, B) final product purity requirement
specified by guidelines from FDA
*The individual specifications are not fixed values and may be adapted according to further
developments in this field. Guidelines can be obtained from the FDA (http://www.fda.gov/cber/)
or the WHO (http://www.who.int/en/)

10
The purification processes after fermentation are comprised of several unit operations
including cell harvest, cell lysis, cell debris/solid removal, polishing/clarification, buffer
exchange, concentration, and formulation. A typical pDNA purification process is summarized
in Figure 1.4. Chromatography is currently a key step for large scale pDNA purification, and it
has been widely used for removal of key process impurities, including the undesired plasmid
isoforms, genomic DNA, host cell proteins, RNA, and endotoxins. Chromatography is also used
for assessing the purity of clinical grade pDNA for quality and safety purposes. Chromatographic
techniques typically used include reverse-phase HPLC (RP), hydrophobic interaction
chromatography (HIC), anion-exchange chromatography (AEC), size exclusion chromatography
(SEC), and affinity chromatography (AC) (e.g., immobilized metal affinity, triple-helix affinity
and amino acid-DNA affinity chromatography) 34.
Figure 1.4: Typical industrial scale pDNA purification process
There are several critical limitations associated with DNA chromatography. First, the
average pore size in chromatographic resins is smaller than or comparable to the radius of
11
gyration of typical plasmid DNA molecules, therefore the majority of the internal surface area is
inaccessible to the large DNA molecules, leading to very low binding capacities. In contrast to
protein biologics, where loading can range from 10 to 100 g of protein per liter of resin, only 0.2-
2 g of pDNA can typically bind per liter of resin 35. As a result, very large quantities of
chromatographic media are needed for the large-scale purification of pDNA for therapeutic
applications (~ 500-2000 L of resin kg-1 pDNA processed). Second, the separation of different
plasmid isoforms is fairly limited due to their extremely similar chemical and physical
properties. The lack of selectivity has important implications for product purity and yield.
Finally, diffusional mass transfer significantly limits the total throughput of chromatographic
processes, with very long contact times required for satisfactory resolution 36.
1.3 Purification of plasmid DNA using membrane processes
A promising alternative strategy for pDNA purification is the use of ultrafiltration (UF)
membranes with pore sizes on the order of 10 nm, which was first demonstrated by Latulippe
and Zydney 37. Membrane processes are attractive since they are easily scaled and typically
cause little damage to biomolecules. In addition, membranes have unique advantages over
chromatography, as the process is driven by convective flow and does not suffer from diffusional
limitations. At the same time, membranes tend to be more cost effective than chromatographic
separations. Currently, membrane based processes have been widely used in the biotechnology
industry for protein concentration, buffer exchange, virus filtration and depth filtration 38-40.
Latulippe et al. 37 conducted extensive experimental and theoretical studies on the
transmission of plasmid DNA through semi-permeable ultrafiltration membranes. The extent of
DNA transmission was found to be largely dependent on the filtrate flux, with the transmission

12
increasing from essentially zero to nearly 100% as the filtrate flux increased, even though the
pore size of the UF membranes (2-20 nm) was an order of magnitude smaller than the radius of
gyration of pDNA (~100 nm for 3-30 kbp plasmids that are typically used in DNA therapeutics).
The large increase in DNA transmission with increasing filtrate flux was not caused by
concentration polarization effects since the results were found to be independent of the stirring
speed. Instead, Latulippe and Zydney hypothesized that the high transmission was due to
elongation of the plasmid DNA in the converging flow field entering the membrane pores during
ultrafiltration.
The extent of polymer deformation during flow can described in terms of the Deborah
number (De), which is the ratio of the time-scale for polymer relaxation (τ) to the characteristic
time for the fluid flow (γ-1) where γ is the shear rate associated with the flow. Significant
polymer deformation typically occurs when De = τγ ≥ 1. When τ > γ-1, the hydrodynamic force is
greater than the spring restoring force and the polymer stretches out into a string of ‘blobs’ with
a characteristic blob size smaller than the pore size 41. The elongated polymer is then able to
enter the pore and pass through the membrane. Daoudi and Brochard 42 modeled the effects of
chain deformation on the transport of large linear polymers into a single cylindrical pore. The
model predicts a sharp transition in polymer transmission above a critical value of the filtrate
flux, with this critical flux scaling as:
𝐽𝑐𝑟𝑖𝑡𝑖𝑐𝑎𝑙 = 𝑘𝐵𝑇
𝑟𝑝2𝜇
(1.5)
where kB is Boltzmann’s constant, T is the absolute temperature, µ is the fluid viscosity, and rp is
the pore radius. Equation (1.5) predicts that the critical filtrate flux is independent of the polymer
size but varies with the reciprocal of the pore radius squared. It is also proportional to
temperature and the reciprocal of the solution viscosity. These trends agree with experimental

13
results obtained with Ultracel 100, 300 and 1000 kDa membranes 37. However, this elongational
flow model only considers flow through a single cylindrical pore located within an infinite flat
(non-porous) plane. The flow behavior is much more complicated for a real membrane (e.g., the
Ultracel membranes with porosity as high as 50%) since the fluid streamlines from adjacent
pores will interact at a distance above the surface of the membrane that is much less than the Rg
of the plasmids. Latulippe and Zydney 43 modified the elongational flow model by assuming that
plasmid elongation occurred at a critical distance equal to a fraction of the radius of gyration
(β·Rg) with β <1. The resulting model yields a much smaller Jcritical and agrees well with the
critical flux measured experimentally:
𝐽𝑐𝑟𝑖𝑡𝑖𝑐𝑎𝑙 =𝛽3𝜋
6 (
𝑟𝑝2) (
1
𝜆) (
𝑘𝑩𝑇
𝜂) (1.6)
where λ is the ratio of the hydrodynamic radius to the radius of gyration, which is specific to the
type of pDNA and the solution conditions, and β was determined by fitting the model to data for
Jcritical under different experimental conditions. Although Equation (1.6) was in good agreement
with experimental data, the plasmid transmission is found to increase gradually with increasing
filtrate flux, in contrast to the sharp transition predicted by this polymer elongation model. This
discrepancy is likely due to the heterogeneity in the DNA molecules in combination with the
pore size distribution in the membranes. This will be discussed in more detail in the following
chapters.
It is well established that solution conditions, including both the salt concentration and
ionic composition, can significantly affect the conformation and flexibility of DNA due to
intramolecular electrostatic interactions between the negative-charged phosphate groups along
the DNA backbone. As a result, the transmission of pDNA through a UF membrane is also a
strongly affected by solution conditions, as shown by Latulippe and Zydney 44. For example, the

14
sieving coefficient of a 3.0 kbp supercoiled plasmid through Ultracel 300 kDa membranes
increased dramatically (from <0.01 to 0.65) at a constant filtrate flux of 50 µm/s as the NaCl
concentration was increased from 1 to 150 mM. An even more significant increase in
transmission was observed using MgCl2 as the salt concentration was increased from 2 to 40 mM
(similar to the total ionic strength range up to 150 mM NaCl). This could be due to the formation
of intramolecular salt bridges by the divalent magnesium ions, which would further reduce the
effective plasmid size. Dynamic ultrafiltration experiments were also performed with continuous
adjustment of the solution ionic strength. A considerable increase in the observed sieving
coefficient was observed following a 10-min mixing period (after changing the salt
concentration). This could imply that the conformational change in the pDNA with respect to the
change in ionic strength may be on the order of minutes. The dynamic response of the
supercoiled plasmids to changes in ionic environment could have important implications for the
overall performance of diafiltration/buffer exchange processes for DNA purification.
Similar to the case of supercoiled plasmids, the transmission of the linear and open-
circular isoforms is also a strong function of the filtrate flux. However, the critical flux for the
different isoforms were significantly different. Latulippe and Zydney 45 hypothesized that
different pDNA isoforms would display unique Jcritical values due to differences in their ability to
elongate in the converging flow field, thus providing opportunities to separate the isoforms by
simple ultrafiltration. Sieving experiments with the individual pDNA isoforms showed the
lowest values of the critical filtrate flux for the linear isoform followed by the supercoiled and
then the open-circular isoform; these results were confirmed by experiments using binary and
ternary mixtures of the pDNA isoforms. Separations could thus be achieved by operating at a
filtrate flux between the Jcrititcal values for the specific isoforms. For example, the supercoiled
15
DNA could be separated from the linear isoform by selecting a filtrate flux between the critical
flux for the linear and supercoiled isoforms, with the filtrate solution only containing the linear
isoform due to the nearly complete retention of the supercoiled isoform under these conditions. It
is worth mentioning that the separation mechanism in ultrafiltration is dramatically different
from other common methods of DNA separation such as SEC and Agarose gel electrophoresis
(AGE). For example, plasmid retention in SEC is due to equilibrium partitioning between the
mobile phase and the fluid space within the resin particles; therefore, the separation in SEC
depends on differences in the radius of gyration of the different isoforms 46. In this case, the
linear (largest) isoform has the shortest retention time while the supercoiled (smallest) isoform
has the longest retention time. In contrast, the supercoiled isoform migrates fastest
(corresponding to the largest mobility) through the homogeneous gel in AGE while the open-
circular isoform migrates the slowest, which is likely due to either transient impalement or
hindered reptation effects involving the agarose fibers within the gel matrix.
1.4 Challenges in membrane ultrafiltration of plasmid DNA
One of the main challenges in using membranes for biomolecule separations is the
limited selectivity of traditional size-based membrane separations. The general rule of thumb is
that at least a 10-fold difference in size is required for effective separation using conventional
ultrafiltration membranes (although electrically-charged membranes have been shown to have
much greater resolution when separating species with different net charge) 47. This is much less
than the difference in size for the different DNA isoforms, and even the differences in
elongational flexibility are often insufficient to provide sufficiently high resolution separations.

16
In addition to selectivity, another major challenge in membrane UF for pDNA
purification is membrane fouling. Borujeni and Zydney 48 conducted a thorough study on the
fouling behavior of pDNA during ultrafiltration. A significant decline in both filtrate flux and
DNA sieving coefficient was observed during the ultrafiltration of concentrated plasmid
solutions. For example, the filtration of a 20 L/m2 pDNA solution with a concentration of 7.2 x
10-3 kg/m3 caused 3-fold decline in filtrate flux and nearly total loss of plasmid transmission. A
simple mathematical model was developed for the decline in both filtrate flux and sieving
coefficient based on pore blockage by large pDNA molecules. The model accounts for both
partial pore blockage, as described by the parameter β (ratio of the filtrate flux through a blocked
pore to that through an open pore), and the rate at which the pores are blocked, which was
characterized by the rate constant k. Model calculations were in good agreement with the
experimental results, properly capturing the effects of membrane pore size, plasmid
concentration, and plasmid size on the fouling behavior. A variety of strategies have been
applied to control membrane fouling, including modification of membrane surfaces, physical
cleaning (sponges, water jets, or backflushing), chemical cleaning (use acids or bases to remove
foulants and impurities), optimization of operating conditions etc. However, it is critical to find
more efficient approaches to reduce membrane fouling for UF to be applied in large scale
purification of pDNA.
1.5 Dissertation outline
Previous studies have demonstrated that plasmid transmission through UF membranes
can be controlled by adjusting the filtrate flux thereby controlling the extent of plasmid
elongation. This phenomenon can be used for the separation of different plasmid isoforms by

17
exploiting the differences in flexibility of the supercoiled, linear, and open-circular isoforms.
However, there are a number of critical challenges that still need to be overcome in order to
apply these novel membrane-based processes for commercial scale manufacture of DNA for
gene therapy applications and for use as DNA-based vaccines.
The overall objective of this dissertation is to develop novel strategies to enable the
application of UF for pDNA separations and to demonstrate the feasibility of using these
enhanced membrane systems for the purification of plasmid DNA. This includes:
I. Evaluating different approaches that can enhance the separation resolution during
ultrafiltration of different plasmid isoforms
II. Examining different approaches to reduce membrane fouling during ultrafiltation of
concentrated DNA solutions
III. Developing better physical understanding of the factors governing the ultrafiltration
behavior of DNA through small pore size membranes
It is anticipated that the results from this study will provide important information needed for
successfully implementing UF processes into commercial systems for the large-scale
manufacture of therapeutic DNA products.
The details of the general experimental methods and materials used in this research are
summarized in Chapter 2. Chapter 3 investigates the strategy of pre-conditioning during UF of
pDNA, accomplished by exploiting the asymmetric structure of conventional ultrafiltraion
membranes to enhance the separation performance and reduce fouling. Chapter 4 provides a
different approach to pre-conditioning, in this case using composite membrane structures with
layers have different pore size. Chapters 5 and 6 examine the effects of solution ionic strength
and mutilvalent salts on the transmission of different plasmid isoforms through UF membranes,

18
including the identification of strategies to enhance the resolution of membrane systems for
DNA separations. Chapter 7 explores the effects of solution ionic conditions on membrane
fouling phenomena. Chapter 8 discusses the use of UF membranes for the separation of DNA
based on differences in DNA size / length (kbp), including a comparison with other size-based
separation methods such as AGE and SEC. The major conclusions that can be drawn from this
thesis, as well as recommendations for future research in this area, are presented in Chapter 9.

19
Chapter 2
Materials and Methods
This chapter describes the materials, apparatus, and experimental procedures that are
common across the different chapters in this dissertation. Additional details on specific methods
are provided in the appropriate chapters.
2.1 Plasmid DNA
2.1.1 Supercoiled plasmids
Experiments were performed with plasmids from approximately 3 to 17 kilo-base-pair
(kbp) in size. The 2,961 base pair (bp) pBluescript® II KS+ plasmid was obtained from
Strategene. The 9,801 bp plasmid was generated by insertion of a 6,840 bp fragment into the SalI
site of pBluescript® II KS+ plasmid vector. The 16,836 bp plasmid was generated by insertion
of a 13,878 bp fragment into the NotI site of the pBluescript® SK- plasmid (2,958 bp). The three
supercoiled plasmids mentioned above are named as p-EMP, p-MDY, and p-FDY and are
described as having size of 3.0, 9.8 and 16.8 kbp throughout the thesis.
Stock solutions of each supercoiled plasmid were prepared by Aldevron (Fargo, ND) as
follows. A single colony of E. coli DH5α bacteria strain was transfected by the desired plasmid
and used to inoculate a small starter culture that was allowed to grow for approximately 7 hr at
37 °C. The cell culture was then transferred to a shaker flask that contains 2 L of a nutrient-rich
media to grow overnight. The resulting biomass was harvested and lysed, with the lysate purified

20
by anion exchange chromatography. The plasmid stock solution met the stringent lot release
specifications listed in Table 2.1. All solutions were prepared in Tris-EDTA (TE) buffer with
concentrations of 200 – 250 µg/mL. The received stock solution was divided into 110 µL
aliquots to avoid damage of DNA molecules from repeated freeze-thaw cycles. These aliquots
were stored at -20 °C until ready for use in experiments.
Table 2.1: Specification of plasmid DNA stock solution
*Abbreviations: AGE, Agarose gel electrophoresis; EtBr, Ethidium bromide; LAL, Limulus
amebocyte lysate; EU, endotoxin units.
2.1.2 Plasmid isoforms
The linear and open-circular plasmid isoforms were prepared by enzymatic digestion of
the supercoiled isoform using restriction endonucleases that recognize specific nucleotide
Method Specification
Appearance Visual inspection Clear, colorless and free of visible particulates
Concentration UV spectrophotometry =0.20 or 0.25mg/mL
DNA homogeneity EtBr stained AGE Predominantly supercoiled
Endotoxin Kinetic Turbidimetric LAL < 100 EU/mg
Identity EtBr stained AGE Co-migrates with clienet reference DNA or
size confirmed versus a supercoiled marker
260/280 Absorbance Ratio UV spectrophotometry 1.80 – 2.00
Residual host Genomic DNA EtBr stained AGE < 5.00%
Residual host RNA EtBr stained AGE Not visible at 200 ng load
21
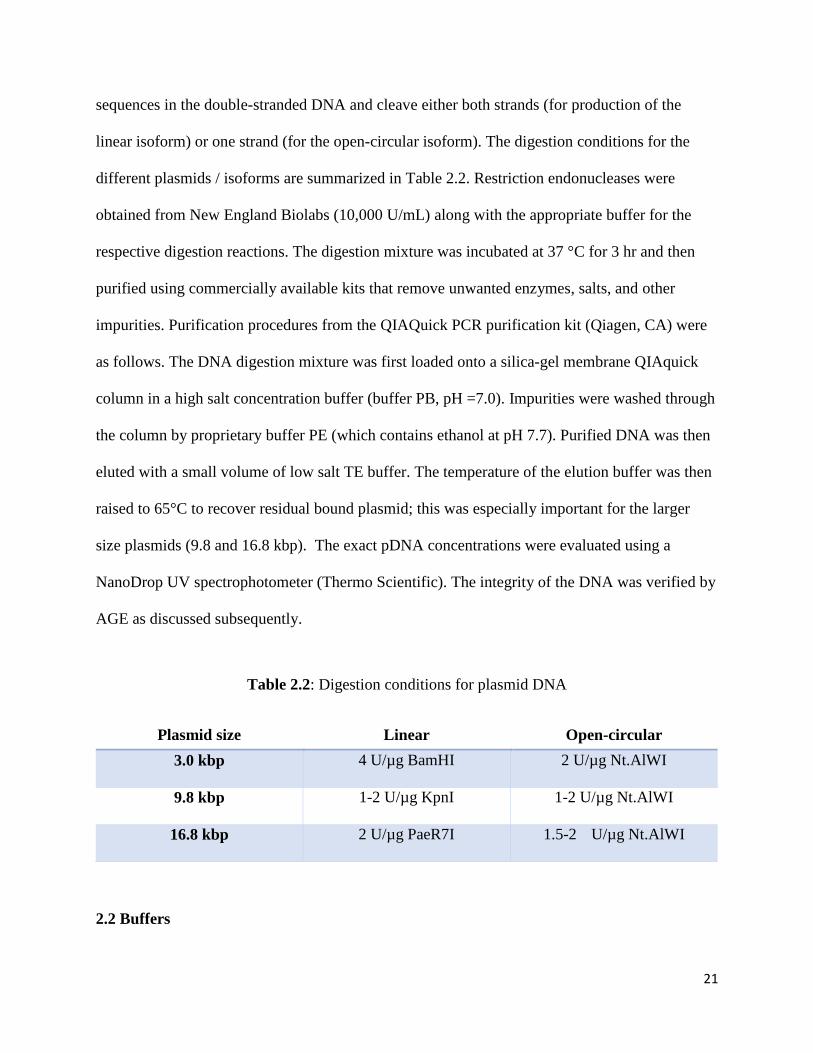
sequences in the double-stranded DNA and cleave either both strands (for production of the
linear isoform) or one strand (for the open-circular isoform). The digestion conditions for the
different plasmids / isoforms are summarized in Table 2.2. Restriction endonucleases were
obtained from New England Biolabs (10,000 U/mL) along with the appropriate buffer for the
respective digestion reactions. The digestion mixture was incubated at 37 °C for 3 hr and then
purified using commercially available kits that remove unwanted enzymes, salts, and other
impurities. Purification procedures from the QIAQuick PCR purification kit (Qiagen, CA) were
as follows. The DNA digestion mixture was first loaded onto a silica-gel membrane QIAquick
column in a high salt concentration buffer (buffer PB, pH =7.0). Impurities were washed through
the column by proprietary buffer PE (which contains ethanol at pH 7.7). Purified DNA was then
eluted with a small volume of low salt TE buffer. The temperature of the elution buffer was then
raised to 65°C to recover residual bound plasmid; this was especially important for the larger
size plasmids (9.8 and 16.8 kbp). The exact pDNA concentrations were evaluated using a
NanoDrop UV spectrophotometer (Thermo Scientific). The integrity of the DNA was verified by
AGE as discussed subsequently.
Table 2.2: Digestion conditions for plasmid DNA
Plasmid size Linear Open-circular
3.0 kbp 4 U/µg BamHI 2 U/µg Nt.AlWI
9.8 kbp 1-2 U/µg KpnI 1-2 U/µg Nt.AlWI
16.8 kbp 2 U/µg PaeR7I 1.5-2 U/µg Nt.AlWI
2.2 Buffers

22
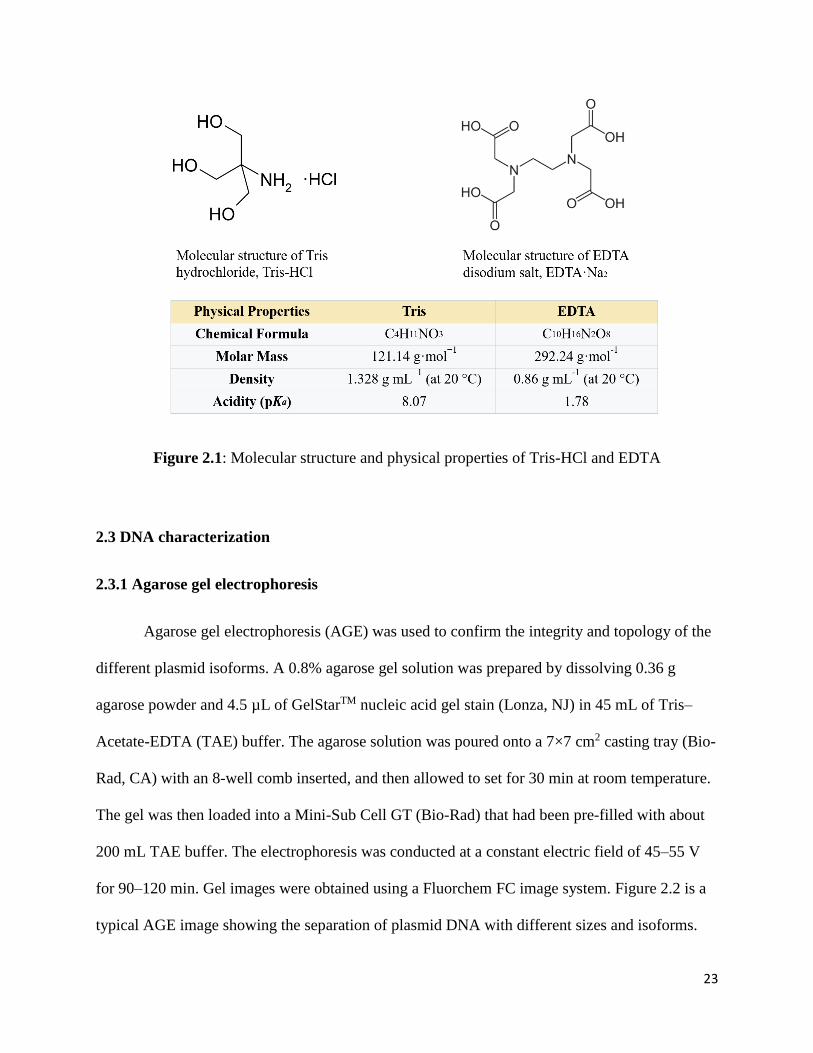
Buffer solutions were prepared by diluting a 100× concentrate of 1.0 M Tris-
hydrochloride (Tris-HCl) and 0.1 M ethylenediaminetetraacetic acid disodium salt (EDTA-Na2)
from Sigma-Aldrich. The molecular structure and physical properties of Tris-HCl and EDTA are
shown in Figure 2.1. Tris is widely used as a component of buffer solutions in biochemistry and
molecular biology, especially for solutions of nucleic acids. It has a pKa of 8.07 at 25 °C, and
thus has an effective buffer pH range between about 7.5 and 9.0. EDTA inactivates DNase by
chelating and sequestering cations such as Mg2+ that are required for DNase activity. The TE
buffer solution (i.e., 10 mM Tris-HCl, 1 mM EDTA-Na2) is thus commonly used to solubilize
DNA or RNA while protecting it from degradation. Plasmid DNA can be stored in TE buffer at
4°C for short term use or at -20°C to -80°C for long term storage up to 2 years.
Deionized distilled water with a resistivity greater than 18 MΩ-cm was produced using a
NANOpure Diamond water purification system (Barnstead International, IL). The solution ionic
strength was adjusted with either monovalent salts (e.g., sodium chloride = NaCl) or divalent
salts (e.g., magnesium chloride = MgCl2), both obtained from VWR with certified ACS grade.
The solution pH (7.7 ± 0.1) was measured using a 420APlus pH meter (Thermo Orion), and the
solution conductivity was measured using a 105APlus conductivity meter (Thermo Orion). All
solutions were prefiltered through 0.2 µm pore size Supor 200 disc filters obtained from Pall
Corporation (Port Washington, NY) to remove particulates.
23
Figure 2.1: Molecular structure and physical properties of Tris-HCl and EDTA
2.3 DNA characterization
2.3.1 Agarose gel electrophoresis
Agarose gel electrophoresis (AGE) was used to confirm the integrity and topology of the
different plasmid isoforms. A 0.8% agarose gel solution was prepared by dissolving 0.36 g
agarose powder and 4.5 µL of GelStarTM nucleic acid gel stain (Lonza, NJ) in 45 mL of Tris–
Acetate-EDTA (TAE) buffer. The agarose solution was poured onto a 7×7 cm2 casting tray (Bio-
Rad, CA) with an 8-well comb inserted, and then allowed to set for 30 min at room temperature.
The gel was then loaded into a Mini-Sub Cell GT (Bio-Rad) that had been pre-filled with about
200 mL TAE buffer. The electrophoresis was conducted at a constant electric field of 45–55 V
for 90–120 min. Gel images were obtained using a Fluorchem FC image system. Figure 2.2 is a
typical AGE image showing the separation of plasmid DNA with different sizes and isoforms.

24
For the same voltage, plasmid DNA with the smallest size migrates fastest (from top to bottom),
with the supercoiled isoform migrating faster than either the linear or open-circular isoforms.
Figure 2.2: AGE image for plasmid with different sizes (left panel) and isoforms (right panel)
2.3.2 PicoGreen Assay
DNA concentrations were evaluated by fluorescence detection using the ultrasensitive
nucleic acid stain PicoGreen (Life Technology, CA). All DNA samples were analyzed in
duplicate using Cliniplate 96-well black microplates (Thermo Scientific, PA) and a GENios FL
microplate reader (TECAN). 70 µL of the PicoGreen solution was prepared by diluting the stock
reagent with TE buffer (1:200), with the reagent added to each well along with 70 µL of the
DNA sample. The plates were shaken for 3 min, with the fluorescence intensity evaluated at 530
nm using an excitation wavelength of 485 nm and a temperature of 36 °C. Calibration curves
were constructed using DNA solutions with known concentrations from 0 to 0.5 µg/mL, with
accuracy of 0.25 ng/mL. Since the Picogreen fluorescence is weakly sensitive to the salt
concentration49, calibration standards were included in each plate at the specific ionic conditions.
DNA concentration measurements using fluorescence methods are more sensitive than
25
absorbance, particularly for low-concentration samples, and the use of DNA-binding dyes allows
more specific measurement of DNA than is possible with spectrophotometric methods.
2.3.3 NanoDrop Spectrophotometry
Nucleic acids absorb ultraviolet (UV) light due to the heterocyclic rings of the
nucleotides; the sugar-phosphate backbone does not contribute to absorption. The wavelength of
maximum absorption for both DNA and RNA is 260 nm (λmax = 260nm), with a characteristic
value for each base. The absorption properties of DNA can be used for detection, quantification
and assessment of purity. A260 readings need to be within the instrument’s linear range (generally
0.1–1.0). The actual DNA concentration is then determined by subtracting off the contribution
from the turbidity (measured by absorbance at 320 nm):
Concentration (µg/ml) = (A260 reading – A320 reading) × dilution factor × 50 µg/ml
The DNA purity was estimated by measuring the absorbance from 230 to 320 nm. The most
common purity calculation is based on the ratio of the absorbance at 260 nm to that at 280 nm.
Good-quality DNA will have an A260/A280 ratio of 1.7–2.0. The ratio is best calculated after
correcting for turbidity (absorbance at 320nm).
DNA purity (A260/A280) = (A260 reading – A320 reading) ÷ (A280 reading – A320 reading)
A NanoDrop 1000 Spectrophotometer (Thermo Fisher Scientific, DE) was used to
evaluate the UV absorbance of the different DNA samples. 1-2 µL aqueous nucleic acid samples
were added to the measurement pedestal, which was sufficient to generate accurate and
reproducible results. The detection upper/lower limits and reproducibility of the NanoDrop 1000
Spectrophotometer are summarized in Table 2.3.
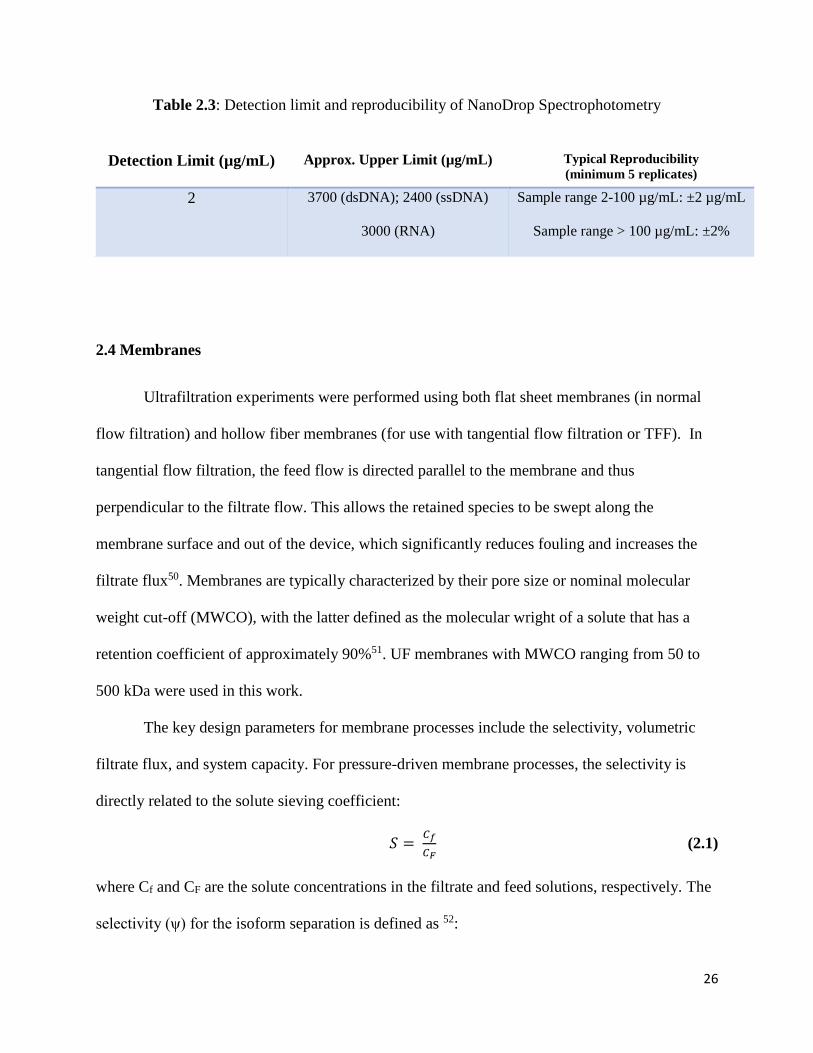
26
Table 2.3: Detection limit and reproducibility of NanoDrop Spectrophotometry
Detection Limit (µg/mL) Approx. Upper Limit (µg/mL) Typical Reproducibility
(minimum 5 replicates)
2 3700 (dsDNA); 2400 (ssDNA)
3000 (RNA)
Sample range 2-100 µg/mL: ±2 µg/mL
Sample range > 100 µg/mL: ±2%
2.4 Membranes
Ultrafiltration experiments were performed using both flat sheet membranes (in normal
flow filtration) and hollow fiber membranes (for use with tangential flow filtration or TFF). In
tangential flow filtration, the feed flow is directed parallel to the membrane and thus
perpendicular to the filtrate flow. This allows the retained species to be swept along the
membrane surface and out of the device, which significantly reduces fouling and increases the
filtrate flux50. Membranes are typically characterized by their pore size or nominal molecular
weight cut-off (MWCO), with the latter defined as the molecular wright of a solute that has a
retention coefficient of approximately 90%51. UF membranes with MWCO ranging from 50 to
500 kDa were used in this work.
The key design parameters for membrane processes include the selectivity, volumetric
filtrate flux, and system capacity. For pressure-driven membrane processes, the selectivity is
directly related to the solute sieving coefficient:
𝑆 = 𝐶𝑓
𝐶𝐹 (2.1)
where Cf and CF are the solute concentrations in the filtrate and feed solutions, respectively. The
selectivity (ψ) for the isoform separation is defined as 52:
27
(2.2)
where S1 and S2 are the observed sieving coefficients of the plasmid isoforms that are more and
less highly transmitted through the membrane, respectively. The initial (clean membrane)
volumetric filtrate flux is related to the membrane hydraulic permeability as:
𝐿𝑝 = 𝐽𝑣
∆𝑃 (2.3)
where Jv is the filtrate flux (volumetric filtrate flow rate per unit membrane area) and ∆P is the
transmembrane pressure difference. The filtrate flux during filtration of the actual feed solution
is typically less than that predicted from the fresh membrane permeability due to membrane
fouling and concentration polarization effects. The system capacity is defined as the volume of
feed that can be processed per unit membrane area before the membrane has to be cleaned or
replaced. For constant pressure filtration, this is usually defined as the volume processed up until
the filtrate flux has dropped to less than 10% (or 20%) of its initial value. The change in the
membrane hydraulic permeability can also be used to characterize the extent of membrane
fouling after a filtration run 53.
Most of the membranes used in this study have an asymmetric structure, which is
comprised of a thin skin layer that provides the membrane its functionality and a much thicker
and more porous substrate that provides the membrane its structural integrity. The small
thickness of the skin greatly enhances the permeability compared to symmetric membranes with
similar selectivity. Figure 2.3 is a scanning electron microscope (SEM) image of the cross
section of the BiomaxTM and UltracelTM membranes used in this work showing their asymmetric
structures. The skin thickness is approximately 0.5 – 1 μm while the total membrane thickness is
around 100 μm.
y =S1
S2
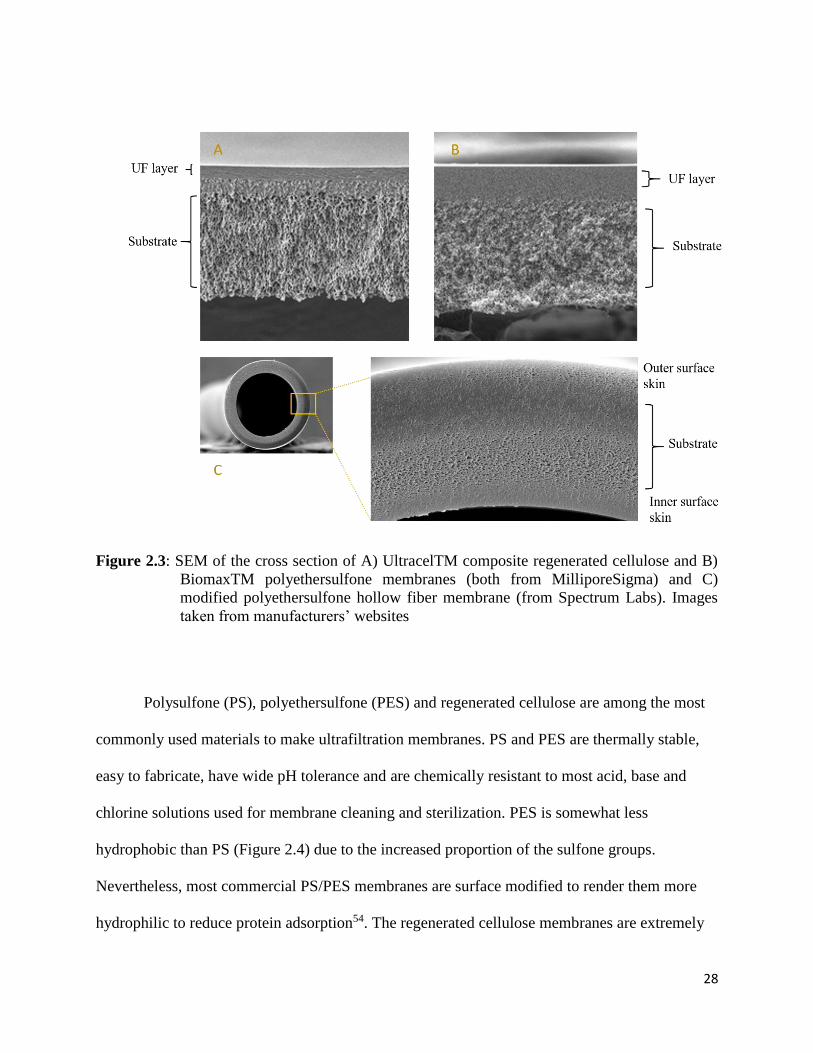
28
Figure 2.3: SEM of the cross section of A) UltracelTM composite regenerated cellulose and B)
BiomaxTM polyethersulfone membranes (both from MilliporeSigma) and C)
modified polyethersulfone hollow fiber membrane (from Spectrum Labs). Images
taken from manufacturers’ websites
Polysulfone (PS), polyethersulfone (PES) and regenerated cellulose are among the most
commonly used materials to make ultrafiltration membranes. PS and PES are thermally stable,
easy to fabricate, have wide pH tolerance and are chemically resistant to most acid, base and
chlorine solutions used for membrane cleaning and sterilization. PES is somewhat less
hydrophobic than PS (Figure 2.4) due to the increased proportion of the sulfone groups.
Nevertheless, most commercial PS/PES membranes are surface modified to render them more
hydrophilic to reduce protein adsorption54. The regenerated cellulose membranes are extremely

29
hydrophilic due to the large numbers of hydroxyl groups on the surface, which greatly reduces
protein binding and fouling during filtration. The structural integrity of regenerated cellulose
membranes is enhanced by casting the cellulose onto a microporous support matrix (typically
polyethylene). The resulting composite regenerated cellulose (CRC) membranes have a uniform,
robust structure, with high integrity and greater resistance to back pressure. Since regenerated
cellulose membranes are not very stable to extreme acidic or basic conditions, they are most
suitable in applications that do not involve harsh chemical conditions.
Figure 2.4: Molecular structure of polysulfone, polyethersulfone, and regenerated cellulose

30
Two types of flat sheet membranes, UltracelTM (regenerated cellulose) and BiomaxTM
(polyethersulfone), both with MWCO of 100 and 300 kDa, were used extensively throughout
this study. Membrane discs (25 mm diameter) were cut from large membrane sheets, generously
provided by Millipore Corp., using a specially designed cutting device. All membranes were
initially soaked in 90% isopropyl alcohol and then flushed with at least 100 mL of water to
remove residual storage agents and to insure thorough wetting of the pore structure. The
membranes were stored in DI water at approximately 4 °C to prevent collapse of the membrane
pore structure (i.e., irreversible damage) due to drying.
Tangential flow ultrafiltration experiments were performed with hollow fiber PS
membranes obtained from GE Healthcare (Niskayuna, NY) with MWCO of 50 kDa (UFP-50-C-
03M) and 500 kDa (UFP-500-C-03M). Each cartridge contains 30 hollow fibers with 5 × 10⁻⁴ m
(0.5 mm) ID and 0.3 m length, giving 140 cm2 total membrane area. New membrane filters were
soaked in 25% ethanol or isopropyl alcohol for 1 hr and rinsed with DI water to ensure complete
removal of glycerol that was used during long term storage / shipping. The modules were
preconditioned by circulating the buffer of interest through the retentate and permeate at a feed
transmembrane pressure of 1.6 to 2.8 bar (25 to 40 psi) for several minutes. Transmembrane
pressure (TMP) was calculated as:
𝑇𝑀𝑃 (∆𝑃) = 𝑃𝑓𝑒𝑒𝑑+ 𝑃𝑟𝑒𝑡𝑒𝑛𝑡𝑎𝑡𝑒
2− 𝑃𝑝𝑒𝑟𝑚𝑒𝑎𝑡𝑒 (2.4)
The shear rate at the lumen surface of the membrane was evaluated assuming Poiseuille flow as:
𝛾 = 4𝑞
𝜋𝑅3 (2.5)
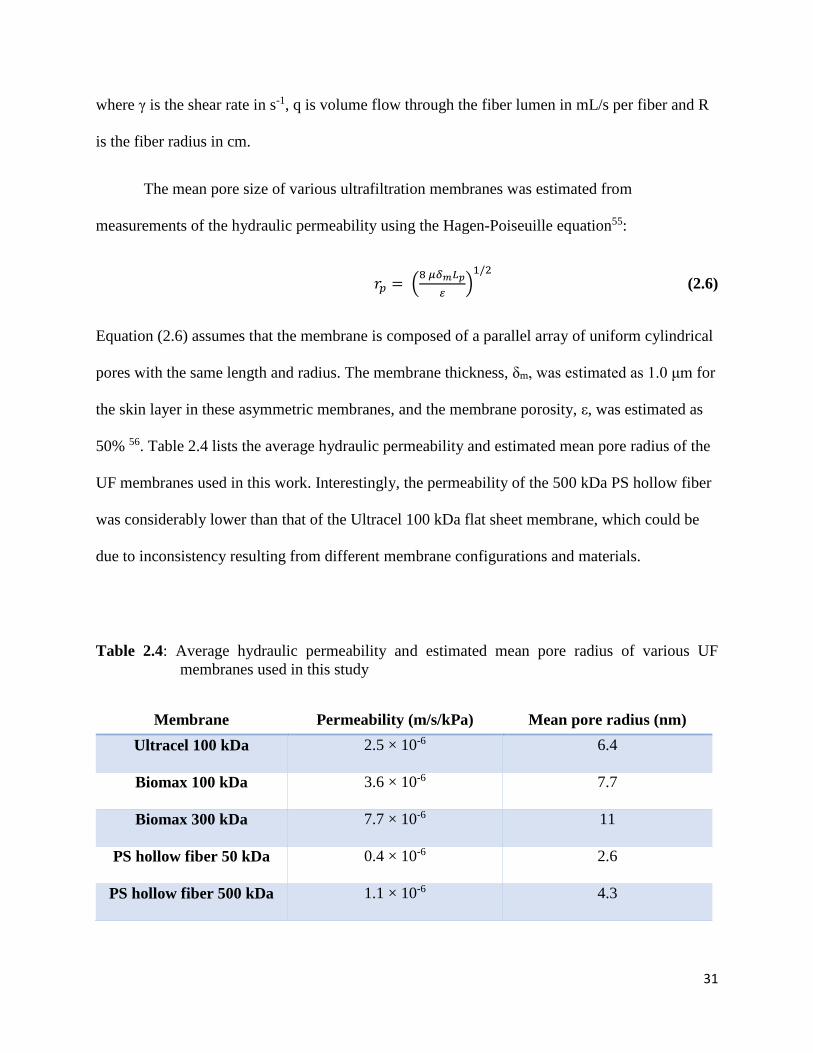
31
where γ is the shear rate in s-1, q is volume flow through the fiber lumen in mL/s per fiber and R
is the fiber radius in cm.
The mean pore size of various ultrafiltration membranes was estimated from
measurements of the hydraulic permeability using the Hagen-Poiseuille equation55:
𝑟𝑝 = (8 𝜇𝛿𝑚𝐿𝑝
)1/2
(2.6)
Equation (2.6) assumes that the membrane is composed of a parallel array of uniform cylindrical
pores with the same length and radius. The membrane thickness, δm, was estimated as 1.0 μm for
the skin layer in these asymmetric membranes, and the membrane porosity, ε, was estimated as
50% 56. Table 2.4 lists the average hydraulic permeability and estimated mean pore radius of the
UF membranes used in this work. Interestingly, the permeability of the 500 kDa PS hollow fiber
was considerably lower than that of the Ultracel 100 kDa flat sheet membrane, which could be
due to inconsistency resulting from different membrane configurations and materials.
Table 2.4: Average hydraulic permeability and estimated mean pore radius of various UF
membranes used in this study
Membrane Permeability (m/s/kPa) Mean pore radius (nm)
Ultracel 100 kDa 2.5 × 10⁻⁶ 6.4
Biomax 100 kDa 3.6 × 10⁻⁶ 7.7
Biomax 300 kDa 7.7 × 10⁻⁶ 11
PS hollow fiber 50 kDa 0.4 × 10⁻⁶ 2.6
PS hollow fiber 500 kDa 1.1 × 10⁻⁶ 4.3

32
2.5 Membrane characterization
2.5.1 Membrane hydraulic permeability
The membrane hydraulic permeability is an important indicator of membrane
functionality and is evaluated as the slope of data for the filtrate flux (Jv) as a function of the
transmembrane pressure (∆P) using DI water as shown in Equation (2.2). Measurements were
typically taken at 4 different TMP ranging from 14 to 69 kPa (2 to 10 psi), which were
determined by differential pressure measurements using a digital pressure gauge (Ashcroft, CT).
For TFF cartridges, TMP is calculated based on Equation (2.4) and can be adjusted by either
altering the feed flow rate or restricting the retentate outlet. The filtrate flux is calculated as the
volumetric flow rate through the membrane divided by the effective membrane area. The
volumetric flow rate was evaluated by timed collection of filtrate samples using a digital balance
(Mettler Toledo). Membranes were only used when the permeability was within ±20% of the Lp
suggested by the manufacturer.
2.5.2 Scanning electron microscopy (SEM)
The surface characteristics of the clean membranes and membranes after chemical
modification (Chapter 4) were examined by scanning electron microscopy. A small piece of
membrane (approximately 1 cm2) was cut from larger membrane discs and attached to an
aluminum barrel stub using carbon tape. The membrane surface was imaged using a FEI Nova
NanoSEM 630 Field Emission Scanning Electron Microscope (FESEM) and helix detector under
low vacuum mode (without coating to protect the membrane surface) at magnifications up to
150,000 × using a 3.0 to 5.0 kV electron landing energy.

33
2.6 Sieving experiments
2.6.1 Normal flow filtration
Sieving experiments using flat sheet membranes were conducted using 10 mL Amicon
stirred cells (MilliporeSigma) with effective membrane area of 4.1 cm2. Figure 2.5 shows a
schematic of the stirred cell setup. The plasmid solution was added to the stirred cell, and the
entire apparatus was sealed and connected to an air-pressurized feed reservoir. The stirred cell
was placed on a magnetic stir plate (VWR 205 Autostirrer) to ensure proper mixing of the
solution using a stirring speed of 730 rpm. The pressure of the feed reservoir was adjusted to
obtain the desired filtrate flux. The system was allowed to stabilize (typically after filtration of
approximately 1 mL), with a filtrate sample then collected for subsequent analysis. Data were
reported in terms of the observed sieving coefficient (S0), evaluated as the ratio of the plasmid
concentration in the collected filtrate sample to that in the feed solution (Equation 2.1), with the
feed concentration evaluated from the arithmetic average of samples taken from the stirred cell
immediately before and after collecting the filtrate sample. Ultrafiltration experiments were
performed at room temperature (18–23°C), with filtrate and feed samples stored at 4°C until they
were ready to be analyzed.

34
Figure 2.5: Schematic of stirred cell set-up used for ultrafiltration (adopted from Latulippe, 2010).
2.6.2 Tangential flow filtration
The experimental set up used for the hollow fiber modules is shown schematically in
Figure 2.6. The hollow fiber modules were oriented at a 45°angle to the horizontal to facilitate
sampling and filling of the shell region. The feed was driven through the module using a positive
displacement pump (Masterflex, Gelsenkirchen, Germany). The pressures on the feed and
retentate side were measured using pressure sensors and LabQuest software (Vernier, OR), while
the pressure on the filtrate side was atmospheric. The transmembrane pressure was set by
adjusting a valve on the retentate exit line, with the permeate flow rate evaluated via timed
collection of permeate samples obtained throughout the ultrafiltration. Experiments were
performed in a batch concentration mode at constant transmembrane pressure (by adjusting the
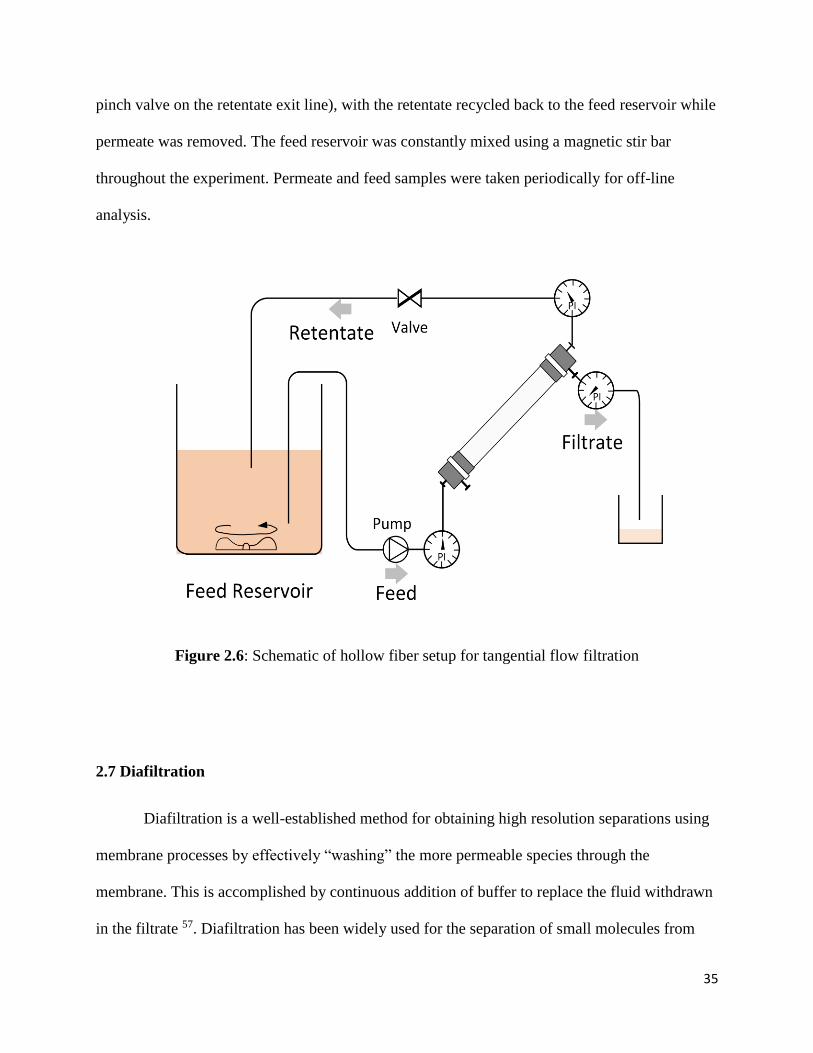
35
pinch valve on the retentate exit line), with the retentate recycled back to the feed reservoir while
permeate was removed. The feed reservoir was constantly mixed using a magnetic stir bar
throughout the experiment. Permeate and feed samples were taken periodically for off-line
analysis.
Figure 2.6: Schematic of hollow fiber setup for tangential flow filtration
2.7 Diafiltration
Diafiltration is a well-established method for obtaining high resolution separations using
membrane processes by effectively “washing” the more permeable species through the
membrane. This is accomplished by continuous addition of buffer to replace the fluid withdrawn
in the filtrate 57. Diafiltration has been widely used for the separation of small molecules from

36
therapeutic proteins 58-59 and also for the removal of host cell proteins from recombinant protein
therapeutics 47. During a constant volume diafiltration process, buffer solution is added
continuously throughout the filtration at the same rate as the permeate is removed so that the
total volume in the feed tank remains constant during the process.
Experimental setup of a diafiltration system is similar to that shown in Figure 2.5. The
stirred cell was initially filled with 12 mL of the plasmid solution in TE buffer while the
polycarbonate feed reservoir was filled with a plasmid free TE buffer solution. The reservoir was
left at atmospheric pressure throughout the diafiltration. The desired filtrate flux was set by
connecting a peristaltic pump to the exit filtrate line. The vacuum generated by the pump caused
buffer in the reservoir to be drawn into the stirred cell at the same volumetric flow rate as the
filtrate is removed. Filtrate and feed samples were collected at designated time intervals to
evaluate the concentration and identity of the pDNA isoforms. The plasmid concentration in the
stirred cell during a diafiltration process can be expressed as a function of the number of
diavolumes (ND) as:
𝐶 = 𝐶0 exp (−𝑁𝐷 ∙ 𝑆𝑜) (2.7)
where C0 is the initial plasmid concentration in the stirred cell, S0 is the observed sieving
coefficient of the particular plasmid isoform, and ND equals to the total volume processed
through the membrane divided by the constant retentate volume in the stirred cell. The filtrate
concentration Cfiltrate can therefore be calculated from:
𝐶𝑓𝑖𝑙𝑡𝑟𝑎𝑡𝑒 = 𝐶0 𝑆0exp (−𝑁𝐷 ∙ 𝑆0) (2.8)

37
Chapter 3
Use of Pre-conditioning to Control Membrane Fouling and Enhance Membrane
Performance
The objective of the work described in this Chapter was to examine the potential of using
pre-conditioning, in this case accomplished by pre-elongating the DNA by passage through a
region with large pore size, to minimize fouling and enhance DNA separations. The majority of
the work presented in this chapter was previously published in the Journal of Membrane Science
(Li et al., 479, 117-122, 2015).
3.1 Introduction
As discussed in Chapter 1, one of the major challenges in plasmid DNA ultrafiltration is
membrane fouling48, 60-61. Borujeni and Zydney48 showed that membrane fouling increased
dramatically at high feed concentrations, with the extent of plasmid transmission decreasing
rapidly during the ultrafiltration process due to partial blockage of the membrane pores by
individual plasmids that became trapped at the pore entrance. The rate of fouling was greater for
the larger plasmids due to the greater probability of a plasmid getting trapped at the pore
entrance. This trapping phenomenon was likely due to the incomplete extension of the plasmid
in the converging flow field into the membrane pores and / or the increased likelihood of “knot”
formation in the larger plasmids62-63.
Plasmid “trapping” has also been observed in micro- / nano-fluidic systems designed for
DNA separations, manipulations, and sequencing 64. A variety of approaches have been used to

38
facilitate DNA extension by “pre-conditioning” the DNA in nanofluidic systems, e.g., by
applying shear forces, passing the DNA through a gel matrix or an array of nano-obstacles 65-69,
or using a conically-shaped constriction to gradually elongate the DNA 70-72. For example, Cao
et al. 65 used a gradient array of nanostructures with decreasing spacing to enhance the extension
of long DNA molecules; DNA that passed through the nanostructured array were able to enter
narrow slit-shaped nanopores under conditions in which the DNA was trapped at the pore
entrance in the absence of “pre-conditioning” by the nanostructured array. Different strategies to
pre-condition DNA using microfluidic systems are schematically shown in Figure 3.1.
Figure 3.1: Use of microfluidic devices to pre-condition DNA.A) Stretching by shear flow
(reproduced from Perkins et al., 2007)73; B) Pre-stretching using obstacle arrays
(reproduced from Chan et al., 2004)74; C) Pre-stretching by conical-shaped
microchannel (adopted from Larson et al., 2006)70
The objective of the work described in this Chapter was to examine the effect of “pre-
conditioning” on the transmission and fouling behavior of plasmid DNA during ultrafiltration.
Data were obtained with asymmetric hollow fiber ultrafiltration membranes, oriented with the
flow through either the skin or the substructure first. The results were analyzed using available
39
models for polymer elongation, with the data used to identify conditions that could provide
enhanced separation of the plasmid DNA isoforms. The results clearly demonstrate the potential
of controlling the membrane pore morphology to pre-condition the DNA, thus, reducing the
extent of fouling and enhancing the performance of membrane systems for DNA purification.
3.2 Materials and methods
Ultrafiltration experiments were performed with hollow fiber polysulfone (PS)
membranes obtained from GE Healthcare (Niskayuna, NY) with nominal molecular weight
cutoffs of 50 kDa (UFP-50-C-03M) and 500 kDa (UFP-500-C-03M). These membranes are
highly asymmetric, with the tight “skin” on the inner surface of the fiber lumen.
200 µg/mL stock solutions of 3.0 and 16.8 kbp supercoiled plasmids were prepared by
Aldevron (Fargo, ND) and stored frozen at -20º C. A small amount of the stock solution was
thawed and diluted with TE buffer containing 150 mM NaCl immediately prior to use in the
ultrafiltration experiment. The linear and open-circular isoforms were prepared in our laboratory
by enzymatic digestion of the supercoiled isoform using restriction and nicking endonucleases
(New England Biolabs, MA), respectively. Plasmid concentrations were determined using the
Quant-iT PicoGreen dsDNA assay kit (Life Technologies, Carlsbad, CA). The quality of the
plasmid stock solutions and the effectiveness of the enzymatic digestions were examined by
agarose gel electrophoresis (AGE) following the procedures described in Chapter 2. AGE was
also used to estimate the relative concentrations of the different isoforms in separation
experiments performed using mixtures of the linear and supercoiled isoforms.

40
Plasmid ultrafiltration experiments were conducted in both the normal (from lumen to
shell) and reverse flow directions. Buffer solution was pumped into the module (through the
fiber lumens) using a Masterflex peristaltic pump at a constant feed flow rate of 100 mL/min,
with the transmembrane pressure adjusted using a ball valve installed on the exit retentate line.
During normal operation, the feed flow was introduced into the fiber lumen with permeate
withdrawn through the shell. The module was oriented at a 45° angle to the horizontal with the
upper permeate port kept closed. During ‘reverse’ operation, the feed flow was introduced into
the shell, with filtration occurring through the membrane substructure and then the skin, with the
filtrate collected from the lumen exit. In both cases, data were obtained in total recycle mode,
with the retentate and permeate lines recycled back to the feed reservoir to maintain a uniform
plasmid concentration. Filtrate samples were collected periodically throughout the ultrafiltration
experiment to evaluate the plasmid concentrations.
3.3. Results and discussion
3.3.1 Membrane Orientation
Figure 3.2 shows typical data for the transmission of plasmid DNA through ultrafiltration
membranes. Experiments were performed using the 16.8 kbp supercoiled plasmid through a 500
kDa and a 50 kDa hollow fiber membrane in normal (lumen-to-shell) operation. The plasmid
transmission increased significantly with increasing filtrate flux for data obtained using the 500
kDa PS membranes. For example, the sieving coefficient increased from So < 0.05 at a filtrate
flux of 6.7 µm/s (24 L/m2/h) to So ≈ 0.9 at a filtrate flux of 45 μm/s (160 L/m2/h). This increase
in plasmid transmission with increasing filtrate flux is due to elongation of the plasmid in the

41
fluid flow entering the membrane pore as discussed by Latulippe and Zydney43. Note that the
radius of gyration of the 16.8 kbp plasmid is approximately 170 nm 75, which is more than 10
times larger than the less than 5 nm mean pore size of the 500 kDa membrane used in these
experiments (Table 2.4). In contrast, the transmission of plasmids through the 50 kDa membrane
was very low (So < 0.1) over the entire range of filtrate flux tested, indicating that the critical flux
for DNA transmission is above 60 µm/s. This is consistent with the analysis provided by
Latulippe and Zydney43, where the critical flux is reversely proportional to the square of the pore
radius.
Figure 3.2: Observed sieving coefficient of the supercoiled 16.8 kbp supercoiled plasmid through
a 500 kDa and 50 kDa hollow fiber membrane in normal orientation. Data were
obtained at a feed flow rate of 100 mL/min using a plasmid concentration of 0.25
µg/mL
0
0.2
0.4
0.6
0.8
1
1 10 100
Sie
vin
g C
oe
ffic
ien
t, S
0
Filtrate Flux Jv, (µm/s)
500 kDa
50 kDa

42
Figure 3.3 shows data for the observed sieving coefficient of the 16.8 kbp supercoiled
plasmid during ultrafiltration of a 3 μg/mL (3 × 10⁻³ kg/m3) solution through a 500 kDa hollow
fiber membrane in both the forward (lumen-to-shell) and reverse (shell-to-lumen) orientations.
Data were obtained at a feed flow rate of 100 mL/min using a constant transmembrane pressure
of 55 kPa (8 psi), yielding an initial filtrate flux of 45 μm/s (160 L/m2/h) in both orientations,
consistent with the very similar values of the membrane permeability determined in the lumen-
to-shell and shell-to-lumen directions. The change of the sieving coefficient throughout the
filtration is plotted as a function of the cumulative filtrate volume normalized by the membrane
area; both experiments were conducted for a total filtration time of more than 840 s. When the
membrane was used in the reverse orientation, the observed sieving coefficient and the filtrate
flux remained essentially constant throughout the ultrafiltration experiment with So values
between 0.92 and 0.87. This high degree of plasmid transmission is again due to the stretching
of the plasmid in the elongational flow field entering the membrane pore.
In contrast to the results in the reverse orientation, the observed sieving coefficient in the
forward orientation (skin-side facing the feed) decreased significantly during the ultrafiltration,
going from So > 0.8 at the start of the experiment to less than 0.4 after filtration of 35 L/m2 due
to membrane fouling. The filtrate flux also decreased slightly during filtration in the forward
direction, from Jv = 47 to 41 μm/s. This small decline in filtrate flux (compared to the large
decline in plasmid transmission) is due to fluid flow around the trapped plasmids in the partially
blocked pores. This is discussed in more detail by Borujeni et al.76.

43
Figure 3.3: Observed sieving coefficients (upper panel) and filtrate flux (lower panel) during
constant pressure ultrafiltration of a 3 µg/mL solution of the supercoiled 16.8 kbp
plasmid through a 500 kDa hollow fiber membrane in both the lumen-to-shell
(forward) and shell-to-lumen (reverse) orientations.
The absence of any fouling in the reverse flow orientation is likely due to the gradual
elongation of the plasmid DNA in the more open pores within the support structure of the hollow
44
fiber membrane. This gradual elongation, or “pre-conditioning”, of the plasmid minimizes the
likelihood of the plasmid getting trapped at the entrance to the narrow (less than 20 nm) pores in
the skin layer of the membrane. This pre-conditioning is absent when the fluid flow is in the
forward orientation, with the plasmids immediately exposed to the very narrow pores. This
behavior is in good agreement with results obtained by Cao et al.65 and Tegenfeldt et al.77 in
nanofluidic devices using an array of nanopores to pre-condition the DNA.
The effect of pre-conditioning on the observed sieving coefficient of the 16.8 kbp
plasmid is examined in more detail in Figure 3.2. Data were obtained with a 0.25 µg/mL
solution of the supercoiled plasmid using a single 500 kDa hollow fiber membrane in two
separate experiments, one with flow in the forward direction (through the skin first) and one with
flow in the reverse direction (through the substructure first). In both cases, the flux was
increased from low to high, with approximately 3 min at each condition to insure complete
washout of the hold-up volume in the hollow fiber system (approximately 2 mL inside the fiber
lumen and 9 mL in the shell region). There was no evidence of any fouling in these experiments
due to the very low concentration of the plasmid; the plasmid sieving coefficient remained
constant at each pressure and the membrane hydraulic permeability after filtration was within 5%
of that of the fresh membrane. There was also no degradation or topological changes in the
plasmid due to either operation of the peristaltic pump or passage of the plasmid through the
membrane as confirmed by agarose gel electrophoresis.

45
Figure 3.4: Observed sieving coefficient of the supercoiled 16.8 kbp supercoiled plasmid through
a 500 kDa hollow fiber membrane in the reverse and forward orientations. Data were
obtained at a feed flow rate of 100 mL/min using a plasmid concentration of 0.25
µg/mL.
Plasmid transmission in both the forward and reverse orientations was a strong function
of filtrate flux. For example, the sieving coefficient in the reverse orientation increased from So
= 0.10 to So > 0.8 as the filtrate flux increased from approximately 3.4 to 8.5 μm/s
(corresponding to 12 to 31 L/m2/h). A qualitatively similar behavior was seen in the forward
direction; however, the sieving curve was strongly shifted to the right (higher filtrate flux). In
both cases, plasmid transmission was negligible at very small values of the filtrate flux; plasmid
elongation (and thus transmission) only became significant above a critical value of the filtrate
flux as discussed by Latulippe et al.37. The critical flux for plasmid transmission was estimated
by extrapolation of the sieving coefficient data to zero on a linear plot (using data with So values
0
0.2
0.4
0.6
0.8
1
1 10 100
Sie
vin
g C
oeff
icie
nt,
S0
Filtrate Flux, Jv (μm/s)
reverse
forward
46
less than 0.5), giving Jcrit = 1.8 ± 0.1 µm/s in the reverse orientation compared to 6.3 ± 0.3 µm/s
in the forward orientation.
The large difference in plasmid transmission in the forward and reverse orientations is
directly related to the different hydrodynamics in the two flow directions as shown schematically
in Figure 3.5. When the flow is in the forward direction, plasmid elongation occurs in the
converging flow field as the fluid approaches the pore. In contrast, the converging flow in the
reverse orientation is determined by the geometry of the “conical-shaped” pore as one moves
through the substructure and towards the skin of the highly asymmetric membrane. Daoudi and
Brochard 42 used scaling arguments to evaluate the critical flux for the transmission of a highly
flexible chain for the two geometries sketched in Figure 3.5. In each case, polymer transmission
was assumed to occur when the Deborah number (the ratio of the time scale for polymer
relaxation to the characteristic time scale for the fluid flow) was greater than or equal to one. For
a single cylindrical pore, analogous to the behavior of the hollow fiber membrane in the forward
orientation, the critical flux was scaled as shown previously in Equation (1.5):
𝐽𝑐𝑟𝑖𝑡 ≈ 𝑘𝐵𝑇
𝜇𝑟𝑝2 (1.5)
where ε is the membrane porosity, kB is the Boltzmann constant, T is the absolute temperature, μ
is the fluid viscosity, and rp is the pore radius. In contrast, the critical flux for a conical pore was
given as 42:
𝐽𝑐𝑟𝑖𝑡′ ≈ α𝐽𝑐𝑟𝑖𝑡 (3.1)
where α = D/x is a measure of the angle of the cone. The parameter α can be estimated for the
hollow fiber membrane based on the pore size in the membrane substructure (D ≈ 1 µm) and the

47
thickness of the region of the hollow fiber where the pore size begins to narrow as one
approaches the skin (x ≈ 10 µm) giving α ≈ 0.1. This is in good order of magnitude agreement
with the data in Figure 3.4, which give a ratio of critical flux in the reverse and forward
directions of 0.3 ± 0.1. Note that although Equations (1.5) is in good qualitative agreement with
the data, the actual values of the critical flux were much larger than those found experimentally.
This behavior was discussed previously by Latulippe and Zydney 43.
Figure 3.5: Schematic diagram of plasmid transmission through an asymmetric membrane in the
(A) forward and (B) reverse orientations.
3.3.2 Effects of plasmid and membrane pore size
The effects of the plasmid and membrane pore size on the observed sieving coefficients
are examined in Figure 3.6. Data were obtained with 0.25 μg/ml solutions of the 3.0 and 16.8
kbp plasmids in TE buffer containing 150 mM NaCl using the 500 kDa and 50 kDa hollow fiber

48
membranes, both with flow in the shell-to-lumen (reverse) orientation. The observed sieving
coefficients for the two plasmids through the 50 kDa membrane were very similar over the entire
range of flux. For example, at Jv ≈ 40 μm/s the sieving coefficient of the 3.0 and 16.8 kbp
plasmids were 0.30 and 0.29, respectively, with Jcrit values of 30 ± 3 and 28 ± 1 μm/s. Similar
results were obtained with the 500 kDa membrane, although the data for the 16.8 kbp plasmid
did appear to be shifted slightly to the right (higher flux or lower sieving coefficients). This
small difference may simply be due to the use of different hollow fiber modules for the two
experiments. The effect of plasmid size on the ultrafiltration of the supercoiled plasmid is
discussed further in Chapter 8.
The plasmid sieving coefficients through the 500 kDa membrane are substantially larger
than the values with the 50 kDa membrane, consistent with the very large difference in critical
flux: 1.7 ± 0.2 µm/s for the 500 kDa membrane and 29 ± 3 µm/s for the 50 kDa membrane. If
we assume that the conical pore angle is approximately the same in both hollow fibers, the ratio
of the critical flux values should be proportional to the square of the difference in pore size (as
given by Equation 1.5). For a membrane with uniform cylindrical pores, the effective pore size
can be estimated assuming Poiseuille flow as:
Lp =εrp
2
8δ (3.2)
where δ is the membrane thickness. The ratio of the permeability of the 50 and 500 kDa
membranes was 0.35 ±0.1 (assuming equal porosity and membrane thickness), which is almost
one order of magnitude greater than the ratio of the critical flux values (0.06). This discrepancy
could be due to the effects of a pore size distribution and hydrodynamic interactions between
adjacent pores, as well as the heterogeneity in the DNA molecules.

49
Figure 3.6: Observed sieving coefficients of the supercoiled 3.0 kbp (p-EMP) and 16.8 kbp (p-
FDY) plasmids through the 500 kDa and 50 kDa PS hollow fiber membranes in the
reverse orientation.
3.3.3 Isoform separation
Figure 3.7 shows results for the transmission of the linear and supercoiled isoforms of the
3.0 kbp plasmid in TE buffer containing 150 mM NaCl through the 50 kDa hollow fiber
membrane in both the shell-to-lumen (left panel) and lumen-to-shell (right panel) orientations.
In both cases, transmission of the linear isoform is greater than that of the supercoiled isoform
due to the greater elongational flexibility of the linear plasmid. The difference in transmission
between the two isoforms is much more pronounced when the filtration is performed in the shell-
to-lumen (reverse) orientation. For example, at a filtrate flux of 20 μm/s (72 L/m2/h) the sieving
0
0.2
0.4
0.6
0.8
1
1 10 100
Sie
vin
g C
oe
ffic
ien
t, S
0
Filtrate Flux, Jv (μm/s)
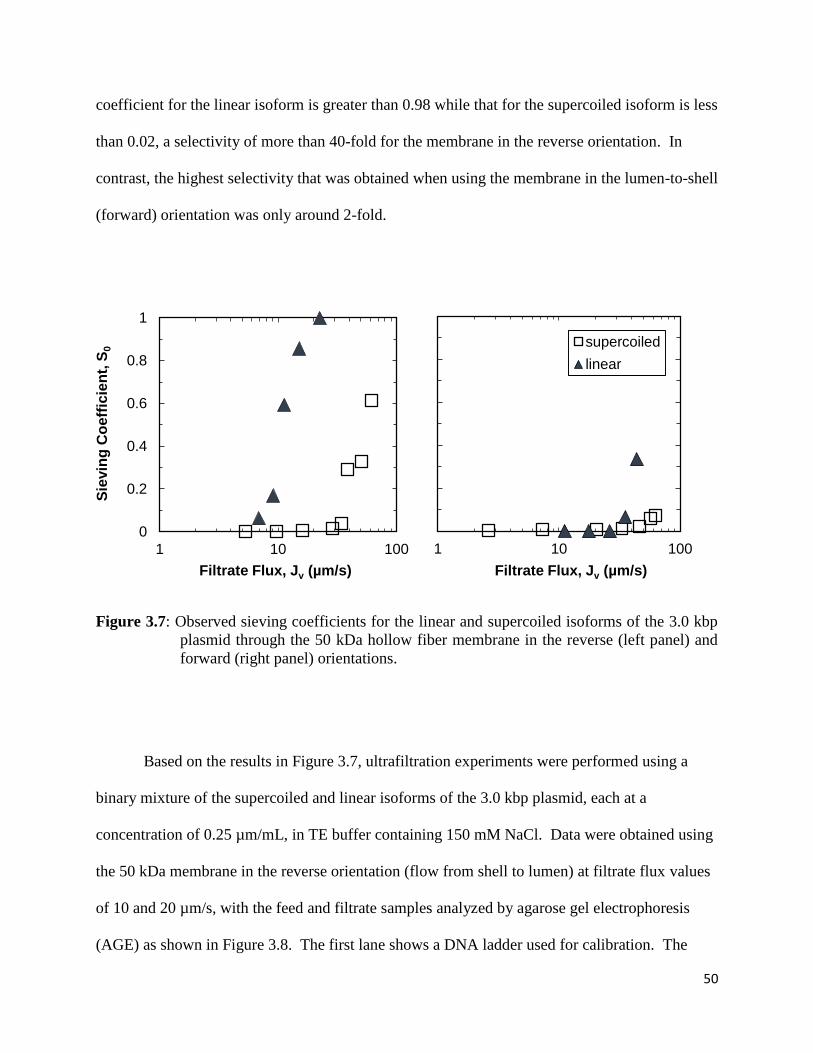
50
coefficient for the linear isoform is greater than 0.98 while that for the supercoiled isoform is less
than 0.02, a selectivity of more than 40-fold for the membrane in the reverse orientation. In
contrast, the highest selectivity that was obtained when using the membrane in the lumen-to-shell
(forward) orientation was only around 2-fold.
Figure 3.7: Observed sieving coefficients for the linear and supercoiled isoforms of the 3.0 kbp
plasmid through the 50 kDa hollow fiber membrane in the reverse (left panel) and
forward (right panel) orientations.
Based on the results in Figure 3.7, ultrafiltration experiments were performed using a
binary mixture of the supercoiled and linear isoforms of the 3.0 kbp plasmid, each at a
concentration of 0.25 µm/mL, in TE buffer containing 150 mM NaCl. Data were obtained using
the 50 kDa membrane in the reverse orientation (flow from shell to lumen) at filtrate flux values
of 10 and 20 µm/s, with the feed and filtrate samples analyzed by agarose gel electrophoresis
(AGE) as shown in Figure 3.8. The first lane shows a DNA ladder used for calibration. The
1 10 100
Filtrate Flux, Jv (µm/s)
supercoiled
linear
0
0.2
0.4
0.6
0.8
1
1 10 100
Sie
vin
g C
oeff
icie
nt,
S0
Filtrate Flux, Jv (µm/s)

51
feed sample is shown in Lane 2; the top and bottom bands correspond to the linear and
supercoiled isoforms, respectively. The filtrate sample, obtained at a flux of 10 μm/s (Lane 3),
did not contain either plasmid (at the sensitivity of the AGE analysis), consistent with the high
degree of plasmid retention seen in Figure 3.7 under these conditions. The filtrate sample
obtained at a flux of 20 μm/s (Lane 4) shows a significant band corresponding to the linear
isoform, with no measurable amount of the supercoiled DNA. Although it is difficult to
quantitatively evaluate the DNA concentrations from the AGE gels, the results in Figure 3.8
clearly demonstrate the potential of using the 50 kDa hollow fiber membrane in the reverse
orientation to obtain highly selective separation between the linear and supercoiled isoforms.
Figure 3.8: Agarose gel electrophoresis image of the feed and filtrate samples during ultrafiltration
of a binary mixture of the linear and supercoiled isoforms of the 3.0 kbp plasmid.
Lane 1 - linear 1 kbp DNA ladder; Lane 2 - feed sample; Lane 3 - filtrate sample at
Jv = 10 μm/s; Lane 4 - filtrate sample at Jv = 20 μm/s.
3.4 Conclusion

52
The experimental data presented in this Chapter clearly demonstrate the potential of using
pre-conditioning to reduce membrane fouling and enhance the separation performance during
ultrafiltration of plasmid DNA through narrow pore size membranes. Pre-conditioning was
accomplished simply by operating the asymmetric membrane in the reverse orientation, i.e., with
the flow directed through the open pores in the substructure before the skin. Pre-stretching of the
plasmid in the more open pores increased the extent of plasmid transmission through the skin
layer of the membrane and it reduced the extent of fouling by decreasing the likelihood of the
plasmid becoming trapped at the pore entrance, similar to results seen in nanofluidic (lab on a
chip) systems for DNA manipulation.
The increase in plasmid transmission was consistent with predictions of a simple scaling
model developed by Daoudi and Brochard 42 to describe the elongation of an idealized polymer
chain through a conical pore. The dependence of the critical flux on the plasmid and pore size
was also consistent with this model. Interestingly, pre-conditioning also caused a significant
increase in the selectivity of the hollow fiber membrane for the separation of the linear and
supercoiled isoforms due to the greater enhancement in transmission of the linear isoform. This
enhanced selectivity provided very high resolution in the separation of these DNA isoforms.
These results clearly demonstrate the potential of enhancing the performance of DNA
ultrafiltration by controlling the pore morphology to properly pre-condition the DNA prior to
transmission through the very narrow pores in the ultrafiltration membranes.

53
Chapter 4
Preconditioning with Multilayer Composite Membranes
The results in Chapter 3 demonstrated that pre-conditioning is a very effective approach
for reducing membrane fouling and enhancing the selectivity for the separation of different
plasmid isoforms. The pre-elongation of DNA molecules can also be accomplished by placing a
large pore size flat sheet microfiltration membrane in series with an ultrafiltration membrane.
This chapter discusses the use of this type of multilayer composite membrane structure,
including the use of membranes with different pore size, for the ultrafiltration of plasmid DNA.
4.1 Introduction
The emergence and rapid development of composite membranes has been a major
milestone in membrane technology since the late 1970s. Primarily developed for reverse
osmosis (RO) and nanofiltration (NF) for water treatment applications, these ‘thin-film
composite’ (TFC) membranes generally contain a thin dense polymer skin formed over a
microporous support 78. Although they are closely related to the Loeb-Sourirajan asymmetric
membrane, the dense skin is formed independently in a separate step. This results in an abrupt
discontinuity between the microporous region and the skin layer. Each layer can have very
different pore size distribution, with isotropic or anisotropic morphology, with appropriate aspect
ratio and thickness. This provides a high degree of flexibility in tailoring the composite
membrane structure / properties for specific application. Figure 4.1 shows a nice comparison of
the isotropic, anisotropic and composite membrane structures.

54
Figure 4.1: Comparison of A) isotropic B) anisotropic and C) composite membrane structure in
sterile filters (reproduced from79)
There are a variety of methods for forming composite membranes, including but not
limited to 80:
I. Interfacial polymerization (IP) of reactive monomers on the surface of the support film
II. Casting an ultrathin layer separately, followed by lamination to the support film
III. Dip coating a polymer solution onto the support and drying; or dip-coating a reactive
monomer/prepolymer solution followed by curing with heat or irradiation
IV. Gas phase deposition of the skin layer from a glow-discharge plasma

55
The different layers of the thin film composite membranes can be independently optimized to
achieve the desired selectivity and permeability while offering excellent mechanical strength and
compression resistance.
As demonstrated in Chapter 3, the performance of an ultrafiltration membrane for DNA
separations can be significantly enhanced by “pre-conditioning” the feed by passing the plasmid
solution through a region with large pore size before allowing the plasmids to approach the
narrow pore region. In Chapter 3, this pre-conditioning was achieved by using a highly
asymmetric ultrafiltration membrane in reverse orientation. However, these ultrafiltration
membranes were not designed for this application; thus, the relative size and thickness of the
different regions may not be ideally suited for DNA ultrafiltration. It is also possible to achieve
the pre-conditioning by using composite membrane structures. This is most easily accomplished
by simply physically layer two different membranes together, each of which can be selected to
have the most appropriate pore size and morphology.
The objective of the work described in this Chapter was to examine the performance of
multilayer composite membranes for DNA ultrafiltration, including evaluation of the key factors
that determine the effectiveness of the pre-conditioning layer. In addition, several physical
models are developed to help understand the effects of pre-conditioning on DNA transmission.
Further confirmation of these models was obtained using membranes with conically shaped
pores. These results provide important insights into the role of preconditioning in enhancing the
performance of DNA ultrafiltration, while providing a framework for the design and
optimization of membranes specifically for plasmid DNA separations.
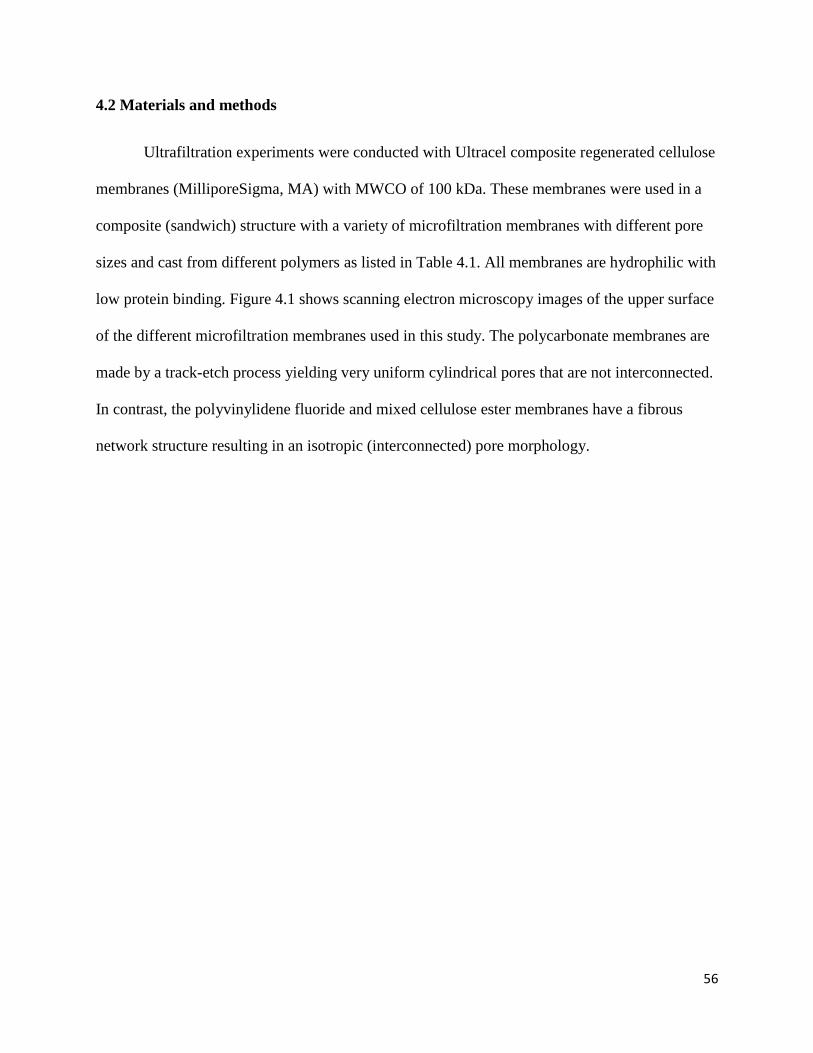
56
4.2 Materials and methods
Ultrafiltration experiments were conducted with Ultracel composite regenerated cellulose
membranes (MilliporeSigma, MA) with MWCO of 100 kDa. These membranes were used in a
composite (sandwich) structure with a variety of microfiltration membranes with different pore
sizes and cast from different polymers as listed in Table 4.1. All membranes are hydrophilic with
low protein binding. Figure 4.1 shows scanning electron microscopy images of the upper surface
of the different microfiltration membranes used in this study. The polycarbonate membranes are
made by a track-etch process yielding very uniform cylindrical pores that are not interconnected.
In contrast, the polyvinylidene fluoride and mixed cellulose ester membranes have a fibrous
network structure resulting in an isotropic (interconnected) pore morphology.
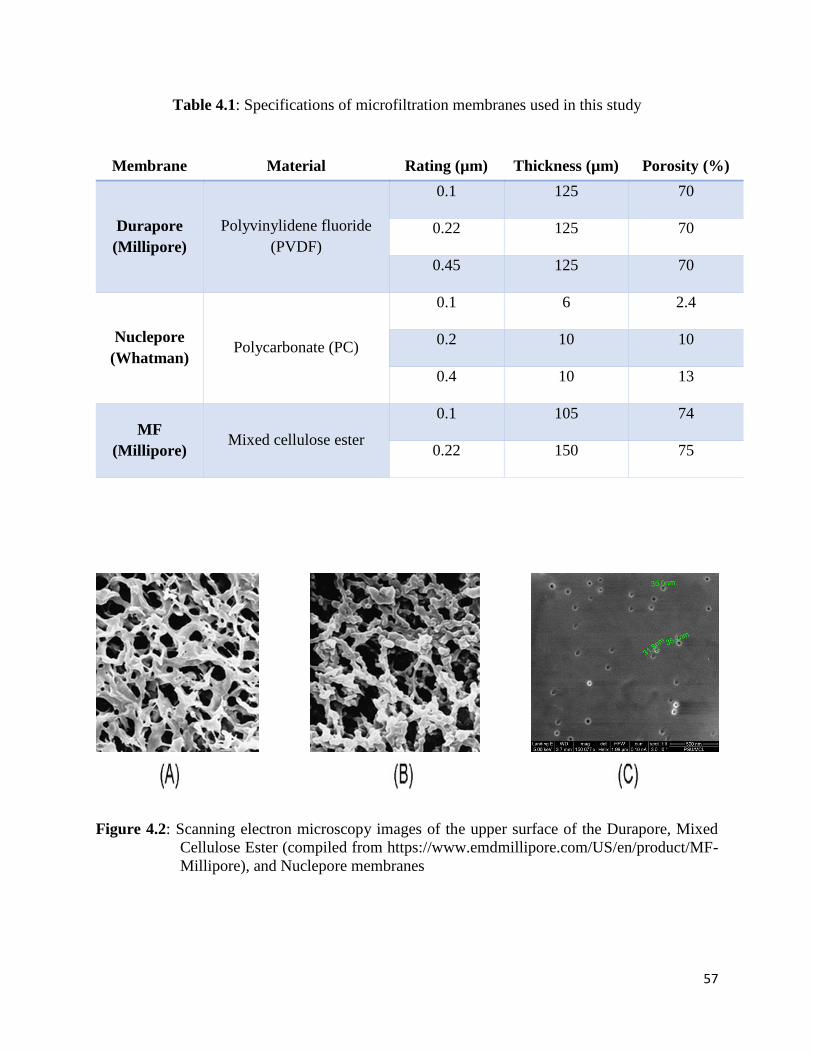
57
Table 4.1: Specifications of microfiltration membranes used in this study
Membrane Material Rating (µm) Thickness (µm) Porosity (%)
Durapore
(Millipore)
Polyvinylidene fluoride
(PVDF)
0.1 125 70
0.22 125 70
0.45 125 70
Nuclepore
(Whatman) Polycarbonate (PC)
0.1 6 2.4
0.2 10 10
0.4 10 13
MF
(Millipore) Mixed cellulose ester
0.1 105 74
0.22 150 75
Figure 4.2: Scanning electron microscopy images of the upper surface of the Durapore, Mixed
Cellulose Ester (compiled from https://www.emdmillipore.com/US/en/product/MF-
Millipore), and Nuclepore membranes

58
Membranes with conical shaped pores were prepared by chemical etching of track-etched
polycarbonate films with pore size of 0.015 µm (Whatman) following the procedures described
in Harrell et al. (2006)81 and Scopece et al. (2006)82. The thickness of the original membrane is 6
µm with a surface pore density of 3 × 10⁸ pores/cm2. Figure 4.3 shows a schematic of the
experimental apparatus. A polycarbonate membrane was placed between two halves of the glass
chamber, and an etching solution (8 M NaOH) was added to one of the half cells. The other half
cell was filled with a stop solution of 1 M KCl and 1 M formic acid. A Pt electrode was placed
into each solution (anode in the etching solution, cathode in the stop solution), and a constant
transmembrane potential difference was applied during etching. A voltage greater than +0.1 V
was used to prevent the etching ion (OH-) from entering the other side of the chamber83. Etching
was performed at room temperature (23°C). The cone angle in the etched membrane can be
controlled by varying the applied transmembrane potential and / or the etching time. After
etching, the membrane was removed from the chamber and immediately immersed in 1 M
formic acid for 1 hr to neutralize any base left in the pores. The membrane was then soaked in DI
water for 1 hr at 40°C, rinsed thoroughly, and stored in air. Field Emission Scanning Electron
Microscopy (FESEM, FEI Nova NanoSEM 630) was used to measure the diameter of the pores
on both sides of the membrane to obtain insights into the conical shape of the pores.

59
Figure 4.3: Schematic of etching apparatus for preparation of polycarbonate membranes with
conical shape pores
4.3 Results and Discussions
4.3.1 Multilayer composite membrane
Initial experiments were performed using composite (or “sandwich”) membranes made
by placing an asymmetric Ultracel 100 kDa ultrafiltration membrane in series with a symmetric
(0.22 µm pore size) Durapore microfiltration membrane. Three sets of experiments were
performed: one with the Ultracel membrane alone in the normal (skin-up) orientation, one with
the Ultracel membrane in the reverse (skin-down) orientation, and one with a Durapore
membrane placed directly on top of the Ultracel membrane (with the Ultracel in the skin-up
orientation). Sieving data were obtained with a 0.25 µg/mL solution of the 3.0 kbp supercoiled
plasmid in TE buffer containing 100 mM NaCl; this low concentration was used to avoid
artifacts associated with membrane fouling. The results are summarized in Table 4.2 at filtrate
flux values of 40 and 60 μm/s (140 and 220 L/m2/h).

60
Plasmid transmission through the Ultracel 100 kDa membrane with the skin-side up was
low (So < 0.15) at both fluxes, consistent with the high value of the critical flux (> 60 µm/s)
determined by Latulippe et al. (2007)37 for this membrane. In contrast, there was significant
transmission of the supercoiled plasmid through the membrane in the skin-side down orientation
(substructure facing the feed), with So = 0.67 at Jv = 60 µm/s. The results with the composite
(sandwich) membrane are similar to those for the Ultracel membrane in the skin-side down
orientation; placing the Durapore membrane on top of the Ultracel membrane caused more than a
3-fold increase in plasmid transmission. This large increase in plasmid transmission is due to the
pre-elongation of the plasmid in the large pores in either the Durapore membrane (for the
composite structure) or the support layer of the Ultracel membrane (when used in the skin-side
down orientation). Note that the Ultracel membrane is itself a composite structure formed by
casting a regenerated cellulose layer on a polyethylene microporous substrate with a pore size
similar to that of the Durapore membrane 47.
Table 4.2: Comparison of observed sieving coefficients of a 3.0 kbp supercoiled plasmid through
an Ultracel 100 kDa membrane with the skin-side up, the skin-side down, and in a
composite structure with a 0.22 µm Durapore membrane
Observed Sieving Coefficient, So
Jv ≈ 40 µm/s Jv ≈ 60 µm/s
Skin Up 0.06 0.13
Skin Down 0.51 0.67
Composite
Membrane 0.20 0.42

61
4.3.2 Effects of upper layer structure
In order to further explore the effect of the upper layer membrane pore size and structure
on the pre-conditioning, a series of experiments were performed using different microfiltration
membranes placed directly on top of an Ultracel 100 kDa ultrafiltration membrane. All
experiments were conducted in TE buffer containing 100 mM NaCl.
Figure 4.4 shows the effects of the pore size of the upper layer membrane on plasmid
transmission through the Ultracel 100 kDa membrane. Experiments were conducted with 0.1,
0.22, and 0.45 µm Durapore membranes as the top layer; these are all homogeneous membranes
with very similar pore morphology. Ultrafiltration experiments performed with a single layer
Ultracel 100 kDa in both the normal (skin up) and flipped (skin down) orientation are also
included for comparison. The sieving coefficients at a filtrate flux of around 20 μm/s were
minimal at all membranes, indicating that the critical flux for plasmid transmission was above
this value for all of the composite membranes examined in Figure 4.4. The greatest plasmid
transmission was obtained using the flipped membrane, with the composite membrane made
used the 0.22 µm Durapore having the greatest sieving coefficients compared to the other
composite membrane structures. The benefits of pre-elongation were slightly reduced using the
0.1 µm pore size Durapore membrane, while DNA transmission through the composite
membrane formed with the 0.45 µm Durapore was nearly indistinguishable from that of the
Ultracel 100 kDa membrane when used in the normal (skin up) orientation.

62
Figure 4.4: Effects of pre-conditioning with different pore size Durapore microfiltration
membranes (upper layers) on transmission of the supercoiled 3.0 kbp plasmid
through the composite membranes. Experiments were performed in TE buffer
containing 100 mM NaCl, with an UltracelTM 100 kDa membrane as the bottom layer.
The data in Figure 4.4 are re-plotted in Figure 4.5 as an explicit function of the pore size
in the upper layer (microfiltration) membrane at several distinct values of the filtrate flux. Where
necessary, the sieving coefficients were determined by linearly interpolating between results
obtained at slightly higher and lower fluxes. Results obtained with a single ‘skin up’ Ultracel 100
kDa membrane were plotted at a pore size in the upper layer equal to 0. It is clear from Figure
4.5 that the effect of pre-conditioning is directly related to the average pore size in the large pore
region. The plasmid transmission was greatest when the pore size in the upper membrane layer
was at an intermediate value, in this case corresponding to the 0.22 µm pore size Durapore
0
0.2
0.4
0.6
0.8
1
0 20 40 60 80 100
Sie
vin
g C
oe
ffic
ien
t, S
0
Filtrate Flux, Jv (µm/s)
No Preconditioning
0.1 μm Durapore
0.22 μm Durapore
0.45 μm Durapore
Flipped Membrane

63
membranes. Preconditioning using an upper layer with a larger pore size had a minimal effect on
DNA transmission, suggesting that the plasmid can only be pre-stretched effectively when the
pore size is sufficiently small that passage of the DNA through the membrane causes enough
force to significantly stretch the DNA. The use of an upper layer with a pore size below 0.2 µm
requires the DNA to elongate almost as much as the ultrafiltration membrane itself, causing a
reduction in the sieving coefficient. The very high transmission seen with the Ultracel membrane
in the reverse (flipped) orientation may be due to the graded pore size in moving from the
substructure towards the thin skin layer. This is discussed in more detail subsequently.
Figure 4.5: Sieving coefficient for the supercoiled 3.0 kbp plasmid through composite membranes
as a function of the pore size of the upper layer Durapore microfiltration membranes
at filtrate flux of 40, 60 and 80 µm/s.
Two additional sets of ultrafiltration experiments were conducted using different pore
size mixed cellulose ester (MF) and Nuclepore polycarbonate membranes as the preconditioning
layer, all in composite membrane structures on top of an Ultracel 100 kDa membrane (Figures
0
0.2
0.4
0.6
0.8
1
0 0.2 0.4 0.6
Sie
vin
g C
oe
ffic
ien
t, S
0
Upper Layer Pore Size (μm)
40 µm/s
60 µm/s
80 µm/s

64
4.6 and 4.7). In both cases, preconditioning resulted in a significant increase in plasmid
transmission. For example, at a fixed filtrate flux of 60 µm/s, preconditioning using 0.1 and 0.22
µm MF membranes increased the sieving coefficient from 0.13 to 0.60 and 0.31, respectively,
corresponding to 4.6- and 2.4-fold increases in plasmid transmission. Similarly, preconditioning
with 0.1, 0.2 and 0.4 µm Nuclepore membranes yielded sieving coefficients of 0.55, 0.66, and
0.36, respectively. Similar to results obtained with the Durapore membranes, the greatest DNA
transmission was obtained with an intermediate pore size for the upper layer, although in this
case the maximum transmission was obtained with a 0.1 µm pore size for the mixed cellulose
ester membranes and a 0.2 µm pore size for the Nuclepore membranes.
Figure 4.6: Effects of pre-conditioning with different pore sizes of mixed cellulose ester (MF)
microfiltration membranes on the transmission of the supercoiled 3.0 kbp plasmid
through the composite membranes.
0
0.2
0.4
0.6
0.8
1
30 50 70 90
Sie
vin
g C
oe
ffic
ien
t, S
0
Filtrate Flux, Jv (μm/s)
0.1 μm MF
0.22 μm MF
No preconditioning
Flipped membrane

65
Figure 4.7: Effects of pre-conditioning with different pore size Nuclepore microfiltration
membranes on transmission of the supercoiled 3.0 kbp plasmid through the
composite membranes.
The Durapore and mixed cellulose ester (MF) membranes have similar pore structures
(SEM images in Figure 4.2), bulk porosity, and thickness (values in Table 4.1). Thus, it is
unclear why these membranes didn’t have the same behavior when used as a preconditioning
layer for the ultrafiltration of plasmid DNA. Note that in addition to the difference in optimal
pore size, preconditioning with the mixed cellulose ester membranes gave significantly greater
DNA transmission than preconditioning using the Durapore membranes. The mixed cellulose
ester and Durapore membranes do have very different surface chemistry, with the cellulose
acetate / cellulose nitrate having similar properties to the composite regenerated cellulose in the
Ultracel membranes. This may have improved the adhesion between the mixed cellulose ester
0
0.2
0.4
0.6
0.8
1
0 20 40 60 80 100
Sie
vin
g C
oe
ffic
ien
t, S
0
Filtrate Flux, Jv (µm/s)
No Preconditioning
0.1 μm Polycarbonate
0.2 μm Polycarbonate
0.4 μm Polycarbonate
Flipped membrane

66
and Ultracel membranes, enhancing DNA transmission. In addition, SEM images of mixed
cellulose ester membranes show a much ‘lacier’ structure with somewhat higher surface porosity
84-85, which could be more effective in pre-elongating the DNA. It is also possible that there are
differences in the interconnectivity 86 and tortuosity of the pore structures in mixed cellulose
ester and Durapore membranes, although the exact impact of these physical parameters on the
elongation of DNA is unclear.
The structure of the Nuclepore polycarbonate track-etched membranes is very different
from that of the Durapore and mixed cellulose ester membranes. The Nuclepore membranes have
straight-through cylindrical pores formed by bombardment of thin polycarbonate sheets with
fission fragments from radioactive decay of high atomic weight isotopes followed by appropriate
chemical etching of the polymer. As a result, the porosity and thickness of this type of membrane
are much smaller than for other microfiltration membranes (Table 4.1). DNA transmission
through composite membranes formed with an upper layer of a Nuclepore membrane was greater
than that with a Durapore membrane having the same effective pore size, which is likely due to
primarily to the much lower porosity (which leads to higher elongational forces at the same
filtrate flux), possibly in combination with the low tortuosity. However, membrane fouling was
found to be greater in composite membranes formed using the Nuclepore membranes, especially
when the upper layer had a small pore size of 0.1 µm. For example, the hydraulic permeability of
the 0.1 µm Nuclepore membrane dropped by more than 40% after filtration of less than 10 µg
(50 mL of the 0.20 µg/mL feed solution) of the supercoiled 3.0 kbp plasmid at a filtrate flux of
80 µm/s. Note that the data in Figure 4.7 were obtained using 0.1 µg/mL DNA solutions at a
filtrate flux below 80 µm/s to minimize the extent of membrane fouling. The high rate of fouling

67
is directly related to the low porosity of these membranes, leading to a rapid rate of pore
blockage during DNA filtration.
An additional series of experiments were performed with the 9.8 kbp supercoiled plasmid
(Figure 4.8). In this case, DNA transmission was largely unaffected by the preconditioning,
irrespective of the pore size of the upper (Durapore) layer. In contrast, pre-conditioning by
operating the Ultracel membrane in the reverse orientation, i.e., with flow through the membrane
substructure before the skin, yielded sieving coefficients that were much larger than those of the
same membrane oriented with the skin-side up. For example, at a filtrate flux of 40 µm/s, the
sieving coefficient with the flipped Ultracel membrane was more than 8 times larger than that
obtained with any of the composite membranes. Experiments performed with the 16.8 kbp
supercoiled plasmid also showed a dramatic increase in DNA transmission using the flipped
Ultracel 100 kDa membrane (data not shown), with the sieving coefficient increasing from 0.05
to 0.48 at filtrate flux of 70 µm/s. These results suggest that preconditioning of the larger size
DNA might require a gradually converging pore structure, similar to what exists in moving from
the substructure to the skin in the highly asymmetric Ultracel membranes (when used in the
reverse orientation).

68
Figure 4.8: Effects of pre-conditioning with different pore size upper (Durapore) membranes on
transmission of the supercoiled 9.8 kbp plasmid through the composite membranes.
A corresponding set of experiments was performed with open-circular DNA isoform in
order to explore the effect of preconditioning on the separation of plasmid isoforms using
composite membranes. 0.1 µm MF membrane and 0.22 µm Durapore membranes were selected
as they provided the most effective pre-elongation of the supercoiled plasmids. The selectivity
between the supercoiled and open-circular plasmid is defined as the ratio of the sieving
coefficients for the two isoforms. The selectivity obtained using composite membranes having a
0.1 µm mixed cellulose ester MF membrane as the upper layer was comparable to that obtained
without any preconditioning, since the MF membrane caused a similar relative increase in
transmission of both the supercoiled and open-circular isoforms (Figure 4.9). In contrast, the
composite membrane made using a 0.22 µm Durapore membrane as the upper layer had a
0
0.2
0.4
0.6
0.8
1
0 20 40 60 80 100 120
Sie
vin
g C
oe
ffic
ien
t, S
0
Filtrate Flux, Jv (μm/s)
No preconditioning
0.1 μm Durapore
0.22 μm Durapore
0.45 μm Durapore
Flipped membrane
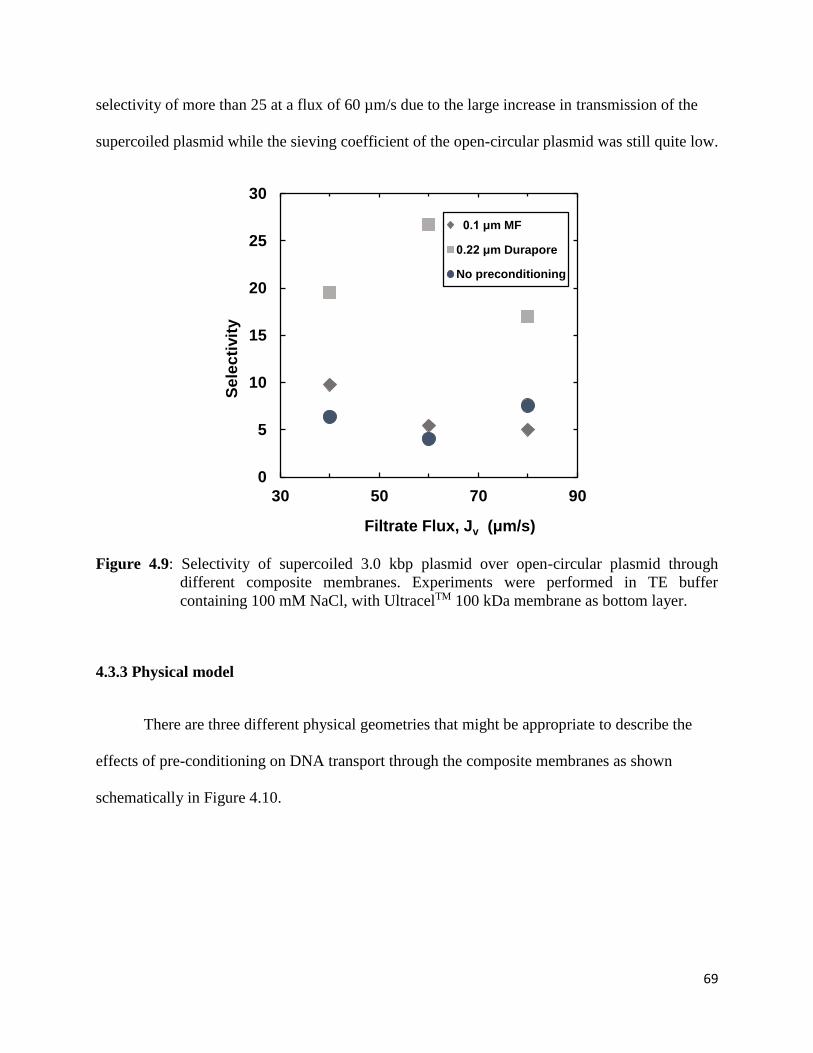
69
selectivity of more than 25 at a flux of 60 µm/s due to the large increase in transmission of the
supercoiled plasmid while the sieving coefficient of the open-circular plasmid was still quite low.
Figure 4.9: Selectivity of supercoiled 3.0 kbp plasmid over open-circular plasmid through
different composite membranes. Experiments were performed in TE buffer
containing 100 mM NaCl, with UltracelTM 100 kDa membrane as bottom layer.
4.3.3 Physical model
There are three different physical geometries that might be appropriate to describe the
effects of pre-conditioning on DNA transport through the composite membranes as shown
schematically in Figure 4.10.
0
5
10
15
20
25
30
30 50 70 90
Se
lec
tivit
y
Filtrate Flux, Jv (μm/s)
0.1 μm MF
0.22 μm Durapore
No preconditioning
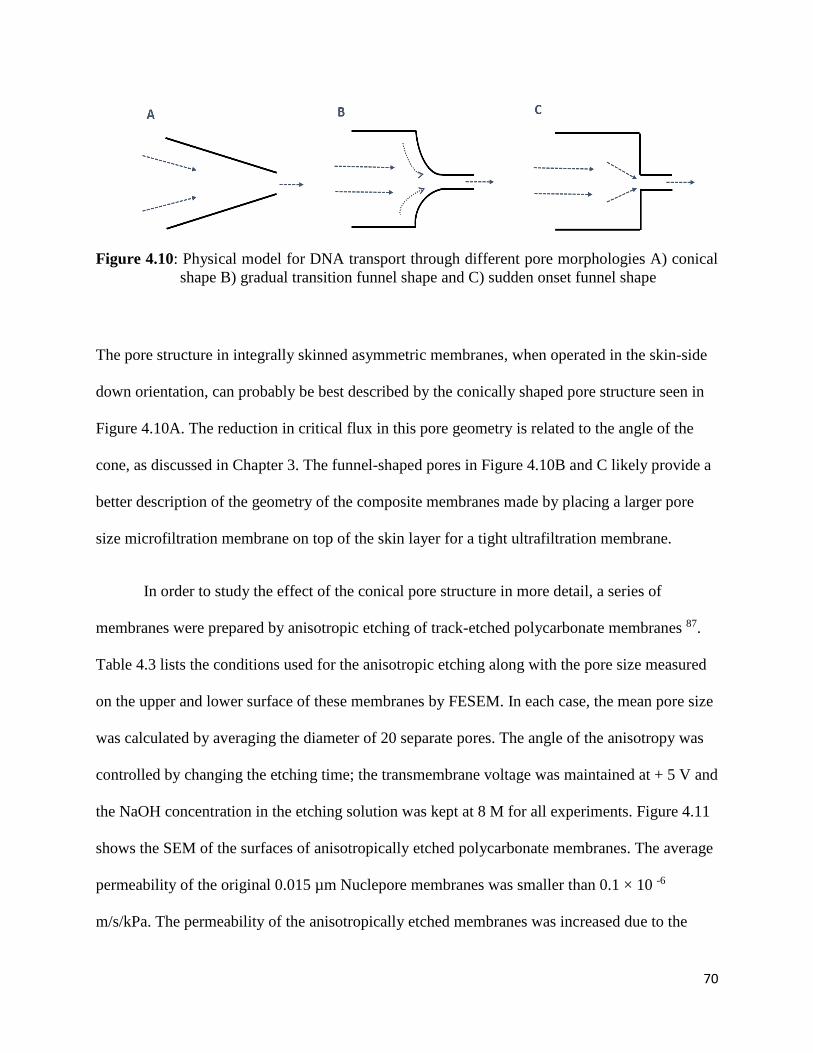
70
Figure 4.10: Physical model for DNA transport through different pore morphologies A) conical
shape B) gradual transition funnel shape and C) sudden onset funnel shape
The pore structure in integrally skinned asymmetric membranes, when operated in the skin-side
down orientation, can probably be best described by the conically shaped pore structure seen in
Figure 4.10A. The reduction in critical flux in this pore geometry is related to the angle of the
cone, as discussed in Chapter 3. The funnel-shaped pores in Figure 4.10B and C likely provide a
better description of the geometry of the composite membranes made by placing a larger pore
size microfiltration membrane on top of the skin layer for a tight ultrafiltration membrane.
In order to study the effect of the conical pore structure in more detail, a series of
membranes were prepared by anisotropic etching of track-etched polycarbonate membranes 87.
Table 4.3 lists the conditions used for the anisotropic etching along with the pore size measured
on the upper and lower surface of these membranes by FESEM. In each case, the mean pore size
was calculated by averaging the diameter of 20 separate pores. The angle of the anisotropy was
controlled by changing the etching time; the transmembrane voltage was maintained at + 5 V and
the NaOH concentration in the etching solution was kept at 8 M for all experiments. Figure 4.11
shows the SEM of the surfaces of anisotropically etched polycarbonate membranes. The average
permeability of the original 0.015 µm Nuclepore membranes was smaller than 0.1 × 10 -6
m/s/kPa. The permeability of the anisotropically etched membranes was increased due to the

71
large increase in pore size on one side of the membrane. Membranes with this particular conical
shaped pores will be used to study effects of pore angle on ultrafiltration of different isoforms of
plasmid DNA.
Table 4.3: Dimensions of membranes with conical shape pores created by anisotropic chemical
etching of 0.015 µm Nuclepore membranes
Etching Time (min) Pore Size (etch side) Pore Size (stop side) Permeability (µm/s/kPa)
20 35 25 0.1±0.05
30 40 27 0.15±0.05
40 130 25 0.8±0.10
Figure 4.11: SEM images of 0.015 µm Nuclepore membranes etched for A) 20 B) 30 and C)
40min. Images show membrane surfaces in the etching solution.

72
Smith et al.88 and Larson et al.70 used florescence microscopy to directly observe the
extension of different size DNA molecules at different shear rates. The stretching of DNA under
shear flow can be quantified in terms of the Weissenberg number (similar to the Deborah
number):
𝑊𝑖 = 𝜀⊥𝜏 (4.1)
where ε⊥ is the strain rate perpendicular to flow and τ is the longest relaxation time of the
polymer. For example, the average strain rate in a Nuclepore membrane with 0.1 µm cylindrical
pores at a filtrate flux of 60 µm/s is 24 ms-1 (velocity gradient of Jv/ε over a 0.05 µm distance
from pore wall to axis). The longest relaxation time of DNA can be estimated based on its
contour length, where τ scales as L3/2 89-90. The relaxation time for a 48.5 kbp λ-phage DNA was
measured as 150 ms. Therefore the relaxation time of a 3.0 kbp plasmid DNA should be
approximately 2.3 ms, giving Wi = 55. The mean fractional extension of a DNA molecule under
these conditions is around 0.3 according to data obtained by Smith et al. 88 in free shear flow.
Note that the highest attainable fractional extension by shear flow was less than 0.4, which is
much less than that obtained in an elongational flow (mean fractional extension above 0.8 at De
≈ 1 which is where the coil-to-stretch transition occurs)91.
Upstream shear interaction can also increase the stretching efficiency by reducing the
conformational complexity of the pre-stretched DNA at the entrance to the narrow pore 70, 92-94.
Although some initial random coil conformations (e.g., the ‘dumbbell’ or coiled conformations)
can be elongated as fast as the fluid at high strain rates (affine stretching), molecules in folded
states (e.g., ‘hairpin’ conformations) strongly resist stretching in extensional flows since they
have two ends tightly pulled behind the middle section. Larson 92 and Smith and Chu 91 showed

73
that pre-shearing DNA can cause rotation and adjustment of molecular configurations reducing
the tendency of molecules to form folds in subsequent elongational flow.
The shape and size of the funnel structure can also have a large effect on the pre-
conditioning. The stretching efficiency is found to depend strongly on the accumulated fluid
strain 93, 95. In a funnel shaped pore, higher aspect ratio funnels are predicted to achieve higher
stretching efficiencies based on a purely elongational flow model. On the other hand, pre-
shearing would be more significant in a funnel with a smaller opening. Thus, there should exist
an optimal size to maximize the pre-conditioning efficiency, consistent with our experimental
results.
Larson et al.70 studied DNA stretching under different strain rate profiles and proved
experimentally that the shape of the funnel is critical for efficient DNA stretching. The gradual
transition funnel shape shown in Figure 4.10B produces increasing strain rate towards the
entrance to the narrow pore, yielding a highly extended conformation. In comparison, the sudden
onset shape funnel shown in Figure 4.10C caused many of the DNA molecules to be under-
stretched. In particular, it remains questionable whether bursts of elongational flow could stretch
DNA efficiently in the presence of extra shear interactions. Studies have shown that shear-
induced polymer tumbling in the tapered funnel region would diminish stretching efficiency96-97.
Note that the sizes of the 9.8 and 16.8 kbp supercoiled plasmid were measured to be 120 and 170
nm from static light scattering75, close to the mean pore size (0.1 and 0.2 µm) of the upper
microfiltration membranes. Hence these DNA molecules would effectively span the narrow pore
space, experiencing rotational flow in opposing directions simultaneously. The conflicting
influences of opposed rotational flows likely frustrated effective pre-conditioning in the upper
layer of these composite membranes.

74
4.4 Conclusions and recommendations
The data presented in this Chapter demonstrate that pre-conditioning using composite
membranes can enhance the transmission of supercoiled DNA through narrow pore UF
membranes. Data were obtained using a series of composite membranes generated by placing a
larger pore size microfiltration membrane on top of the skin layer of an ultrafiltration membrane.
The increase in plasmid transmission was found to be greatest when using an intermediate pore
size for the upper layer of the composite membranes. The pore size that provided the greatest
transmission through the Ultracel 100 kDa membrane was between 0.1 and 0.2 µm. Membranes
with larger pores provided insufficient pre-elongation, while membranes with smaller pores
required that the plasmids elongate significantly even to enter the upper layer of the membrane.
The greatest increase in transmission was seen when the asymmetric ultrafiltration membrane
was used in the reverse orientation, likely due to the gradual reduction in the pore size as one
moves from the membrane substructure to the tight skin.
Limited experiments performed with the open-circular plasmid suggest that pre-
conditioning using these composite membranes can also significantly increase the selectivity for
the separation between open-circular and supercoiled isoforms. In this case, pre-conditioning
caused a large increase in transmission of the supercoiled isoform while having little effect on
the transmission of the open-circular isoform. The net result was an increase in selectivity from
around 5-fold for the Ultracel 100 kDa membrane alone to more than 25-fold for a composite
membrane formed with a 0.22 µm Durapore membrane as the upper layer.
75
The pre-conditioning in composite membranes was found to be closely related to the pre-
shearing and pre-stretching of DNA molecules before approaching the tapered region. Conical
shape membranes made with anisotropic chemical etching of polycarbonate films containing
straight through cylindrical pores provide an idealized physical model to study the effects of pore
morphology on DNA transport through nanopores. Results presented in this study have
important implications on fabricating composite membranes with desirable pore size and
structures to provide optimal performance for specific needs.
Future studies can be done to further explore the transmission of plasmid DNA through
different shapes of nanopores. Synthesized polycarbonate membranes having conical shaped
pores with different cone angles and pore diameters can be made by controlling the chemical
etching conditions, including the NaOH concentration, etching time, solvent composition, and
transmembrane voltage82, 98. Etching without any applied voltage yields almost cylindrical pores
with a relatively short conical segment at one end 81 (sudden onset model). Ultrafiltration data
obtained with different isoforms and sizes of plasmid DNA can be compared with predictions of
the different physical models developed for flow-induced DNA elongation. Ultrafiltration
experiments could also be performed with more concentrated DNA solutions for longer filtration
times using these composite and conical-shaped membranes to examine the effects of pre-
conditioning on membrane fouling. Knowledge obtained from these studies would be of direct
interest in the design and manufacture of composite membranes with desirable pore size and
shape for separation and purification of plasmid DNA.
76
Chapter 5
Enhanced Plasmid DNA Purification by Exploiting Ionic Strength Effects
The solution structure of plasmid DNA is known to be a strong function of solution
conditions due to intramolecular electrostatic interactions between the charged phosphate groups
along the DNA backbone. The objective of the work described in this Chapter was to determine
whether it was possible to enhance the separation of different plasmid isoforms by proper
selection of the solution ionic strength and ion type during ultrafiltration. Experiments were
performed with three different plasmid isoforms in solutions containing different NaCl or MgCl2
concentrations. The majority of the work presented in this Chapter was previously published in
Biotechnology and Bioengineering (Li et al., 113, 783-789, 2015).
5.1 Introduction
It is well established that the conformation and flexibility of DNA are both functions of
the solution environment due to the strong intramolecular electrostatic interactions between the
charged phosphate groups along the DNA backbone. For example, Borochov et al. 99 reported a
25% reduction in the radius of gyration (Rg) of a linear 6.6 kilo base pair (kbp) DNA molecule
(from 245 to 195 nm) as the sodium chloride concentration was increased from 5 to 100 mM.
This change in NaCl concentration also caused a decrease in the DNA persistence length from 91
to 55 nm. Cherny and Jovin100 observed a gradual transition in the conformation of a 2.96 kbp
supercoiled plasmid from a loose to tightly inter-wound structure as the concentration of NaCl
was increased. Rybenkov et al.101 evaluated the effects of ionic conditions on the effective

77
diameter of the supercoiled helix, with results showing a 3-fold reduction (from approximately
15 to 5 nm) as the Na+ concentration increased from 1 to 100 mM. Kong et al.102 showed that the
transmission of various plasmids through 0.2 µm microfiltration membranes was significantly
improved with the addition of 150 mM NaCl to the formulation buffer, which the authors
attributed to the reduction in repulsive interactions between the charged membrane and the
charged DNA.
There is, however, relatively little data on the effects of solution conditions on the
transmission of plasmid DNA through the small pores in ultrafiltration membranes. DNA
transmission during ultrafiltration occurs by elongation of the DNA in the converging flow field
approaching the membrane pores37. The transmission of the supercoiled plasmid increased with
increasing solution ionic strength (at a given filtrate flux), which was attributed to the reduction
in effective plasmid size due to shielding of the intramolecular electrostatic interactions44.
However, the potential impact of solution ionic strength on the ultrafiltration of the linear and
open-circular plasmids has yet to be determined.
The objective of the work described in this Chapter was to obtain quantitative data for the
effects of salt concentration and ion valence on the transmission of the linear, open-circular, and
super-coiled isoforms of a 3.0 kbp plasmid through small pore size ultrafiltration membranes.
These results were used to identify ionic conditions that significantly enhance the selectivity of
ultrafiltration processes for purification of the therapeutically active supercoiled isoform that is
of interest in both gene therapy applications and for production of DNA-based vaccines.

78
5.2 Materials and Methods
Filtration experiments were conducted using Ultracel™ membranes and the 3.0 kbp
plasmid in the supercoiled, linear, and open-circular conformations. Plasmid solutions with a
final concentration of 0.25 µg/ml were prepared by diluting the stock solution with TE buffer
(solution pH = 7.7 ± 0.1).
The ionic strength of the buffer solution was adjusted by adding appropriate amounts of
sodium chloride (NaCl) or magnesium chloride hexahydrate (MgCl2・6H2O). Plasmid
concentrations were determined using the PicoGreen assay as described in Chapter 2.3. The
PicoGreen® fluorescence intensity signal is mildly sensitive to the salt concentration in the
buffer solution 49. Standard calibration curves were thus prepared over a range of salt
concentrations, with the concentrations evaluated by appropriate interpolation. The results were
used to evaluate the effects of solution conditions on the observed sieving coefficients.
Ultrafiltration using a mixture of two different plasmid isoforms were also performed, with
results analyzed using a combination of the Picogreen assay and AGE as described Chapter 2.3.
5.3 Results and Discussion
5.3.1 Linear plasmid
Figure 5.1 shows typical results for transmission of a 0.25 µg/L solution of the linear 3.0
kbp plasmid through the 100 kDa UltracelTM membrane as a function of filtrate flux. Data were
obtained from four separate experiments, each using TE buffer but with different amounts of
added NaCl. In each case, data were obtained with increasing values of the filtrate flux, with the
value re-checked at low flux to insure that there was no hysteresis. Selected filtrate and feed

79
samples were analyzed by agarose gel electrophoresis to confirm the integrity of the plasmid;
there was no evidence of plasmid degradation or aggregation in any of the salt solutions at either
low or high filtrate flux. There was also no measurable fouling of the membrane. The filtrate flux
remained stable at each applied pressure and the hydraulic permeability of the membrane after
the ultrafiltration experiment (evaluated from data for the filtrate flux as a function of the
transmembrane pressure) was within 10% of that for the clean membrane. The absence of any
fouling is consistent with previous results obtained with similarly dilute plasmid solutions 103.
Figure 5.1: Effect of NaCl concentration on the observed sieving coefficients for ultrafiltration of
the linear 3.0 kbp plasmid through the UltracelTM 100 kDa membrane
At any given value of the filtrate flux, the plasmid sieving coefficient increased with
increasing solution ionic strength. The greatest effect of ionic strength was seen at intermediate
values of the filtrate flux. For example, the sieving coefficient at a filtrate flux of 43 μm/s varied

80
from So = 0.29 in the solution with 1 mM NaCl to So = 0.63 in the 300 mM NaCl solution.
Plasmid transmission in the solutions containing 10 and 150 mM NaCl solution were very
similar for all values of the filtrate flux; the sieving coefficient at a flux of 12 µm/s was So = 0.05
at both ionic strengths while So = 0.69 and 0.73 at a flux of 80 µm/s in the 10 and 150 mM NaCl
solutions, respectively.
Figure 5.2 shows results from a similar set of experiments but with solutions containing
either 10 or 40 mM MgCl2 added to the TE buffer. The data at the two MgCl2 concentrations
were essentially identical over the entire range of filtrate flux with So values differing by less
than 0.05. Results are also shown for the 150 mM NaCl solution (taken from Figure 1) for
comparison. The transmission of the linear plasmid was very similar for all three ionic
conditions. Note that the ionic strength (I) of the 10 and 40 mM MgCl2 solution, calculated as:
I = 1
2 (∑ 𝑐𝑖𝑧𝑖
2𝑖 ) (5.1)
where ci and zi are the concentration and valence of each ionic species, are approximately 43 and
130 mM (using the pKa = 8.1 for Tris at 25 °C), whereas the ionic strength of the solution
containing 150 mM NaCl is 160 mM (accounting for the contribution from the TE buffer). The
data in Figure 5.2 are thus consistent with the results from Figure 5.1, with transmission of the
3.0 kbp linear plasmid nearly independent of solution ionic strength between I = 20 and 160 mM.

81
Figure 5.2: Effect of ion valence and concentration on the observed sieving coefficient for
ultrafiltration of the linear 3.0 kbp plasmid through the UltracelTM 100 kDa
membrane
5.3.2 Open-circular plasmid
Figure 5.3 shows data for the transmission of the open-circular isoform of the 3.0 kbp
plasmid through the Ultracel 100 kDa membrane in TE buffer containing either 10, 150, or 300
mM NaCl. The open-circular plasmid was highly retained over the entire range of filtrate flux,
with So < 0.2 even at the highest salt concentration and flux (140 µm/s) and So < 0.01 at a filtrate
flux of 40 µm/s in the solutions containing 10 and 150 mM NaCl. The high retention of the open-
circular isoform is consistent with previous results 45 and reflects the difficulty in fully
elongating the open-circular plasmid.

82
Figure 5.3: Transmission of the open circular isoform of the 3.0 kbp plasmid through the
UltracelTM 100 kDa membrane in the presence of 10, 150, or 300 mM NaCl
The results from Figure 5.3 have been re-plotted in Figure 5.4 as an explicit function of
the solution ionic strength along with data obtained in two separate experiments performed in the
presence of 10 and 40 mM MgCl2. The data in the NaCl and MgCl2 were reasonably consistent
when plotted as a function of the ionic strength, with the transmission of the open-circular
isoform increasing slightly with increasing ionic strength. However, the open-circular isoform
was highly retained over the full range of experimental conditions.

83
Figure 5.4: Effect of solution ionic strength on transmission of the open circular 3.0 kbp plasmid
through the UltracelTM 100 kDa membrane at a filtrate flux of 140 ± 5 μm/s.
5.3.3 Isoform separation
Figure 5.5 summarizes the effects of solution ionic strength on the transmission of the
different plasmid isoforms at a filtrate flux of 140 μm/s (500 L/m2/h); qualitatively similar
behavior was seen at other values of the flux but with lower transmission at lower flux. The data
in Figure 5.5 were all obtained with NaCl solutions, although similar results were seen with
MgCl2. The observed sieving coefficients of the linear 3.0 kbp plasmid were almost independent
of ionic strength, with values ranging from So = 0.82 to 0.93 for ionic strength between 10 and
300 mM. In contrast, transmission of the supercoiled plasmid increased significantly with
increasing solution ionic strength, similar to data reported previously by Latulippe and Zydney
(2008)44, going from So = 0.09 in the 10 mM ionic strength solution to more than 0.71 in the 300
mM solution. The open-circular plasmid also showed a slight increase in transmission with

84
increasing ionic strength (data from Figure 5.4), but this isoform was strongly retained under all
conditions.
Figure 5.5: Effect of solution ionic strength on transmission of the linear, open-circular, and
supercoiled 3.0 kbp plasmid through the UltracelTM 100 kDa membrane at a filtrate
flux of 140 µm/s.
Figure 5.6 shows results for the selectivity between the linear and supercoiled isoforms
(top panel) and between the supercoiled and open-circular isoforms (bottom panel) using the
UltracelTM 100 kDa membrane at both low and high NaCl concentrations. The error bars were
determined from standard propagation of error analysis based on Equation (2.2).
(2.2) y =S1
S2

85
The selectivity between the linear and supercoiled isoforms decreased with increasing filtrate
flux due to the large increase in transmission of the supercoiled isoform. The selectivity was
greatest at low ionic strength due to the large increase in retention of the supercoiled plasmid; the
transmission of the linear isoform was nearly independent of the salt concentration. The
selectivity in the 10 mM NaCl solution was nearly 30 at a filtrate flux around 40 μm/s (140
L/m2/h), with even higher selectivity possible at lower salt concentrations and / or lower filtrate
flux. The maximum selectivity in the 10 mM NaCl solution was more than 3 times higher than
the optimal selectivity achieved in 150 mM NaCl solution. In contrast, the selectivity between
the supercoiled and open-circular plasmids (lower panel) was greatest at high ionic strength due
to the increased transmission of the supercoiled plasmid under these conditions. The selectivity
attains its maximum value at an intermediate filtrate flux (around 80 µm/s) due to the increase in
transmission of both isoforms at very high filtrate flux.

86
Figure 5.6: Selectivity between the linear and supercoiled isoforms (top panel) and between the
supercoiled and open-circular isoforms (bottom panel) of the 3.0 kbp plasmid using
the Ultracel™100 kDa membrane

87
Based on the results in Figure 5.6, an ultrafiltration experiment was performed using a
binary mixture of the supercoiled and linear isoforms of the 3.0 kbp plasmid, each at a
concentration of 0.5 μg/mL, in a TE buffer containing 10 mM NaCl. Data were obtained using an
UltracelTM 100 kDa membrane at a filtrate flux of 80 µm/s (280 L/m2/h). Feed and filtrate
samples were analyzed using agarose gel electrophoresis, with the resulting gel shown in Figure
5.7. The first lane shows a 1 kbp DNA ladder for calibration. The feed sample (Lane 3) has equal
concentrations (corresponding to essentially equal brightness) of the linear and supercoiled
plasmids, with the lower band corresponding to the supercoiled isoform which migrates further
through the gel 104. The filtrate samples (Lanes 2 and 4) clearly show a band corresponding to the
linear isoform, with no measureable amount of the supercoiled plasmid. This behavior is
completely consistent with the high selectivity between the linear and supercoiled isoforms seen
in Figure 5.6 under these conditions. Note that a somewhat higher selectivity could have been
obtained at an even lower filtrate flux (40 µm/s), but the resulting filtrate solution was very dilute
making it harder to see the bands for the linear isoform on the gel.

88
Figure 5.7: Agarose gel electrophoresis showing the separation of a binary mixture of the linear
and supercoiled isoforms in TE buffer containing 10 mM NaCl. Lane 1: linear 1 kbp
DNA ladder. Lane 3: feed sample. Lanes 2 and 4: filtrate samples collected using the
Ultracel 100 kDa membrane at a filtrate flux of 80 μm/s.
Similar experiments were performed with a binary mixture of the supercoiled and open-
circular plasmids in a TE buffer containing 150 mM NaCl at a filtrate flux of 125 µm/s. In this
case, the filtrate samples (Lanes 2 and 3) show a significant band corresponding to the
supercoiled isoform, with no measurable band corresponding to the open-circular DNA (which
lies above that for both the supercoiled and linear plasmids). The high resolution of the
separation was a direct result of the high transmission of the supercoiled isoform in the 150 mM
NaCl solution at high filtrate flux, with the open-circular isoform remaining highly retained
under these conditions.

89
Figure 5.8: Agarose gel electrophoresis showing the separation of a binary mixture of the open-
circular and supercoiled isoforms in TE buffer containing 150 mM NaCl. Lane 4:
linear 1 kbp DNA ladder. Lane 1: feed sample. Lanes 2: filtrate samples collected at
filtrate flux of 100 μm/s. Lanes 3: filtrate samples collected at filtrate flux of 125
μm/s.
5.3.4 Physical Interpretation
Although all three plasmid isoforms showed at least some increase in transmission with
increasing solution ionic strength due to electrostatic shielding effects, the ultrafiltration behavior
of the individual isoforms was very different: the sieving coefficient of the linear plasmid was a
very weak function of the salt concentration while the sieving coefficient of the supercoiled
isoform increased significantly with increasing ionic strength. In contrast, the effect of solution
ionic strength on the radius of gyration (Rg) is very similar for the different plasmid isoforms.
For example, Hammermann et al. 105 observed a 20% reduction in the radius of gyration of a
supercoiled 1.87 kbp plasmid (from Rg = 58 to 47 nm) when the NaCl concentration was
increased from 10 to 100 mM, while Borochov et al. 99 reported approximately the same percent
reduction in Rg of a linear 6.6 kbp plasmid (from Rg = 245 to 186 nm) as the NaCl concentration

90
increased from 5 to 200 mM. In addition, the persistence length of DNA, which provides a
measure of the DNA flexibility, is relatively independent of salt concentration at solution ionic
strength above about 10 mM106. Thus, the large difference in ultrafiltration behavior of the
supercoiled and linear isoforms is probably not due to differences in either the effective size or
persistence length.
Instead, the strong dependence of the transmission of the supercoiled plasmid on the
solution ionic strength is most likely due to changes in the supercoiled structure at different salt
concentrations. Atomic force microscopy (AFM) and scanning electron microscopy (SEM) have
been used to evaluate the plectonemic structure of supercoiled plasmids in different ionic
environments. Images show a significantly tighter supercoiling at high NaCl concentrations107.
Cherny and Jovin100 showed that the number of nodes (distinct crossings of double helical
segments) of a 2.96 kbp plasmid decreased from nearly 15 to approximately 2 as the NaCl
concentration was reduced from 50 to 1 mM. The supercoiled isoform displayed an open ring
structure at very low salt concentrations similar to that of the open-circular plasmid 100. These
changes in structure also led to a reduction in the superhelix diameter with increasing salt
concentration 108-111, where the superhelix diameter is defined as the average distance between
opposing DNA strands in the interwound regions. For example, Rybenkov et al. 108 reported
values of the superhelix diameter ranging from 15 nm in a 10 mM NaCl solution to 3 nm in 1 M
NaCl, with the latter approaching the geometrical diameter of the double helix. The net result is
that the ultrafiltration behavior of the supercoiled isoform is very similar to that of the open-
circular plasmid at low ionic strength but becomes more similar to that of the linear plasmid at
high ionic strength, consistent with the experimental data for the sieving coefficient in Figure
5.5.

91
5.4 Conclusions
Although the effects of ionic environment on DNA conformation are well known, the
experimental data presented in this Chapter provide the first demonstration that it is possible to
enhance the performance of membrane systems for plasmid DNA separations by proper selection
of the ionic conditions. The transmission of the linear isoform was nearly independent of
solution ionic strength whereas the transmission of the supercoiled plasmid increased
significantly with increasing salt concentration. The large effect of solution conditions on the
transmission of the supercoiled plasmid was likely due to a change in conformation from a loose
to tightly inter-wound structure with increasing ionic strength associated with the shielding of the
intramolecular electrostatic interactions.
The changes in isoform transmission caused a significant enhancement of the selectivity
between the linear and supercoiled plasmid isoforms at low ionic strength due to the increased
retention of the supercoiled isoform under these conditions. In contrast, the selectivity between
the supercoiled and open-circular plasmid isoforms was greatest at high ionic strength since the
open-circular isoform was highly retained under all conditions. These results show that it should
be possible to perform a staged diafiltration process for purification of the desired supercoiled
isoform: the linear plasmid would initially be removed in the permeate by a diafiltration process
performed at low ionic strength and low filtrate flux with the supercoiled plasmid then recovered
in the permeate by a second diafiltration at high ionic strength and relatively high filtrate flux.
The ability to control the plasmid transmission by proper selection of the filtrate flux and ionic
conditions could thus provide a new strategy for the high resolution separation of plasmid
isoforms using small pore size ultrafiltration membranes.

92
Chapter 6
Effects of Multivalent Salts on Plasmid DNA Ultrafiltration
It has been well established that the structure of plasmid DNA is a strong function of
solution ionic conditions due to changes in intramolecular electrostatic interactions between the
charged phosphate groups along the DNA backbone. Multivalent cations like spermine play a
critical role in compacting and controlling the structure of supercoiled DNA in living cells. The
objective of the work described in this Chapter was to investigate the effects of the polyamine
spermine on the ultrafiltration of plasmid DNA and to explore the opportunity of using these
polycations to enhance the purification of specific plasmid isoforms. Much of the experimental
data presented in this Chapter were obtained by Rachel Bolten as part of her senior Honors thesis
in Chemical Engineering.
6.1 Introduction
Polyamines are organic compounds having two or more amino groups (NH2). Spermidine
(which contains 3 amine groups) and spermine (which contains 4 amine groups) are two
naturally occurring polyamines (Figure 6.1), both of which are synthesized in living cells via
highly regulated pathways and are critical in regulating a variety of cellular activities112. In
particular, the presence of physiological level polyamines (submillimolar or millimolar) has been
shown to inhibit topoisomerase catalyzed relaxation of negative supercoils in DNA113. Several
studies have suggested that DNA supercoiling, and in turn its biological activity, are controlled
by systematic regulation of the concentrations of these polyamines114.

93
Figure 6.1: Chemical structure of spermidine and spermine. The basic amino (NH2) groups bind
protons at physiological pH to become positively charged.
Polyamines can directly interact with DNA molecules in two ways. First, the positively
charged amine groups can interact electrostatically with the negatively charged phosphates along
the DNA backbone, similar to the interactions that occur with mono- and di-valent cations115.
Cation binding is generally found to stabilize the right handed, B-form double helix structure of
DNA116 and protect the DNA from damage due to radiation or oxidation117. Second, polyamines
can bind in the major and minor grooves of DNA, forming hydrogen bonds with bases from the
opposing strands of the DNA double helix as revealed by recent crystal structures and infrared
spectra of polyamine-DNA complexes118-120. This reduces denaturation of DNA and favors
formation of writhes instead of unwinding of DNA. Shao et al.121 used single molecule
experiments to demonstrate that the presence of spermine or spermidine produced more compact
plectonemes in DNA in the presence of high concentrations of monovalent salts. Theoretical
models confirmed that binding of polyamines reduced the radius and increased the density of
DNA supercoils.
Sato et al. 114 studied the conformational transition of a 12.5 kbp supercoiled plasmid
DNA induced by spermine using fluorescence microscopy. The hydrodynamic radius of the
plasmid decreased from more than 250 nm to less than 150 nm as the spermine concentration

94
was increased from 0 to 10 µM; these concentrations are far too low to cause any significant
increase in electrostatic shielding due to the increase in solution ionic strength. Murphy et al.122
showed that the equilibrium adsorption capacity of a Q-Sepharose anion-exchange resin for a 5.9
kbp supercoiled plasmid DNA at 600 mM NaCl was enhanced by up to 40% in the presence of
2.5 mM spermine. This was primarily due to compaction of the plasmid by spermine, which
allowed the large plasmid to access the surface of small pores within the adsorbents.
Multivalent salts can also induce DNA condensation by neutralizing the high negative
charge of the DNA, thereby reducing inter-helix electrostatic repulsion. Wilson and
Bloomfield123 used the counter-ion condensation theory developed by Manning124 to calculate
that DNA condensation occurs when approximately 90% of the DNA charge is neutralized.
Inter-molecular bridging between DNA helices also helps to promote condensation at low ionic
strength125. DNA condensation primarily occurs via intramolecular interactions at low DNA
concentrations (below 5 µg/mL), with the resulting condensates having a compact spherical or
toroidal shape as observed by both electron and atomic force microscopy126-127. The
hydrodynamic radius of DNA condensates resulting from collapse of λ-phage DNA by spermine
is 41±5 nm as determined by dynamic light scattering128.
Although polyamines are known to have a significant effect on DNA structure, there is
currently no information on the possible role of these multivalent cations on plasmid
ultrafiltration. The objective of the work described in this Chapter is to evaluate the effects of
spermine on plasmid DNA transmission through UF membranes and to explore the opportunity
for enhancing the separation between different plasmid isoforms by proper addition of spermine.
Data were obtained using Biomax 300 kDa membranes with different concentrations of
spermine, both with and without other monovalent salts. The results clearly demonstrate that

95
spermine has a dramatic effect on plasmid ultrafiltration, even at micromolar concentrations,
leading to a large decrease in DNA transmission.
6.2 Materials and methods
Ultrafiltration experiments were performed with 9.8 kbp plasmids in the supercoiled,
open circular, and linear isoforms. Limited experiments were also performed with the 16.8 kbp
supercoiled plasmid. Plasmid DNA solutions were prepared in TE buffer with NaCl
concentrations ranging from 1 to 100 mM. Spermine (MW= 202.34, ≥97%) was obtained from
SigmaAldrich (MO) and stored at -20°C prior to use. TE buffer containing 10 mM spermine and
appropriate NaCl concentrations was prepared and then slowly added to the DNA solution. The
DNA and spermine were allowed to interact for 30 min before use in the ultrafiltration
experiment.
Sieving experiments were performed with Biomax 300 kDa ultrafiltration membranes.
Data were obtained using the standard constant-pressure ultrafiltration procedures described in
Section 2.6.1. In addition, a limited number of constant flux experiments were performed by
connecting a peristaltic pump to the permeate exit line. The entire system was flushed with 10
mL buffer between sieving experiments performed with different salt or spermine
concentrations.
6.3 Results and Discussions
6.3.1 Supercoiled isoform

96
Figure 6.2 shows data for transmission of the supercoiled 9.8 kbp plasmid through the
Biomax 300 kDa membrane in TE buffer containing 10 mM NaCl and various concentrations of
spermine. DNA transmission was largely unaffected by the spermine concentration for spermine
concentrations ranging from 0 to 10 µM. For example, the DNA sieving coefficients at a filtrate
flux of 75 µm/s were So ≈ 0.84 in both the 0 and 2 µM spermine solutions, while the sieving
coefficient for DNA in the 10 µM spermine was 0.74. Results obtained with a different lot of
Biomax 300 kDa membranes yielded very different results, with the addition of 2 or 10 µM
spermine causing a significant increase in DNA transmission (from So = 0.12 in the absence of
spermine to So = 0.93 in the 10 µM solution). At least 3 membranes were tested from each lot,
with the results for the membranes within a given lot being highly consistent. It is unclear what
caused this discrepancy; further study is required to determine the cause of the very different
behavior for these lots of the Biomax membranes.
In contrast to the data at low spermine concentrations, DNA transmission at spermine
concentrations of 15 and 30 µM was negligible over the entire range of filtrate flux, suggesting
the presence of a threshold spermine concentration above which the plasmid is unable to
elongate and pass through the pores of the membrane. Vijayanathan et al. 128 also observed a
critical spermine concentration of 10 µM for DNA condensation in a 10 mM sodium cacodylate
buffer. DNA condensates have been shown to have a toroidal shape with hydrodynamic radius
around 41 nm for 48.5 kbp plasmids 128-129. These large condensates would be completely
retained by the small pores in the Biomax 300 kDa membrane (11.2 nm from Table 2.4), since
the converging flow into the membrane pores is likely to be unable to elongate the condensed
DNA.
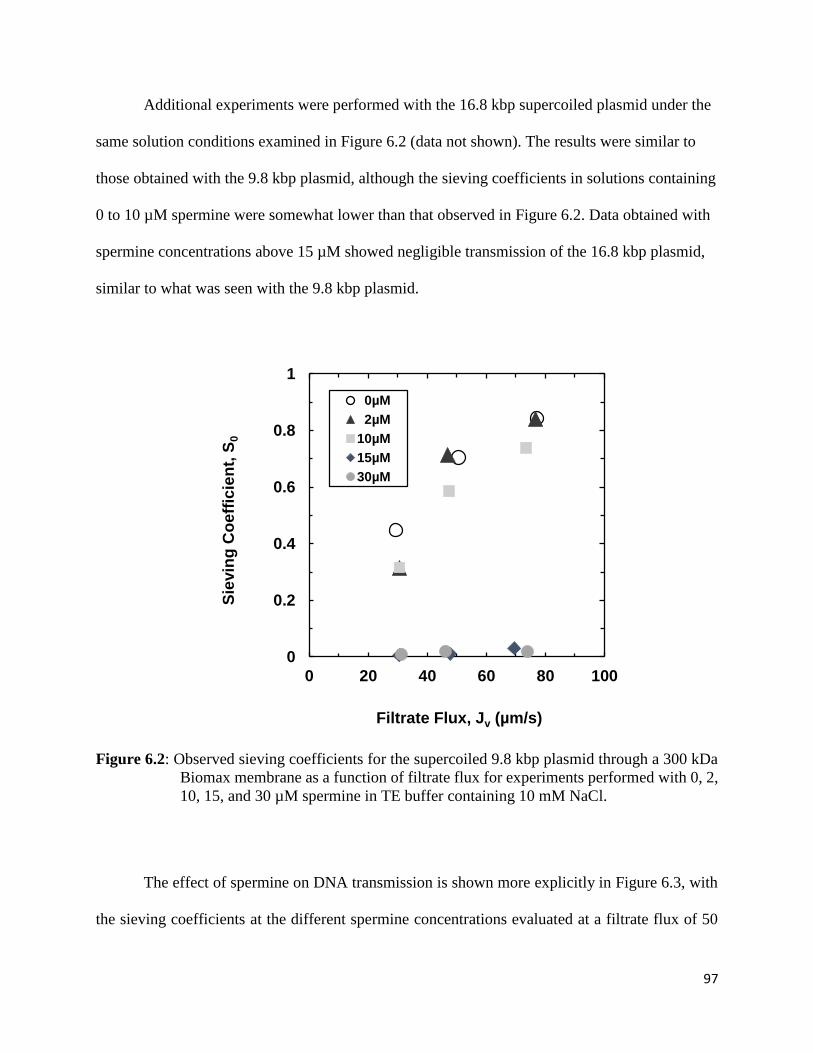
97
Additional experiments were performed with the 16.8 kbp supercoiled plasmid under the
same solution conditions examined in Figure 6.2 (data not shown). The results were similar to
those obtained with the 9.8 kbp plasmid, although the sieving coefficients in solutions containing
0 to 10 µM spermine were somewhat lower than that observed in Figure 6.2. Data obtained with
spermine concentrations above 15 µM showed negligible transmission of the 16.8 kbp plasmid,
similar to what was seen with the 9.8 kbp plasmid.
Figure 6.2: Observed sieving coefficients for the supercoiled 9.8 kbp plasmid through a 300 kDa
Biomax membrane as a function of filtrate flux for experiments performed with 0, 2,
10, 15, and 30 µM spermine in TE buffer containing 10 mM NaCl.
The effect of spermine on DNA transmission is shown more explicitly in Figure 6.3, with
the sieving coefficients at the different spermine concentrations evaluated at a filtrate flux of 50
0
0.2
0.4
0.6
0.8
1
0 20 40 60 80 100
Sie
vin
g C
oe
ffic
ien
t, S
0
Filtrate Flux, Jv (µm/s)
0µM
2µM
10µM
15µM
30µM

98
µm/s. The DNA transmission initially increased slightly upon addition of a low concentration of
spermine, but then rapidly decreased to essentially zero for spermine concentrations at 15 µM and
above.
Figure 6.3: Effect of spermine concentration on the observed sieving coefficients for the
supercoiled 9.8 kbp plasmid through 300 kDa Biomax membranes at a filtrate flux
of 50 µm/s. Data obtained in TE buffer containing 10 mM NaCl.
6.3.2 Effects of monovalent salts
Since spermine directly alters the inter- and intra-molecular electrostatic interactions
between the negatively-charged phosphate groups in DNA, a series of sieving experiments were
performed using the supercoiled 9.8 kbp plasmid in TE buffer with different spermine and NaCl
concentrations. Results are shown in Figure 6.4 for data obtained in the presence of 100 and 1
mM NaCl. Increasing monovalent salt concentration significantly increased plasmid
0
0.2
0.4
0.6
0.8
1
0 10 20 30
Sie
vin
g C
oe
ffic
ien
t, S
0
Spermine Concentration (µM)

99
transmission when at low spermine concentrations (upper panel of Figure 6.4), which is
consistent with results obtained by Latulippe and Zydney 44 and also in Chapter 5. For example,
at a filtrate flux of 50 µm/s, the sieving coefficient in the absence of any spermine ranged from
more than So = 0.8 in the TE buffer with 100 mM NaCl to So < 0.2 in the solution with only 1
mM NaCl. Adding low concentrations of spermine had little effect on DNA transmission, with
the sieving coefficients remaining nearly unchanged from the values obtained in the absence of
any spermine over the entire range of filtrate flux. Note that the ionic strengths (I) of the 1, 10
and 100 µM spermine solution, calculated as:
I = 1
2 (∑ 𝑐𝑖𝑧𝑖
2𝑖 ) (5.1)
where ci and zi are the concentration and valence of each ionic species, are approximately 8, 80
and 800 µM, compared to the 11.6 mM contributed by the TE buffer itself.
The effect of spermine on DNA transmission at high spermine concentrations depends
very strongly on the NaCl concentration. For example, the critical spermine concentration,
defined as the spermine concentration at which there is a large reduction in DNA transmission,
was between 2 and 6 µM in the TE buffer with 1 mM NaCl but this increased to 15 – 30 µM for
the buffer with 10 mM NaCl and to between 100 – 200 µM for 100 mM NaCl. This behavior is
consistent with results obtained by Hoopes and McClure130 for DNA precipitation, in which the
addition of 0.1 M salt increased the concentration of spermine needed for DNA precipitation by
more than 10-fold. The critical spermine concentration for precipitation was found to increase
approximately linearly with increasing NaCl concentration for both long (48.5 kbp) and short
(146 bp) DNA131.

100
Figure 6.4: Observed sieving coefficients for the supercoiled 9.8 kbp plasmid through a 300 kDa
Biomax membrane as a function of the filtrate flux for experiments performed with
various concentrations of spermine added to TE buffer containing 100 mM (upper
panel) and 1 mM (lower panel) NaCl.
0
0.2
0.4
0.6
0.8
1
0 20 40 60 80
Sie
vin
g c
oe
ffic
ien
t, S
0
Filtrate Flux Jv, µm/s
0µM
10µM
30µM
100µM
200µM
0
0.2
0.4
0.6
0.8
1
0 20 40 60 80 100
Sie
vin
g C
oe
ffic
ien
t, S
0
Filtrate Flux Jv, (µm/s)
0µM
2µM
6µM
10µM
15µM
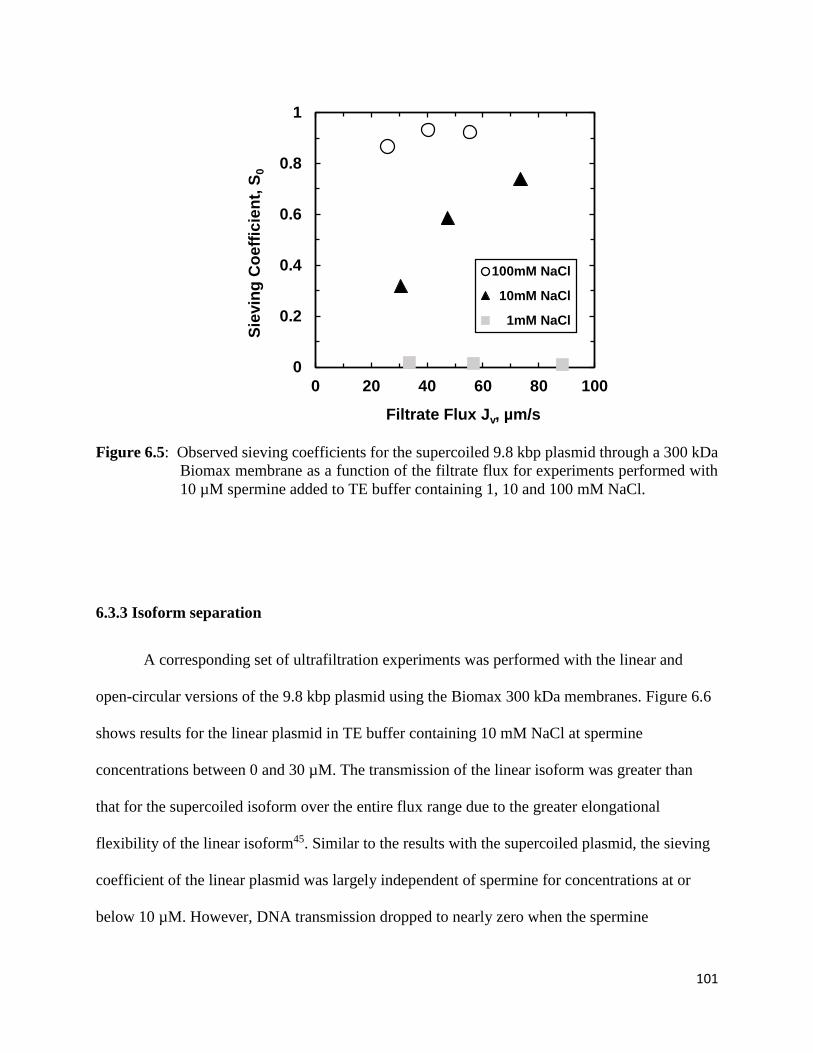
101
Figure 6.5: Observed sieving coefficients for the supercoiled 9.8 kbp plasmid through a 300 kDa
Biomax membrane as a function of the filtrate flux for experiments performed with
10 µM spermine added to TE buffer containing 1, 10 and 100 mM NaCl.
6.3.3 Isoform separation
A corresponding set of ultrafiltration experiments was performed with the linear and
open-circular versions of the 9.8 kbp plasmid using the Biomax 300 kDa membranes. Figure 6.6
shows results for the linear plasmid in TE buffer containing 10 mM NaCl at spermine
concentrations between 0 and 30 µM. The transmission of the linear isoform was greater than
that for the supercoiled isoform over the entire flux range due to the greater elongational
flexibility of the linear isoform45. Similar to the results with the supercoiled plasmid, the sieving
coefficient of the linear plasmid was largely independent of spermine for concentrations at or
below 10 µM. However, DNA transmission dropped to nearly zero when the spermine
0
0.2
0.4
0.6
0.8
1
0 20 40 60 80 100
Sie
vin
g C
oe
ffic
ien
t, S
0
Filtrate Flux Jv, µm/s
100mM NaCl
10mM NaCl
1mM NaCl

102
concentration was increased to above 15 µM, reflecting the condensation of the plasmids under
these conditions. The threshold spermine concentration for the linear isoform was similar to that
found for the supercoiled plasmid (data in Figure 6.3). Thus, spermine had relatively little affect
on the separation between the linear and supercoiled plasmids; the selectivity at low spermine
concentrations was essentially the same as that in the complete absence of any spermine while
high spermine concentrations essentially eliminated transmission of both isoforms through the
Biomax 300 kDa membrane.
Figure 6.7 shows results for the sieving coefficients of the open-circular 9.8 kbp plasmid
through the same Biomax 300 kDa membrane in TE buffer containing 10 (left) and 100 mM
(right) NaCl. There was negligible transmission of the open-circular plasmid through the Biomax
300 kDa membrane in the 10 mM NaCl solution at all spermine concentrations, reflecting the
high value of the filtrate flux required to sufficiently elongate these large circular molecules.
The addition of 100 mM NaCl significantly increased the transmission of the open-circular
plasmid, with the observed sieving coefficients essentially independent of the spermine
concentration up to 30 µM spermine. Figure 6.8 shows the selectivity between the supercoiled
and open-circular isoforms for experiments performed with various concentrations of spermine
at a filtrate flux of 50 µm/s. The selectivity of the supercoiled/open-circular separation was
maximum in the absence of or at very low concentrations of spermine. For example, operating in
a 10 mM NaCl solution with 0 or 2 µM spermine resulted in very low transmission of the open-
circular plasmid (So < 0.05) while there was significant passage of the supercoiled DNA (So >
0.7). In addition, operating at a lower NaCl concentration (10 mM) allowed effective separation
at higher filtrate flux, with the open-circular plasmid still strongly retained under these

103
conditions. Increasing NaCl concentration enhances the transmission of both isoforms, with good
separation only possible at very low filtrate flux (<20 µm/s).
Figure 6.6: Observed sieving coefficients for the linear 9.8 kbp plasmid through a 300 kDa
Biomax membrane as a function of the filtrate flux for experiments performed with
0, 2, 6, 10, 15 µM spermine added to TE buffer containing 10 mM NaCl.
0
0.2
0.4
0.6
0.8
1
0 20 40 60 80 100
Sie
vin
g C
oe
ffic
ien
t, S
0
Filtrate Flux Jv, µm/s
0µM
2µM
10µM
15µM
30µM

104
Figure 6.7: Observed sieving coefficients for the open-circular 9.8 kbp plasmid through a 300 kDa
Biomax membrane as a function of the filtrate flux for experiments performed with
various concentrations of spermine added to TE buffer. Left - solutions contained 10
mM NaCl, Right - solutions contained 100 mM NaCl.
Figure 6.8: Selectivity for separation of the supercoiled and open-circular 9.8 kbp plasmids
through a 300 kDa Biomax membrane as a function of spermine concentration for
experiments performed at filtrate flux of 50 µm/s in TE buffer containing 10 and 100
mM NaCl.
6.4 Conclusions and recommendations
The results presented in this chapter provide the first data for the effects of spermine, a
small polyvalent amine, on the transmission of the supercoiled, linear, and open-circular plasmid
isoforms through ultrafiltration membranes. Adding low concentrations (typically below 10 µM)
of spermine had minimal effect on plasmid transmission through the Biomax 300 kDa
membranes. However, high spermine concentrations caused a dramatic reduction in DNA
0
4
8
12
16
20
0 10 20 30
Se
lec
tivit
y, ψ
Spermine Concentration (µM)
10 mM NaCl
100 mM NaCl

105
transmission, which is likely associated with the condensation of the DNA into a structure that
can no longer be elongated by the flow field into the membrane pores. DNA condensation
appeared to happen at a threshold spermine concentration, above which the plasmids became
almost completely retained by the membrane. The amount of spermine needed to induce DNA
condensation increased with increasing NaCl concentration for both the supercoiled and open-
circular plasmids (data were not obtained at different NaCl concentrations using the linear
plasmid).
Although spermine had a large effect on plasmid transmission, the results obtained in this
Chapter did not find any improvement in the selectivity for the membrane separation between the
different plasmid isoforms upon addition of spermine. At low spermine concentrations, the
plasmid sieving coefficient was essentially independent of the spermine concentration, while at
high spermine concentrations the transmission of all 3 isoforms through the Biomax 300 kDa
membrane was negligible. However, additional experiments might be able to identify conditions
where spermine could enhance the separation behavior. For example, Shao et al. 121 examined
the effect of spermine on DNA structure at high monovalent salt concentrations (>200 mM),
which were sufficient to prevent DNA condensation and which might lead to enhanced DNA
transmission. Experiments under these conditions would likely require the use of ultrafiltration
membranes with much smaller pores than the Biomax 300 kDa membrane to try to identify
conditions where spermine alters DNA transmission by tightening the supercoiled structure,
which could in turn lead to greater selectivity between the open-circular and supercoiled
isoforms.
Although the addition of spermine was not beneficial for DNA isoform separation, it is
very possible that DNA condensation using appropriate concentrations of spermine could be

106
attractive for separation of plasmid DNA from other impurities in the cell lysate. Hoopes and
McClure 130 showed that the intra- and intermolecular precipitation of DNA induced by spermine
was highly selective even in the presence of most proteins or triphosphates. The addition of
spermine could thus be used to significantly increase the retention of a desired DNA product
while allowing host cell proteins to be removed in the permeate. Similarly, unreacted DNA
could be more easily retained, and thus removed, from restriction endonuclease digests by
addition of appropriate quantities of spermine. Note that Hoopes and McClure 130 found that the
concentration of spermine required to precipitate a 100 bp DNA fragment in moderate salt
condition was twice that for a larger (200 bp) DNA, suggesting that the spermine concentration
could be adjusted to enhance the selectivity for the separation between these small nucleotide
fragments.

107
Chapter 7
Effect of Ionic Strength on Membrane Fouling During Ultrafiltration of Plasmid DNA
Results from Chapter 5 demonstrated that the selectivity of membrane systems for DNA
purification can be significantly enhanced by proper selection of the solution ionic strength, but
these data were all obtained in dilute solutions where fouling is negligible. The objective of the
work described in this Chapter was to evaluate the effects of solution conditions on the fouling
characteristics of both supercoiled and linear plasmid DNA isoforms with different length.
Experiments were performed with Biomax membranes with MWCO of 300 and 1000 kDa using
3.0, 9.8, and 16.8 kbp plasmids in solutions containing different NaCl concentrations. The
majority of the work presented in this Chapter was previously published in Separation and
Purification Technology (Li et al., 176, 287-293, 2016).
7.1 Introduction
Membrane processes are highly attractive for the downstream purification of plasmid
DNA, including the separation of the desired supercoiled plasmid from other topological
isoforms 132. However, membrane fouling remains a major factor limiting the performance and
application of these membrane processes. Several studies have demonstrated that even very pure
solutions of plasmid DNA can cause significant fouling, leading to a decline in filtrate flux and
loss of membrane selectivity. For example, Affandy et al.60 showed that the fouling behavior of a
20 kilo base-pair (kbp) and a 56 kbp plasmid DNA during sterile filtration through 0.22 μm
PVDF membranes was due primarily to pore blockage. Borujeni and Zydney 48 observed a rapid

108
decline in both the sieving coefficient and filtrate flux during filtration of a 16.9 kbp supercoiled
plasmid through a 100 kDa polyethersulfone ultrafiltration membrane, with the experimental
data well described by a partial pore blockage model in which the plasmids were trapped at the
pore entrance. The flux and sieving coefficient could be at least partially restored by periodic
backpulsing to remove the trapped plasmids 76.
It is well established that protein fouling is a strong function of solution conditions,
including both pH and ionic strength, due to changes in the intermolecular electrostatic
interactions between the charged protein and the membrane 133-135. DNA is a strongly charged
polyelectrolyte due to the phosphate groups along the DNA backbone. The data presented in
Chapter 5 clearly showed that transmission of the supercoiled plasmid through Ultracel
composite regenerated cellulose membranes increased with increasing ionic strength and that this
could be used to improve the separation of the different plasmid isoforms by proper choice of
solution ionic conditions. However, this work was performed with very dilute DNA solutions
where membrane fouling was negligible.
The objective of the work described in this Chapter was to evaluate the effects of solution
conditions on the rate and extent of membrane fouling during ultrafiltration of more concentrated
plasmid DNA solutions. Data were analyzed using the partial pore blockage model developed by
Borujeni et al.48 to obtain additional insights into the underlying fouling mechanisms and to
develop appropriate strategies for reducing membrane fouling during DNA ultrafiltration.

109
7.2 Materials and methods
Polyethersulfone (Biomax) ultrafiltration membranes (25 mm diameter disks) with
nominal molecular weight cut-off (MWCO) of 300 and 1000 kDa were obtained from EMD
Millipore (Bedford, MA) and used in all ultrafiltration experiments. TE buffer solutions were
prepared by diluting a concentrated stock solution with deionized water. NaCl was added to
achieve the desired ionic strength. All solutions were pre-filtered through 0.2 µm Supor 200
filters (Pall) prior to use.
Data were obtained with three different size supercoiled plasmids (3.0, 6.8 and 16.8 kbp)
obtained from Aldevron, with the linear versions obtained using appropriate restriction
endonucleases as described in Chapter 2. All plasmid samples were stored at -20°C and slowly
thawed at 4°C immediately prior to use.
The effective size of the different plasmids was determined by size exclusion
chromatography (SEC) using a PL Aquagel-OH 60 size exclusion column (designed for
separating polymers from 200 to 105 kDa in size). Data were obtained with an Agilent 1200
series HPLC system (Agilent Technologies) using a sample injection volume of 80 µL with
sample detection by an Agilent 1100 series refractive index detector. The temperature of the
column was kept at 35 °C. The mobile phase was a Tris-EDTA buffer (pH = 7.7 ± 0.3) with the
NaCl concentration chosen to match the ionic strength of the sample. The measured retention
volume of each sample was compared with that of dextran standards with molecular weight
between 2000 and 5000 kDa (American Polymer Standards Corp), which are comparable in size
to the plasmids used in this study. The effective radii of the dextran standards were calculated
from the empirical correlation:

110
𝑅𝑒𝑓𝑓 = 3.1 × 10⁻¹¹ × (𝑀𝑤)0.47752 (7.1)
as described elsewhere136.
7.3 Results and discussions
7.3.1 Fouling experiments
Figure 7.1 shows typical data for the normalized filtrate flux (bottom panel) and observed
sieving coefficients (top panel) during ultrafiltration of 3 µg/mL (= 3 × 10⁻³ kg/m3) solutions of
the supercoiled 16.8 kbp plasmid through the Biomax 300 kDa membranes. Data were obtained
with the plasmids suspended in TE buffer containing 1, 10, or 500 mM NaCl. Each experiment
used a fresh membrane; the permeabilities of the 3 membranes were all within ±20% (6.2 ± 1.1 ×
10-12 m). The transmembrane pressure for each experiment was chosen to provide similar initial
values of the sieving coefficient (So = Cf/Cb where Cf is the filtrate concentration and Cb is the
bulk concentration), giving pressures of 3.2, 1.1, and 0.8 psi (corresponding to 22, 7.6, and 5.5
kPa) for the 1, 10, and 500 mM NaCl solutions, respectively. The higher pressure (and thus
higher filtrate flux) required for the solutions with the lower NaCl concentrations has been
discussed previously by Latulippe and Zydney (2008) 44 and in Chapter 5 and is related to the
change in plasmid conformational flexibility. The data are plotted against the total plasmid mass
throughput, evaluated from the measured filtrate volume and concentration as:
𝑚
𝐴= ∫ 𝐽𝐶𝑓𝑑𝑡
𝑡
0 (7.2)
At least two experiments were performed at each condition to confirm the reproducibility of the
data.

111
Figure 7.1: Effect of solution ionic conditions on the sieving coefficients (top panel) and filtrate
flux (bottom panel) during ultrafiltration of solutions of the 16.8 kbp supercoiled
plasmid through 300 kDa Biomax membranes. Data were obtained at plasmid
concentrations of 3x10⁻³ kg/m3 using TE buffer with 1, 10 or 500 mM NaCl. Dashed
curves are model calculations using parameter values given in Table 7.1.
The flux decline and loss of transmission was most pronounced for the plasmid in the 1
mM NaCl solution. In this case, the sieving coefficient decreased by nearly a factor of 50 (from
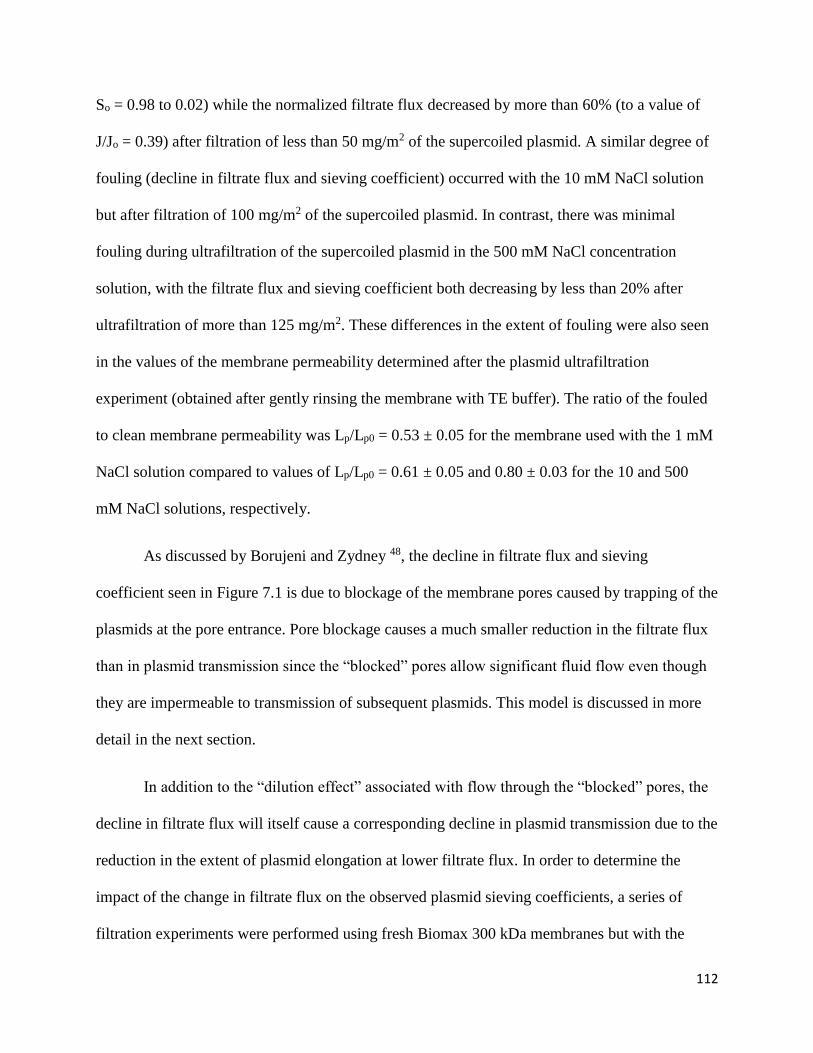
112
So = 0.98 to 0.02) while the normalized filtrate flux decreased by more than 60% (to a value of
J/Jo = 0.39) after filtration of less than 50 mg/m2 of the supercoiled plasmid. A similar degree of
fouling (decline in filtrate flux and sieving coefficient) occurred with the 10 mM NaCl solution
but after filtration of 100 mg/m2 of the supercoiled plasmid. In contrast, there was minimal
fouling during ultrafiltration of the supercoiled plasmid in the 500 mM NaCl concentration
solution, with the filtrate flux and sieving coefficient both decreasing by less than 20% after
ultrafiltration of more than 125 mg/m2. These differences in the extent of fouling were also seen
in the values of the membrane permeability determined after the plasmid ultrafiltration
experiment (obtained after gently rinsing the membrane with TE buffer). The ratio of the fouled
to clean membrane permeability was Lp/Lp0 = 0.53 ± 0.05 for the membrane used with the 1 mM
NaCl solution compared to values of Lp/Lp0 = 0.61 ± 0.05 and 0.80 ± 0.03 for the 10 and 500
mM NaCl solutions, respectively.
As discussed by Borujeni and Zydney 48, the decline in filtrate flux and sieving
coefficient seen in Figure 7.1 is due to blockage of the membrane pores caused by trapping of the
plasmids at the pore entrance. Pore blockage causes a much smaller reduction in the filtrate flux
than in plasmid transmission since the “blocked” pores allow significant fluid flow even though
they are impermeable to transmission of subsequent plasmids. This model is discussed in more
detail in the next section.
In addition to the “dilution effect” associated with flow through the “blocked” pores, the
decline in filtrate flux will itself cause a corresponding decline in plasmid transmission due to the
reduction in the extent of plasmid elongation at lower filtrate flux. In order to determine the
impact of the change in filtrate flux on the observed plasmid sieving coefficients, a series of
filtration experiments were performed using fresh Biomax 300 kDa membranes but with the

113
initial filtrate flux chosen to match the measured flux obtained at the end of each fouling run.
This corresponds to J = 40, 32, and 21 µm/s for the 1, 10, and 500 mM NaCl conditions,
respectively. The flux was set by adjusting the transmembrane pressure based on the previously
measured permeability of the specific membrane; the measured filtrate flux during the
experiment was in good agreement with the expected value. Data were obtained using very
dilute plasmid solutions to avoid any fouling during this set of experiments. The measured values
of the plasmid sieving coefficients were similar in the 3 salt solutions: So = 0.81, 0.89, and 0.90.
The slightly lower value of the sieving coefficient in the 1 mM NaCl solution is due to the larger
effective size of the plasmid at low ionic strength; this more than compensates for the higher
filtrate flux. Thus, the small values of the sieving coefficients seen in Figure 7.1 are a direct
result of the dilution of the filtrate caused by fluid flow through the “blocked” pores at the end of
the ultrafiltration experiment, with very little contribution from the change in filtrate flux.
The large degree of fouling seen in Figure 7.1 is also directly linked to the topology of
the supercoiled plasmids. For comparison, a corresponding fouling experiment was performed
with a 4.0 µg/mL solution of the linear p-FDY plasmid in a 1 mM NaCl solution, with results for
the filtrate flux and sieving coefficient shown in Figure 7.2. Both the sieving coefficient and
filtrate flux remained essentially constant over the entire course of the experiment, up to a
throughput of more than 220 mg/m2, indicating that there was negligible fouling/pore blockage
by the linear isoform even in the 1 mM salt solution. The linear plasmids are much easier to
elongate than the supercoiled DNA, and are thus much less likely to become trapped at the pore
entrance.

114
Figure 7.2: Ultrafiltration of a 3x10⁻³ kg/m3 solution of the 16.8 kbp linear plasmid through a 300
kDa Biomax membrane in 1 mM NaCl TE buffer.
7.3.2 Fouling model
The sieving coefficient and filtrate flux data in the different NaCl solutions were
analyzed using the fouling model developed previously by Borujeni and Zydney 48. As discussed
in the previous section, this model assumes that the membrane pores are occasionally blocked by
plasmids that become trapped at the pore entrance, with these blocked pores assumed to be
completely impermeable to the transport of additional plasmids while allowing some filtrate flow
due to the very open conformation of the trapped plasmids.
The filtrate flux and sieving coefficient are both expressed as functions of the fraction of
open pores (f = Aopen/εAm where ε is the membrane porosity) as:

115
𝐽
𝐽0= 𝛽 + 𝑓(1 − 𝛽) (7.3)
𝑆0
𝑆𝑜𝑝𝑒𝑛=
𝑓
𝛽+𝑓(1−𝛽) (7.4)
where β is the ratio of the flow rate through a partially blocked pore to that through an open pore.
The rate of pore blockage is assumed to be directly proportional to the mass of DNA that passes
through the open pores:
𝑑𝑓
𝑑𝑡= −𝑘(𝐽𝑜𝑝𝑒𝑛𝐶𝑓𝑆𝑜𝑝𝑒𝑛𝑓) (7.5)
where k is a constant describing the rate of fouling. The filtrate flux and sieving coefficient
through an open pore are assumed to be constant since the transmembrane pressure difference
across the pore remains constant. The concentration of the feed solution will gradually increase
with time due to plasmid retention; this was determined numerically using a simple differential
mass balance:
Ct+∆ t =Ct +q
VCFeed -C féë ùû∆ t
(7.6)
Mass balance closure was verified based on the measured plasmid concentration in the stirred
cell at the end of the filtration experiment.
The dashed curves in Figure 7.1 show the calculated values of the sieving coefficient and
filtrate flux based on Equations (7.3) to (7.6) using the best fit values of β and k determined by
minimizing the sum of the squared residuals between the experimental data and model
calculations for both So and J/Jo using a membrane porosity of ε = 0.5. The value of β is
unaffected by the uncertainty in ε as it is defined as the filtrate flow rate through the blocked
pore divided by that in the open pore, which does not depend on the porosity. The fouling rate

116
constant k is proportional to the change in ε according to Equation (7.5) as Jopen = J/ε. However
the absolute values of k should be comparable when experiments were performed with the same
type of membrane (Biomax 300 kDa) since the porosities of the different membranes are very
similar. The values of Sopen and Jopen were taken from the values of the sieving coefficient and
filtrate flux measured at the start of the given ultrafiltration experiment. The model calculations
are in very good agreement with the data, properly describing the more gradual decline in the
filtrate flux (compared to the sieving coefficient) due to the fluid flow through the blocked pores.
The best fit values of β are essentially independent of the NaCl concentration, varying
between β = 0.41 ± 0.01 and 0.48 ± 0.02, where the plus / minus limits on the fitted parameters
were determined based on a 5% increase in the sum of the squared residuals. This behavior is
consistent with the assumed physical picture of the pore being blocked by individual (trapped)
plasmid molecules, with the flow through these “blocked” pores occurring in the “gaps” within
the plasmid and between the plasmid and the pore walls. In contrast, the rate constant for fouling
was significantly affected by the solution ionic strength. There is a nearly 50% decline in the
fouling constant from k = 0.94 × 10⁻⁴ to 0.50 × 10⁻⁴ m2/kg when the salt concentration was
increased from 1 mM to 10 mM, with k further decreasing to 0.13 × 10⁻⁴ m2/kg in the 500 mM
solution.

117
Table 7.1: Best fit values of β and k for plasmid ultrafiltration experiments shown in Figs. 7.1–
7.5.
7.3.3 Effects of plasmid size
Figure 7.3 shows the effect of NaCl concentration on membrane fouling for plasmids
with different size. Experiments were performed using 3.0 µg/mL solutions of the 9.8 and 16.8
kbp supercoiled plasmids in TE buffer containing 1 and 10 mM NaCl. The transmembrane
pressures were maintained at 1.6 and 1.3 psi (11 and 9.0 kPa), giving initial filtrate flux of Jo =
80 and 55 µm/s for the 1 and 10 mM NaCl solutions, respectively. These flux values correspond
to initial sieving coefficients of So = 0.93 ± 0.03. The extent of fouling was much less
pronounced for the smaller 9.8 kbp plasmid, particularly in the 10 mM NaCl solution. For
example, the sieving coefficient decreased from So ≈ 0.9 to 0.05 after filtration of less than 100
mg/m2 for the 16.8 kbp (p-FDY) plasmid in the 10 mM solution, while the sieving coefficient
only decreased to So ≈ 0.4 after more than 145 mg/m2 for the 9.8 kbp (p-MDY) plasmid in the
same NaCl solution. Data obtained with the 3.0 kbp (p-EMP) plasmid in a 10 mM NaCl solution

118
yielded an essentially constant sieving coefficient and filtrate flux after filtration of more than
250 mg/m2, indicating that fouling was completely absent under these conditions.
Figure 7.3: Effect of solution ionic strength on the sieving coefficient (top) and filtrate flux
(bottom) of different size supercoiled plasmids through 300 kDa Biomax membranes.
Data were obtained with 3x10⁻³ kg/m3 solutions of the 16.8, 9.8 and 3.0 kbp plasmid
wi ith 3×10⁻³ kg/m3 solutions of the 16.8, 9.8 and 3.0 kbp plasmid with 1 and 10 mM
NaCl in TE buffer. Dashed curves are model calculations using parameter values
specified in Table 7.1.

119
The dashed curves in Figure 7.3 are again the model calculations using the best fit values
of the fouling parameters, k and β. The β value decreases slightly with increasing plasmid size,
varying from β = 0.70 ± 0.07 for p-EMP to β = 0.44 ± 0.03 for p-FDY. This behavior is
consistent with the physical picture of the larger plasmids providing more extensive blocking of
the pore area.
The best fit values of the fouling rate constant k for the 3 plasmids at the different NaCl
concentrations are summarized in Table 7.1. The fouling rate constant increases with increasing
plasmid size at a fixed set of solution conditions. For example, the best fit value of the rate
constant increases from k = 0.12 × 10⁻⁴ to 0.94 × 10⁻⁴ m2/kg in the 1 mM NaCl solution as the
plasmid size increases from 3.0 to 16.8 kbp. A similar increase is seen in the 10 mM NaCl
solution, consistent with the greater probability of the larger plasmids becoming trapped in the
membrane pores. The greater rate of pore blockage for the larger plasmids is mostly likely
related to their more branched structure as discussed by Li et al. 137. The supercoiled plasmids
adopt a branched structure due to the under-twisting of the DNA, with the number of branches
increasing with increasing chain length. Therefore the chance of blocking a membrane pore is
much higher for the 16.8 kbp plasmid compared with the 3.0 kbp plasmid. This is further
illustrated in Chapter 8. Interestingly, the fouling rate constant for the 16.8 kbp plasmid in a 1
mM NaCl solution was very similar to that of the 9.8 kbp plasmid in a 10 mM NaCl solution,
indicating that an increase in the NaCl concentration is able to compensate for the greater fouling
tendency of the larger plasmid.

120
The relationship between the plasmid size / ionic conditions and membrane fouling was
examined in more detail by plotting the fouling rate constants as a function of the radius of
gyration (Rg) of the plasmid DNA (Figure 7.4). The plasmid radii of gyration were estimated
from the retention volume determined by SEC using mobile phases of differing ionic strength
(TE buffer with 1, 10 and 500 mM NaCl). The radius of a given plasmid decreases with
increasing ionic strength due to the reduction in the magnitude of the intramolecular electrostatic
repulsion between the charged phosphate groups along the DNA backbone. For example, the
radius of the 16.8 kbp plasmid in the 1 mM NaCl solution is 240 nm compared to only 150 nm in
the 500 mM NaCl solution.
Figure 7.4: Fouling rate constant k plotted versus radius of gyration of plasmid DNA. Data include
3.0 and 9.8 kbp supercoiled plasmids in TE buffer containing 1 and 10 mM NaCl,
and 16.8 kbp supercoiled plasmids in TE buffer containing 1, 10, and 500 mM NaCl.
Fouling experiments were performed with Biomax 300 kDa membranes. Error bars
are within the size of the symbols.

121
The fouling rate constant, k, is strongly correlated with the effective plasmid size. The
values of k range from a low of k = 0.01 × 10⁻⁴ m2/kg for the plasmid with the smallest effective
size (Reff = 120 nm for the 3.0 kbp plasmid in 10 mM NaCl TE buffer) to a high of k = 0.94 ×
10-4 m2/kg for the plasmid with the largest size (Reff = 240 nm for the 16.8 kbp plasmid in 1 mM
NaCl TE buffer). In addition, plasmids with similar effective size (but different numbers of base
pairs), have very similar fouling rate constants. For example, the 3.0 kbp plasmid in 1 mM NaCl
TE buffer has Reff = 140 nm while the 16.8 kbp plasmid in 500 mM NaCl TE buffer has Reff =
150 nm, with these two plasmids having k = 0.12 and 0.13 × 10⁻⁴ m2/kg, respectively.
7.3.4 Effects of membrane pore size
An additional series of experiments was performed with the larger pore size Biomax
1000 kDa membranes, with the results in the 1 and 10 mM NaCl solutions shown in Figure 7.5.
Also shown for comparison are data for the 300 kDa membrane taken from Figure 7.1.
Experiments with the 1000 kDa membrane were done using 5.0 µg/mL solutions of the
supercoiled p-FDY plasmids in TE buffer at constant pressures of ∆P = 2.5 and 1.2 kPa for the 1
and 10 mM NaCl solutions, respectively, with these pressures chosen to give similar initial
values for the plasmid sieving coefficients. The hydraulic permeability of the Biomax 1000 kDa
membranes was 30 × 10-12 m, which is approximately 5 times the value obtained with the
Biomax 300 kDa membranes.
The rate of fouling was much less pronounced with the larger pore size membrane at both
NaCl concentrations. For example, the sieving coefficient data for the Biomax 1000 kDa

122
membrane using the 10 mM NaCl solution showed only a very small decline, from So = 0.97 to
0.87, after a mass throughput of as much as 170 mg/m2. A much greater decline in sieving
coefficient and filtrate flux was seen with the 1 mM NaCl solution, although in both cases the
fouling was less pronounced than that seen with the 300 kDa membrane even at the higher salt
concentration. In contrast to the data with the 300 kDa membrane, the decline in filtrate flux with
the 1000 kDa membrane is comparable to the decline in sieving coefficient, suggesting that there
is proportionally less filtrate flow through the blocked pores in the 1000 kDa membrane.

123
Figure 7.5: Effect of solution ionic strength on the sieving coefficient (top) and filtrate flux
(bottom) of the supercoiled plasmid through membranes with different MWCO. Data
obtained with 5×10⁻³ kg/m3 solutions of the 16.8 kbp plasmid with 1 and 10 mM
NaCl in TE buffer using Biomax 300 and 1000 kDa membranes. Dashed curves are
model calculations using parameter values in Table 7.1.
In order to understand these differences in fouling behavior in more detail, the data in
Figure 7.5 were analyzed using the fouling model to determine the best fit values of k and β, with

124
results summarized in Table 7.1. The mean pore size (rp) of the two membranes was estimated
from the measured hydraulic permeability using the Hagen-Poiseuille equation assuming
uniform cylindrical pores with length δm = 1 µm (equal to the thickness of the selective skin
layer) and porosity ε = 0.5:
𝑟𝑝 = (8𝛿𝑚𝐿𝑝
)1/2
(7.7)
Equation (7.7) gives rp = 22 nm and 9 nm for the 1000 kDa and 300 kDa membranes,
respectively. The values of the fouling rate constant for the Biomax 1000 kDa membrane are
about a factor of 3 smaller than those for the Biomax 300 kDa membrane at both NaCl
concentrations, which is consistent with the lower probability of plasmid trapping in the larger
pore size membranes. Interestingly, the best fit values of β are also much smaller for the Biomax
1000 kDa membranes (β = 0.14 ± 0.05) compared to the results obtained with the Biomax 300
kDa membranes (β = 0.44 ± 0.03), even though one would expect to have greater fluid flow
through a larger pore that is blocked by a single plasmid. The small values of β for the Biomax
1000 kDa membrane could be due to the presence of multiple DNA molecules in the blocked
pores, which would significantly reduce the available open space for fluid flow. This is also
reflected in the somewhat greater reduction in filtrate flux compared to that seen for the sieving
coefficient for the fouling experiments conducted with the Biomax 1000 kDa membranes (Fig.
7.5). Additional studies will be needed to fully clarify the origin of this behavior.
Table 7.1 summarizes the best fit values of the fouling parameters for all of the
experimental conditions. The fouling rate constant k and the pore blockage parameter β are both
strong functions of the solution ionic strength, the membrane pore size, and the plasmid size.
These changes are likely related to the conformational properties of the supercoiled plasmid. In

125
particular, electrostatic shielding at high salt concentrations reduces the intersegmental repulsion
in the DNA molecules, which causes the plasmids to adopt a more tightly interwound
conformation 101, 107. The more highly condensed and tightly interwound structure not only
facilitates transmission of the supercoiled plasmid through the small pore size ultrafiltration
membranes, it also reduces the probability of pore blockage (and membrane fouling) due to
trapping of plasmid at the pore entrance.
7.4 Conclusions
The data presented in this Chapter provide the first quantitative analysis of the effects of
solution ionic strength on membrane fouling during ultrafiltration of plasmid DNA. Membrane
fouling was negligible with the linear plasmid isoform. In contrast, the supercoiled plasmid
showed a significant decline in both filtrate flux and transmission, with the rate of fouling
decreasing significantly at high ionic strength and for the smaller size plasmids. Membrane
fouling in this system appears to be due to trapping of the large supercoiled plasmids at the pore
entrance 48; previous studies by Borujeni et al.76 showed that the flux and transmission could be
largely restored by periodic backpulsing to push these plasmids out of the pores. The fouling rate
constant was highly correlated with the effective plasmid size (as determined by size exclusion
chromatography), potentially allowing one to predict the rate of fouling for different size
plasmids under different ionic conditions based on limited fouling data in combination with SEC
measurements of the effective plasmid size.
The results from these fouling experiments could have significant implications in the
design of membrane processes for the purification of plasmid DNA. The dramatic reduction in
126
fouling in the higher ionic strength solution could be exploited by operating the membrane
process at relatively high salt concentrations, particularly for processes with higher DNA
concentrations. However, the data presented in Chapter 5 showed that the greatest selectivity for
the separation of the linear and supercoiled isoforms was achieved at low salt concentrations due
to the increase in retention of the supercoiled isoform under these conditions. The design and
optimization of membrane processes for purification of the desired supercoiled isoform thus
requires a detailed understanding of the tradeoffs between the selectivity and fouling behavior in
the different ionic strength solutions.

127
Chapter 8
Size-based Separation of Supercoiled Plasmid DNA using Ultrafiltration
Most previous studies of membrane-based separations have shown no effect of DNA size
on plasmid transmission through small pore size ultrafiltration membranes, consistent with the
predicted behavior for flexible polymer chains. However, supercoiled plasmids are known to
have a highly “branched” structure with the number of branches dependent on the DNA length.
This difference in branching could lead to a significant dependence of the transmission on the
plasmid size, providing opportunities for size-based separations using ultrafiltration.
The objective of the work described in this Chapter was to evaluate the transmission of
different size supercoiled plasmids during ultrafiltration. Data were obtained with 3.0, 9.8, and
16.8 kbp plasmids using both cellulosic and polyethersulfone ultrafiltration membranes with
different molecular weight cutoffs. Initial experiments were performed with purified samples of
the supercoiled or linear isoforms, with the results used to identify appropriate conditions for
plasmid separation. The majority of the work presented in this Chapter was previously published
in the Journal of Colloid and Interface Science (Li et al., 472, 195-201, 2016).
8.1 Introduction
DNA purification is a critical step in many microbiological processes, forensic analyses,
and in the large scale production of gene therapy agents and DNA based vaccines 34. This
includes the removal of other nucleic acids such as genomic DNA, RNA, and DNA dimers (e.g.,
linked plasmids), as well as plasmids with incorrect constructs 33. These nucleic acid separations

128
are particularly difficult since the DNA has similar surface charge and affinity, although there
can be large differences in the size of these species.
Agarose gel electrophoresis (AGE) is the standard method for size-based DNA
separations, with differences in DNA mobility through the gel arising from hydrodynamic
interactions with the agarose matrix 138-139. However, AGE is limited to laboratory-scale
separations, it is very time-consuming, and it can be difficult to recover DNA from the gel and
remove the stain used for visualization. Density gradient centrifugation using CsCl can also be
used for size-based DNA separations, although this usually requires more than 16 h of
ultracentrifugation 140.
Several size exclusion chromatography (SEC) resins have been specifically developed for
DNA separations, including the Sephacryl S-1000 and the Superose 6B 141. These large pore size
resins can provide reasonable resolution for DNA separations, particularly between very large
genomic DNA and smaller plasmids, although the throughput tends to be very low due to the
significant diffusional resistance arising from the large size of the DNA 142. In addition, baseline
resolution can be difficult to achieve due to the broad peaks and the physical and chemical
similarity between the impurities and the supercoiled plasmid 143. For example, McClung and
Gonzales used the Superose 6 resin for purification of plasmids from E Coli extract containing
DNA fragments with good resolution, but all plasmids from 4 to 150 kbp eluted at the same
retention volume, with no fractionation of these plasmids on the basis of size or length 144.
Raymond et al. 145 used the Sephacryl S-1000 resin for purification of supercoiled DNA, with
good (but incomplete) removal of RNA and genomic DNA for both 4.4 and 12 kbp plasmids.
Membrane separations have replaced SEC in many size-based separations due to the
large increase in throughput and the significant reduction in processing time. For example, buffer

129
exchange in the formulation of therapeutic proteins is now done almost entirely by ultrafiltration
/ diafiltration 79, 146. Membrane systems can also be used for much higher resolution size-based
separations, e.g., between protein monomers and dimers 147. However, previous studies of
membrane systems for DNA separations have generally shown little if any dependence of
plasmid retention on the DNA size 37, 43. Latulippe and Zydney 43 hypothesized that this was due
to the elongation of the plasmid in the converging flow field approaching the membrane pores,
with the larger plasmids having more time to elongate as they approach the pore. This behavior
is in good agreement with predictions of scaling models developed to describe the elongation of
single polymer chains during passage through isolated small pores 42. However, it is well known
that supercoiled plasmids adopt a more complex 3-dimensional morphology, which could lead to
very different behavior during ultrafiltration.
The objective of this Chapter was to investigate whether ultrafiltration could be used for
the separation of supercoiled plasmids based on differences in their size, i.e., number of base
pairs. Initial experiments were conducted with purified plasmids of different size to determine
the effect of the plasmid size on transmission through different pore size ultrafiltration
membranes. Corresponding experiments were performed with linear plasmids to confirm the role
of the supercoiled structure on the ultrafiltration behavior. Appropriate conditions were identified
and then applied for the separation of a binary mixture of supercoiled plasmids with different
size. The results were in good agreement with a simple physical model for the transmission of
“branched” polymers, providing further confirmation of the potential for using ultrafiltration for
size-based separation of supercoiled plasmid DNA.

130
8.2 Materials and methods
200 × 10-6 kg/m3 (200 μg/mL) stock solutions of supercoiled plasmids were obtained
from Aldevron (Fargo, ND) and stored frozen at -20 °C. Three different size plasmids: 3.0, 9.8,
and 16.8 kilo base pair (kbp), were used in the experiments. The linear plasmid isoforms were
prepared from the supercoiled isoforms using restriction endonucleases that recognize and cleave
a specific nucleotide sequence in the double-stranded DNA following procedures described in
Chapter 2.
25 mm diameter polyethersulfone (Biomax) ultrafiltration membranes with nominal
molecular weight cut-offs of 50 kDa (PBQK02510), 100 kDa (PBHK02510), and 300 kDa
(PBMK02510) were provided by MilliporeSigma. Limited experiments were also performed
using 100 kDa Ultracel composite regenerated cellulose membranes (PLHK02510,
MilliporeSigma). DNA concentrations were analyzed using the PicoGreen Assay and the size,
integrity, and topology of the different plasmid isoforms were confirmed using Agarose gel
electrophoresis (AGE).
A 10 mL stirred cell (MilliporeSigma) was used in the ultrafiltration experiments. The
stirring speed in the stirred cell was adjusted to 730 rpm for all experiments. The pressure in the
system was controlled by air pressurization of the polycarbonate feed reservoir that was
connected to the stirred cell using pressures from 0 to 60 kPa (approximately 0-8 psi). Additional
details on the plasmid filtration experiments are provided in Chapter 2.
8.3 Results and discussion
8.3.1 Supercoiled plasmids
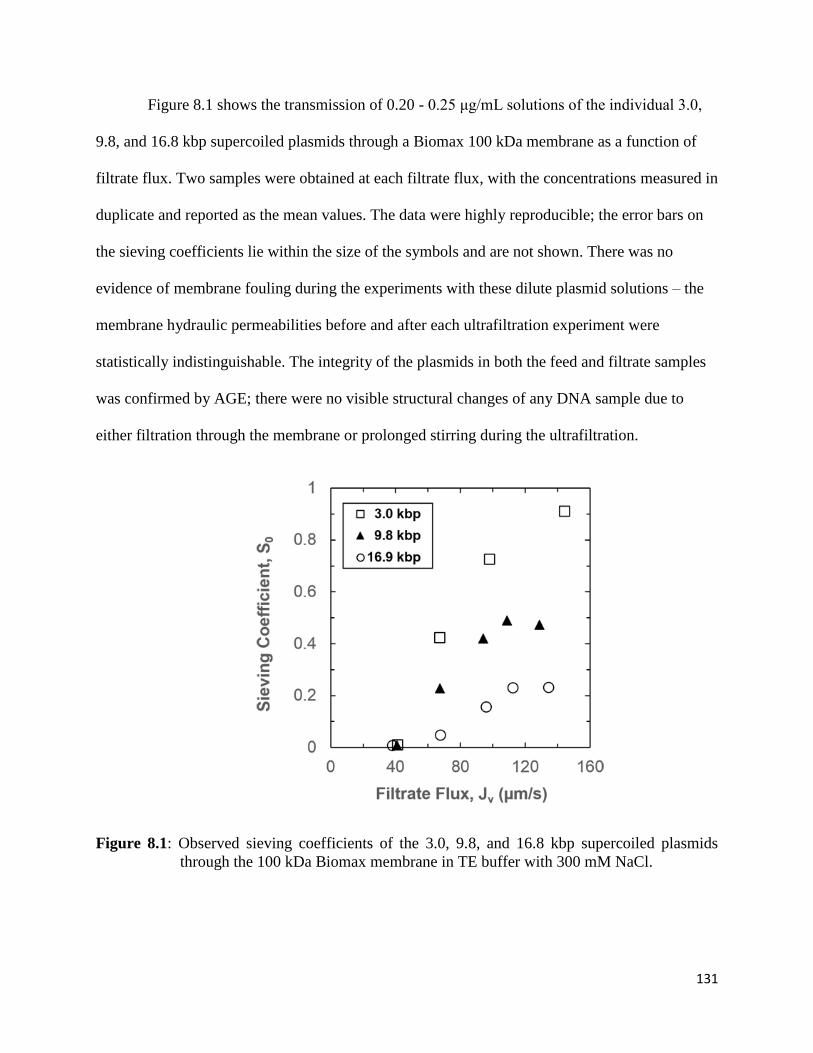
131
Figure 8.1 shows the transmission of 0.20 - 0.25 μg/mL solutions of the individual 3.0,
9.8, and 16.8 kbp supercoiled plasmids through a Biomax 100 kDa membrane as a function of
filtrate flux. Two samples were obtained at each filtrate flux, with the concentrations measured in
duplicate and reported as the mean values. The data were highly reproducible; the error bars on
the sieving coefficients lie within the size of the symbols and are not shown. There was no
evidence of membrane fouling during the experiments with these dilute plasmid solutions – the
membrane hydraulic permeabilities before and after each ultrafiltration experiment were
statistically indistinguishable. The integrity of the plasmids in both the feed and filtrate samples
was confirmed by AGE; there were no visible structural changes of any DNA sample due to
either filtration through the membrane or prolonged stirring during the ultrafiltration.
Figure 8.1: Observed sieving coefficients of the 3.0, 9.8, and 16.8 kbp supercoiled plasmids
through the 100 kDa Biomax membrane in TE buffer with 300 mM NaCl.
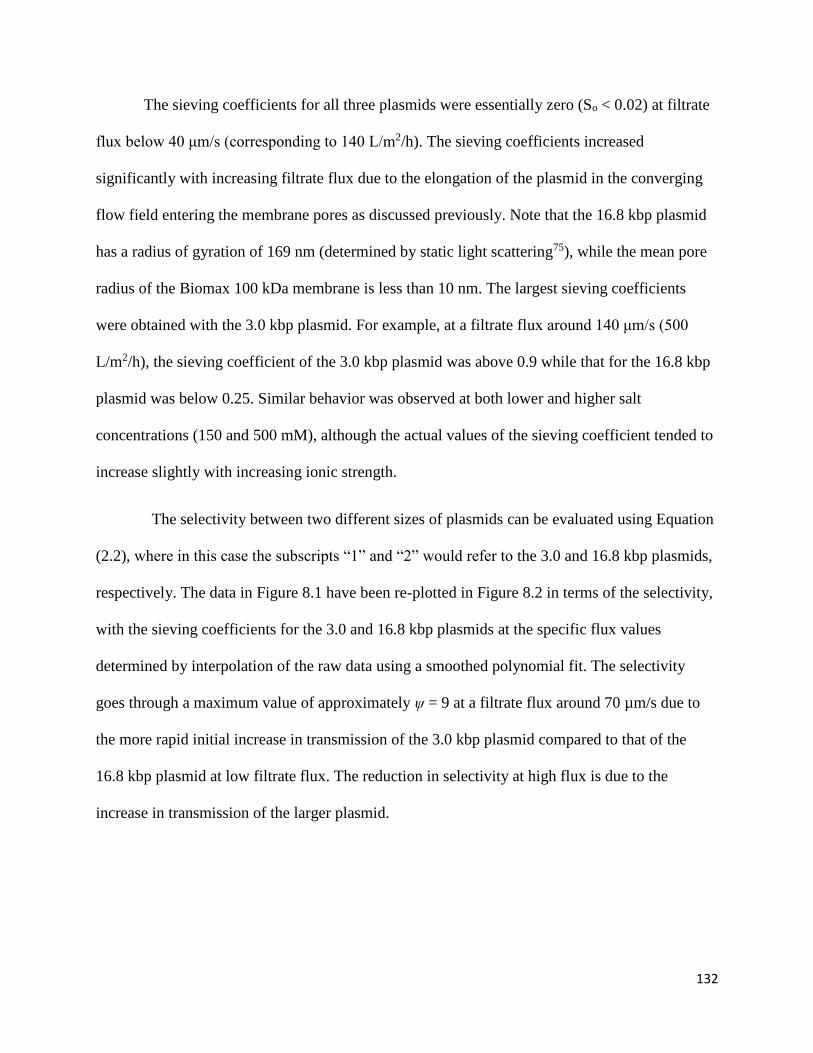
132
The sieving coefficients for all three plasmids were essentially zero (So < 0.02) at filtrate
flux below 40 μm/s (corresponding to 140 L/m2/h). The sieving coefficients increased
significantly with increasing filtrate flux due to the elongation of the plasmid in the converging
flow field entering the membrane pores as discussed previously. Note that the 16.8 kbp plasmid
has a radius of gyration of 169 nm (determined by static light scattering75), while the mean pore
radius of the Biomax 100 kDa membrane is less than 10 nm. The largest sieving coefficients
were obtained with the 3.0 kbp plasmid. For example, at a filtrate flux around 140 μm/s (500
L/m2/h), the sieving coefficient of the 3.0 kbp plasmid was above 0.9 while that for the 16.8 kbp
plasmid was below 0.25. Similar behavior was observed at both lower and higher salt
concentrations (150 and 500 mM), although the actual values of the sieving coefficient tended to
increase slightly with increasing ionic strength.
The selectivity between two different sizes of plasmids can be evaluated using Equation
(2.2), where in this case the subscripts “1” and “2” would refer to the 3.0 and 16.8 kbp plasmids,
respectively. The data in Figure 8.1 have been re-plotted in Figure 8.2 in terms of the selectivity,
with the sieving coefficients for the 3.0 and 16.8 kbp plasmids at the specific flux values
determined by interpolation of the raw data using a smoothed polynomial fit. The selectivity
goes through a maximum value of approximately ψ = 9 at a filtrate flux around 70 µm/s due to
the more rapid initial increase in transmission of the 3.0 kbp plasmid compared to that of the
16.8 kbp plasmid at low filtrate flux. The reduction in selectivity at high flux is due to the
increase in transmission of the larger plasmid.

133
Figure 8.2: Selectivity between the 3.0 and 16.8 kbp supercoiled plasmids as a function of filtrate
flux. Ultrafiltration experiments were performed using 100 kDa Biomax membranes
in TE buffer containing 300 mM NaCl.
The effect of membrane pore size on the selectivity between the 3.0 and 16.8 kbp
plasmids is examined in Figure 8.3 based on data obtained with the Biomax 50, 100, and 300
kDa membranes in TE buffer containing 300 mM NaCl. In each case, the maximum value of the
selectivity is shown; this occurred at a filtrate flux of 110 µm/s for the 50 kDa membrane and at
Jv = 5 µm/s for the 300 kDa membrane. The selectivity was very low with the large pore size
Biomax 300 kDa membrane, withψ < 2.5 for all conditions, due to the similar (and relatively
large) values of the sieving coefficients for both plasmids. The maximum selectivity for the
Biomax 50 kDa membrane was only about ψ ≈ 4.5 due to the high degree of retention for both
plasmids through this small pore size membrane. The greatest selectivity was seen with the
Biomax 100 kDa membrane (data from Figure 8.2). It is possible that the small pore membrane

134
could separate plasmids of different sizes, but that would require a very high filtrate flux
(transmembrane pressure) in order to get significant plasmid transmission, which is beyond the
operation range of the stirred cell apparatus used in this work.
Figure 8.3: Selectivity between the 3.0 and 16.8 kbp supercoiled plasmids as a function of
membrane MWCO. Only the optimal Ψ values were plotted. Ultrafiltration
experiments were conducted in TE buffer containing 300 mM NaCl. The optimal Ψ
values were obtained at filtrate flux of 110, 70, and 5.2 µm/s for the 50, 100, and 300
kDa membranes, respectively.
To confirm that the size-dependent transmission of the supercoiled plasmids was not
unique to the Biomax membranes, additional sieving experiments were performed using the
Ultracel 100 kDa regenerated cellulose membrane. As seen in Figure 8.4, the behavior of the
Ultracel 100 kDa membrane is similar to that seen with the Biomax 100 kDa membrane, with
much larger transmission of the 3.0 kbp supercoiled plasmid compared to that of the 9.8 and 16.8

135
kbp plasmids. The maximum selectivity between the 3.0 and 16.8 kbp plasmids was ψ ≈ 30 at a
filtrate flux around 40 μm/s (L/m2/h). The Ultracel membrane also showed a large selectivity
between the 3.0 and 9.8 kbp plasmids, with ψ ≈ 12 under these conditions.
Figure 8.4: Observed sieving coefficients of the 3.0, 9.8, and 16.8 kbp supercoiled plasmids
through the 100 kDa Ultracel membrane in TE buffer with 500 mM NaCl.
Actual separation of the 3.0 and 16.8 kbp plasmids was done by performing an
ultrafiltration experiment with a binary mixture of the two supercoiled plasmids, each at a
concentration of 0.25 μg/mL, using the same solution conditions as in Figure 8.4. Data were
obtained at a filtrate flux of 70 μm/s using an Ultracel 100 kDa membrane; this corresponds to a
selectivity about 8-fold. This higher flux was chosen to increase the transmission of the 3.0 kbp
plasmid and enhance the accuracy of the AGE used to evaluate the performance of the

136
ultrafiltration process. Figure 8.5 shows the AGE image for filtrate and feed samples obtained 2
min after the start of the ultrafiltration. The first lane shows a 1.0 kbp DNA ladder; Lanes 4 and
5 are the purified 3.0 and 16.8 kbp supercoiled plasmids for reference. The 16.8 kbp supercoiled
plasmid sample contains some higher molecular weight species (faint band near the top of the gel
in Lane 5), which could be plasmid dimers or low levels of the open circular isoform of this
plasmid. The feed sample for the ultrafiltration experiment (Lane 3) consists of equal amounts of
the 3.0 and 16.8 kbp plasmids, with the lower band corresponding to the smaller 3.0 kbp plasmid
since it migrates faster through the gel during the electrophoresis; again, some high molecular
weight species is seen near the top of the gel. The filtrate sample (Lane 2) shows only a single
band corresponding to the 3.0 kbp plasmid with no detectable levels of the 16.8 kbp plasmid or
the higher molecular weight species, consistent with the sieving coefficient data for the
individual plasmids shown previously in Figure 8.4. These data clearly demonstrate that
ultrafiltration can be used for the separation of different supercoiled plasmids on the basis of
size.

137
Figure 8.5: Agarose gel electrophoresis (AGE) showing the separation of a binary mixture of the
3.0 and 16.8 kbp supercoiled plasmids using an UltracelTM 100 kDa membrane in
TE buffer containing 500 mM NaCl. Lane 1: linear 1 kbp DNA ladder. Lane 2: filtrate
sample collected at a filtrate flux of 70 µm/s. Lane 3: feed sample. Lane 4: purified
3.0 kbp supercoiled plasmid. Lane 5: purified 16.8 kbp supercoiled plasmid.
8.3.2 Linear plasmids
A corresponding series of experiments was performed with linear versions of the three
plasmids, each generated by enzymatic digestion of the corresponding supercoiled isoform.
Figure 8.6 presents results for the linear 3.0 and 16.8 kbp plasmids through the Ultracel 100 kDa
(left panel) and Biomax 100 kDa (right panel) membranes in TE buffer containing 150 mM and
10 mM NaCl, respectively. Similar results were obtained at other solution ionic strength and with
both the smaller and larger molecular weight cutoff membranes. The sieving coefficients of the
linear plasmid are considerably larger than the values seen with the supercoiled plasmids
(Figures 8.1 and 8.4) at the same filtrate flux due to the greater elongational flexibility of the
linear isoform; this is discussed in detail by Latulippe and Zydney 45 and has been exploited for

138
the separation of the different DNA isoforms by ultrafiltration. The sieving coefficients for the
two plasmids are very similar for all values of the filtrate flux, with differences of less than 8%
(except for a single data point at 40 μm/s for the Biomax 100 kDa membrane). Thus, the good
selectivity for the supercoiled plasmids seen in Figures 8.1 to 8.5 is completely absent with the
linear isoforms; the selectivity between the 3.0 and 16.8 kbp linear isoforms was less than 1.2
under all experimental conditions.
Figure 8.6: Observed sieving coefficients of the 3.0, 9.8, and 16.8 kbp linear plasmids through (a)
the Ultracel 100 kDa membrane in TE buffer with 150 mM NaCl and (b) the Biomax
100 kDa membrane in TE buffer with 10 mM NaCl.
8.3.3 Physical interpretation
A number of previous experimental and theoretical studies have examined the
transmission of linear polymers through narrow pores. Daoudi and Brochard 42 used scaling

139
arguments to show that the critical volumetric flow rate required for passage of the chain through
a pore scales as:
𝑞𝑐 ≈ 𝑘𝐵𝑇
𝜂 (8.1)
independent of the polymer chain length (where kB is Boltzmann’s constant, T is the absolute
temperature, and η is the solution viscosity). Sakaue et al.148 used a force balance analysis to
show that passage of a linear polymer through a small pore is controlled by the injection of the
first polymer “blob”, which is again independent of the polymer chain length. Both molecular
dynamic simulations 149 and experimental studies 150 have confirmed the universal transmission
behavior of linear polymers with different chain length.
These results strongly suggest that the size-dependent transmission seen in Figures 8.1 to
8.5 is due to the unique molecular structure of the supercoiled plasmid isoform. Supercoiled
DNA adopts a plectonemic (interwound) conformation with numerous branch points due to the
helical “twists” in the circular plasmid (leading to local contortions or “writhe”). This branching
is driven by the increase in entropy associated with the expanded conformation, but is
enthalpically unfavorable due to the additional bending energy required to form the branches 22-
23, 151. Previous studies have shown that the extent of branching is proportional to the size of the
supercoiled plasmid 23. The degree of branching is often quantified by the number of superhelix
“ends” 152. For example, Hammermann et al. 105 showed that a 1.868 kbp supercoiled DNA was
essentially unbranched (N = 2), whereas a 5.243 kbp molecule adopted a conformation with
N ≈ 3. Fathizadeh et al. 153 used molecular dynamics simulations to model the structure of
supercoiled plasmids with lengths between 1.2 and 6 kbp and showed that the average number of
superhelix ends increased from 2 (no branching) for the smallest plasmid to 4.5 ± 0.5 for the 6

140
kbp plasmid. Boles et al. 17 used scanning electron microscopy to count the average number of
branch points per DNA as 1.6 and 2.9 for a 3.5 and 7 kbp supercoiled plasmid, respectively.
Vologodskii and Cozzarelli 22 evaluated the branching frequency of supercoiled DNA as a
function of DNA length using Monte Carlo simulations, with the results showing N = 2, 7, and
12 for plasmids with lengths of 3, 10 and 17 kbp (similar to the size of the plasmids examined in
this work).
Several investigators have developed simple scaling models for the transport of polymer
chains with different topologies (e.g., branching) through small cylindrical pores154-156. The
passage of a polymer chain through a cylindrical pore happens when the confinement and
hydrodynamic forces on each individual blob are balanced (i.e. fc = fh). Here 𝝃, u (=q/D2, where
D refers to the pore diameter), and le are the “blob” diameter, flow velocity, and the blob’s
effective length along the flow direction, respectively; and each “blob” is defined as the
maximum portion of the confined chain whose confinement free energy becomes of order
thermal energy (kBT). The critical flow rate for polymer chains to pass through the pore was
found to be a function of the polymer topology (number of branches):
𝑞𝑐
𝑞𝑐,𝑙𝑖𝑛𝑒𝑎𝑟= (
𝐷
𝜉)2 (8.2)
where 𝑞𝑐,𝑙𝑖𝑛𝑒𝑎𝑟 = 𝑘𝐵𝑇
3𝜋𝜂 (
ξ
𝑙𝑒). In the limit of small pore size (i.e., membrane pore diameter <<
polymer length), the critical flow rate for injection of a branched polymer into a small pore was
found to scale as
𝑞𝑐,𝑏𝑟𝑎𝑛𝑐ℎ
𝑞𝑐,𝑙𝑖𝑛𝑒𝑎𝑟= 𝑛𝑏𝑟𝑎𝑛𝑐ℎ
1/4 (8.3)

141
where nbranch is defined as the number of branching points of the hyperbranched chain (equal to
the number of ends minus two). Thus, Equation (8.3) predicts that the critical flow rate increases
by a factor of approximately 1.5 in going from the 3.0 to 9.8 kbp plasmids, with a 1.8-fold
increase in the critical flow rate for the 16.8 kbp plasmid.
The experimental data for plasmid transmission as a function of filtrate flux can be used
to estimate the critical flow rate by defining qc as the flux at which So ≈ 0.1. The data in Figure
8.1 give values of the critical flux for the 3.0, 9.8, and 16.8 kbp plasmids of 47, 52, and 81 μm/s
based on linear interpolation of the sieving coefficients. Thus, the ratio of the critical flow rate
for the 16.8 kbp plasmid to that for the 3.0 kbp plasmid is 1.7, in excellent agreement with the
factor of 1.8 given by Equation (8.3). Similar results were seen with the other membranes and
with the 9.8 kbp plasmid, providing further evidence that the observed differences in
transmission of the different size supercoiled plasmids is due to differences in the underlying
topologies associated with the writhe / branching of the longer plasmids.
Although there have been no prior experimental studies showing the effects of DNA
branching on plasmid ultrafiltration, Ge and Wu 157 examined the transmission of linear and star-
shaped polystyrene through ultrafiltration membranes with well-defined 20 nm pores. The
polystyrene chains were synthesized by coupling “living” polystyl chains of different lengths
using divinylbenzene. The linear polystyrenes showed much greater transmission than the
corresponding star-shaped polymers (with the same total chain length), consistent with the
behavior predicted by Equation (8.3) and in good qualitative agreement with the data obtained in
this study for the ultrafiltration of supercoiled versus linear plasmids.

142
8.4 Conclusions
The results presented in this Chapter clearly demonstrate the potential of using
ultrafiltration membranes to separate supercoiled plasmids based on differences in their size (i.e.,
number of base pairs). Plasmid transmission through small pore ultrafiltration membranes is due
to the elongation of the DNA chain in the converging flow field approaching the membrane
pores, with minimal transmission below a critical value of the filtrate flux. However, the
different size supercoiled plasmids have different critical flux, leading to greater transmission of
the smaller plasmids. The Ultracel 100 kDa membrane showed a selectivity between the 3.0 and
16.8 kbp plasmids as high as 30, with similar behavior seen with the Biomax polyethersulfone
membrane. Note that a selectivity of 30 could provide a 100-fold purification with 90% yield
using a diafiltration process based on the expected trade-off between the product yield and
purification factor in membrane separation systems 52. For example, the yield of a product that is
collected in feed (retentate) tank during diafiltration is given as:
𝑌 = exp(−𝑁𝐷𝑆) (8.4)
where ND is the number of diavolumes and S is the sieving coefficient of the species of interest.
The purification factor can be calculated as:
P =Y 1-y (8.5)
where ψ is the selectivity.. Thus, a membrane system with selectivity of 30 would give P > 100
with Y = 90%.
The potential for using ultrafiltration for separation of different size supercoiled plasmids
was confirmed by agarose gels of filtrate samples obtained in an experiment using a binary

143
mixture of the 3.0 and 16.8 kbp plasmids. To our knowledge, this is the first quantitative
demonstration of a size-based separation of large plasmid DNA using ultrafiltration.
The reduction in transmission of the supercoiled plasmids with increasing chain length is
a direct result of the morphology of the supercoiled isoform; no significant affect of plasmid size
was seen during ultrafiltration of linear versions of the same plasmids. The supercoiled isoforms
adopt a branched structure due to the under-twisting of the DNA, with the number of branches
increasing with increasing chain length. The experimental results obtained in this Chapter are
consistent with the critical flux determined by a scaling analysis for branched polymers,
providing further confirmation of the origin of this size-based ultrafiltration behavior. Note that
previous studies of plasmid ultrafiltration by Latulippe et al.37, Borujeni and Zydney158 and
Arkhangelsky et al.61 did not observe any significant dependence of plasmid transmission on the
size of the supercoiled DNA, although these experiments were done with considerably larger
pore size membranes (1000 kDa molecular weight cutoff and 20 nm pores, respectively) which
would be expected to have minimal selectivity based on the results in Figure 8.3.
Membrane systems could provide an attractive alternative for the purification of
supercoiled plasmid DNA, both for laboratory analysis and in the preparation of gene therapy
agents or DNA-based vaccines. Membranes are relatively inexpensive, and they provide much
faster separations with greater throughput and scalability than size exclusion chromatography
(SEC). Although additional studies will be needed to quantify the selectivity for different DNA
separations, the data obtained in this Chapter suggest that properly designed ultrafiltration
processes could potentially provide higher resolution separations of supercoiled plasmids than is
possible using currently available SEC resins, particularly for very large size plasmids.

144
Chapter 9
Conclusions and Recommendations for Future Work
9.1 Conclusions
There is growing interest in the use of plasmids for applications in DNA therapeutics,
including both gene therapy and DNA vaccination. The large dosage required for DNA
therapeutics has created a critical need for the development of cost-effective processes for large-
scale plasmid purification. Conventional separation methods, such as different modes of
chromatography, suffer from low binding capacity and significant mass transfer limitations due
to the large size of the plasmid DNA. In addition, the separation of open-circular and linear
plasmid isoforms from the desirable supercoiled isoform is particularly challenging since these
molecules have the same molecular weight and base sequence, with very similar size and surface
charge.
Membrane processes could provide an attractive alternative for industrial scale plasmid
DNA purification since they are easily scalable and only weakly affected by diffusional
limitations associated with the large size of the plasmids. Membranes have been widely used in
the biotechnology and pharmaceutical industries for primary clarification, concentration, and
formulation. Latulippe et al. 37 and Latulippe and Zydney 43 successfully demonstrated that
narrow pore size ultrafiltration membranes can also be used for high resolution purification of
different plasmid isoforms based on differences in their ability to elongate in the converging flow
field entering the membrane pores. The linear plasmid requires the smallest flow rate to be
sufficiently stretched to pass through narrow pores, followed by the supercoiled and then the

145
open-circular isoforms. Separation therefore can be achieved by operating at a filtrate flux
between the critical flux values for the specific isoforms.
There are two major bottlenecks limiting the performance of membrane systems in the
purification of plasmid DNA: (A) the limited selectivity that can be achieved between the
different isoforms, and (B) fouling of the ultrafiltration membranes due to the blockage of the
membrane pores (which reduces both he flux and the selectivity). The overall objectives of this
dissertation were:
I. Designing novel strategies to enhance the resolution of plasmid isoform
separation and / or control membrane fouling
II. Developing a more detailed fundamental understanding of the key factors
governing both the transmission of DNA through nanopores and membrane
fouling phenomena during plasmid ultrafiltration, including the effects of the
membrane structure and pore morphology, solution ionic conditions, size of
plasmid DNA etc.
The key findings from this dissertation are summarized as below.
Chapter 3 introduced and examined the idea of pre-conditioning, accomplished by pre-
elongating the DNA by passage through a region with large pore size, to minimize fouling and
enhance DNA separations. Data were obtained using asymmetric hollow fiber membranes, with
flow in either the normal or reverse orientation. Flow through the larger pore size region pre-
stretched the plasmid, leading to an increase in plasmid transmission and a significant reduction
in fouling. This pre-conditioning also provided a significant increase in selectivity for separation
of the linear and supercoiled isoforms. These results clearly demonstrate the potential for

146
dramatically increasing the performance of membrane systems for plasmid DNA separations by
controlling the pore morphology to pre-stretch the DNA before passing through the narrow pores
of an ultrafiltration membrane.
The data presented in Chapter 4 demonstrated that pre-conditioning using composite
membranes can also enhance the transmission of supercoiled DNA during ultrafiltration. Data
were obtained using a series of composite membranes generated by placing a larger pore size
microfiltration membrane on top of the skin layer of an ultrafiltration membrane. The increase in
plasmid transmission was found to be greatest when using an intermediate pore size for the upper
layer of the composite membranes. Upper layers with too large a pore size provided insufficient
stretching of the DNA while layers with too small a pore size gave minimal improvement in
performance compared to that of the ultrafiltration membrane alone. This also provided
opportunities to enhance the separation between the open-circular and supercoiled plasmid
isoforms. Several physical models were developed to help understand the effects of pre-
conditioning on DNA transmission. Further confirmation of these models is going to be obtained
using membranes with conically shaped pores. These results provide important insights into the
role of preconditioning in enhancing the performance of DNA ultrafiltration, while providing a
framework for the design and optimization of membranes specifically for plasmid DNA
separations.
Chapter 5 examined the enhancement in separation of the different plasmid isoforms that
could be achieved by proper selection of the solution ionic strength and ion type. Experiments
were performed with a 3.0 kbp plasmid using composite regenerated cellulose ultrafiltration
membranes. The transmission of the linear isoform was nearly independent of solution ionic
strength. In contrast, the transmission of the open-circular and supercoiled plasmids both

147
increased with increasing NaCl or MgCl2 concentration due to the change in plasmid size and
conformational flexibility. The effect of ionic strength was greatest for the supercoiled plasmid,
providing opportunities for enhanced purification of this therapeutically active isoform. This
behavior was confirmed using experiments performed with binary mixtures of the different
isoforms. These results clearly demonstrate the potential for enhancing the performance of
membrane systems for plasmid DNA separations by proper selection of the ionic conditions.
Chapter 6 discussed the effects of different levels of the polycation spermine on the
transmission of supercoiled, linear, and open-circular plasmid isoforms through small pore size
ultrafiltration membranes. Adding low concentrations (below 10 µM) of spermine to TE buffer
was found to have little effect on the transmission of all plasmid isoforms through the Biomax
300 kDa membranes. For supercoiled and linear plasmids, DNA condensation happened at a
threshold spermine concentration, above which transmission of the plasmid DNA dropped
rapidly with the membranes becoming nearly completely retentive to the plasmid. The amount of
spermine needed to induce DNA condensation increased with increasing NaCl concentration.
Once the plasmids were condensed into densely packed structures, they were unable to pass
through the narrow pore ultrafiltration membranes even at high filtrate flux, conditions that
would have readily elongated the DNA in the absence of any spermine. DNA condensation was
reduced in the presence of high concentrations of monovalent salts, potentially providing an
opportunity to “tune” the transmission of the DNA isoforms by proper of addition of spermine
and NaCl to the solutions.
Chapter 7 evaluated the effects of solution conditions on the fouling characteristics of
both supercoiled and linear plasmid DNA isoforms with different numbers of base pairs. Sieving
coefficient and filtrate flux data were analyzed using a model based on the partial blockage of the

148
membrane pores by trapped plasmids. Fouling increased dramatically at low ionic strength, with
the flux decline parameter for the 3.0 kbp plasmid in a 1 mM NaCl solution being an order of
magnitude greater than that in a 10 mM solution. Fouling was also most pronounced for the
larger 16.8 kbp plasmid, consistent with the greater probability of plasmid trapping at the pore
entrance. These results provide important insights into the development of membrane systems
for plasmid DNA filtration in different solution conditions.
The results presented in Chapter 8 demonstrated the potential of using ultrafiltration
membranes to separate supercoiled plasmids based on differences in their size (i.e., number of
base pairs). The Ultracel 100 kDa membrane showed a selectivity between the 3.0 and 16.8 kbp
plasmids as high as 30-fold, with similar behavior seen with the Biomax polyethersulfone
membrane. The reduction in transmission of the supercoiled plasmids with increasing chain
length was a direct result of the morphology of the supercoiled isoform; no significant affect of
plasmid size was seen during ultrafiltration of linear versions of the same plasmids. The
supercoiled isoforms adopt a branched structure due to the under-twisting of the DNA, with the
number of branches increasing, and the DNA transmission decreasing, with increasing chain
length. To our knowledge, this is the first quantitative demonstration of a size-based separation
of large plasmid DNA using ultrafiltration membranes.
Overall, the results from this dissertation provide a variety of strategies to effectively
enhance the performance of membrane systems for the ultrafiltration / separation of plasmid
DNA. The insights obtained from these studies provide a better understanding of the key
physical factors that determine the transmission of plasmid DNA through ultrafiltration
membranes and a guide to the systematic design of large scale plasmid purification processes.

149
9.2 Future recommendations
Our current studies on membrane ultrafiltration of plasmid DNA were mostly performed
in small scale systems (15 mL stirred cell) with a single plasmid isoform. Actual separations of
isoform mixtures can be accomplished in linearly-scalable tangential flow filtration modules
using a diafiltration mode of operation (with the more permeable plasmids effectively washed
through the membrane by the continuous addition of diafiltration buffer). This could potentially
allow much greater throughput than was seen in the normal flow filtration experiments
performed in stirred cells. For example, van Reis et al. 147 developed the use of high performance
tangential flow filtration (HPTFF) for large-scale separations of recombinant protein products,
which can be scaled to membrane areas of at least 100 m2.159 Future work on using TFF for the
separation of plasmid DNA isoforms would be focused on demonstrating that the approaches
developed previously for protein purification could be extended to the large scale production of
plasmid DNA.
Appropriate conditions for DNA separations could first be identified based on small scale
studies of the individual plasmid isoforms. A combination of strategies identified in this thesis
could then be applied to enhance the separation efficiency as well as minimize membrane
fouling, including the use of membranes with pore morphologies that effectively pre-stretch the
DNA. The diafiltration would begin at a relatively low filtrate flux (above the critical flux for the
linear isoform but below the critical flux for the supercoiled plasmid) to wash the linear plasmid
through the membrane. The flux would then be increased to allow the supercoiled plasmid to be
recovered in the permeate solution, while the least flexible open-circular plasmid is retained by
the membrane. The separation process could also be done using a multi-stage ultrafiltration
150
system with different modules operated using different pore size and / or filtrate flux to obtain
the desired separation.
The experimental studies described in this dissertation used pure plasmid DNA solutions
prepared by Aldevron following stringent specifications. Future studies with simulated (or
actual) cell lysate solutions are critical to determine the effect of additional impurities (such as
genomic DNA and host cell proteins) on the performance of membrane system for plasmid
purification. Initial experiments would likely be conducted with model systems using specific
proteins having a range of size (i.e., molecular weight) and surface charge (i.e., isoelectric point).
Subsequent work would examine the purification of plasmids directly from E. Coli cell lysate.
Depth filtration would likely be used to remove large cell debris. Filtration experiments would
then be performed over a range of filtration conditions, with the smaller host cell proteins
removed in the permeate while the large plasmids are retained by the membrane. A variety of
filtration conditions would likely need to be examined, including a range of membrane pore size
and materials, solution pH, and salt concentrations, with the goal of minimizing membrane
fouling while enhancing the separation performance.
In addition to DNA therapeutics, numerous types of RNA-based therapeutics have
emerged and are under extensive clinical development. RNA therapeutics exploit various
oligonucleotides that bind to RNA by base pairing in a sequence-specific manner yet have
different mechanisms of actions and effects 160. RNA-therapeutics include inhibitors of mRNA
translation (antisense), agents of RNA interference (RNAi), catalytically active RNA molecules
(ribozymes), and RNAs that bind proteins and other molecular ligands (aptamers) 161. Hundreds
of RNA-based therapeutics are currently under clinical investigation for diseases ranging from
genetic disorders to HIV infection to various cancers 162. RNAs are less stable than DNA, so

151
there are additional difficulties associated with their production and purification. RNA is a single
stranded nucleotide chain that shares many similar properties as other large biopolymers such as
DNA and polysaccharides. Unlike DNA ultrafiltration, transmission of polysaccharides through
ultrafiltration membrane is governed by concentration polarization effects 136. Future work
examining the transport mechanisms of RNA through narrow pore UF membranes would be of
considerable interest, both for developing a more fundamental understanding of nucleic acid
ultrafiltration and for developing new downstream processes for purification of novel RNA-
based therapeutics. This would likely include studies examining the effects of membrane
properties (e.g., pore size and pore morphology) and solution conditions (e.g., ionic strength and
ionic composition) on RNA ultrafiltration.
An interesting alternative to pressure-driven ultrafiltration would be to use an applied
electric field to drive the transport of the charged DNA molecules through the pores in UF
membranes. There have been extensive theoretical and experimental studies on the electrical
field driven translocation of single/double stranded DNA through nanopores. Kasianowicz et
al.163, Mathe et al.164, and Meller et al.165-166 examined the transport of single stranded DNA
through a nanometer size channel within a naturally-occurring membrane protein, with the rate
of transport determined by monitoring transient changes in ionic current. Li et al.167, Storm et
al.168, and Wanunu et al.169 studied the transport of double stranded DNA through solid state
nanopores, including the molecular dynamics involved in DNA translocation. A detailed
experimental analysis of electrically-driven UF processes for plasmid purification would provide
important insights into the underlying physics governing DNA transport and a basis for the
design of effective separations using this approach, both for small scale analytical separations as
well as the possibility of developing larger-scale electrically-driven separation processes. It

152
might even be possible to use a combination of convective flow and electric fields to provide
further improvements in membrane separation. In addition, membranes with different surface
charges can be produced by chemical modification, providing an additional control of DNA
transport by exploiting both intra- and inter-molecular electrostatic interactions.
Further studies should also be performed to better understand the fundamental
mechanisms controlling transport of plasmid DNA through the narrow pores in ultrafiltration
membranes. This would include the effects of pore size distribution and hydrodynamic
interactions between adjacent pores, both of which could be examined theoretically using
computational fluid dynamics simulations to evaluate the velocity profiles and extensional flow
field during filtration through model membranes consisting of an array of cylindrical pores with
different packing geometries and pore size distribution. The transport of DNA molecules in
membranes with well-defined pore dimensions and geometries can also be examined
experimentally by constructing various micro/nano-fluidic devices composed of slits, channels,
and arrays of posts 170. These micro/nano-fluidic devices would also provide opportunities to
study single DNA molecules in idealized environments rather than the bulk behavior averaged
over large numbers of DNA molecules as in membrane systems.

153
Bibliography
1. Mountain, A., Gene therapy: the first decade. Trends in Biotechnology 2000, 18 (3), 119-
128.
2. Verma, I. M.; Somia, N., Gene therapy-promises, problems and prospects. Nature 1997,
389 (6648), 239-242.
3. Ulmer, J. B.; Wahren, B.; Liu, M. A., Gene-based vaccines: Recent technical and clinical
advances. Trends Mol Med 2006, 12 (5), 216-22.
4. Ferraro, B.; Morrow, M. P.; Hutnick, N. A.; Shin, T. H.; Lucke, C. E.; Weiner, D. B.,
Clinical applications of DNA vaccines: Current progress. Clin Infect Dis 2011, 53 (3), 296-302.
5. Ylä-Herttuala, S., Endgame: Glybera finally recommended for approval as the first gene
therapy drug in the European union. Molecular Therapy 2012, 20 (10), 1831.
6. Schimmer, J.; Breazzano, S., Investor outlook: Rising from the ashes; GSK's European
approval of Strimvelis for ADA-SCID. Human Gene Therapy Clinical Development 2016, 27
(2), 57-61.
7. Bessis, N.; GarciaCozar, F. J.; Boissier, M. C., Immune responses to gene therapy
vectors: Influence on vector function and effector mechanisms. Gene Ther 2004, 11 Suppl 1,
S10-7.
8. Patil, S. D.; Rhodes, D. G.; Burgess, D. J., DNA-based therapeutics and DNA delivery
systems: A comprehensive review. The AAPS Journal 2005, 7 (1), E61-E77.
9. Niidome, T.; Huang, L., Gene therapy progress and prospects: Nonviral vectors. Gene
Ther 2002, 9 (24), 1647-52.
10. Schaffert, D.; Wagner, E., Gene therapy progress and prospects: Synthetic polymer-based
systems. Gene Therapy 2008, 15 (16), 1131-8.
154
11. Bodles-Brakhop, A. M.; Heller, R.; Draghia-Akli, R., Electroporation for the delivery of
DNA-based vaccines and immunotherapeutics: Current clinical developments. Mol Ther 2009,
17 (4), 585-92.
12. Herweijer, H.; Wolff, J. A., Progress and prospects: Naked DNA gene transfer and
therapy. Gene Ther 2003, 10 (6), 453-8.
13. Li, S. D.; Huang, L., Gene therapy progress and prospects: Non-viral gene therapy by
systemic delivery. Gene Ther 2006, 13 (18), 1313-9.
14. Rhoades, M.; Thomas, C., The P22 bacteriophage DNA molecule: II. Circular
intracellular forms. Journal of molecular biology 1968, 37 (1), 41IN357-56IN661.
15. Laundon, C. H.; Griffith, J. D., Curved helix segments can uniquely orient the topology
of supertwisted DNA. Cell 1988, 52 (4), 545-549.
16. Adrian, M.; ten Heggeler-Bordier, B.; Wahli, W.; Stasiak, A. Z.; Stasiak, A.; Dubochet,
J., Direct visualization of supercoiled DNA molecules in solution. The EMBO Journal 1990, 9
(13), 4551.
17. Boles, T. C.; White, J. H.; Cozzarelli, N. R., Structure of plectonemically supercoiled
DNA. Journal of molecular biology 1990, 213 (4), 931-951.
18. Bednar, J.; Furrer, P.; Stasiak, A.; Dubochet, J.; Egelman, E. H.; Bates, A. D., The twist,
writhe and overall shape of supercoiled DNA change during counterion-induced transition from
a loosely to a tightly interwound superhelix: Possible implications for DNA structure in vivo.
Journal of Molecular Biology 1994, 235 (3), 825-847.
19. Lyubchenko, Y. L.; Shlyakhtenko, L. S., Visualization of supercoiled DNA with atomic
force microscopy in situ. Proceedings of the National Academy of Sciences 1997, 94 (2), 496-
501.

155
20. Lyubchenko, Y. L.; Shlyakhtenko, L. S.; Gall, A. A., Atomic force microscopy imaging
and probing of DNA, proteins, and protein-DNA complexes: silatrane surface chemistry. DNA-
Protein Interactions: Principles and Protocols, Third Edition 2009, 337-351.
21. Klenin, K. V.; Vologodskii, A. V.; Anshelevich, V. V.; Dykhne, A. M.; Frank-
Kamenetskii, M. D., Computer simulation of DNA supercoiling. Journal of MolecularBiology
1991, 217 (3), 413-419.
22. Vologodskii, A. V.; Cozzarelli, N. R., Conformational and thermodynamic properties of
supercoiled DNA. Annual Review of Biophysics and Biomolecular Structure 1994, 23 (1), 609-
643.
23. Vologodskii, A. V.; Levene, S. D.; Klenin, K. V.; Frank-Kamenetskii, M.; Cozzarelli, N.
R., Conformational and thermodynamic properties of supercoiled DNA. Journal of Molecular
Biology 1992, 227 (4), 1224-1243.
24. Hammermann, M.; Brun, N.; Klenin, K. V.; May, R.; Tóth, K.; Langowski, J., Salt-
dependent DNA superhelix diameter studied by small angle neutron scattering measurements
and Monte Carlo simulations. Biophysical Journal 1998, 75 (6), 3057-3063.
25. Rybenkov, V. V.; Vologodskii, A. V.; Cozzarelli, N. R., The effect of ionic conditions on
the conformations of supercoiled DNA. I. sedimentation analysis1. Journal of Molecular Biology
1997, 267 (2), 299-311.
26. Wasserman, S. A.; Cozzarelli, N. R., Supercoiled DNA-directed knotting by T4
topoisomerase. Journal of Biological Chemistry 1991, 266 (30), 20567-20573.
27. Higgins, C. F.; Dorman, C. J.; Stirling, D. A.; Waddell, L.; Booth, I. R.; May, G.;
Bremer, E., A physiological role for DNA supercoiling in the osmotic regulation of gene
expression in S. typhimurium and E. coli. Cell 1988, 52 (4), 569-584.
156
28. Pruss, G. J.; Drlica, K., DNA supercoiling and prokaryotic transcription. Cell 1989, 56
(4), 521-523.
29. Sousa, F.; Prazeres, D. M.; Queiroz, J. A., Improvement of transfection efficiency by
using supercoiled plasmid DNA purified with arginine affinity chromatography. The Journal of
Gene Medicine 2009, 11 (1), 79-88.
30. Lahijani, R.; Hulley, G.; Soriano, G.; Horn, N. A.; Marquet, M., High-yield production of
pBR322-derived plasmids intended for human gene therapy by employing a temperature-
controllable point mutation. Human Gene Therapy 1996, 7 (16), 1971-1980.
31. Gonçalves, G. A.; Bower, D. M.; Prazeres, D. M.; Monteiro, G. A.; Prather, K. L.,
Rational engineering of Escherichia coli strains for plasmid biopharmaceutical manufacturing.
Biotechnology Journal 2012, 7 (2), 251-261.
32. Ghanem, A.; Healey, R.; Adly, F. G., Current trends in separation of plasmid DNA
vaccines: a review. Anal Chim Acta 2013, 760, 1-15.
33. Prather, K. J.; Sagar, S.; Murphy, J.; Chartrain, M., Industrial scale production of plasmid
DNA for vaccine and gene therapy: plasmid design, production, and purification. Enzyme and
Microbial Technology 2003, 33 (7), 865-883.
34. Ferreira, G. N.; Monteiro, G. A.; Prazeres, D. M.; Cabral, J. M., Downstream processing
of plasmid DNA for gene therapy and DNA vaccine applications. Trends in Biotechnology 2000,
18 (9), 380-388.
35. Stadler, J.; Lemmens, R.; Nyhammar, T., Plasmid DNA purification. J Gene Med 2004, 6
Suppl 1, S54-66.
36. Carnes, A.; Williams, J., Plasmid DNA manufacturing technology. Recent Patents on
Biotechnology 2007, 1 (2), 151-166.
157
37. Latulippe, D. R.; Ager, K.; Zydney, A. L., Flux-dependent transmission of supercoiled
plasmid DNA through ultrafiltration membranes. Journal of Membrane Science 2007, 294 (1-2),
169-177.
38. Van Reis, R.; Zydney, A., Membrane separations in biotechnology. Current Opinion in
Biotechnology 2001, 12 (2), 208-211.
39. Eon-Duval, A.; MacDuff, R. H.; Fisher, C. A.; Harris, M. J.; Brook, C., Removal of RNA
impurities by tangential flow filtration in an RNase-free plasmid DNA purification process.
Analytical Biochemistry 2003, 316 (1), 66-73.
40. Kong, S.; Aucamp, J.; Titchener-Hooker, N. J., Studies on membrane sterile filtration of
plasmid DNA using an automated multiwell technique. Journal of Membrane Science 2010, 353
(1-2), 144-150.
41. Brochard, F.; De Gennes, P., Dynamics of confined polymer chains. The Journal of
Chemical Physics 1977, 67 (1), 52-56.
42. Daoudi, S.; Brochard, F., Flows of flexible polymer solutions in pores. Macromolecules
1978, 11 (4), 751-758.
43. Latulippe, D. R.; Zydney, A. L., Elongational flow model for transmission of supercoiled
plasmid DNA during membrane ultrafiltration. Journal of Membrane Science 2009, 329 (1-2),
201-208.
44. Latulippe, D. R.; Zydney, A. L., Salt-induced changes in plasmid DNA transmission
through ultrafiltration membranes. Biotechnol Bioeng 2008, 99 (2), 390-8.
45. Latulippe, D. R.; Zydney, A. L., Separation of plasmid DNA isoforms by highly
converging flow through small membrane pores. J Colloid Interface Sci 2011, 357 (2), 548-53.
158
46. Latulippe, D. R.; Zydney, A. L., Size exclusion chromatography of plasmid DNA
isoforms. J Chromatogr A 2009, 1216 (35), 6295-302.
47. van Reis, R.; Zydney, A., Bioprocess membrane technology. Journal of Membrane
Science 2007, 297 (1), 16-50.
48. Borujeni, E. E.; Zydney, A. L., Membrane fouling during ultrafiltration of plasmid DNA
through semipermeable membranes. Journal of Membrane Science 2014, 450, 189-196.
49. Singer, V. L.; Jones, L. J.; Yue, S. T.; Haugland, R. P., Characterization of PicoGreen
reagent and development of a fluorescence-based solution assay for double-stranded DNA
quantitation. Analytical Biochemistry 1997, 249 (2), 228-238.
50. Van Reis, R. D., Tangential flow filtration process and apparatus. U.S. Patent 5,256,294
1993.
51. Mochizuki, S.; Zydney, A. L., Theoretical analysis of pore size distribution effects on
membrane transport. Journal of Membrane Science 1993, 82 (3), 211-227.
52. van Reis, R.; Saksena, S., Optimization diagram for membrane separations. Journal of
Membrane Science 1997, 129 (1), 19-29.
53. Zydney, A. L.; Ho, C. C., Effect of membrane morphology on system capacity during
normal flow microfiltration. Biotechnology and Bioengineering 2003, 83 (5), 537-543.
54. Mochizuki, S.; Zydney, A. L., Effect of protein adsorption on the transport characteristics
of asymmetric ultrafiltration membranes. Biotechnology Progress 1992, 8 (6), 553-561.
55. Deen, W., Hindered transport of large molecules in liquid‐filled pores. AIChE Journal
1987, 33 (9), 1409-1425.
56. Rao, S.; Zydney, A. L., Controlling protein transport in ultrafiltration using small charged
ligands. Biotechnology and Bioengineering 2005, 91 (6), 733-742.

159
57. Zeman, L. J.; Zydney, A. L., Microfiltration and Ultrafiltration: Principles and
Applications. M. Dekker: 1996.
58. Rao, S.; Zydney, A. L., High resolution protein separations using affinity ultrafiltration
with small charged ligands. Journal of Membrane Science 2006, 280 (1), 781-789.
59. Molek, J. R.; Zydney, A. L., Separation of PEGylated α-lactalbumin from unreacted
precursors and byproducts using ultrafiltration. Biotechnology Progress 2007, 23 (6), 1417-1424.
60. Affandy, A.; Keshavarz-Moore, E.; Versteeg, H. K., Application of filtration blocking
models to describe fouling and transmission of large plasmids DNA in sterile filtration. Journal
of Membrane Science 2013, 437, 150-159.
61. Arkhangelsky, E.; Sefi, Y.; Hajaj, B.; Rothenberg, G.; Gitis, V., Kinetics and mechanism
of plasmid DNA penetration through nanopores. Journal of Membrane Science 2011, 371 (1),
45-51.
62. Dai, L.; Renner, C. B.; Doyle, P. S., Metastable tight knots in semiflexible chains.
Macromolecules 2014, 47 (17), 6135-6140.
63. Dai, L.; van der Maarel, J.; Doyle, P. S., Extended de Gennes regime of DNA confined in
a nanochannel. Macromolecules 2014, 47 (7), 2445-2450.
64. Dorfman, K. D.; King, S. B.; Olson, D. W.; Thomas, J. D.; Tree, D. R., Beyond gel
electrophoresis: microfluidic separations, fluorescence burst analysis, and DNA stretching. Chem
Rev 2013, 113 (4), 2584-667.
65. Cao, H.; Tegenfeldt, J. O.; Austin, R. H.; Chou, S. Y., Gradient nanostructures for
interfacing microfluidics and nanofluidics. Applied Physics Letters 2002, 81 (16), 3058-3060.

160
66. Cao, H.; Yu, Z.; Wang, J.; Tegenfeldt, J. O.; Austin, R. H.; Chen, E.; Wu, W.; Chou, S.
Y., Fabrication of 10 nm enclosed nanofluidic channels. Applied Physics Letters 2002, 81 (1),
174-176.
67. Teclemariam, N. P.; Beck, V. A.; Shaqfeh, E. S.; Muller, S. J., Dynamics of DNA
polymers in post arrays: Comparison of single molecule experiments and simulations.
Macromolecules 2007, 40 (10), 3848-3859.
68. Balducci, A.; Doyle, P., Conformational preconditioning by electrophoresis of DNA
through a finite obstacle array. Macromolecules 2008, 41 (14), 5485-5492.
69. Viero, Y.; He, Q.; Bancaud, A., Hydrodynamic manipulation of DNA in nanopost arrays:
Unhooking dynamics and size separation. Small 2011, 7 (24), 3508-3518.
70. Larson, J. W.; Yantz, G. R.; Zhong, Q.; Charnas, R.; D'Antoni, C. M.; Gallo, M. V.;
Gillis, K. A.; Neely, L. A.; Phillips, K. M.; Wong, G. G.; Gullans, S. R.; Gilmanshin, R., Single
DNA molecule stretching in sudden mixed shear and elongational microflows. Lab on a Chip
2006, 6 (9), 1187-99.
71. Wong, P. K.; Lee, Y.-K.; Ho, C.-M., Deformation of DNA molecules by hydrodynamic
focusing. Journal of Fluid Mechanics 2003, 497, 55-65.
72. Chen, Q.; Diao, S.; Wu, C., How does a supercoiled DNA chain pass through a small
conical glass pore? Soft Matter 2012, 8 (20), 5451-5458.
73. Perkins, T. T.; Quake, S. R.; Smith, D. E.; Chu, S., Relaxation of a single DNA molecule
observed by optical microscopy. Science-AAAS-Weekly Paper Edition-including Guide to
Scientific Information 1994, 264 (5160), 822-825.
74. Chan, E. Y.; Goncalves, N. M.; Haeusler, R. A.; Hatch, A. J.; Larson, J. W.; Maletta, A.
M.; Yantz, G. R.; Carstea, E. D.; Fuchs, M.; Wong, G. G., DNA mapping using microfluidic

161
stretching and single-molecule detection of fluorescent site-specific tags. Genome Research
2004, 14 (6), 1137-1146.
75. Latulippe, D. R.; Zydney, A. L., Radius of gyration of plasmid DNA isoforms from static
light scattering. Biotechnol Bioeng 2010, 107 (1), 134-42.
76. Borujeni, E. E.; Li, Y.; Zydney, A. L., Application of periodic backpulsing to reduce
membrane fouling during ultrafiltration of plasmid DNA. Journal of Membrane Science 2015,
473, 102-108.
77. Tegenfeldt, J. O.; Bakajin, O.; Chou, C.-F.; Chan, S. S.; Austin, R.; Fann, W.; Liou, L.;
Chan, E.; Duke, T.; Cox, E. C., Near-field scanner for moving molecules. Physical Review
Letters 2001, 86 (7), 1378.
78. Lau, W. J.; Ismail, A. F.; Misdan, N.; Kassim, M. A., A recent progress in thin film
composite membrane: A review. Desalination 2012, 287, 190-199.
79. van Reis, R.; Zydney, A., Bioprocess membrane technology. Journal of Membrane
Science 2007, 297 (1-2), 16-50.
80. Cheryan, M., Ultrafiltration and Microfiltration Handbook. CRC press: 1998.
81. Harrell, C. C.; Siwy, Z. S.; Martin, C. R., Conical nanopore membranes: Controlling the
nanopore shape. Small 2006, 2 (2), 194-8.
82. Scopece, P.; Baker, L. A.; Ugo, P.; Martin, C. R., Conical nanopore membranes: Solvent
shaping of nanopores. Nanotechnology 2006, 17 (15), 3951-3956.
83. Apel, P. Y.; Korchev, Y. E.; Siwy, Z.; Spohr, R.; Yoshida, M., Diode-like single-ion
track membrane prepared by electro-stopping. Nuclear Instruments and Methods in Physics
Research Section B: Beam Interactions with Materials and Atoms 2001, 184 (3), 337-346.

162
84. Ho, C.-C.; Zydney, A. L., Effect of membrane morphology on the initial rate of protein
fouling during microfiltration. Journal of Membrane Science 1999, 155 (2), 261-275.
85. Ho, C.-C.; Zydney, A. L., Protein fouling of asymmetric and composite microfiltration
membranes. Industrial & Engineering ChemistryRresearch 2001, 40 (5), 1412-1421.
86. Ho, C.-C.; Zydney, A. L., Measurement of membrane pore interconnectivity. Journal of
Membrane Science 2000, 170 (1), 101-112.
87. Spohr, R.; Apel, Y. P.; Korchev, Y.; Siwy, Z.; Yoshida, M., Method for etching at least
one ion track to a pore in a membrane and electrolyte cell for preparing the membrane. U.S.
Patent 7,001,501, 2006.
88. Smith, D. E.; Babcock, H. P.; Chu, S., Single-polymer dynamics in steady shear flow.
Science 1999, 283 (5408), 1724-1727.
89. Randall, G. C.; Doyle, P. S., DNA deformation in electric fields: DNA driven past a
cylindrical obstruction. Macromolecules 2005, 38 (6), 2410-2418.
90. Zimm, B. H., Dynamics of polymer molecules in dilute solution: viscoelasticity, flow
birefringence and dielectric loss. The Journal of Chemical Physics 1956, 24 (2), 269-278.
91. Smith, D. E.; Chu, S., Response of flexible polymers to a sudden elongational flow.
Science 1998, 281 (5381), 1335-1340.
92. Larson, R., The role of molecular folds and ‘pre-conditioning’in the unraveling of
polymer molecules during extensional flow. Journal of Non-Newtonian Fluid Mechanics 2000,
94 (1), 37-45.
93. Perkins, T. T.; Smith, D. E.; Chu, S., Single polymer dynamics in an elongational flow.
Science 1997, 276 (5321), 2016-2021.
163
94. Hur, J. S.; Shaqfeh, E. S.; Larson, R. G., Brownian dynamics simulations of single DNA
molecules in shear flow. Journal of Rheology 2000, 44 (4), 713-742.
95. Larson, R.; Perkins, T.; Smith, D.; Chu, S., Hydrodynamics of a DNA molecule in a flow
field. Physical Review E 1997, 55 (2), 1794.
96. Babcock, H. P.; Teixeira, R. E.; Hur, J. S.; Shaqfeh, E. S.; Chu, S., Visualization of
molecular fluctuations near the critical point of the coil− stretch transition in polymer elongation.
Macromolecules 2003, 36 (12), 4544-4548.
97. Teixeira, R. E.; Babcock, H. P.; Shaqfeh, E. S.; Chu, S., Shear thinning and tumbling
dynamics of single polymers in the flow-gradient plane. Macromolecules 2005, 38 (2), 581-592.
98. Harrell, C. C.; Lee, S. B.; Martin, C. R., Synthetic single-nanopore and nanotube
membranes. Analytical Chemistry 2003, 75 (24), 6861-6867.
99. Borochov, N.; Eisenberg, H.; Kam, Z., Dependence of DNA conformation on the
concentration of salt. Biopolymers 1981, 20 (1), 231-235.
100. Cherny, D. I.; Jovin, T. M., Electron and scanning force microscopy studies of alterations
in supercoiled DNA tertiary structure. Journal of Molecular Biology 2001, 313 (2), 295-307.
101. Rybenkov, V. V.; Vologodskii, A. V.; Cozzarelli, N. R., The effect of ionic conditions on
DNA helical repeat, effective diameter and free energy of supercoiling. Nucleic Acids Research
1997, 25 (7), 1412-1418.
102. Kong, S.; Titchener-Hooker, N.; Levy, M. S., Plasmid DNA processing for gene therapy
and vaccination: Studies on the membrane sterilisation filtration step. Journal of Membrane
Science 2006, 280 (1-2), 824-831.

164
103. Li, Y.; Borujeni, E. E.; Zydney, A. L., Use of preconditioning to control membrane
fouling and enhance performance during ultrafiltration of plasmid DNA. Journal of Membrane
Science 2015, 479, 117-122.
104. Tweedie, J. W.; Stowell, K. M., Quantification of DNA by agarose gel electrophoresis
and analysis of the topoisomers of plasmid and M13 DNA following treatment with a restriction
endonuclease or DNA topoisomerase I. Biochemistry and Molecular Biology Education 2005, 33
(1), 28-33.
105. Hammermann, M.; Steinmaier, C.; Merlitz, H.; Kapp, U.; Waldeck, W.; Chirico, G.;
Langowski, J., Salt effects on the structure and internal dynamics of superhelical DNAs studied
by light scattering and Brownian dynamics. Biophysical Journal 1997, 73 (5), 2674-2687.
106. Hagerman, P. J., Flexibility of DNA. Annual Review of Biophysics and Biophysical
Chemistry 1988, 17 (1), 265-286.
107. Shlyakhtenko, L. S.; Miloseska, L.; Potaman, V. N.; Sinden, R. R.; Lyubchenko, Y. L.,
Intersegmental interactions in supercoiled DNA: atomic force microscope study.
Ultramicroscopy 2003, 97 (1), 263-270.
108. Rybenkov, V. V.; Cozzarelli, N. R.; Vologodskii, A. V., Probability of DNA knotting and
the effective diameter of the DNA double helix. Proceedings of the National Academy of
Sciences 1993, 90 (11), 5307-5311.
109. Rybenkov, V. V.; Vologodskii, A. V.; Cozzarelli, N. R., The effect of ionic conditions on
the conformations of supercoiled DNA. I. Sedimentation analysis. Journal of Molecular Biology
1997, 267 (2), 299-311.

165
110. Rybenkov, V. V.; Vologodskii, A. V.; Cozzarelli, N. R., The effect of ionic conditions on
the conformations of supercoiled DNA. II. Equilibrium catenation. Journal of Molecular Biology
1997, 267 (2), 312-323.
111. Stigter, D., Interactions of highly charged colloidal cylinders with applications to double‐
stranded DNA. Biopolymers 1977, 16 (7), 1435-1448.
112. Kusano, T.; Berberich, T.; Tateda, C.; Takahashi, Y., Polyamines: Essential factors for
growth and survival. Planta 2008, 228 (3), 367-381.
113. Peng, H. F.; Jackson, V., In vitro studies on the maintenance of transcription-induced
stress by histones and polyamines. Journal of Biological Chemistry 2000, 275 (1), 657-668.
114. Sato, Y. T.; Hamada, T.; Kubo, K.; Yamada, A.; Kishida, T.; Mazda, O.; Yoshikawa, K.,
Folding transition into a loosely collapsed state in plasmid DNA as revealed by single-molecule
observation. FEBS Lett 2005, 579 (14), 3095-9.
115. Ma, C.; Bloomfield, V. A., Condensation of supercoiled DNA induced by MnCl2.
Biophysical Journal 1994, 67 (4), 1678-1681.
116. Tabor, H., The protective effect of spermine and other polyamines against heat
denaturation of deoxyribonucleic acid. Biochemistry 1962, 1 (3), 496-501.
117. Ha, H. C.; Sirisoma, N. S.; Kuppusamy, P.; Zweier, J. L.; Woster, P. M.; Casero, R. A.,
The natural polyamine spermine functions directly as a free radical scavenger. Proceedings of
the National Academy of Sciences 1998, 95 (19), 11140-11145.
118. Ouameur, A. A.; Tajmir-Riahi, H.-A., Structural analysis of DNA interactions with
biogenic polyamines and cobalt (III) hexamine studied by Fourier transform infrared and
capillary electrophoresis. Journal of Biological Chemistry 2004, 279 (40), 42041-42054.
166
119. Jain, S.; Zon, G.; Sundaralingam, M., Base only binding of spermine in the deep groove
of the A-DNA octamer d (GTGTACAC). Biochemistry 1989, 28 (6), 2360-2364.
120. Tari, L. W.; Secco, A. S., Base-pair opening and spermine binding—B-DNA features
displayed in the crystal structure of a gal operon fragment: implications for protein-DNA
recognition. Nucleic Acids Research 1995, 23 (11), 2065-2073.
121. Shao, Q.; Goyal, S.; Finzi, L.; Dunlap, D., Physiological levels of salt and polyamines
favor writhe and limit twist in DNA. Macromolecules 2012, 45 (7), 3188-3196.
122. Murphy, J. C.; Fox, G. E.; Willson, R. C., Enhancement of anion-exchange
chromatography of DNA using compaction agents. Journal of Chromatography A 2003, 984 (2),
215-221.
123. Wilson, R. W.; Bloomfield, V. A., Counterion-induced condensation of deoxyribonucleic
acid. A light-scattering study. Biochemistry 1979, 18 (11), 2192-2196.
124. Manning, G. S., The molecular theory of polyelectrolyte solutions with applications to
the electrostatic properties of polynucleotides. Quarterly Reviews of Biophysics 1978, 11 (02),
179-246.
125. Bancroft, D.; Williams, L. D.; Rich, A.; Egli, M., The low-temperature crystal structure
of the pure-spermine form of Z-DNA reveals binding of a spermine molecule in the minor
groove. Biochemistry 1994, 33 (5), 1073-1086.
126. Chattoraj, D. K.; Gosule, L. C.; Schellman, J. A., DNA condensation with polyamines: II.
Electron microscopic studies. Journal of Molecular Biology 1978, 121 (3), 327-337.
127. Lin, Z.; Wang, C.; Feng, X.; Liu, M.; Li, J.; Bai, C., The observation of the local ordering
characteristics of spermidine-condensed DNA: atomic force microscopy and polarizing
microscopy studies. Nucleic Acids Research 1998, 26 (13), 3228-3234.

167
128. Vijayanathan, V.; Thomas, T.; Shirahata, A.; Thomas, T., DNA condensation by
polyamines: A laser light scattering study of structural effects. Biochemistry 2001, 40 (45),
13644-13651.
129. Gosule, L. C.; Schellman, J. A., Compact form of DNA induced by spermidine. Nature
1976, 259 (5541), 333-335.
130. Hoopes, B. C.; McClure, W. R., Studies on the selectivity of DNA precipitation by
spermine. Nucleic Acids Research 1981, 9 (20), 5493-5504.
131. Toma, A. C.; de Frutos, M.; Livolant, F.; Raspaud, E., DNA condensed by protamine: a
"short" or "long" polycation behavior. Biomacromolecules 2009, 10 (8), 2129-34.
132. Kahn, D. W.; Butler, M. D.; Cohen, D. L.; Gordon, M.; Kahn, J. W.; Winkler, M. E.,
Purification of plasmid DNA by tangential flow filtration. Biotechnology and Bioengineering
2000, 69 (1), 101-106.
133. Chan, R.; Chen, V., Characterization of protein fouling on membranes: opportunities and
challenges. Journal of Membrane Science 2004, 242 (1), 169-188.
134. Hadidi, M.; Zydney, A. L., Fouling behavior of zwitterionic membranes: Impact of
electrostatic and hydrophobic interactions. Journal of Membrane Science 2014, 452, 97-103.
135. Palecek, S. P.; Zydney, A. L., Intermolecular electrostatic interactions and their effect on
flux and protein deposition during protein filtration. Biotechnology Progress 1994, 10 (2), 207-
213.
136. Hadidi, M.; Buckley, J. J.; Zydney, A. L., Ultrafiltration behavior of bacterial
polysaccharides used in vaccines. Journal of Membrane Science 2015, 490, 294-300.
137. Li, Y.; Butler, N.; Zydney, A. L., Size-based separation of supercoiled plasmid DNA
using ultrafiltration. J Colloid Interface Sci 2016, 472, 195-201.

168
138. Meyers, J. A.; Sanchez, D.; Elwell, L. P.; Falkow, S., Simple agarose gel electrophoretic
method for the identification and characterization of plasmid deoxyribonucleic acid. Journal of
Bacteriology 1976, 127 (3), 1529-1537.
139. Viovy, J.-L., Electrophoresis of DNA and other polyelectrolytes: Physical mechanisms.
Reviews of Modern Physics 2000, 72 (3), 813.
140. Clewell, D. B.; Helinski, D. R., Supercoiled circular DNA-protein complex in
Escherichia coli: purification and induced conversion to an open circular DNA form.
Proceedings of the National Academy of Sciences 1969, 62 (4), 1159-1166.
141. Diogo, M.; Queiroz, J.; Prazeres, D., Chromatography of plasmid DNA. Journal of
Chromatography A 2005, 1069 (1), 3-22.
142. Rathore, A.; Velayudhan, A., Scale-up and optimization in preparative chromatography:
principles and biopharmaceutical applications. CRC Press: 2002; Vol. 88.
143. Prazeres, D. M.; Ferreira, G. N.; Monteiro, G. A.; Cooney, C. L.; Cabral, J. M., Large-
scale production of pharmaceutical-grade plasmid DNA for gene therapy: problems and
bottlenecks. Trends in Biotechnology 1999, 17 (4), 169-174.
144. McClung, J. K.; Gonzales, R. A., Purification of plasmid DNA by fast protein liquid
chromatography on Superose 6 preparative grade. Analytical Biochemistry 1989, 177 (2), 378-
382.
145. Raymond, G. J.; Bryant, P. K.; Nelson, A.; Johnson, J. D., Large-scale isolation of
covalently closed circular DNA using gel filtration chromatography. Analytical Biochemistry
1988, 173 (1), 125-133.
146. Kurnik, R. T.; Yu, A. W.; Blank, G. S.; Burton, A. R.; Smith, D.; Athalye, A. M.; van
Reis, R., Buffer exchange using size exclusion chromatography, countercurrent dialysis, and

169
tangential flow filtration: Models, development, and industrial application. Biotechnology and
Bioengineering 1995, 45 (2), 149-157.
147. van Reis, R.; Gadam, S.; Frautschy, L. N.; Orlando, S.; Goodrich, E. M.; Saksena, S.;
Kuriyel, R.; Simpson, C. M.; Pearl, S.; Zydney, A. L., High performance tangential flow
filtration. Biotechnology and Bioengineering 1997, 56 (1), 71-82.
148. Sakaue, T.; Raphaël, E.; De Gennes, P.-G.; Brochard-Wyart, F., Flow injection of
branched polymers inside nanopores. EPL (Europhysics Letters) 2005, 72 (1), 83.
149. Ding, M.; Duan, X.; Lu, Y.; Shi, T., Flow-induced ring polymer ranslocation through
nanopores. Macromolecules 2015, 48 (16), 6002-6007.
150. Freed, K. F.; Wu, C., Comparison of calculated and measured critical flow rates for
dragging linear polymer chains through a small cylindrical ube. Macromolecules 2011, 44 (24),
9863-9866.
151. Lu, M.; Guo, Q.; Marky, L. A.; Seeman, N. C.; Kallenbach, N. R., Thermodynamics of
DNA branching. Journal of Molecular Biology 1992, 223 (3), 781-789.
152. Marko, J. F.; Siggia, E. D., Statistical mechanics of supercoiled DNA. Physical Review E
1995, 52 (3), 2912-2938.
153. Fathizadeh, A.; Schiessel, H.; Ejtehadi, M. R., Molecular dynamics simulation of
supercoiled DNA rings. Macromolecules 2015, 48 (1), 164-172.
154. Wu, C.; Li, L., Unified description of transportation of polymer chains with different
topologies through a small cylindrical pore. Polymer 2013, 54 (5), 1463-1465.
155. Li, L.; He, C.; He, W.; Wu, C., How does a hyperbranched chain pass through a
nanopore? Macromolecules 2012, 45 (18), 7583-7589.

170
156. Ge, H.; Pispas, S.; Wu, C., How does a star chain (nanooctopus) crawl through a
nanopore? Polymer Chemistry 2011, 2 (5), 1071-1076.
157. Ge, H.; Wu, C., Separation of linear and star chains by a nanopore. Macromolecules
2010, 43 (21), 8711-8713.
158. Borujeni, E. E.; Zydney, A. L., Separation of plasmid DNA isoforms using centrifugal
ultrafiltration. Biotechniques 2012, 53 (1), 49-56.
159. van Reis, R.; Goodrich, E. M.; Yson, C. L.; Frautschy, L. N.; Dzengeleski, S.; Lutz, H.,
Linear scale ultrafiltration. Biotechnology and Bioengineering 1997, 55 (5), 737-746.
160. Kole, R.; Krainer, A. R.; Altman, S., RNA therapeutics: beyond RNA interference and
antisense oligonucleotides. Nat Rev Drug Discov 2012, 11 (2), 125-40.
161. Burnett, J. C.; Rossi, J. J., RNA-based therapeutics: Current progress and future
prospects. Chem Biol 2012, 19 (1), 60-71.
162. Chery, J.; Näär, A., RNA therapeutics: RNAi and antisense mechanisms and clinical
applications. Postdoc Journal: A Journal of Postdoctoral Research andPpostdoctoral Affairs
2016, 4 (7), 35.
163. Kasianowicz, J. J.; Brandin, E.; Branton, D.; Deamer, D. W., Characterization of
individual polynucleotide molecules using a membrane channel. Proceedings of the National
Academy of Sciences 1996, 93 (24), 13770-13773.
164. Mathé, J.; Aksimentiev, A.; Nelson, D. R.; Schulten, K.; Meller, A., Orientation
discrimination of single-stranded DNA inside the α-hemolysin membrane channel. Proceedings
of the National Academy of Sciences of the United States of America 2005, 102 (35), 12377-
12382.

171
165. Meller, A.; Nivon, L.; Branton, D., Voltage-driven DNA translocations through a
nanopore. Phys Rev Lett 2001, 86 (15), 3435-8.
166. Meller, A., Dynamics of polynucleotide transport through nanometre-scale pores. Journal
of Physics: Condensed Matter 2003, 15 (17), R581.
167. Li, J.; Gershow, M.; Stein, D.; Brandin, E.; Golovchenko, J. A., DNA molecules and
configurations in a solid-state nanopore microscope. Nature Materials 2003, 2 (9), 611-615.
168. Storm, A. J.; Storm, C.; Chen, J.; Zandbergen, H.; Joanny, J.-F.; Dekker, C., Fast DNA
translocation through a solid-state nanopore. Nano Letters 2005, 5 (7), 1193-1197.
169. Wanunu, M.; Sutin, J.; McNally, B.; Chow, A.; Meller, A., DNA translocation governed
by interactions with solid-state nanopores. Biophysical Journal 2008, 95 (10), 4716-4725.
170. Levy, S. L.; Craighead, H. G., DNA manipulation, sorting, and mapping in nanofluidic
systems. Chem Soc Rev 2010, 39 (3), 1133-52.
VITA Ying Li
EDUCATION
The Pennsylvania State University, Chemical Engineering, PhD Candidate Aug. 2012-present
The National University of Singapore, Chemical Engineering, B.S (1st Class Honor) May 2012
AWARDS AND HONORS
MilliporeSigma Life Science Award in Bioseparations (2016)
Air Products Fellowship (2016)
American Institute of Chemical Engineers (AIChE) Separations Division Graduate Student Research
Award (2015)
American Chemical Society (ACS) Biochemical Technology (BIOT) Travel Award (2016)
North America Membrane Society (NAMS) Student Travel Award (2014)
Dean’s List, Department of Chemical Engineering, National University of Singapore
Singapore MIT Alliance Research Fellowship (2010)
PUBLICATIONS
Li, Ying, Ehsan Espah Borujeni, and Andrew L. Zydney. "Use of preconditioning to control membrane
fouling and enhance performance during ultrafiltration of plasmid DNA." Journal of Membrane Science
479 (2015): 117-122.
Borujeni Ehsan Espah, Ying Li, and Andrew L. Zydney. "Application of periodic backpulsing to reduce
membrane fouling during ultrafiltration of plasmid DNA." Journal of Membrane Science 473 (2015): 102-
108.
Li, Ying, David Currie, and Andrew L. Zydney. "Enhanced purification of plasmid DNA isoforms by
exploiting ionic strength effects during ultrafiltration." Biotechnology and Bioengineering 113.4 (2016):
783-789. – featured as Spotlight.
Li, Ying, Neil Butler, and Andrew L. Zydney. “Size based separation of supercoiled plasmid DNA using
ultrafiltration.” Journal of Colloid and Interface Science (2016): 195-201.
Li, Ying, Kuangzheng Zhu, and Andrew L. Zydney. “Effects of ionic conditions on membrane fouling
during ultrafitlration of plasmid DNA”. Separation and Purification Technology (2017):176, 287-293
Anirudh Nambiar, Ying Li and Andrew L. Zydney. “Countercurrent Staged Diafiltration for Formulation
of High Value Proteins. ” Submitted to Biotechnology and Bioengineering (2017)
CONFERENCE PRESENTATIONS
Ying Li, Ehsan Espah Borujeni, and Andrew L. Zydney. 24th Annual North American Membrane Society
Meeting, Houston, TX, June 2014 (presentation and poster)
Ying Li, Ehsan Espah Borujeni, and Andrew L. Zydney. Membranes: Materials & Processes, Gordon
Research Seminar, New London, NH, July 2014 (poster)
Ying Li and Andrew L. Zydney. 2015 AIChE annual meeting, Salt Lake City, UT, November 2015 (2
presentations) – featured as Best Presentation in the session.
Ying Li and Andrew L. Zydney. 251st ACS annual meeting, San Diego, CA, March 2016 (presentation).
Ying Li and Andrew L. Zydney. 2016 AIChE annual meeting, San Francisco, November 2016
(presentation).
Ying Li, Anirudh Nambiar, and Andrew L. Zydney. 252nd ACS annual meeting, San Francisco, CA, April
2017 (presentation).