Embed Size (px)
Citation preview

Supplementary Information
Supplementary Figures
Supplementary Figure 1 | Activity and framework aluminum coordination upon copper loading. Total
yield of methane oxidation as a function of Cu concentrate on and the concentration of tetrahedrally
coordinated aluminum acting as ion exchange site for Cu2+
with total yield for a series of Cu-MOR with
Si/Al =21 (b). * The slope of 0.71 indicates an exchange stoichiometry of 2/3 meaning that 2 H+ are
substituted by 3 Cu2+
. The offset of 25 µmol/g shows slight dealumination of framework Al (~5%) during
Cu-exchange. ** The slope of 0.31 indicates that 3 Cu centers are involved in the oxidation of one
methane molecule.
y = 0.71x + 25
y = 0.31x
0.0 0.1 0.2 0.3 0.4 0.5 0.6 0.7 0.8
0
50
100
150
200
250
300
0 100 200 300 400 500 600
consumed BAS
total yield
Co
nce
ntr
atio
n(µ
mo
lg
-1)
Cu concentration (µmol)
Cu/AlF ratio
**
**

Supplementary Figure 2 | Deconvoluted infrared spectra of H-MOR. Infrared spectra of the OH
stretching vibrations of the BAS of H-MOR after activation at 723 K (a) and during adsorption of n-
hexane at 303 K (b). BAS are deconvoluted in bands attributed to main channel OH (3,612 cm-1
), side
pocket OH stretching vibrations (3,590 cm-1
) and perturbed O-H stretching vibrations (3,500 cm-1
).
0
0.1
0.2
0.3
0.4
0.5
0.6
0.7
0.8
330034003500360037003800
measured
Fit
3612 cm-1
3590 cm-1
3500 cm-1
Wavenumber (cm-1)
0
0.1
0.2
0.3
0.4
0.5
0.6
0.7
0.8
330034003500360037003800
measured
Fit
3612 cm-1
3590 cm-1
3500 cm-1
Wavenumber (cm-1)
Ab
so
rba
nce
(a.u
)
Ab
so
rba
nce
(a.u
)
a b

Supplementary Figure 3 | Infrared spectroscopic quantification of Brønsted acid sites in Cu-MOR. Plot
of BAS concentration quantified by OH stretching vibrations (3,605 cm-1
) of the BAS of H-MOR after
activation at 723 K and quantified by vibrational band of the pyridinium ion after adsorption of pyridine
(1,545 cm-1
). * The gap between the BAS concentration quantified by OH stretching intensity and
pyridine adsorption is due to BAS in the bottom of the side pockets which are inaccessible to pyridine.
The slopes of -0.68 and -0.71 respectively indicate that 2 H+ are exchanged for 3 Cu
2+ in the pore mouth of
the side pockets, which are accessible for pyridine.
BA
S c
once
ntr
ation
(µm
olg
-1)

Supplementary Figure 4 | Ab initio thermodynamic analysis. Reaction free energy as a function of water
and oxygen chemical potential (a) and 2D projection of the lowest free energy CuxOmHn species in MOR
supercell (ΔГ (eV/U.C.), cf. equation. (1)) as a function of oxygen chemical potential ( ) and water
chemical potential ( ). and are translated into pressure scales at T = 700 K (b); The
conditions of our experiments (1 atm O2, 10 ppm H2O) and consequently the location of the activated Cu-
MOR are marked as white dot.
O +
H O + 𝑥(CuO) + 4H −MOR ⇋ Cu O H /MOR (1)
a
b
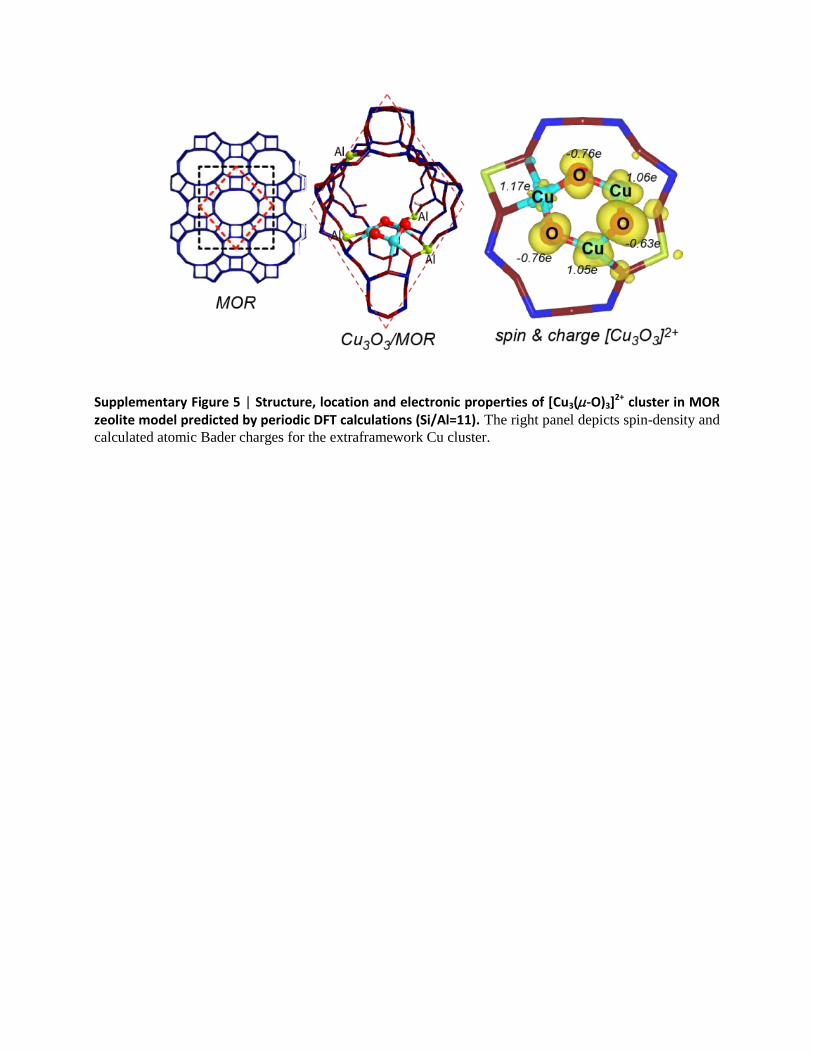
Supplementary Figure 5 | Structure, location and electronic properties of [Cu3(-O)3]2+ cluster in MOR
zeolite model predicted by periodic DFT calculations (Si/Al=11). The right panel depicts spin-density and
calculated atomic Bader charges for the extraframework Cu cluster.
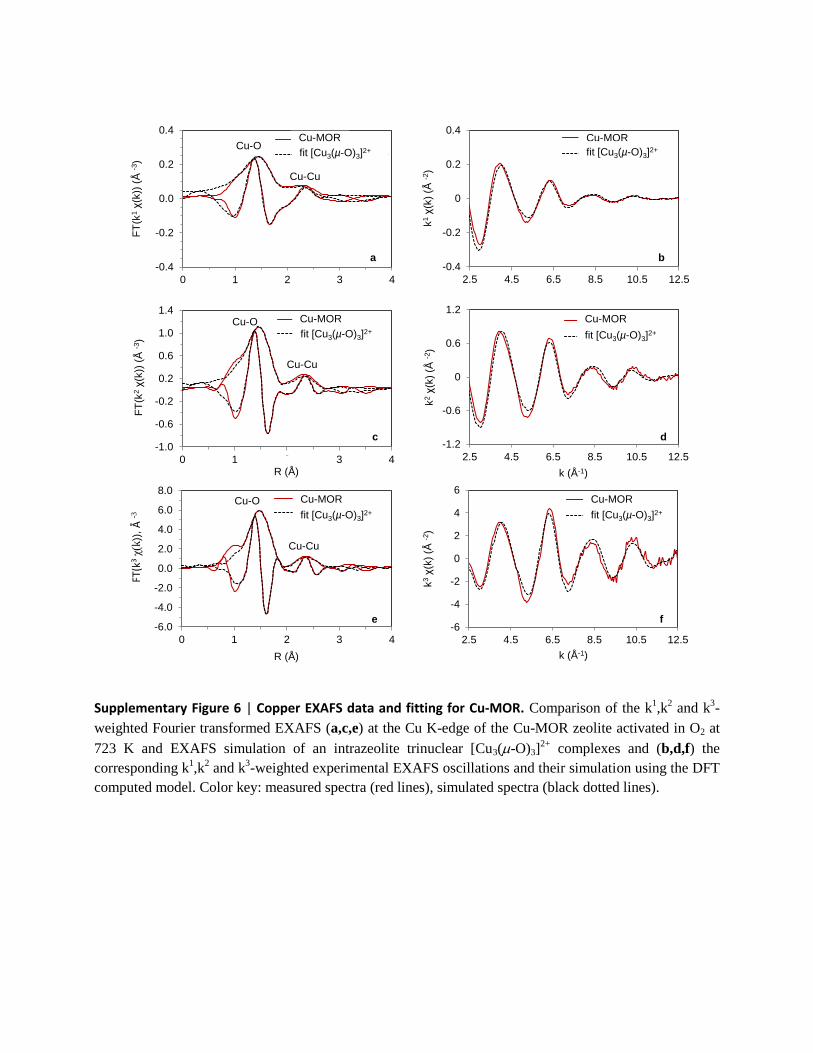
Supplementary Figure 6 | Copper EXAFS data and fitting for Cu-MOR. Comparison of the k1,k
2 and k
3-
weighted Fourier transformed EXAFS (a,c,e) at the Cu K-edge of the Cu-MOR zeolite activated in O2 at
723 K and EXAFS simulation of an intrazeolite trinuclear [Cu3(-O)3]2+
complexes and (b,d,f) the
corresponding k1,k
2 and k
3-weighted experimental EXAFS oscillations and their simulation using the DFT
computed model. Color key: measured spectra (red lines), simulated spectra (black dotted lines).
-1.0
-0.6
-0.2
0.2
0.6
1.0
1.4
0 1 2 3 4
Cu/MOR
Fit [Cu3(µ-O)3]2+
FT
(k2χ(k
)) (
Å-3
)
Cu-Cu
Cu-O
-1.2
-0.6
0
0.6
1.2
2.5 4.5 6.5 8.5 10.5 12.5
Cu/MOR
fit [Cu3(µ-O)3]2+
k (Å-1)R (Å)
-6
-4
-2
0
2
4
6
2.5 4.5 6.5 8.5 10.5 12.5
Cu-MOR
fit [Cu3(µ-O)3]2+
k (Å-1)
-6.0
-4.0
-2.0
0.0
2.0
4.0
6.0
8.0
0 1 2 3 4
Cu-MOR
Fit [Cu3(µ-O)3]2+
FT(k
3χ(
k))
,Å
-3
Cu-Cu
Cu-O
-0.4
-0.2
0
0.2
0.4
2.5 4.5 6.5 8.5 10.5 12.5
Cu-MOR
fit [Cu3(µ-O)3]2+
-0.4
-0.2
0.0
0.2
0.4
0 1 2 3 4
Cu-MOR
Fit [Cu3(µ-O)3]2+Cu-O
Cu-Cu
FT
(k1χ(k
)) (
Å-3
)Cu-MOR
fit [Cu3(µ-O)3]2+
Cu-MOR
fit [Cu3(µ-O)3]2+
fit [Cu3(µ-O)3]2+
Cu-MOR
fit [Cu3(µ-O)3]2+
Cu-MOR
e f
R (Å)
fit [Cu3(µ-O)3]2+
Cu-MORCu-MOR
fit [Cu3(µ-O)3]2+
c d
a b
k1χ(k
) (Å
-2)
k2χ(k
) (Å
-2)
k3χ(k
) (Å
-2)

Supplementary Figure 7 | In situ Copper EXAFS of Cu-MOR. FT EXAFS of Cu-MOR sample during
activation in pure O2 flow with a heating rate of 10 K/min.
FT
(k²χ
(k))
( Å
-3)
0.0
0.5
1.0
1.5
2.0
2.5
3.0
3.5
4.0
0 1 2 3 4 5 6
450 °C
400 °C
300 °C
200 °C
100 °C
50 °C
R (Å)
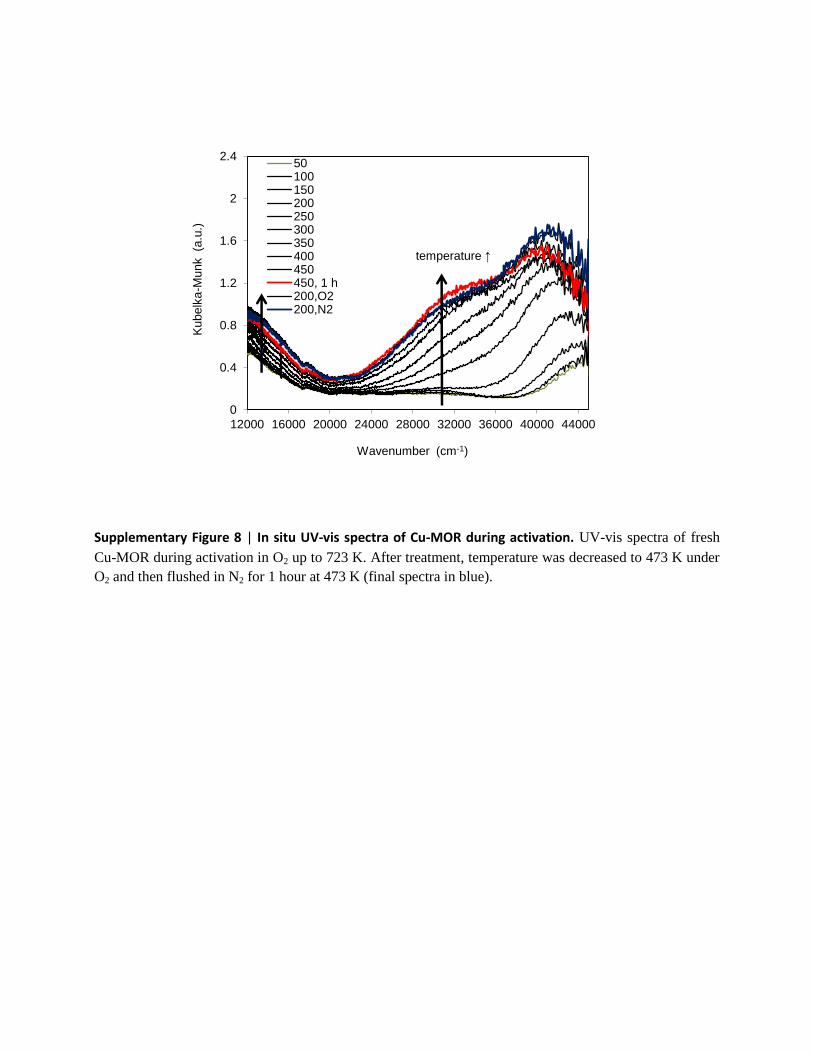
Supplementary Figure 8 | In situ UV-vis spectra of Cu-MOR during activation. UV-vis spectra of fresh
Cu-MOR during activation in O2 up to 723 K. After treatment, temperature was decreased to 473 K under
O2 and then flushed in N2 for 1 hour at 473 K (final spectra in blue).
0
0.4
0.8
1.2
1.6
2
2.4
12000 16000 20000 24000 28000 32000 36000 40000 44000
50100150200250300350400450450, 1 h200,O2200,N2
temperature ↑
Wavenumber (cm-1)
Kubelk
a-M
unk
(a.u
.)

Supplementary Figure 9 | Molecular orbital analysis A schematic representation of orbital interactions
involved in C-H bond activation in methane by the reactive OEF in the trinuclear [Cu3O3]2+
cluster. The
insert depicts the DFT-computed SOMO of the cluster model (Gaussian 09, PBE/6-31+G(d,p)) cut from
the periodic DFT-optimized Cu3O3/MOR structure in S=1/2 and S=3/2 spin states (the reactive O moiety
in the cluster is shown with the arrow).
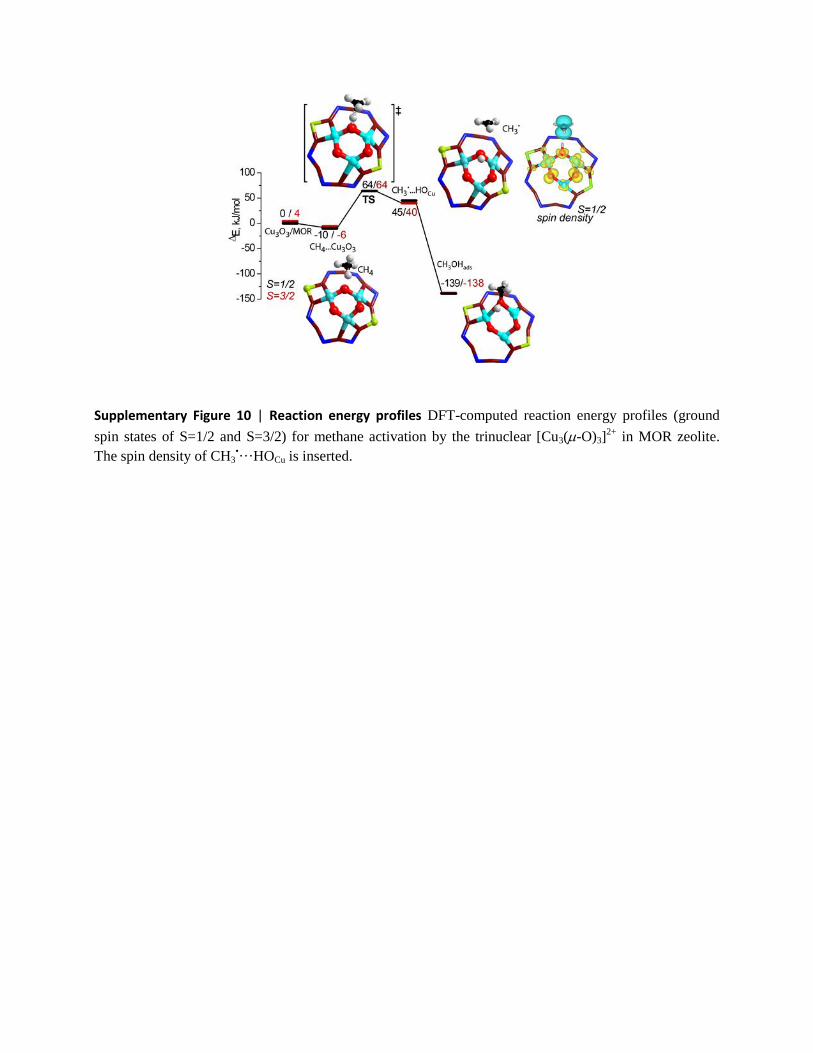
Supplementary Figure 10 | Reaction energy profiles DFT-computed reaction energy profiles (ground
spin states of S=1/2 and S=3/2) for methane activation by the trinuclear [Cu3(-O)3]2+
in MOR zeolite.
The spin density of CH3•···HOCu is inserted.
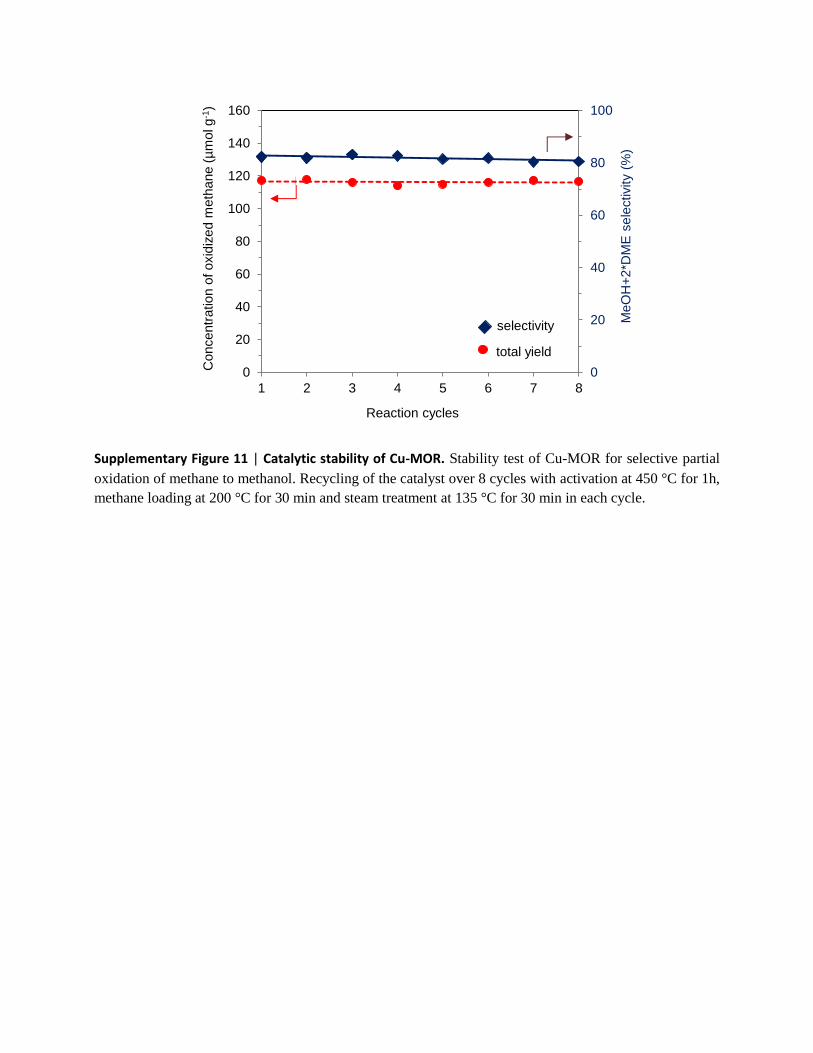
Supplementary Figure 11 | Catalytic stability of Cu-MOR. Stability test of Cu-MOR for selective partial
oxidation of methane to methanol. Recycling of the catalyst over 8 cycles with activation at 450 °C for 1h,
methane loading at 200 °C for 30 min and steam treatment at 135 °C for 30 min in each cycle.
0
20
40
60
80
100
0
20
40
60
80
100
120
140
160
1 2 3 4 5 6 7 8
MeO
H+
2*D
ME
se
lectivity
(%)
co
ncn
etr
atio
n (
µm
ol/g
)
Reaction cycles
selectivity
total yield
Co
nce
ntr
atio
nofo
xid
ize
dm
eth
ane
(µm
olg
-1)

Supplementary Tables
Supplementary Table 1 | BET analysis of Cu-exchanged mordenites.
Sample Si/Al ratio Cu loading
[wt.%]
BET surface
area [m² g-1
]
Vmicropore [cm3
g-1
]
H-MOR 11 0 534 0.20
Cu-MOR 11 1.0 499 0.18
Cu-MOR 11 2.9 501 0.19
Cu-MOR 21 1.0 517 0.17

Supplementary Table 2 | Calculated scattering paths based on DFT optimized model of Cu-MOR. DFT
optimized geometric parameters of [Cu3(µ-O)3]2+
in Cu-MOR predicted by DFT calculation. All paths in a
distance ≤ 3.5 Å were taken into account.
Scatterer Backscatterer Number of paths
(DFT)
Distance
[Å]
Cu1 O 1 1.79
O 1 1.80
O 1 1.96
O 1 2.02
Cu 1 3.04
Cu 1 3.05
Cu2 O 1 1.77
O 1 1.78
O 1 2.04
O 1 2.11
Cu 1 2.74
Cu 1 3.05
O 1 3.23
O 1 3.41
O 1 3.44
Cu3 O 1 1.77
O 1 1.82
O 1 1.99
O 1 2.63
Cu 1 2.74
Cu 1 3.04
O 1 3.20
O 1 3.44
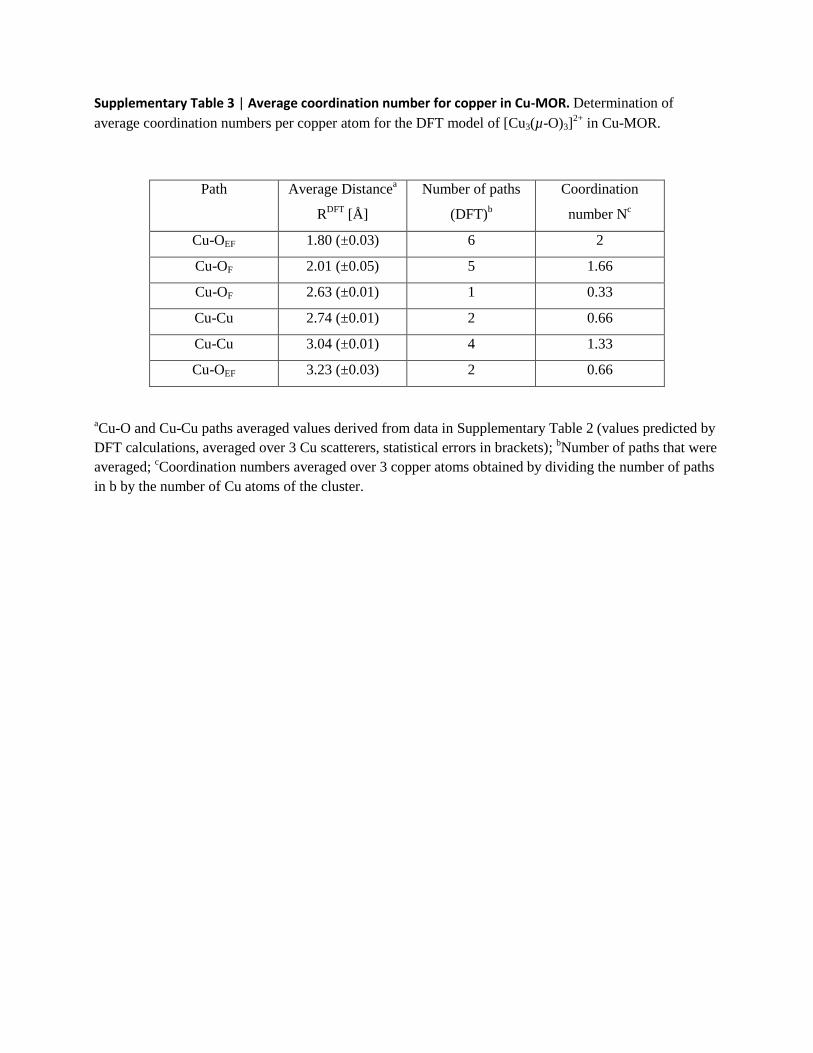
Supplementary Table 3 | Average coordination number for copper in Cu-MOR. Determination of
average coordination numbers per copper atom for the DFT model of [Cu3(µ-O)3]2+
in Cu-MOR.
Path Average Distancea
RDFT
[Å]
Number of paths
(DFT)b
Coordination
number Nc
Cu-OEF 1.80 (±0.03) 6 2
Cu-OF 2.01 (±0.05) 5 1.66
Cu-OF 2.63 (±0.01) 1 0.33
Cu-Cu 2.74 (±0.01) 2 0.66
Cu-Cu 3.04 (±0.01) 4 1.33
Cu-OEF 3.23 (±0.03) 2 0.66
aCu-O and Cu-Cu paths averaged values derived from data in Supplementary Table 2 (values predicted by
DFT calculations, averaged over 3 Cu scatterers, statistical errors in brackets); bNumber of paths that were
averaged; cCoordination numbers averaged over 3 copper atoms obtained by dividing the number of paths
in b by the number of Cu atoms of the cluster.

Supplementary Table 4| EXFAS fitting of Cu-MOR with dimeric copper structures. Comparison of Cu K-
edge EXAFS fit resultsa for O2-activated Cu-MOR zeolite with DFT optimized geometric parameters of
[Cu2(µ-O)]2+
Backscatterer Coordination
number Nb
Distance RDFT
[Å]
Distance REXAFS
[Å]
Debye-Waller
factor Δσ² [Ų]
Cu-OEF 3 1.95 1.94 (±0.04) 0.005 (±0.001)
Cu-Cu 1 2.94 2.92 (±0.07) 0.012 (±0.004)
Cu-OF 1 3.56 3.52 (±0.04) 0.011 (±0.018)
aCombined k
1, k² and k³-weighted fit, 2.4<k<12.0, 1<R<3.6, E0= -2 (2), R factor= 0.009, S0²(fixed)= 0.9,
statistical errors in brackets; bCoordination numbers were fixed during EXAFS fit to reduce the number of
fitting parameters (values predicted by DFT calculations).
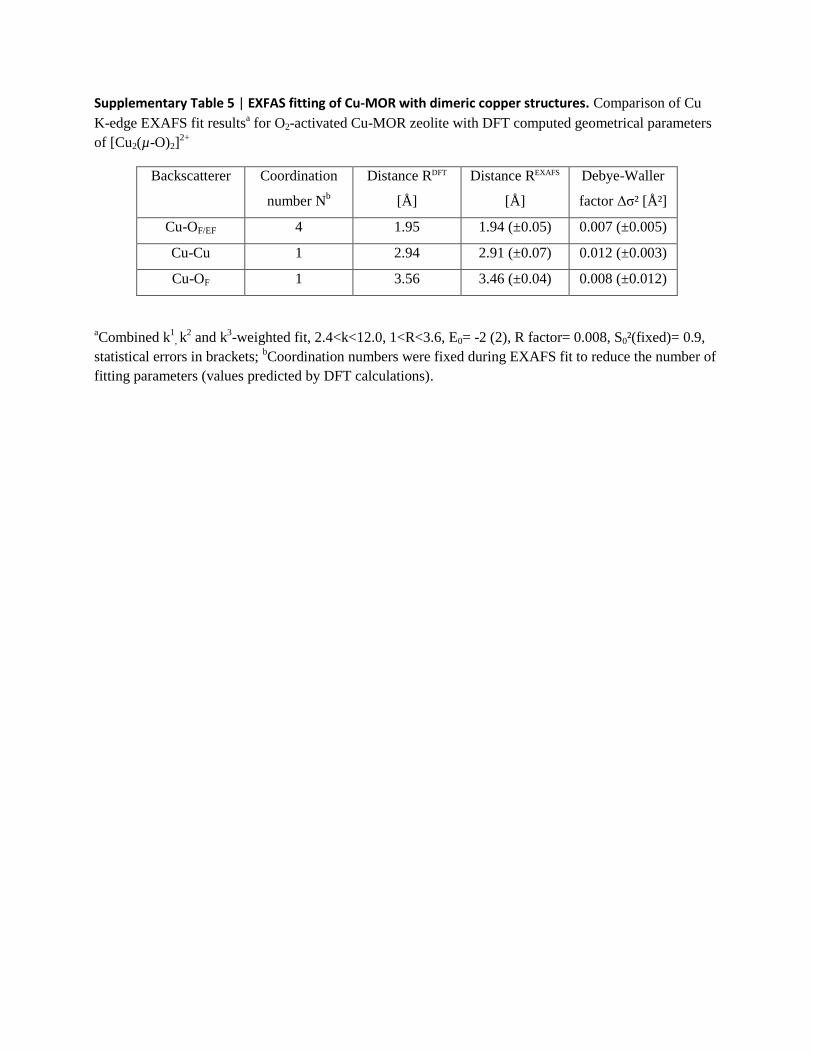
Supplementary Table 5 | EXFAS fitting of Cu-MOR with dimeric copper structures. Comparison of Cu
K-edge EXAFS fit resultsa for O2-activated Cu-MOR zeolite with DFT computed geometrical parameters
of [Cu2(µ-O)2]2+
Backscatterer Coordination
number Nb
Distance RDFT
[Å]
Distance REXAFS
[Å]
Debye-Waller
factor Δσ² [Ų]
Cu-OF/EF 4 1.95 1.94 (±0.05) 0.007 (±0.005)
Cu-Cu 1 2.94 2.91 (±0.07) 0.012 (±0.003)
Cu-OF 1 3.56 3.46 (±0.04) 0.008 (±0.012)
aCombined k
1, k
2 and k
3-weighted fit, 2.4<k<12.0, 1<R<3.6, E0= -2 (2), R factor= 0.008, S0²(fixed)= 0.9,
statistical errors in brackets; bCoordination numbers were fixed during EXAFS fit to reduce the number of
fitting parameters (values predicted by DFT calculations).


![From trinuclear cluster [Mn3(PhCO2)6(THF)4] - Royal Society of](https://img.dokumen.tips/doc/110x75/622fede7a4be99274d021bf4/from-trinuclear-cluster-mn3phco26thf4-royal-society-of.jpg)


![luuIllll-ill - Digital Library/67531/metadc620727/...intercalating with an aqueous solution of trinuclear acetato hydroxyl-iron(III) nitrate, [Fe3(OCOCH3)7OHo2N2ONO3]. Therefore, the](https://img.dokumen.tips/doc/110x75/5ad2e1237f8b9a05208d346c/luuillll-ill-digital-library-67531metadc620727intercalating-with-an-aqueous.jpg)