Embed Size (px)
Citation preview
Pump Station Design Guidelines – Second Edition
Jensen Engineered Systems 825 Steneri Way
Sparks, NV 89431 For design assistance call (855)468-5600
JensenEngineeredSystems.com ©2012 Jensen Precast
www.JensenEngineeredSystems.com 2
TABLE OF CONTENTS
INTRODUCTION ............................................................................................................................................................. 3
PURPOSE OF THIS GUIDE ........................................................................................................................................... 3
OVERVIEW OF A TYPICAL JES SUBMERSIBLE LIFT STATION ....................................................................................... 3
DESIGN PROCESS ....................................................................................................................................................... 3
BASIC PUMP SELECTION ............................................................................................................................................... 5
THE SYSTEM CURVE ................................................................................................................................................... 5
STATIC LOSSES....................................................................................................................................................... 5
FRICTION LOSSES .................................................................................................................................................. 6
TOTAL DYNAMIC HEAD ......................................................................................................................................... 9
HOW PUMPS WORK ................................................................................................................................................ 13
OVERVIEW OF A SUBMERSIBLE PUMP ................................................................................................................ 13
BASIC IMPELLER THEORY .................................................................................................................................... 14
THE CASING ......................................................................................................................................................... 14
THE INLET ............................................................................................................................................................ 14
IMPELLER TYPES .................................................................................................................................................. 15
MOTORS .............................................................................................................................................................. 17
MECHANICAL SEALS ............................................................................................................................................ 19
PUMP CURVES ......................................................................................................................................................... 22
STEEPNESS OF PUMP CURVE .............................................................................................................................. 24
INTERACTION OF THE SYSTEM CURVE WITH THE PUMP CURVE ............................................................................ 24
NET POSITVE SUCTION HEAD .................................................................................................................................. 25
INTRODUCTION TO WET WELL DESIGN ...................................................................................................................... 26
MINIMUM STORAGE VOLUME ................................................................................................................................... 27
SIZE OF WELL ............................................................................................................................................................... 28
HATCH SIZING .......................................................................................................................................................... 28
DIAMETER OF WELL ................................................................................................................................................ 31
CONTROL ELEVATIONS ................................................................................................................................................ 32
HX – MINIMUM SUBMERGENCE .............................................................................................................................. 33
HMIN – MINIMUM STORAGE .................................................................................................................................... 34
HLAG – LAG STORAGE ............................................................................................................................................... 34
HRES – RESERVOIR STORAGE .................................................................................................................................... 34
www.JensenEngineeredSystems.com 3
INTRODUCTION
PURPOSE OF THIS GUIDE
The intent of this manual is to guide the engineering professional through a typical design of a Jensen Engineered
Systems (JES) packaged lift station. These are the same steps and procedures followed by our engineers when we
are designing a submersible lift station. JES can always provide you with a project specific design – free of charge.
Simply contact one of our design professionals toll free at (855) 468-5600. For those who would like insight into
our basis of design, or want to be more hands on in the design process, we hope this manual is of help.
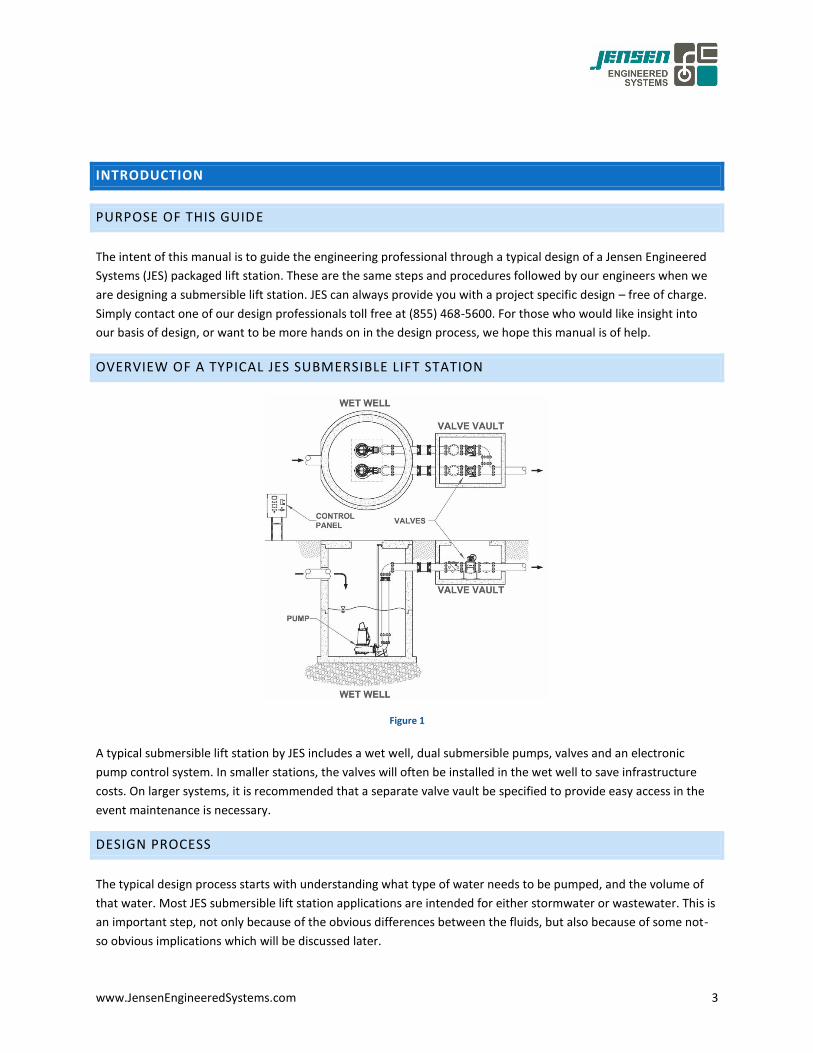
OVERVIEW OF A TYPICAL JES SUBMERSIBLE LIFT STATION
Figure 1
A typical submersible lift station by JES includes a wet well, dual submersible pumps, valves and an electronic
pump control system. In smaller stations, the valves will often be installed in the wet well to save infrastructure
costs. On larger systems, it is recommended that a separate valve vault be specified to provide easy access in the
event maintenance is necessary.
DESIGN PROCESS
The typical design process starts with understanding what type of water needs to be pumped, and the volume of
that water. Most JES submersible lift station applications are intended for either stormwater or wastewater. This is
an important step, not only because of the obvious differences between the fluids, but also because of some not-
so obvious implications which will be discussed later.

www.JensenEngineeredSystems.com 4
Determining the volume of the fluid can be as simple as identifying the fixture unit count in a residential home, or
as complicated as preparing a detailed hydrology report for a 50-acre commercial site. The intent of this manual is
not to detail these very broad subjects, but to point out the necessity of properly determining flowrates, as well as
provide a good understanding of the occurrence of those flows and how they relate to a pump station.
Figure 2
The next steps in design are site considerations. How far does the lift station need to pump? How high does the
liquid need to rise? These questions, when coupled with the flowrate, are eventually going to determine the size of
pump the system will require. Additional site considerations, such as whether or not the lift station is located in a
roadway, will play into various other design criteria. The better the understanding of the site, the easier the lift
station will be to design.
Once flow has been determined and site considerations have been taken into account, the system curve can be
developed. The system curve is matched with various pump curves in an iterative process to determine which
pump will best match the demands of the project. Once the pump is selected, all the additional components, such
as the wet well, valve vault, valve and pipes, control system, etc., can be sized.
www.JensenEngineeredSystems.com 5
BASIC PUMP SELECTION
THE SYSTEM CURVE
The most important part of any pump selection is first determining the system curve. This means, at the very least,
the flowrate and head that will be required of the pump must be identified. Often this is the first mistake made in
the selection process.
In many potable water booster stations, the flowrate is determined by a downstream demand. In a typical JES
application, the purpose of the lift station is to simply move water from one location to another. Therefore, the
flow is typically governed by the inflow to the station, and not an outflow demand. Once the flowrate into the
station is found, the amount of head required by the pump can be determined by calculating the system losses in
the piping network. Rule of thumb estimates and outright guesses of the friction losses will lead to poorly sized
equipment that will have a poor efficiency and reliability.
Calculation of the system losses at several different flowrates will yield a system curve. System curves represent a
loss of energy in systems with a variation in the flowrate. Or, stated differently, the amount of energy the pump
must generate to operate at a given flowrate. System losses come in two forms that are outlined below.
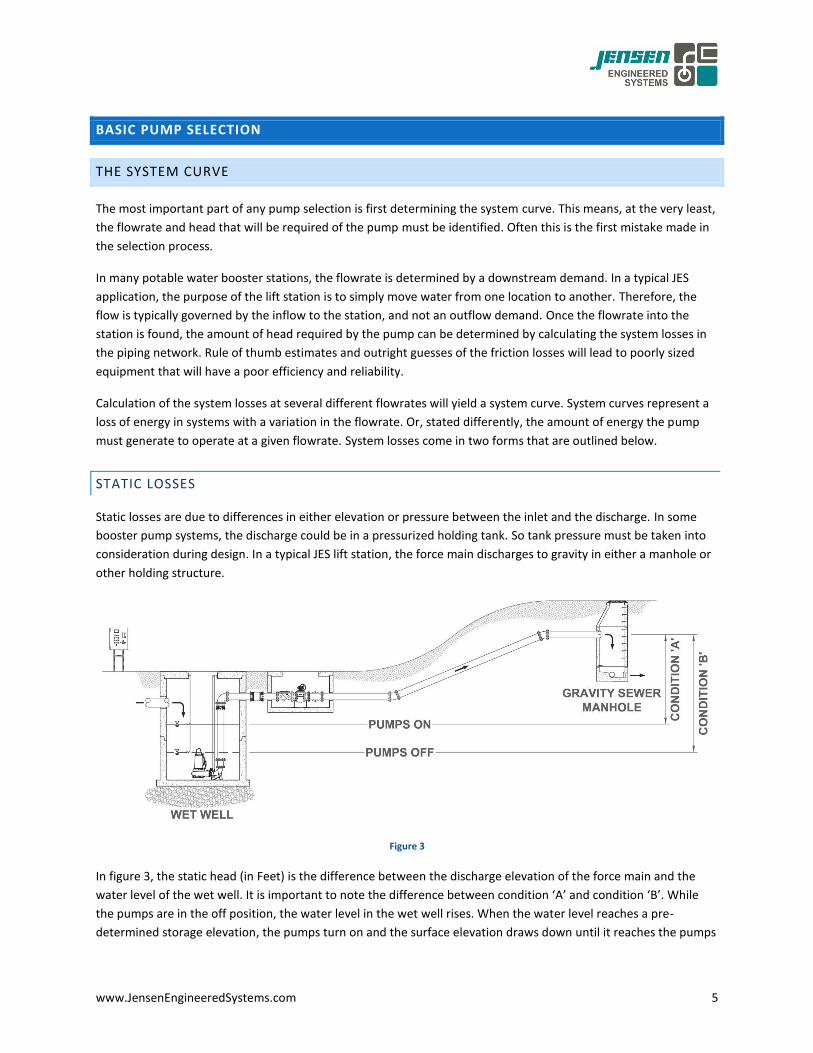
STATIC LOSSES
Static losses are due to differences in either elevation or pressure between the inlet and the discharge. In some
booster pump systems, the discharge could be in a pressurized holding tank. So tank pressure must be taken into
consideration during design. In a typical JES lift station, the force main discharges to gravity in either a manhole or
other holding structure.
Figure 3
In figure 3, the static head (in Feet) is the difference between the discharge elevation of the force main and the
water level of the wet well. It is important to note the difference between condition ‘A’ and condition ‘B’. While
the pumps are in the off position, the water level in the wet well rises. When the water level reaches a pre-
determined storage elevation, the pumps turn on and the surface elevation draws down until it reaches the pumps

www.JensenEngineeredSystems.com 6
off position. Determining these elevations will be addressed later, but for now it is important to understand that
the static head is not a fixed value, but rather a floating value dependent upon the water surface elevation in the
wet well. Many designers consider the system curve to be a fixed and unchanging representation of the pumping
system. However, because the system curve is based upon the static head, which is a fluctuating variable, the
system curve itself can fluctuate. Therefore, the system curve is not a single point set – It is a range of curves. This
will become more apparent when developing a system curve is discussed later in this manual.
FRICTION LOSSES
The second part of losses in the pumping system are the dynamic losses. Dynamic losses are dependent upon the
flowrate through the system and primarily attributed to the system friction. This includes friction of the liquid
flowing through the pipe and fittings, as well as the friction internal to the fluid itself. The friction begins at the
level of the total static head and increases with flowrate.
The subject of friction losses in a piping network is vast and complex. Example: in designing a water booster station
for a residential neighborhood, a detailed pipe analysis of the network, including its physical characteristics and
flow demands, would be necessary. Rather than delve deeper is determining these losses in this manual, the
following discussion assumes a very simple, single force main, gravity discharge lift station. For projects requiring a
more complicated distribution system, contact Jensen Engineered Systems. We utilize advanced computer
modeling software to detail the piping network.
There are many different methods for determining friction losses in a pipe. These include The Darcy-Weisbach
Equation, along with the Hazen Williams Equation. We will be using the Hazen Williams Equation because of its
relative ease for a simple force main. There are some limitations to the Hazen Williams Equation which will be
discussed. To explore this subject in further detail, or learn more about other methods, there are some very good
current publications: Pumping Station Design (Revised Third Edition) by Jones, Sanks, Tchobanoglous, and
Bosserman, published by Butterworth-Heinemann, is thought by many to be the most in-depth resource for pump
station design. Another publication worth reviewing is Hydrology and Hydraulic Systems (Second Edition) by Gupta,
published by Waveland Press, Inc.
There are some advantages of using the Hazen Williams Equation. Not only is it simple and easy to use, its use is
also required by many regulatory agencies. The Hazen Williams Equation is somewhat constraining because there
must be turbulent flow within the pipe, and the fluid type must be water that is at, or near, room temperature.
Additionally, the fluid velocity must be between 3 to 9 ft/sec. This last constraint actually lends itself quite well to
wastewater lift design because if the wastewater velocity is below 3 ft/sec., there will not be enough energy to
scour the pipe of solids. Conversely, water flowing above 9 ft/sec. can scour the pipe material and damage the
force main. The final constraint is that the Hazen-Williams Equation should not be used on force mains larger than
60” in diameter.
www.JensenEngineeredSystems.com 7
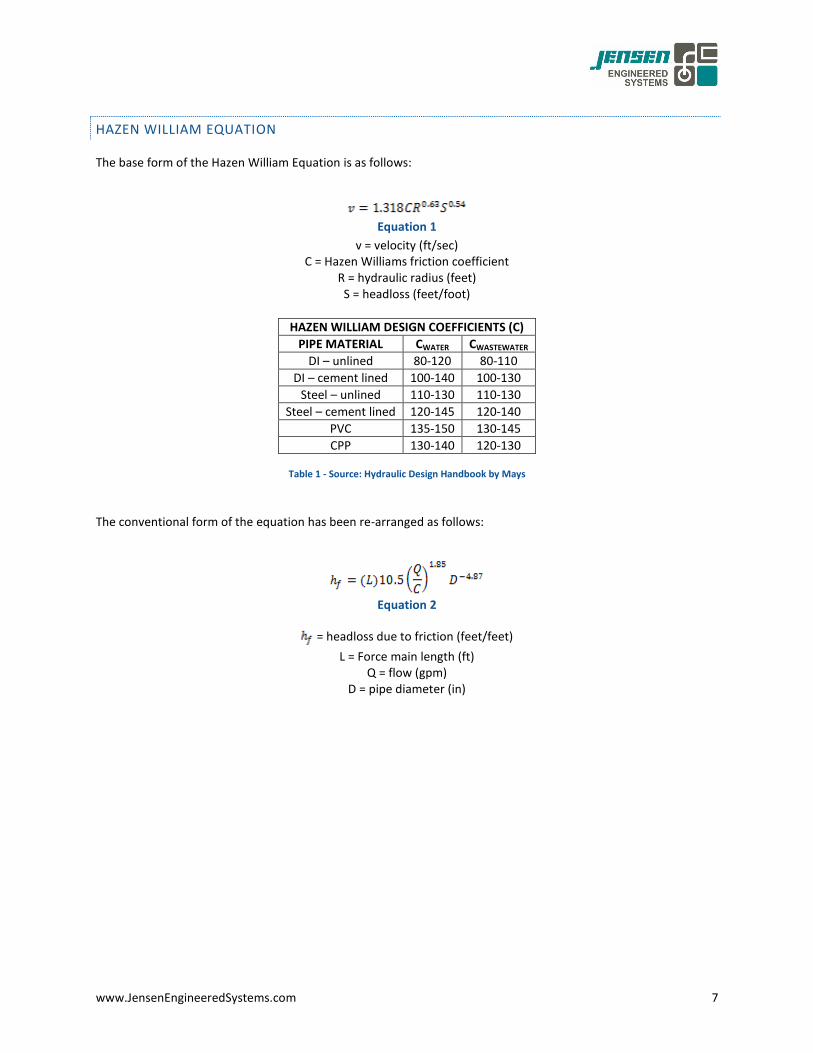
HAZEN WILLIAM EQUATION
The base form of the Hazen William Equation is as follows:
Equation 1
v = velocity (ft/sec) C = Hazen Williams friction coefficient
R = hydraulic radius (feet) S = headloss (feet/foot)
HAZEN WILLIAM DESIGN COEFFICIENTS (C)
PIPE MATERIAL CWATER CWASTEWATER
DI – unlined 80-120 80-110
DI – cement lined 100-140 100-130
Steel – unlined 110-130 110-130
Steel – cement lined 120-145 120-140
PVC 135-150 130-145
CPP 130-140 120-130
Table 1 - Source: Hydraulic Design Handbook by Mays
The conventional form of the equation has been re-arranged as follows:
Equation 2
= headloss due to friction (feet/feet)
L = Force main length (ft) Q = flow (gpm)
D = pipe diameter (in)
www.JensenEngineeredSystems.com 8
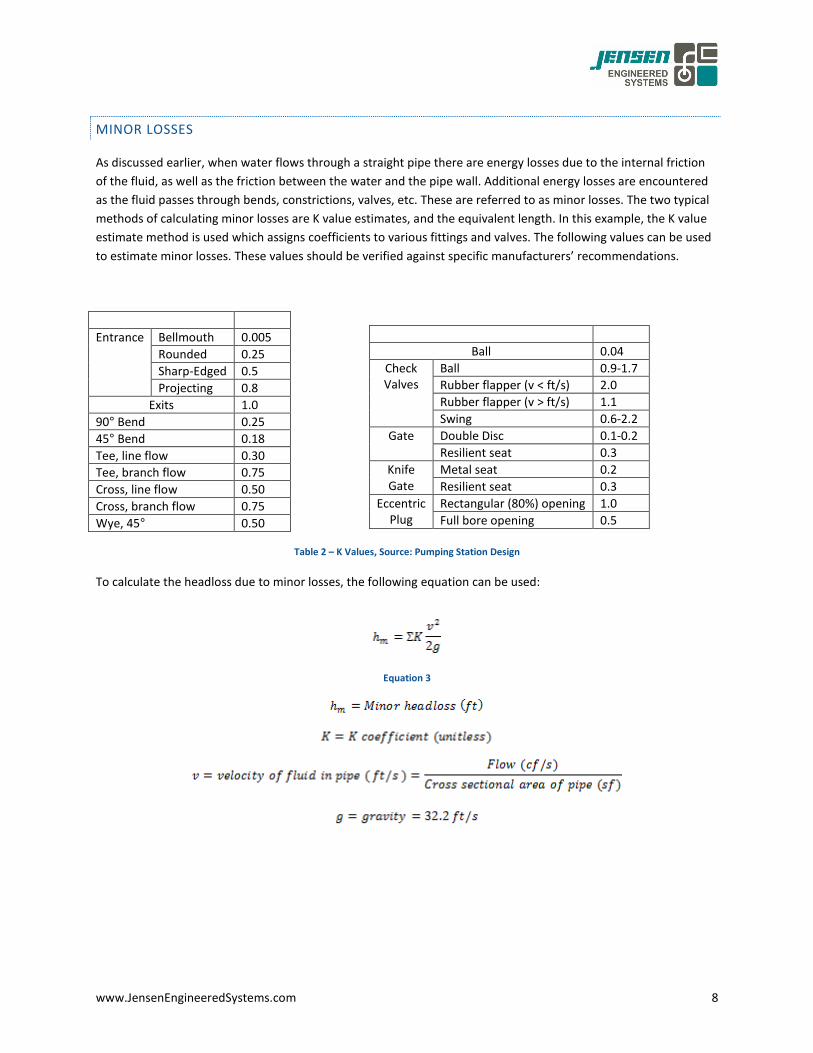
MINOR LOSSES
As discussed earlier, when water flows through a straight pipe there are energy losses due to the internal friction
of the fluid, as well as the friction between the water and the pipe wall. Additional energy losses are encountered
as the fluid passes through bends, constrictions, valves, etc. These are referred to as minor losses. The two typical
methods of calculating minor losses are K value estimates, and the equivalent length. In this example, the K value
estimate method is used which assigns coefficients to various fittings and valves. The following values can be used
to estimate minor losses. These values should be verified against specific manufacturers’ recommendations.
Fitting K Value
Entrance Bellmouth 0.005
Rounded 0.25
Sharp-Edged 0.5
Projecting 0.8
Exits 1.0
90° Bend 0.25
45° Bend 0.18
Tee, line flow 0.30
Tee, branch flow 0.75
Cross, line flow 0.50
Cross, branch flow 0.75
Wye, 45° 0.50
Table 2 – K Values, Source: Pumping Station Design
To calculate the headloss due to minor losses, the following equation can be used:
Equation 3
Valve (Fully Open) K Value
Ball 0.04
Check Valves
Ball 0.9-1.7
Rubber flapper (v < ft/s) 2.0
Rubber flapper (v > ft/s) 1.1
Swing 0.6-2.2
Gate Double Disc 0.1-0.2
Resilient seat 0.3
Knife Gate
Metal seat 0.2
Resilient seat 0.3
Eccentric Plug
Rectangular (80%) opening 1.0
Full bore opening 0.5
www.JensenEngineeredSystems.com 9
TOTAL DYNAMIC HEAD
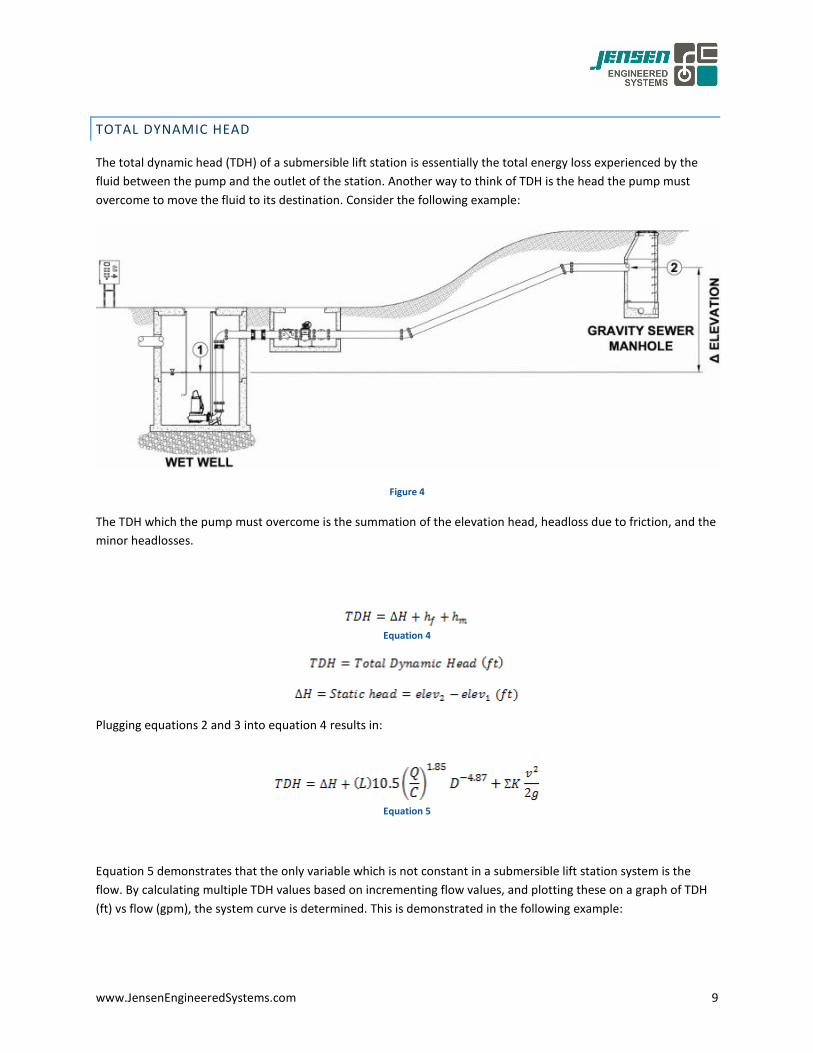
The total dynamic head (TDH) of a submersible lift station is essentially the total energy loss experienced by the
fluid between the pump and the outlet of the station. Another way to think of TDH is the head the pump must
overcome to move the fluid to its destination. Consider the following example:
Figure 4
The TDH which the pump must overcome is the summation of the elevation head, headloss due to friction, and the
minor headlosses.
Equation 4
Plugging equations 2 and 3 into equation 4 results in:
Equation 5
Equation 5 demonstrates that the only variable which is not constant in a submersible lift station system is the
flow. By calculating multiple TDH values based on incrementing flow values, and plotting these on a graph of TDH
(ft) vs flow (gpm), the system curve is determined. This is demonstrated in the following example:
www.JensenEngineeredSystems.com 10
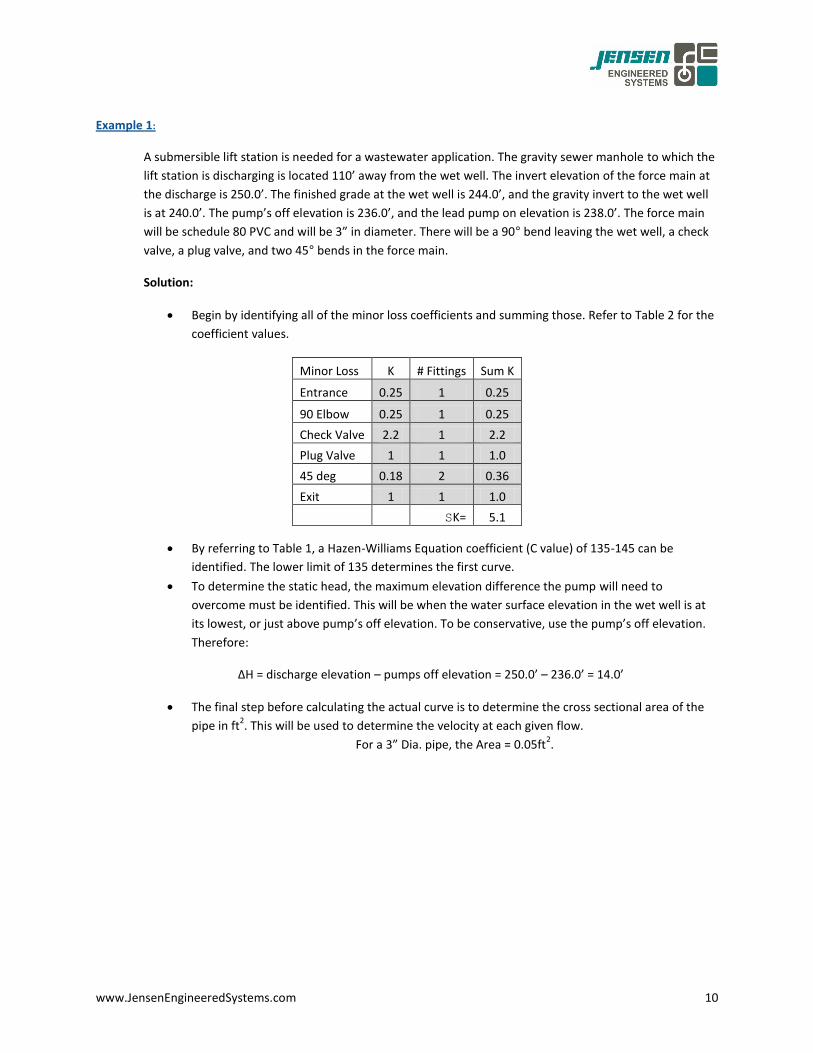
Example 1:
A submersible lift station is needed for a wastewater application. The gravity sewer manhole to which the
lift station is discharging is located 110’ away from the wet well. The invert elevation of the force main at
the discharge is 250.0’. The finished grade at the wet well is 244.0’, and the gravity invert to the wet well
is at 240.0’. The pump’s off elevation is 236.0’, and the lead pump on elevation is 238.0’. The force main
will be schedule 80 PVC and will be 3” in diameter. There will be a 90° bend leaving the wet well, a check
valve, a plug valve, and two 45° bends in the force main.
Solution:
Begin by identifying all of the minor loss coefficients and summing those. Refer to Table 2 for the
coefficient values.
Minor Loss K # Fittings Sum K
Entrance 0.25 1 0.25
90 Elbow 0.25 1 0.25
Check Valve 2.2 1 2.2
Plug Valve 1 1 1.0
45 deg 0.18 2 0.36
Exit 1 1 1.0
SK= 5.1
By referring to Table 1, a Hazen-Williams Equation coefficient (C value) of 135-145 can be
identified. The lower limit of 135 determines the first curve.
To determine the static head, the maximum elevation difference the pump will need to
overcome must be identified. This will be when the water surface elevation in the wet well is at
its lowest, or just above pump’s off elevation. To be conservative, use the pump’s off elevation.
Therefore:
ΔH = discharge elevation – pumps off elevation = 250.0’ – 236.0’ = 14.0’
The final step before calculating the actual curve is to determine the cross sectional area of the
pipe in ft2. This will be used to determine the velocity at each given flow.
For a 3” Dia. pipe, the Area = 0.05ft2.
www.JensenEngineeredSystems.com 11
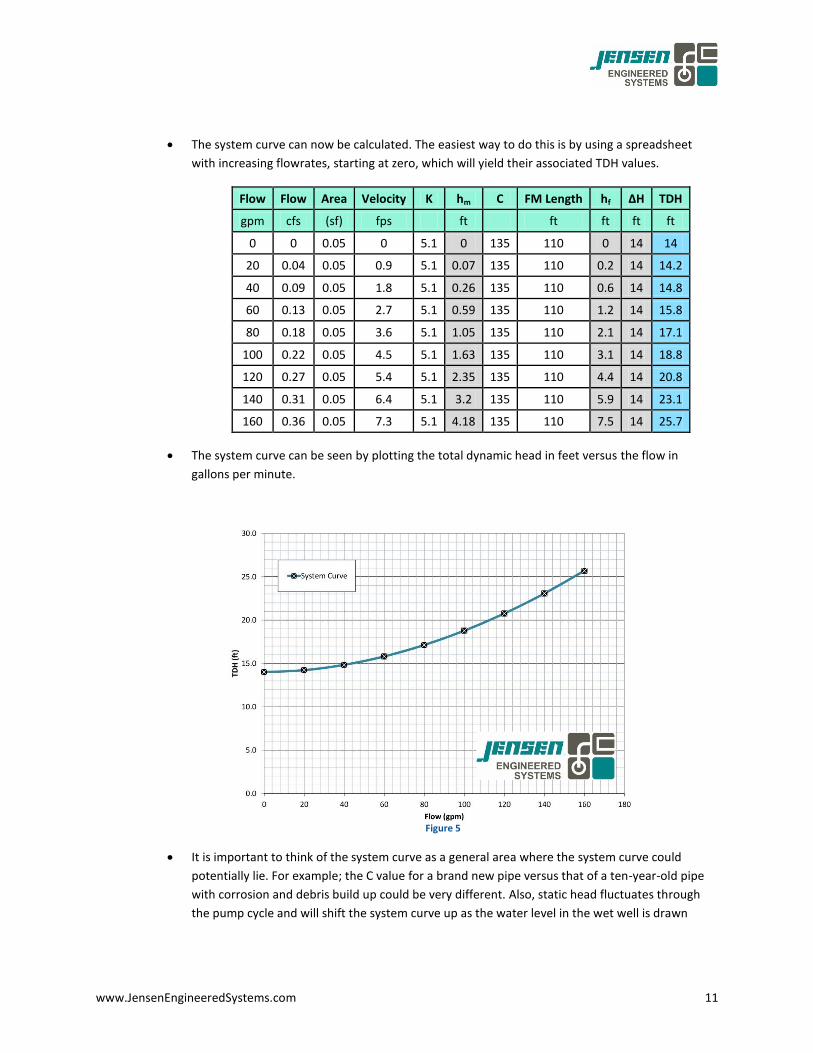
The system curve can now be calculated. The easiest way to do this is by using a spreadsheet
with increasing flowrates, starting at zero, which will yield their associated TDH values.
Flow Flow Area Velocity K hm C FM Length hf ΔH TDH
gpm cfs (sf) fps ft ft ft ft ft
0 0 0.05 0 5.1 0 135 110 0 14 14
20 0.04 0.05 0.9 5.1 0.07 135 110 0.2 14 14.2
40 0.09 0.05 1.8 5.1 0.26 135 110 0.6 14 14.8
60 0.13 0.05 2.7 5.1 0.59 135 110 1.2 14 15.8
80 0.18 0.05 3.6 5.1 1.05 135 110 2.1 14 17.1
100 0.22 0.05 4.5 5.1 1.63 135 110 3.1 14 18.8
120 0.27 0.05 5.4 5.1 2.35 135 110 4.4 14 20.8
140 0.31 0.05 6.4 5.1 3.2 135 110 5.9 14 23.1
160 0.36 0.05 7.3 5.1 4.18 135 110 7.5 14 25.7
The system curve can be seen by plotting the total dynamic head in feet versus the flow in
gallons per minute.
Figure 5
It is important to think of the system curve as a general area where the system curve could
potentially lie. For example; the C value for a brand new pipe versus that of a ten-year-old pipe
with corrosion and debris build up could be very different. Also, static head fluctuates through
the pump cycle and will shift the system curve up as the water level in the wet well is drawn
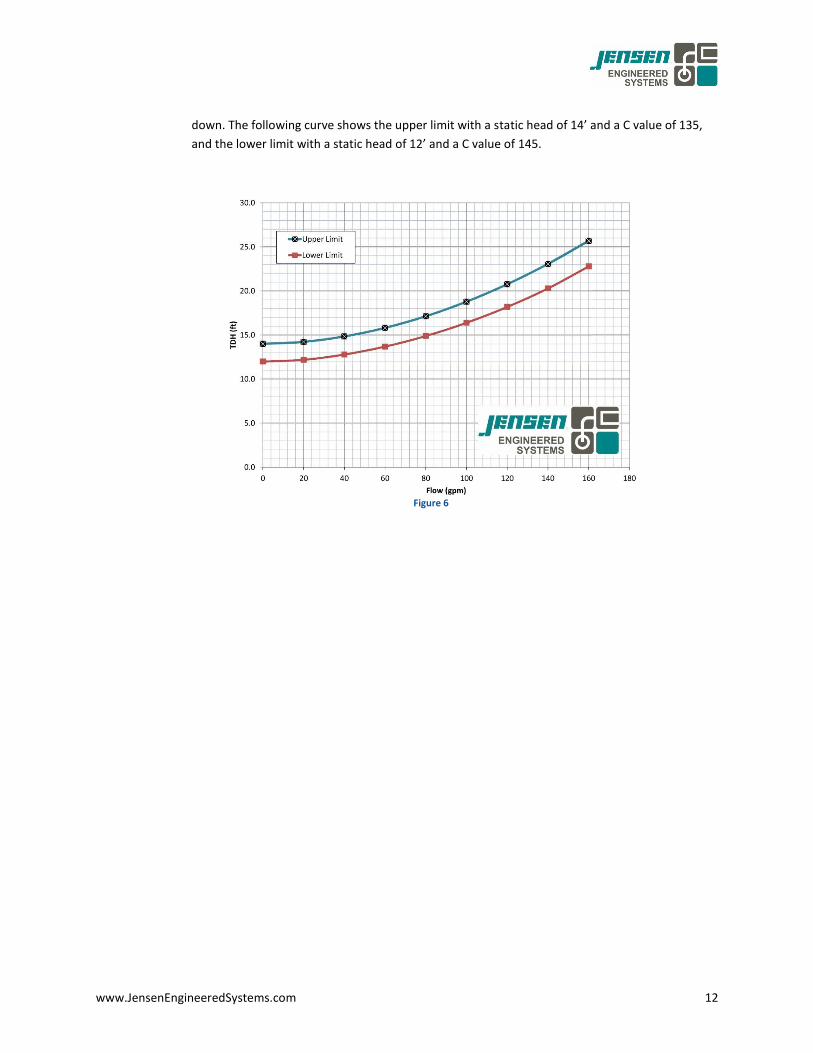
www.JensenEngineeredSystems.com 12
down. The following curve shows the upper limit with a static head of 14’ and a C value of 135,
and the lower limit with a static head of 12’ and a C value of 145.
Figure 6
www.JensenEngineeredSystems.com 13
HOW PUMPS WORK
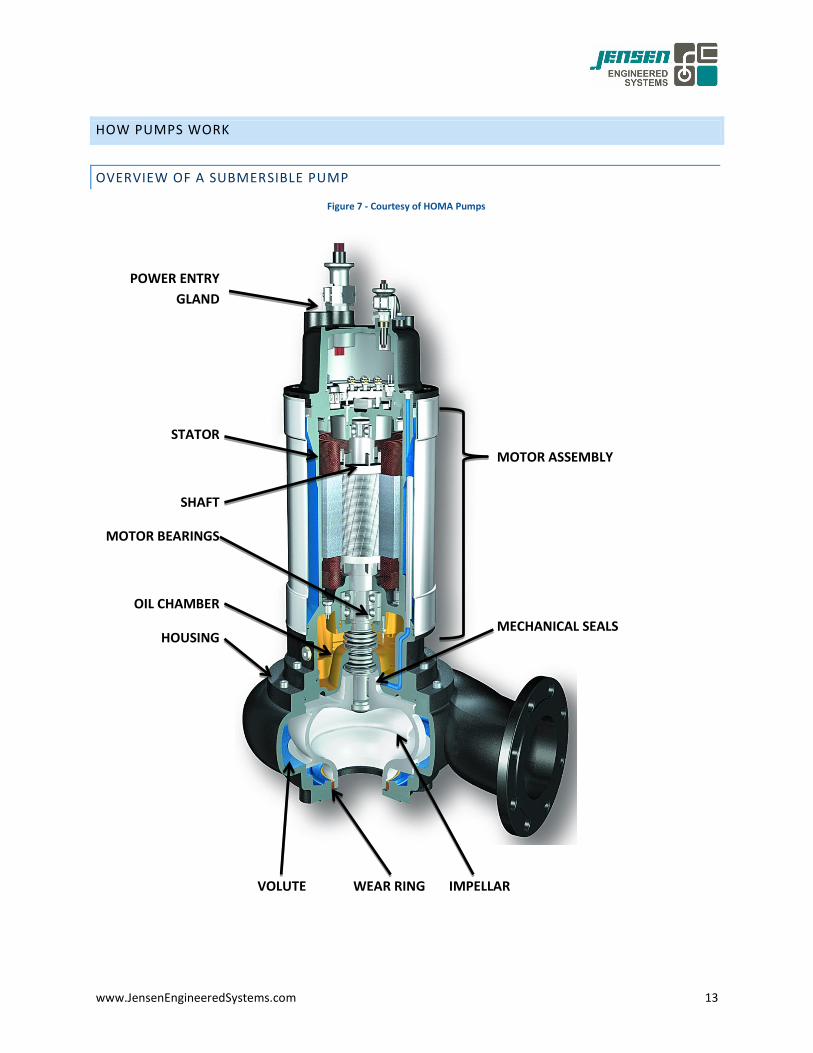
OVERVIEW OF A SUBMERSIBLE PUMP
POWER ENTRY
GLAND
STATOR
SHAFT
MOTOR BEARINGS
OIL CHAMBER
HOUSING
MOTOR ASSEMBLY
MECHANICAL SEALS
VOLUTE WEAR RING IMPELLAR
Figure 7 - Courtesy of HOMA Pumps
www.JensenEngineeredSystems.com 14
BASIC IMPELLER THEORY
The Impeller is the heart of the pump and the only part that adds energy to the liquid. Simply put, energy is added
by accelerating the liquid from the smaller radius at the impeller inlet to a larger radius at the impeller exit. The
amount of energy input into the fluid can be amplified by increasing the outside diameter of the impeller, or
increasing the speed at which it operates.
THE CASING
The energy added by the spinning impeller exits as a high speed fluid, which is generally not very useful for process
applications. Pump output usually requires higher pressure, not higher speed. To convert from higher speed to
higher pressure, the flow must be diffused (speed reduced) converting high velocity energy into pressure and
energy. See Bernoulli’s Equation below.
Equation 6
P = Pressure (psi) sg = Specific gravity (unitless) V = Velocity of the fluid (ft/s)
G = Acceleration due to gravity (32.16 ft/sec2)
Z = Elevation of the centerline of the liquid path Subscripts:
1 = Upstream condition 2 = Downstream condition
In the pump, the elevation change from point 1 (exiting the impeller in this example) to point 2 (centerline of the
volute channel) is generally small, and is considered negligible in most cases. Therefore, only the change in
pressure and velocity is left to be considered. In order for the two sides of the equation to balance, decrease in
velocity from point 1 to point 2 must have a corresponding increase in pressure from point 1 to point 2. Bernoulli’s
Equation is a simplified representation of this process. Technically, it only applies to flows along a streamline and
neglects friction, but it is sufficient to understand the basic principle.
THE INLET
The following discussion concerning inlets is less relevant in submersible lift station design because there is no inlet
piping before the impeller. However, these considerations should be taken into account when designing a dry pit
lift station.
The job of the inlet is to convey the liquid from the inlet pipe to the impeller entrance in a fashion that imposes
minimal loss and creates the most uniform velocity profile at the impeller entrance. Therefore, the ideal inlet
geometry is a straight pipe entrance with a slight taper from the pipe flange to the impeller eye. The taper
somewhat increases the velocity and tends to stabilize the fluid streamlines prior to the impeller.
www.JensenEngineeredSystems.com 15
All curved inlets cause at least a minor penalty and, in some cases, a major efficiency penalty. This includes straight
inlets with an elbow attached close to the suction flange. It is preferred to have at least 5 diameters of straight
pipe (the same size as the inlet flange) leading up to the pump inlet to prevent non-uniform velocity profile at the
impeller eye. With submersible pumps, the inlet configuration is planned by the manufacturer based on the
mounting of the pump. Additional features may need to be included in a tank mount to optimize the operation of
the pump.
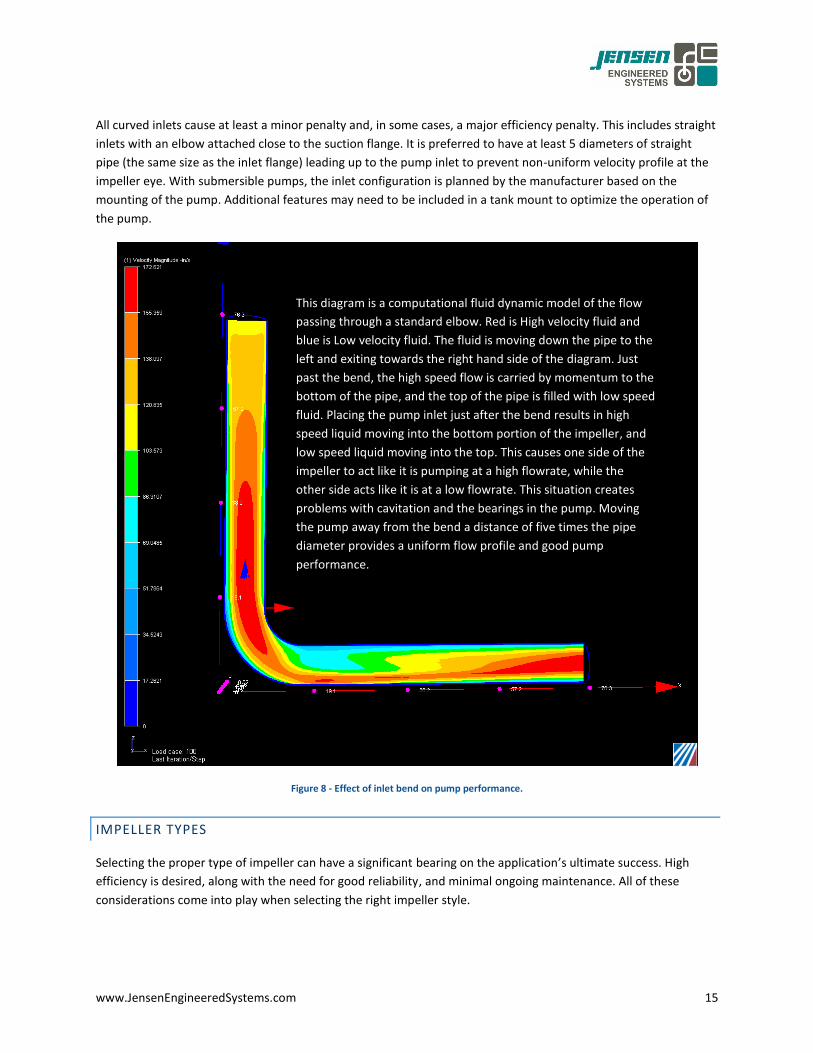
Figure 8 - Effect of inlet bend on pump performance.
IMPELLER TYPES
Selecting the proper type of impeller can have a significant bearing on the application’s ultimate success. High
efficiency is desired, along with the need for good reliability, and minimal ongoing maintenance. All of these
considerations come into play when selecting the right impeller style.
This diagram is a computational fluid dynamic model of the flow
passing through a standard elbow. Red is High velocity fluid and
blue is Low velocity fluid. The fluid is moving down the pipe to the
left and exiting towards the right hand side of the diagram. Just
past the bend, the high speed flow is carried by momentum to the
bottom of the pipe, and the top of the pipe is filled with low speed
fluid. Placing the pump inlet just after the bend results in high
speed liquid moving into the bottom portion of the impeller, and
low speed liquid moving into the top. This causes one side of the
impeller to act like it is pumping at a high flowrate, while the
other side acts like it is at a low flowrate. This situation creates
problems with cavitation and the bearings in the pump. Moving
the pump away from the bend a distance of five times the pipe
diameter provides a uniform flow profile and good pump
performance.
www.JensenEngineeredSystems.com 16
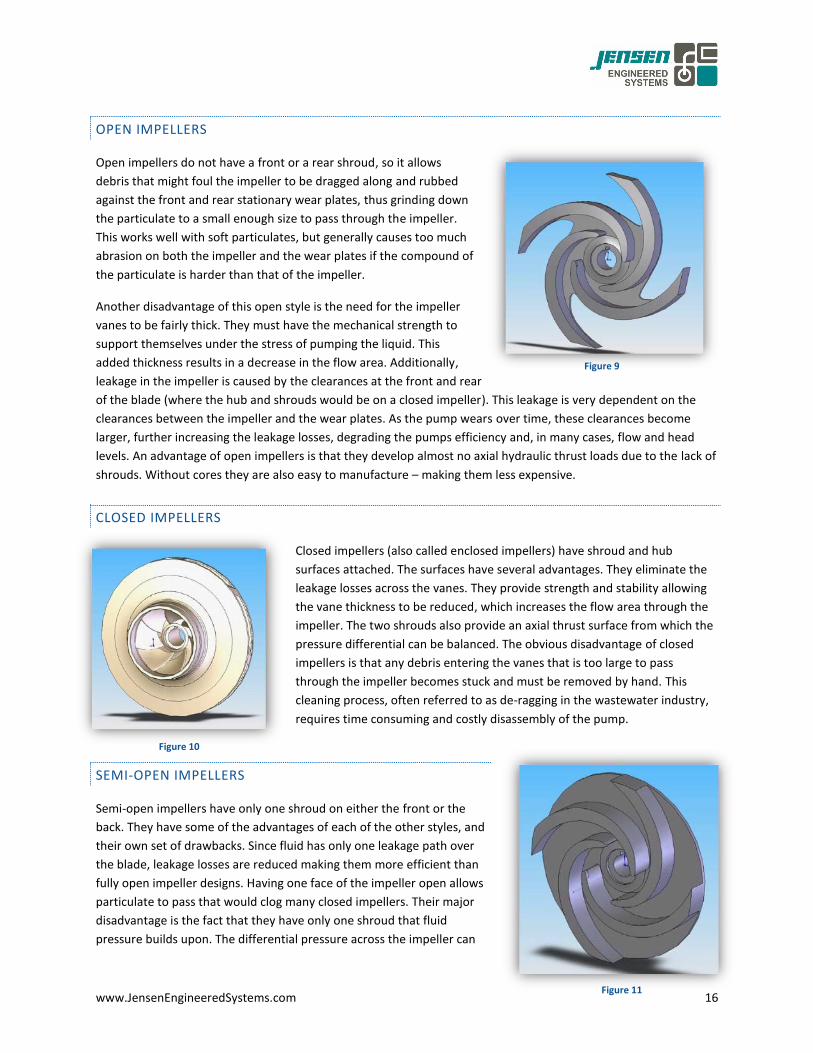
OPEN IMPELLERS
Open impellers do not have a front or a rear shroud, so it allows
debris that might foul the impeller to be dragged along and rubbed
against the front and rear stationary wear plates, thus grinding down
the particulate to a small enough size to pass through the impeller.
This works well with soft particulates, but generally causes too much
abrasion on both the impeller and the wear plates if the compound of
the particulate is harder than that of the impeller.
Another disadvantage of this open style is the need for the impeller
vanes to be fairly thick. They must have the mechanical strength to
support themselves under the stress of pumping the liquid. This
added thickness results in a decrease in the flow area. Additionally,
leakage in the impeller is caused by the clearances at the front and rear
of the blade (where the hub and shrouds would be on a closed impeller). This leakage is very dependent on the
clearances between the impeller and the wear plates. As the pump wears over time, these clearances become
larger, further increasing the leakage losses, degrading the pumps efficiency and, in many cases, flow and head
levels. An advantage of open impellers is that they develop almost no axial hydraulic thrust loads due to the lack of
shrouds. Without cores they are also easy to manufacture – making them less expensive.
CLOSED IMPELLERS
Closed impellers (also called enclosed impellers) have shroud and hub
surfaces attached. The surfaces have several advantages. They eliminate the
leakage losses across the vanes. They provide strength and stability allowing
the vane thickness to be reduced, which increases the flow area through the
impeller. The two shrouds also provide an axial thrust surface from which the
pressure differential can be balanced. The obvious disadvantage of closed
impellers is that any debris entering the vanes that is too large to pass
through the impeller becomes stuck and must be removed by hand. This
cleaning process, often referred to as de-ragging in the wastewater industry,
requires time consuming and costly disassembly of the pump.
SEMI-OPEN IMPELLERS
Semi-open impellers have only one shroud on either the front or the
back. They have some of the advantages of each of the other styles, and
their own set of drawbacks. Since fluid has only one leakage path over
the blade, leakage losses are reduced making them more efficient than
fully open impeller designs. Having one face of the impeller open allows
particulate to pass that would clog many closed impellers. Their major
disadvantage is the fact that they have only one shroud that fluid
pressure builds upon. The differential pressure across the impeller can
Figure 9
Figure 10
Figure 11
www.JensenEngineeredSystems.com 17
cause extreme axial thrust loads putting excessive stress on the bearings, or requiring thrust balancing techniques
that increase leakage losses, or power consumption lowering the pumps overall efficiency
VORTEX IMPELLERS
Vortex impellers are a subset of the semi-open impeller style. Instead of trying to minimize the impeller front
clearance, the impeller is intentionally mounted towards the rear of the casing cavity allowing a large gap between
the rotating vanes and the front of the stationary casing. Often this gap is the size of the discharge port. The
concept is that the spinning impeller creates a forced vortex out in front of the impeller. A low pressure core forms
at the inlet, and speed and pressure increase outward radially until liquid is thrown out the discharge. The
advantage is that particulate can pass through the pump without having to physically pass through the impeller
allowing the pump to pass problem liquids with a larger amount of particulate, or fibrous material, without binding
or clogging.
NON-CLOG IMPELLERS
Often in the sewage or wastewater industry, impellers are designed with a minimal number of vanes to allow
particulate to pass without fouling the impeller. Some designs have only one vane that wraps around the impeller.
More commonly, two and three vane designs are used to improve performance while still allowing the passage of
solids. A common criteria for this style is that it can pass a 3-inch diameter solid without fouling the pump. To meet
this standard, a three inch marble must be able to be rolled through the impeller passage without becoming stuck.
Many of the new, higher efficiency multi-vane impeller designs can no longer pass a 3-inch solid. For applications
where this is a requirement, the manufacturer should be contacted to assure that the pump can actually pass a 3-
ince spherical solid. Generally, non-clog impellers are of the closed design allowing them to maintain clearances in
abrasive environments without the need of continuously replacing wear plates.
MOTORS
When selecting an electric motor, it is important to select one that can develop enough horsepower to drive the
pump. Motors are often selected to be non-overloading at the end of curve. This means that even at the maximum
power requirement for the pump, the motor is large enough to drive the pump without overloading. There are
several important factors that come into play for proper selection of the motor in submersible pumps.
CABLE CONNECTIONS
If the motor is submerged in liquid, the power cable must enter the motor housing at a junction box located below
the liquid level. This is a prime location for a leak. Some manufacturers believe that this should be a rigid,
permanent connection with built-in strain relief. This style connection often has a packing gland around the
entrance of the junction box and, occasionally, a secondary seal to prevent leakage. Other manufacturers see an
advantage to having a quick disconnect on the cable allowing the pump to be replaced without the need to re-
cable the unit to the control panel. If pump changes are frequent due to the need to de-rag the pump or other
operational problems, it may be advantageous to have a pump with a quick disconnect since it allows the unit to
be changed without the need for an electrician.
www.JensenEngineeredSystems.com 18
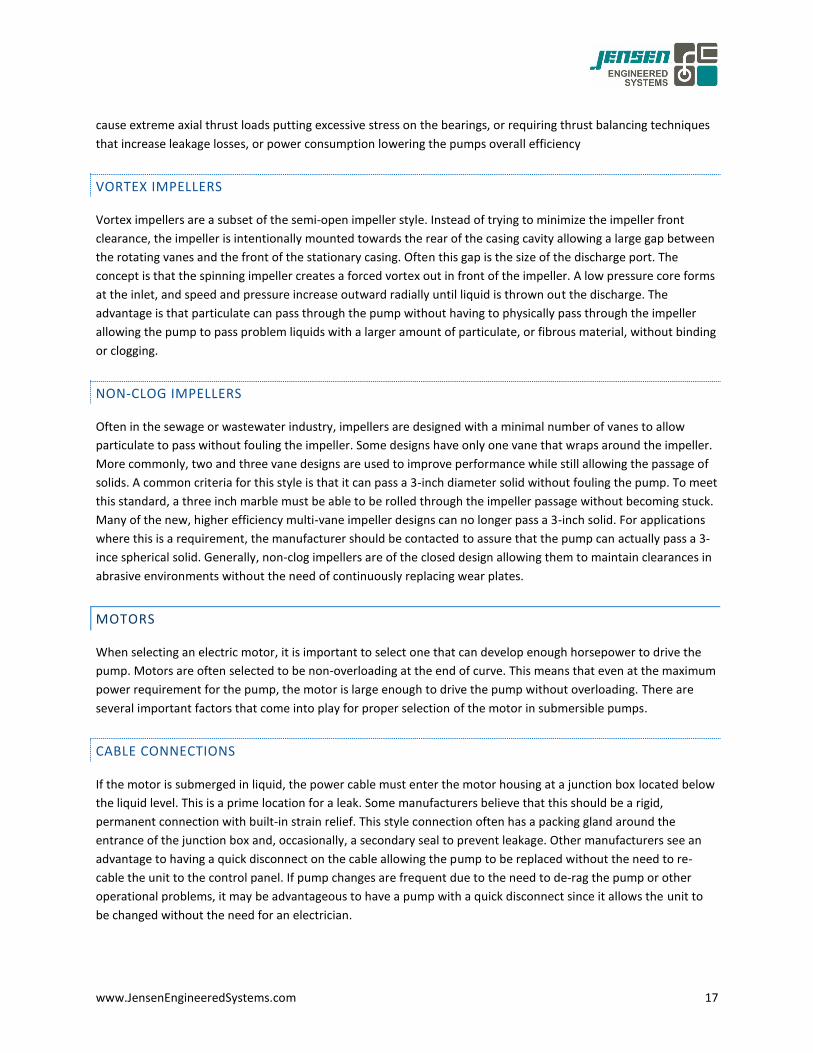
BEARINGS
There are generally two bearings of which to be concerned in submersible pump designs. The first is the upper
bearing designed to support the rotor (pump impeller, shaft, and motor rotor) in the radial direction. This bearing
moves axially via a slip fit to the housing. This design allows for thermal growth in the rotor as it heats during
operation. The second is the lower bearing which is usually responsible for supporting the rotor in both radial and
axial loading. It is fixed in place allowing it to transfer the axial loads from the pump into the motor frame.
(A) (B) (C) (D) (E)
For pure radial loading in pumps, a single row deep groove ball bearing (A) typically works well. These bearings are
inexpensive and have more than enough radial load capability for common pump applications. Occasionally double
row deep groove bearings (B) and roller bearings (E) are used when very high radial loading is expected, however,
these are often more expensive, and are generally found on large horizontal pumps.
For the combination of radial and axial loading, the single row, deep groove bearing can be used, but the axial load
capability is somewhat limited. The double row, deep groove bearing supports much higher axial loading (often 1.7
to 2 times the capability). When very high axial loads are expected, angular contact (C) and tapered roller (D)
bearings can be used. These bearings have 3 to 5 times the load carrying ability, but can only do so in one
direction.
Specifications often include mean time between failures (MTBF) or mean time between repairs (MTBR) at very
high numbers (60K, 80K, 100K hours). This leads the manufacturers to install larger bearings to meet the very high
design life requirements. Bearings running in very lightly loaded conditions often cause the rolling elements to skid
instead of roll. Because more oil is not being drawn in by the rolling action of the bearing, the skidding action
causes the lubricant film between the rotating element and the raceway to dissipate, eventually leading to metal-
to-metal contact. This condition leads to spalling of the bearing and ultimate failure. The most common cause of
bearing failure is actually improper lubrication either from contamination of the lubricant, or poor preventative
maintenance practices.
OIL-FILLED VS AIR-FILLED MOTORS
Oil-filled motors offer several benefits. Due to a much higher thermal transfer capacity of oil as compared to air
(approximately 7X) oil-filled motors tend to run cooler. The oil also provides continuous lubricant for the bearings
and the windings. Some manufacturers claim that the vibration, or start up torque pulses, of the windings causes
the insulation to wear subsequently leading to shorts within the motors. Oil-filled motors are designed to lubricate
the windings and prevent degradation from chaffing during start-up. There are also studies in support of the claim
that oil-filled motors prevent moisture from getting into the hydroscopic insulation on the windings, a benefit
since the insulation tends to breakdown more quickly in moist environments.
Air-filled motors have a lower amount of drag loss as compared to an oil-filled motor. Typical estimates range from
1% to 2% less loss. Air-filled motors work best in applications where the liquids are always cool and provide plenty
of heat dissipation. If heat dissipation might be an issue, oil-filled motors have the advantage over air-filled.
www.JensenEngineeredSystems.com 19
In the case of submersible pumps in dry pit applications, heat dissipation is a major concern. Many manufacturers
will require that the motor stator be jacketed to help remove the motor heat. The jacket circulates liquid over the
outside of the motor helping to dissipate the heat. These jackets typically come in two forms; product-cooled and
self-contained. A product-cooled jacket is a traditional design that cools the motor by passing some of, or the
entire product being pumped, through the jacket. As the pumped product circulates over the motor, the heat is
transferred to the liquid, which is then discharged through a port in the jacket. The product-cooled design is not
recommended in applications where large particulate may cause plugging of the jacket ports and lead to a motor
failure. The self-contained option uses a separate cooling loop to pass clean liquid over the motor and generally
does not suffer from the plugging problem.
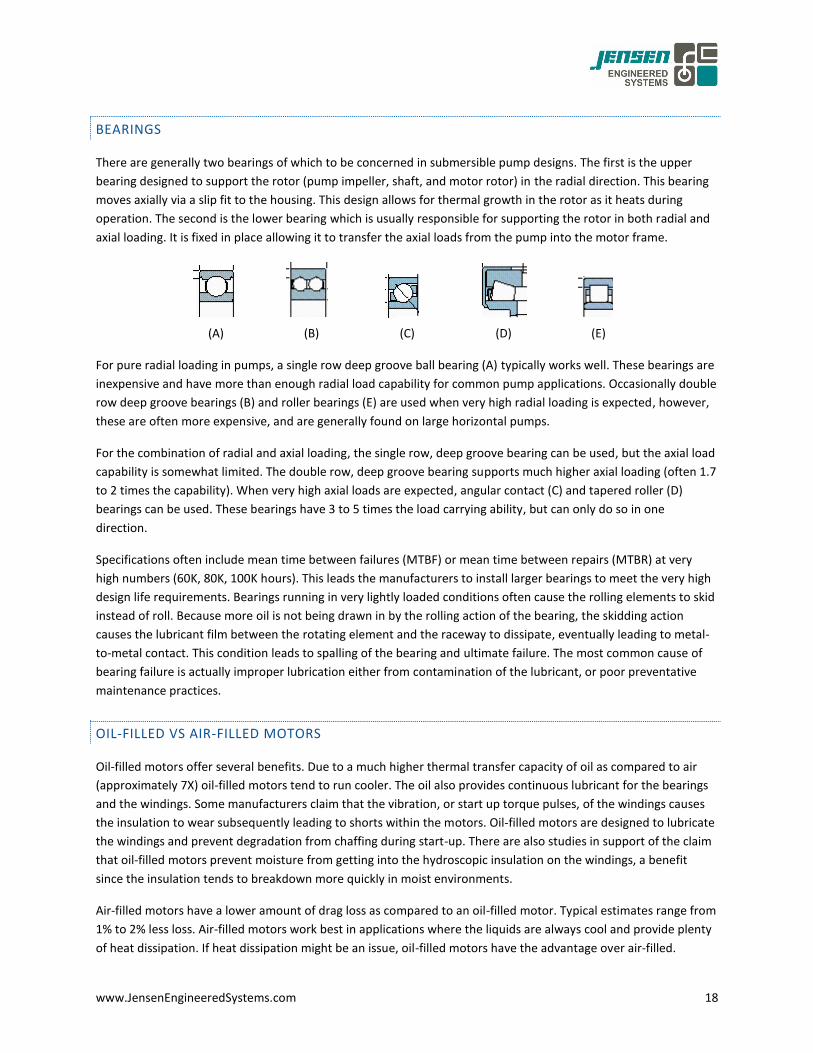
MECHANICAL SEALS
The job of the mechanical seal is to prevent the liquid being pumped from leaking into the bearing and motor
housing. This is accomplished by rotating one extremely flat seal face in very close proximity to a stationary face of
approximately equal flatness. The faces are lapped to within 2-4 helium light bands of being perfectly flat. In the
space shown as the fluid wedge in the diagram below, a small amount of liquid is wicked through the faces and is
vaporized by the heat generated by their rotation. There must be liquid in the seal faces to cool and lubricate
them. Seal faces fail quickly when they run dry – sometimes within fractions of a second. In a typical single seal
pump, pumped liquid passes through the faces and vaporizes as it enters that atmosphere. Some small
submersible pumps use a single seal to protect the motor from the pumped liquid.
Figure 12 - Typical single seal in a process pump
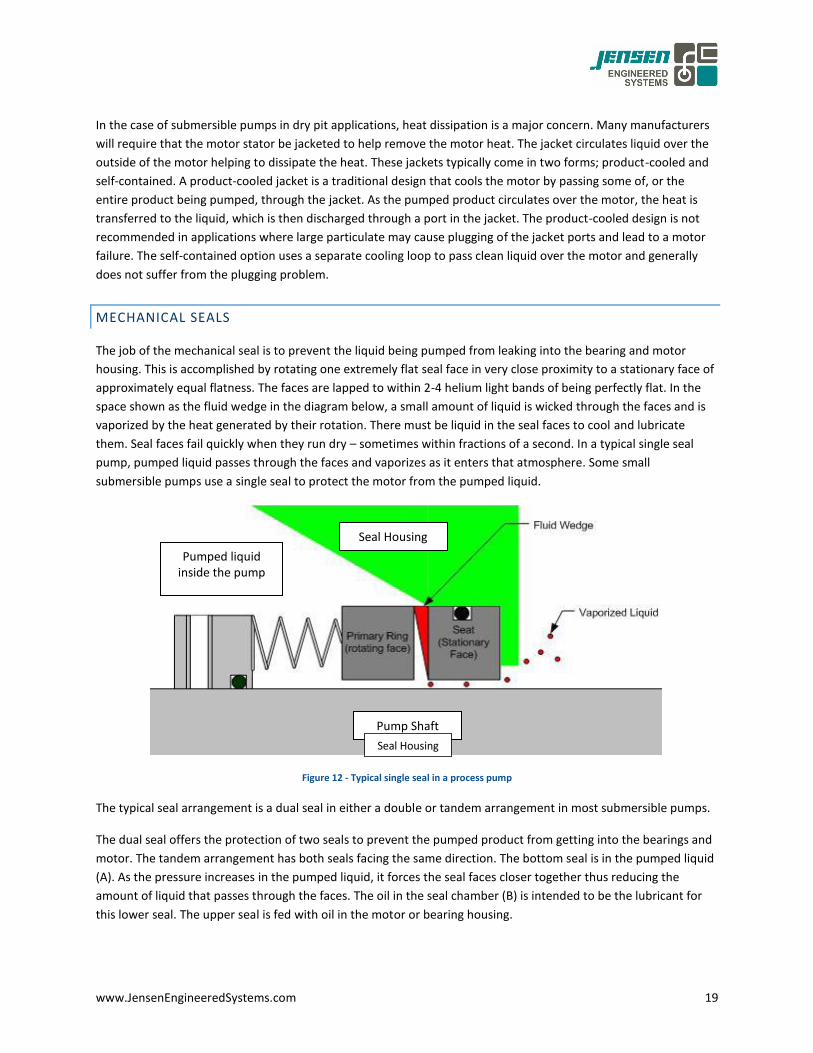
The typical seal arrangement is a dual seal in either a double or tandem arrangement in most submersible pumps.
The dual seal offers the protection of two seals to prevent the pumped product from getting into the bearings and
motor. The tandem arrangement has both seals facing the same direction. The bottom seal is in the pumped liquid
(A). As the pressure increases in the pumped liquid, it forces the seal faces closer together thus reducing the
amount of liquid that passes through the faces. The oil in the seal chamber (B) is intended to be the lubricant for
this lower seal. The upper seal is fed with oil in the motor or bearing housing.
Seal Housing
Pump Shaft Seal Housing
Pumped liquid inside the pump
www.JensenEngineeredSystems.com 20
With a double seal, the two seals are positioned back to back.
This has the advantage that both seals are operating in the
clean oil environment. The disadvantage is that a pressure
spike in the liquid on the pump side of the seal can cause the
seal faces to force open and product can be introduced into
the seal cavity. This reduces or destroys the lubricity of the oil
in the seal chamber, eventually leading to bearing failure.
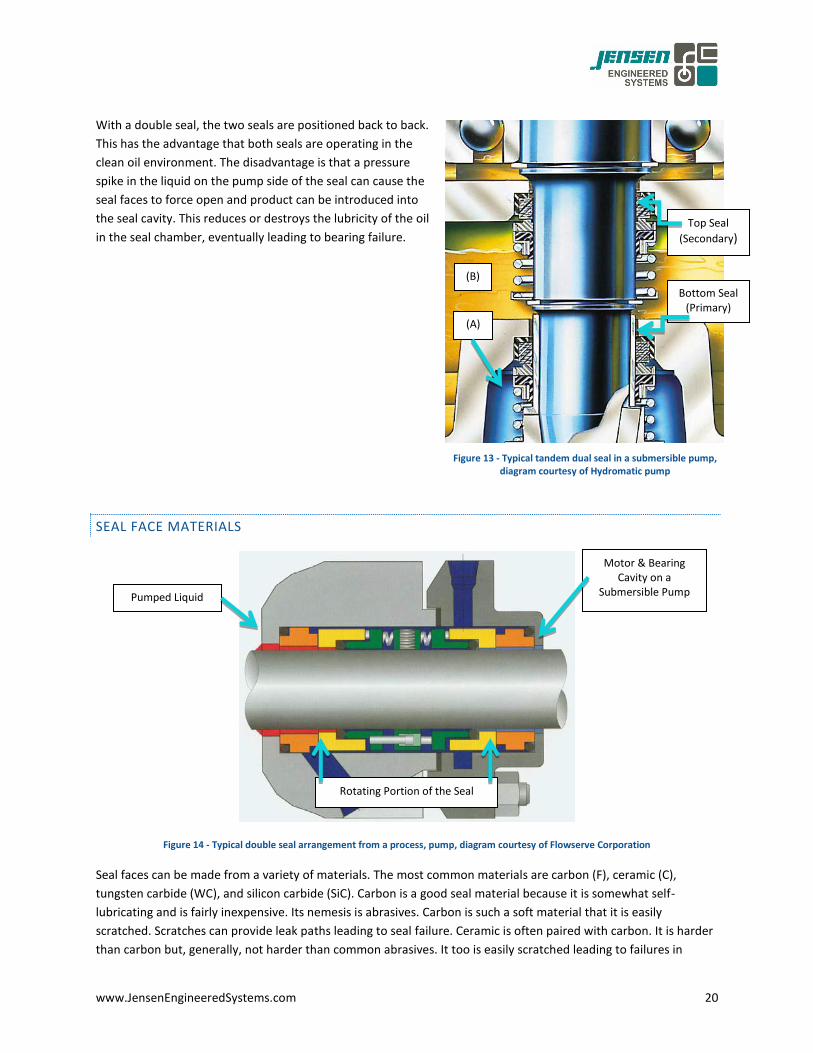
SEAL FACE MATERIALS
Figure 14 - Typical double seal arrangement from a process, pump, diagram courtesy of Flowserve Corporation
Seal faces can be made from a variety of materials. The most common materials are carbon (F), ceramic (C),
tungsten carbide (WC), and silicon carbide (SiC). Carbon is a good seal material because it is somewhat self-
lubricating and is fairly inexpensive. Its nemesis is abrasives. Carbon is such a soft material that it is easily
scratched. Scratches can provide leak paths leading to seal failure. Ceramic is often paired with carbon. It is harder
than carbon but, generally, not harder than common abrasives. It too is easily scratched leading to failures in
Figure 13 - Typical tandem dual seal in a submersible pump, diagram courtesy of Hydromatic pump
Bottom Seal (Primary)
Top Seal
(Secondary)
(A)
(B)
Pumped Liquid
Motor & Bearing Cavity on a
Submersible Pump
Rotating Portion of the Seal
www.JensenEngineeredSystems.com 21
abrasive environments. Ceramic does not have the mechanical strength of Tungsten and Silicon Carbide (it flexes
under pressure). It is susceptible to thermal shock (quick temperature change) causing it to shatter. Its primary
attribute is that it is inexpensive, and therefore very popular. Tungsten Carbide is an extremely hard material that
has very good mechanical properties coupled with excellent corrosion resistance. The material does extremely well
in abrasive conditions. Silicon Carbide is slightly harder than Tungsten Carbide. It has excellent corrosion resistance
and very good mechanical properties. Silicon Carbide is often paired with Tungsten Carbide as a combination of
faces in abrasive situations.
In most wastewater applications, it is desirable to have the primary seal made from harder materials such as SiC vs
SiC, or SiC vs WC. The upper seal should only be pumping oil, so a carbon ceramic seal would be a good choice.
Some companies offer both seals with hard faces, but unless there is a particular reason, the use of F vs C can
reduce the amount of heat generated by the seal and decrease the cost of the pump.
MOISTURE SENSORS
So what if the mechanical seals fail? How would you know? On typical process equipment, the puddle under the
pump is your first warning. With submersible equipment, there is no such visual indicator. Most manufacturers of
submersible equipment have at least one moisture detection device in the pump. These devices are typically time-
tested technologies that indicate when there is moisture in a portion of the pump where there should be none.
The location of these sensors is important. Some manufacturers mount the sensor in the cavity between the
primary and the secondary seal. If the primary seal leaks, the secondary seal prevents the liquid from getting to the
bearings and motor where it can cause damage. Since the pump does not need to be shut down immediately, most
Manufacturers using this method additionally state that the pump repair can then be scheduled for a convenient
time. Other manufactures locate the sensor in the motor cavity. This location can be problematic because liquid
has already reached the bearings and motor when the sensor indicates there is a problem, thus requiring an
immediate shutdown of the unit to prevent further damage.
www.JensenEngineeredSystems.com 22
PUMP CURVES
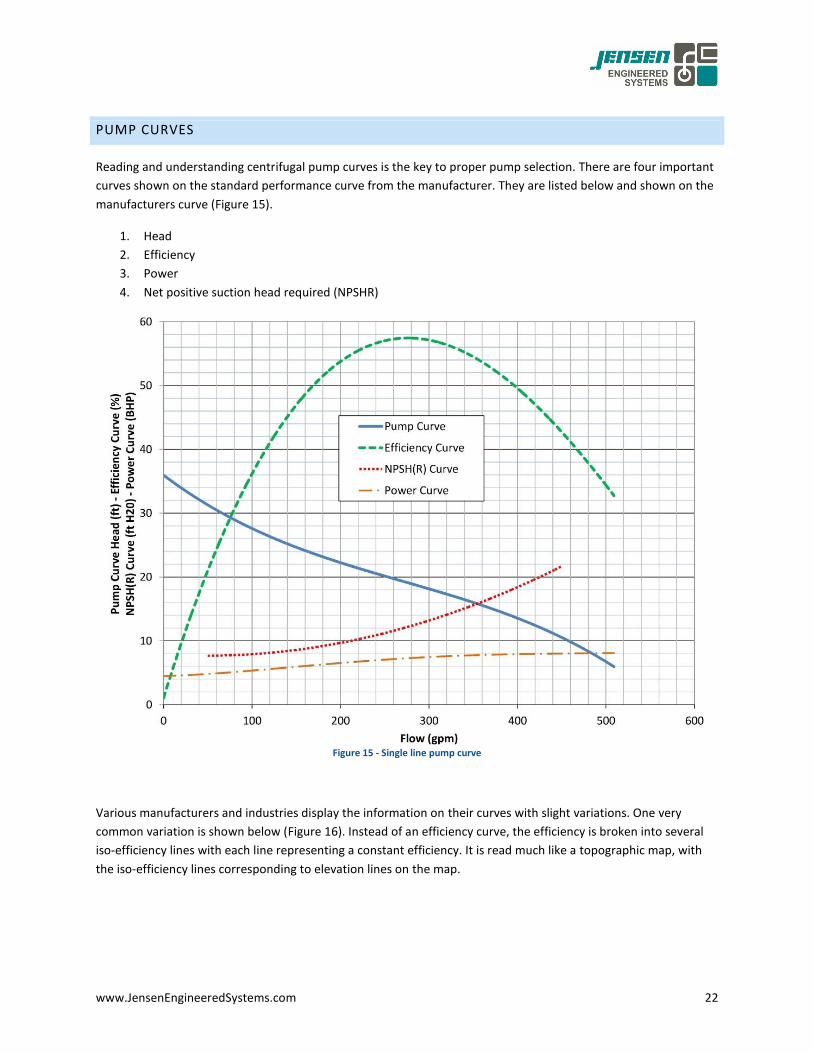
Reading and understanding centrifugal pump curves is the key to proper pump selection. There are four important
curves shown on the standard performance curve from the manufacturer. They are listed below and shown on the
manufacturers curve (Figure 15).
1. Head
2. Efficiency
3. Power
4. Net positive suction head required (NPSHR)
Figure 15 - Single line pump curve
Various manufacturers and industries display the information on their curves with slight variations. One very
common variation is shown below (Figure 16). Instead of an efficiency curve, the efficiency is broken into several
iso-efficiency lines with each line representing a constant efficiency. It is read much like a topographic map, with
the iso-efficiency lines corresponding to elevation lines on the map.
www.JensenEngineeredSystems.com 23
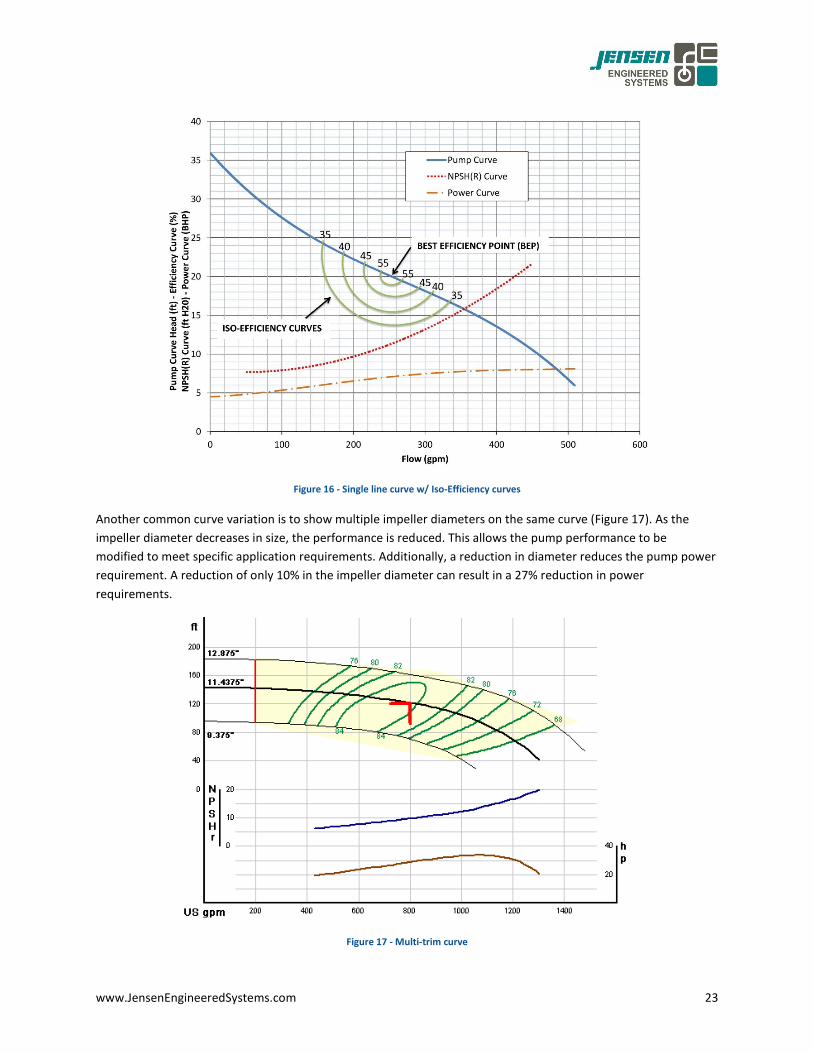
Figure 16 - Single line curve w/ Iso-Efficiency curves
Another common curve variation is to show multiple impeller diameters on the same curve (Figure 17). As the
impeller diameter decreases in size, the performance is reduced. This allows the pump performance to be
modified to meet specific application requirements. Additionally, a reduction in diameter reduces the pump power
requirement. A reduction of only 10% in the impeller diameter can result in a 27% reduction in power
requirements.
Figure 17 - Multi-trim curve
www.JensenEngineeredSystems.com 24
STEEPNESS OF PUMP CURVE
Pump head curves with very flat head flow characteristics can make the pump difficult to control. Small
changes in system resistance can create large changes in flowrate. The pump difficulty arises in
situations that have a flat system loss curve. The problem is exacerbated when variable-frequency drives
are used to control the pump operating point.
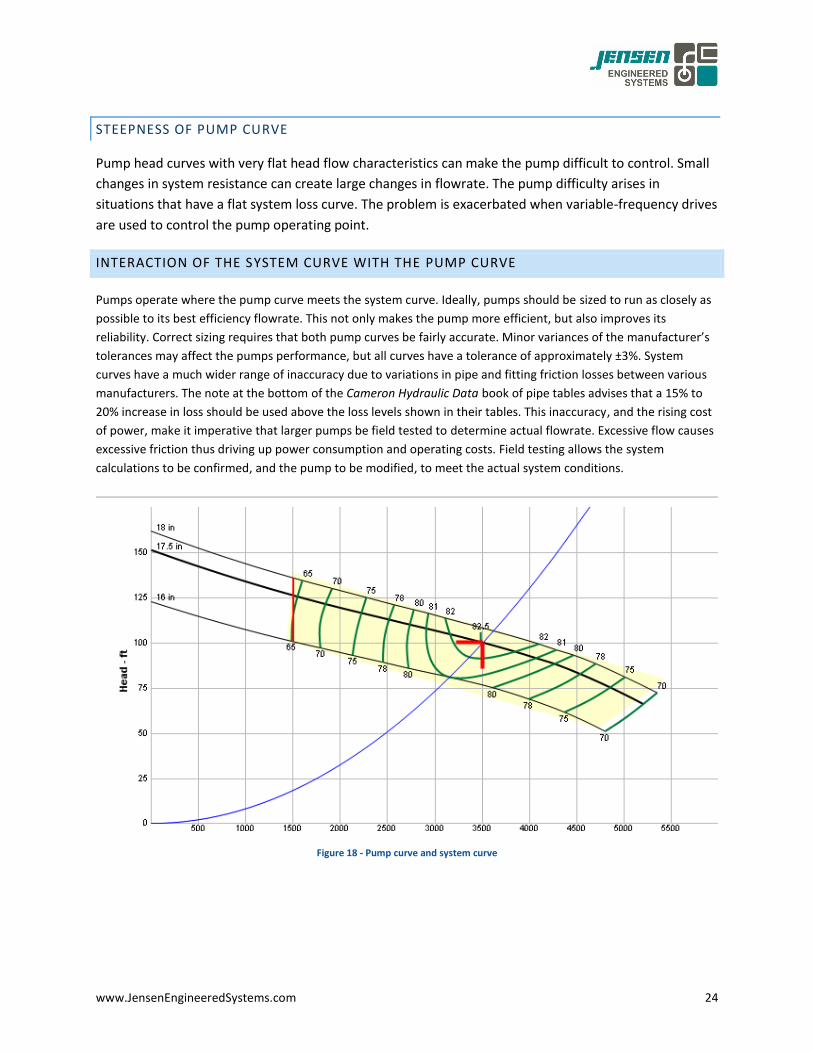
INTERACTION OF THE SYSTEM CURVE WITH THE PUMP CURVE
Pumps operate where the pump curve meets the system curve. Ideally, pumps should be sized to run as closely as
possible to its best efficiency flowrate. This not only makes the pump more efficient, but also improves its
reliability. Correct sizing requires that both pump curves be fairly accurate. Minor variances of the manufacturer’s
tolerances may affect the pumps performance, but all curves have a tolerance of approximately ±3%. System
curves have a much wider range of inaccuracy due to variations in pipe and fitting friction losses between various
manufacturers. The note at the bottom of the Cameron Hydraulic Data book of pipe tables advises that a 15% to
20% increase in loss should be used above the loss levels shown in their tables. This inaccuracy, and the rising cost
of power, make it imperative that larger pumps be field tested to determine actual flowrate. Excessive flow causes
excessive friction thus driving up power consumption and operating costs. Field testing allows the system
calculations to be confirmed, and the pump to be modified, to meet the actual system conditions.
Figure 18 - Pump curve and system curve
www.JensenEngineeredSystems.com 25
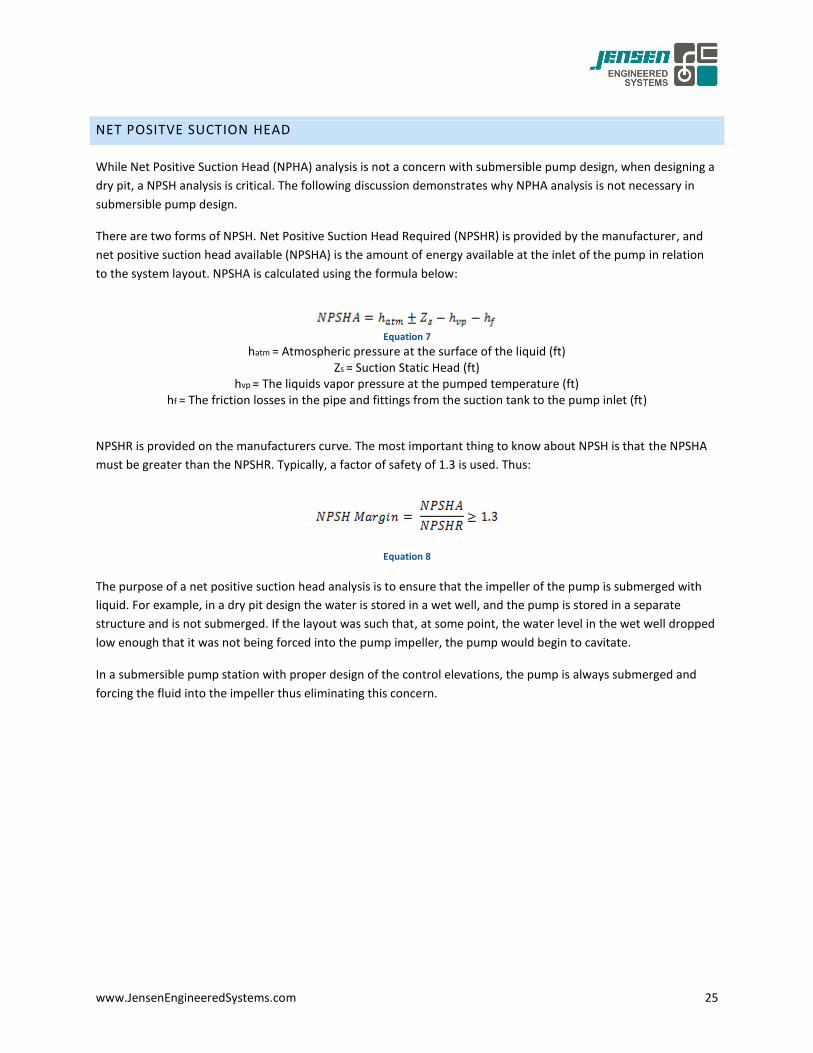
NET POSITVE SUCTION HEAD
While Net Positive Suction Head (NPHA) analysis is not a concern with submersible pump design, when designing a
dry pit, a NPSH analysis is critical. The following discussion demonstrates why NPHA analysis is not necessary in
submersible pump design.
There are two forms of NPSH. Net Positive Suction Head Required (NPSHR) is provided by the manufacturer, and
net positive suction head available (NPSHA) is the amount of energy available at the inlet of the pump in relation
to the system layout. NPSHA is calculated using the formula below:
Equation 7
hatm = Atmospheric pressure at the surface of the liquid (ft) Zs = Suction Static Head (ft)
hvp = The liquids vapor pressure at the pumped temperature (ft) hf = The friction losses in the pipe and fittings from the suction tank to the pump inlet (ft)
NPSHR is provided on the manufacturers curve. The most important thing to know about NPSH is that the NPSHA
must be greater than the NPSHR. Typically, a factor of safety of 1.3 is used. Thus:
Equation 8
The purpose of a net positive suction head analysis is to ensure that the impeller of the pump is submerged with
liquid. For example, in a dry pit design the water is stored in a wet well, and the pump is stored in a separate
structure and is not submerged. If the layout was such that, at some point, the water level in the wet well dropped
low enough that it was not being forced into the pump impeller, the pump would begin to cavitate.
In a submersible pump station with proper design of the control elevations, the pump is always submerged and
forcing the fluid into the impeller thus eliminating this concern.
www.JensenEngineeredSystems.com 26
INTRODUCTION TO WET WELL DESIGN
Once the system curve has been created and a pump performance has been properly matched to that system
curve (refer to Pumps section of this manual to determine pump performance), the wet well can be sized.
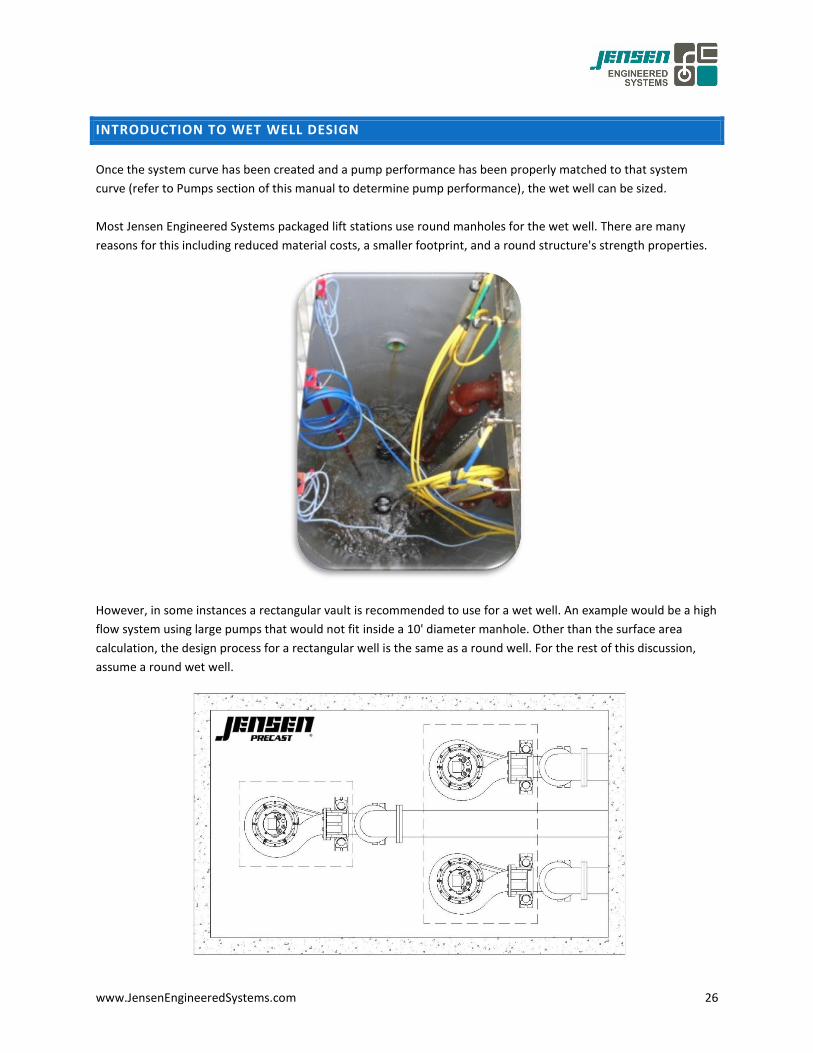
Most Jensen Engineered Systems packaged lift stations use round manholes for the wet well. There are many
reasons for this including reduced material costs, a smaller footprint, and a round structure's strength properties.
However, in some instances a rectangular vault is recommended to use for a wet well. An example would be a high
flow system using large pumps that would not fit inside a 10' diameter manhole. Other than the surface area
calculation, the design process for a rectangular well is the same as a round well. For the rest of this discussion,
assume a round wet well.

www.JensenEngineeredSystems.com 27
MINIMUM STORAGE VOLUME
The following discussion concerning wet well sizing is based upon the assumption of a "low" flow system of less
than 3000 gpm. Systems with flows larger than 3000 gpm require additional considerations.
The first design criteria to identify are the total system inflow rate and the flow at which the pumps will discharge.
As discussed in the pump design section, the discharge flow can be found at the intersection of the system curve
and the pump performance curve. These flows will be identified as:
QIN = Inflow rate into wet well (gpm)
QOUT = Discharge flow rate out of wet well (gpm)
The intent is to determine the minimum storage volume the wet well needs to hold between pump starts.
Typically the recommended minimum time between pump starts should be eight to ten minutes, or roughly six
starts per hour. However, this can vary from manufacturer to manufacturer so check with the particular pump
maker. Also, verify the minimum run time of the pumps with the manufacturer. These values will be represented
as follows:
TMIN = Minimum cycle time between pump starts (minutes)
VMIN = Minimum storage volume of wet well to hold/gather fluid during pump off (gallons)
www.JensenEngineeredSystems.com 28
V(min) can be determined by starting with the following equation which relates the inflow, storage volume, and
outflow to T(min):
Hydraulic Institute Intake Design – 1998 Equation B.1
Assuming the flows entering the wet well have been properly estimated, and an appropriate pump has been
selected for the demand, the worst case scenario is that the inflow is twice the rate as the outflow. Or:
QIN = QOUT / 2
Equation V.1
The result of plugging this into the QIN component of equation 1 and rearranging for VMIN is:
Equation V.2
Therefore:
Equation V.3
SIZE OF WELL
So, the minimum volume of the wet well needs to handle all inflow rates has been determined. Now the wet well
shape and size needs to be selected. This is an iterative process. A good place to start is by sizing the minimum
hatch dimensions, as this sets the minimum well diameter.
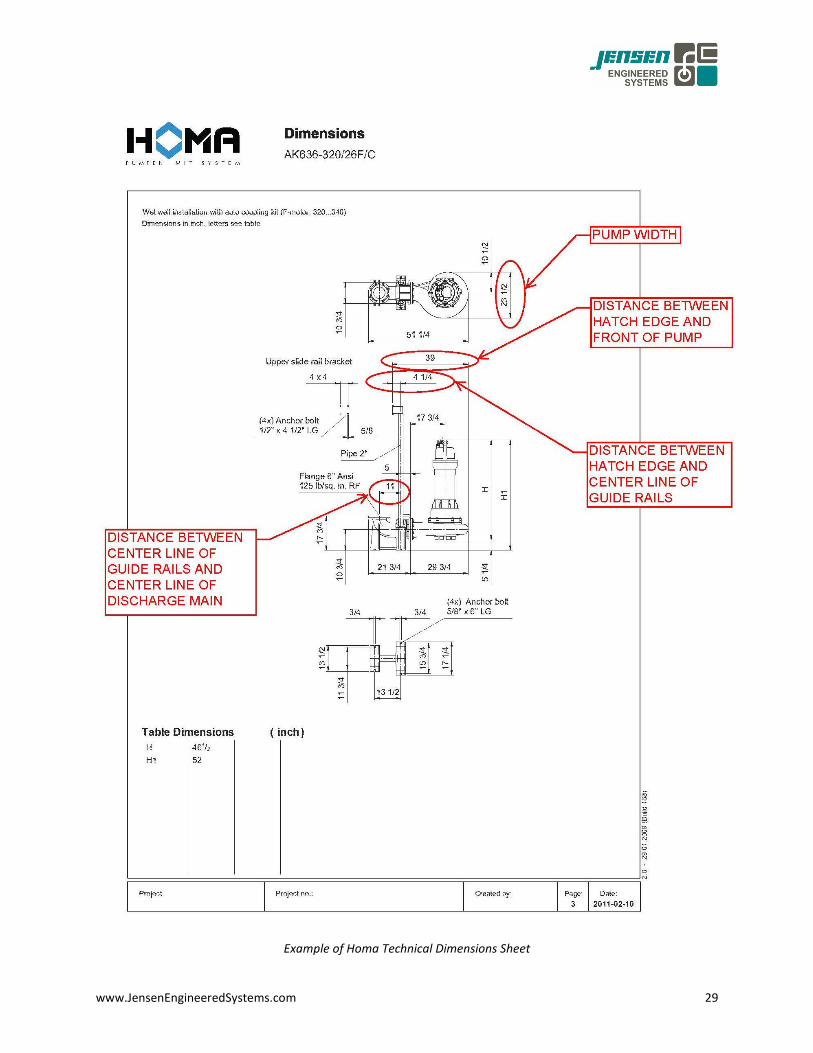
HATCH SIZING
First, determine the horizontal dimensions of the pumps by referring to the technical information sheets for the
selected pump. Some important dimensions are shown in the example on the following page.
www.JensenEngineeredSystems.com 29
Example of Homa Technical Dimensions Sheet
www.JensenEngineeredSystems.com 30
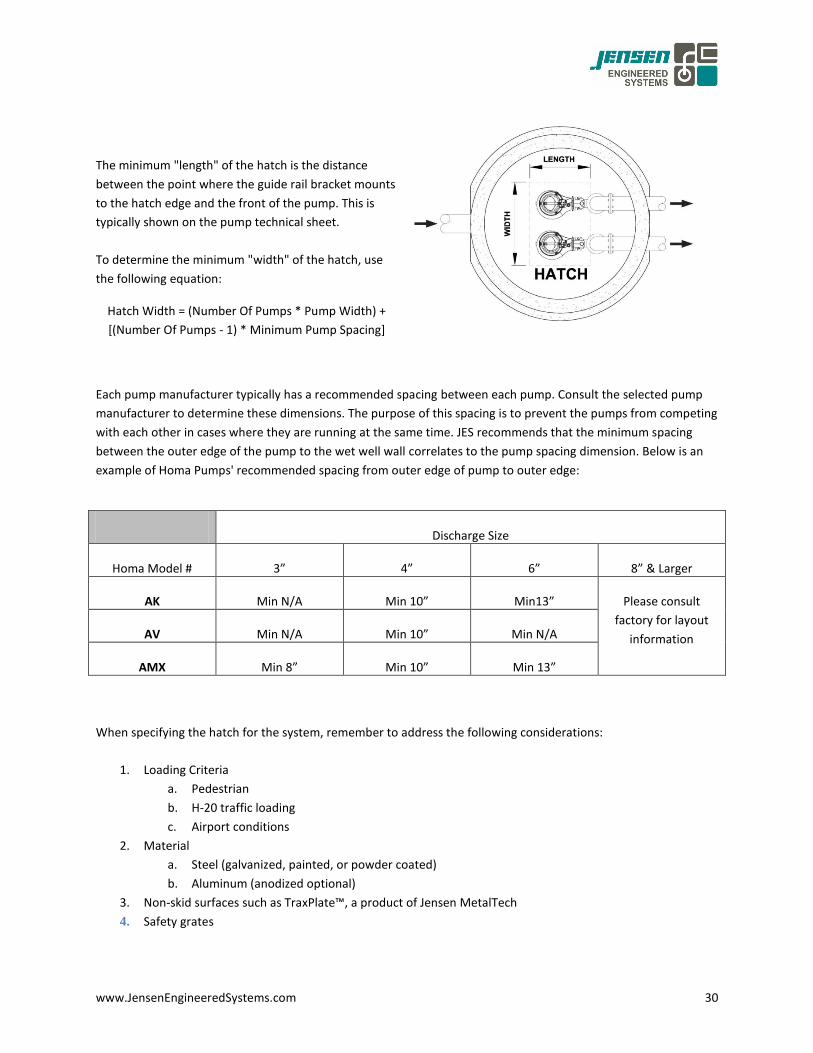
The minimum "length" of the hatch is the distance
between the point where the guide rail bracket mounts
to the hatch edge and the front of the pump. This is
typically shown on the pump technical sheet.
To determine the minimum "width" of the hatch, use
the following equation:
Hatch Width = (Number Of Pumps * Pump Width) +
[(Number Of Pumps - 1) * Minimum Pump Spacing]
Each pump manufacturer typically has a recommended spacing between each pump. Consult the selected pump
manufacturer to determine these dimensions. The purpose of this spacing is to prevent the pumps from competing
with each other in cases where they are running at the same time. JES recommends that the minimum spacing
between the outer edge of the pump to the wet well wall correlates to the pump spacing dimension. Below is an
example of Homa Pumps' recommended spacing from outer edge of pump to outer edge:
Discharge Size
Homa Model # 3” 4” 6” 8” & Larger
AK Min N/A Min 10” Min13” Please consult
factory for layout
information AV Min N/A Min 10” Min N/A
AMX Min 8” Min 10” Min 13”
When specifying the hatch for the system, remember to address the following considerations:
1. Loading Criteria
a. Pedestrian
b. H-20 traffic loading
c. Airport conditions
2. Material
a. Steel (galvanized, painted, or powder coated)
b. Aluminum (anodized optional)
3. Non-skid surfaces such as TraxPlate™, a product of Jensen MetalTech
4. Safety grates
www.JensenEngineeredSystems.com 31
DIAMETER OF WELL
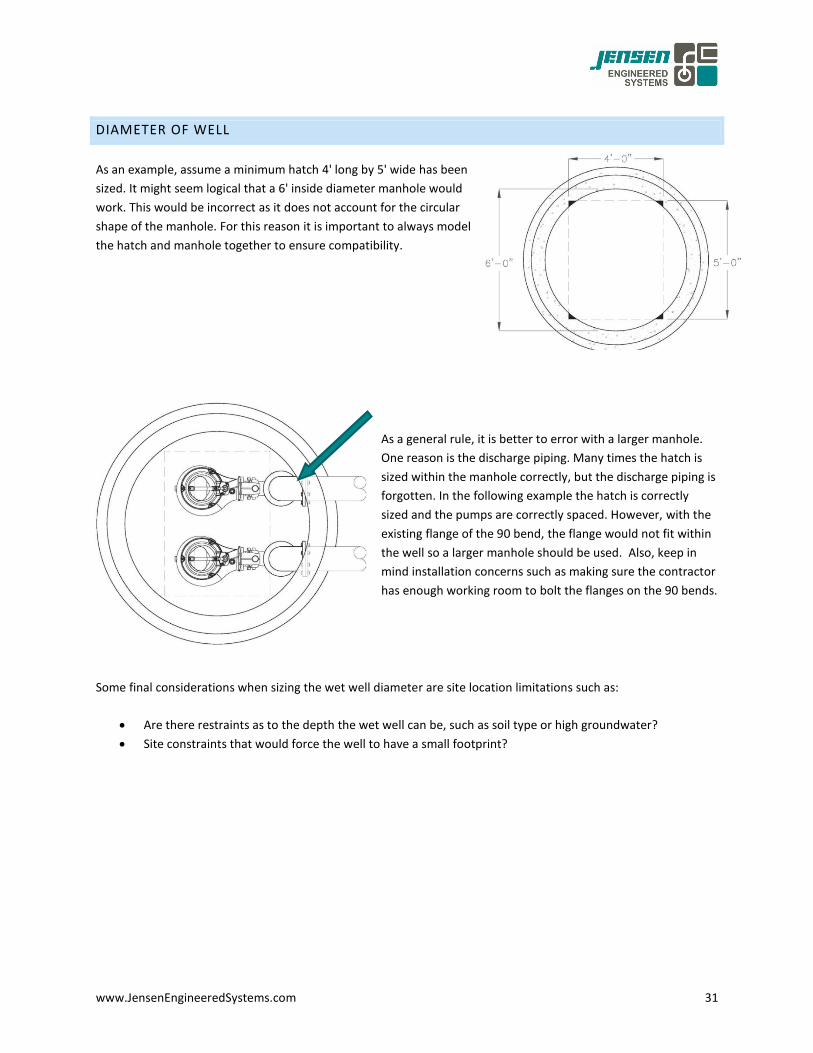
As an example, assume a minimum hatch 4' long by 5' wide has been
sized. It might seem logical that a 6' inside diameter manhole would
work. This would be incorrect as it does not account for the circular
shape of the manhole. For this reason it is important to always model
the hatch and manhole together to ensure compatibility.
As a general rule, it is better to error with a larger manhole.
One reason is the discharge piping. Many times the hatch is
sized within the manhole correctly, but the discharge piping is
forgotten. In the following example the hatch is correctly
sized and the pumps are correctly spaced. However, with the
existing flange of the 90 bend, the flange would not fit within
the well so a larger manhole should be used. Also, keep in
mind installation concerns such as making sure the contractor
has enough working room to bolt the flanges on the 90 bends.
Some final considerations when sizing the wet well diameter are site location limitations such as:
Are there restraints as to the depth the wet well can be, such as soil type or high groundwater?
Site constraints that would force the well to have a small footprint?
www.JensenEngineeredSystems.com 32
CONTROL ELEVATIONS
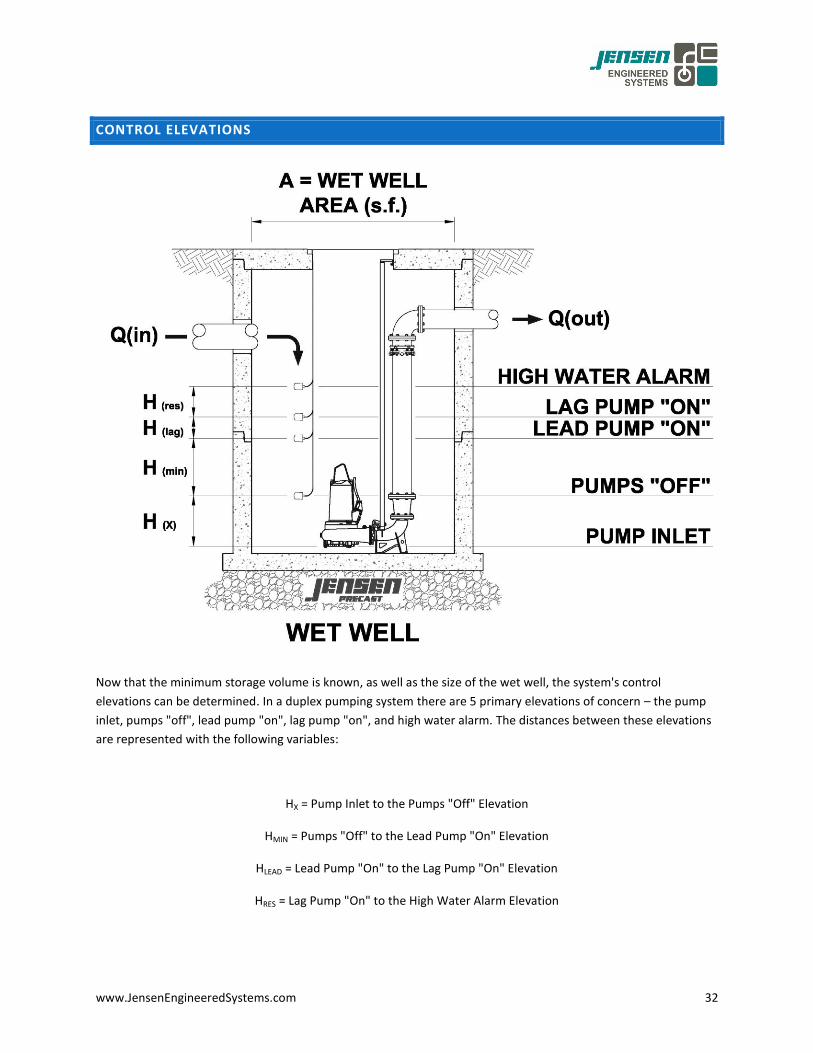
Now that the minimum storage volume is known, as well as the size of the wet well, the system's control
elevations can be determined. In a duplex pumping system there are 5 primary elevations of concern – the pump
inlet, pumps "off", lead pump "on", lag pump "on", and high water alarm. The distances between these elevations
are represented with the following variables:
HX = Pump Inlet to the Pumps "Off" Elevation
HMIN = Pumps "Off" to the Lead Pump "On" Elevation
HLEAD = Lead Pump "On" to the Lag Pump "On" Elevation
HRES = Lag Pump "On" to the High Water Alarm Elevation
www.JensenEngineeredSystems.com 33
HX – MINIMUM SUBMERGENCE
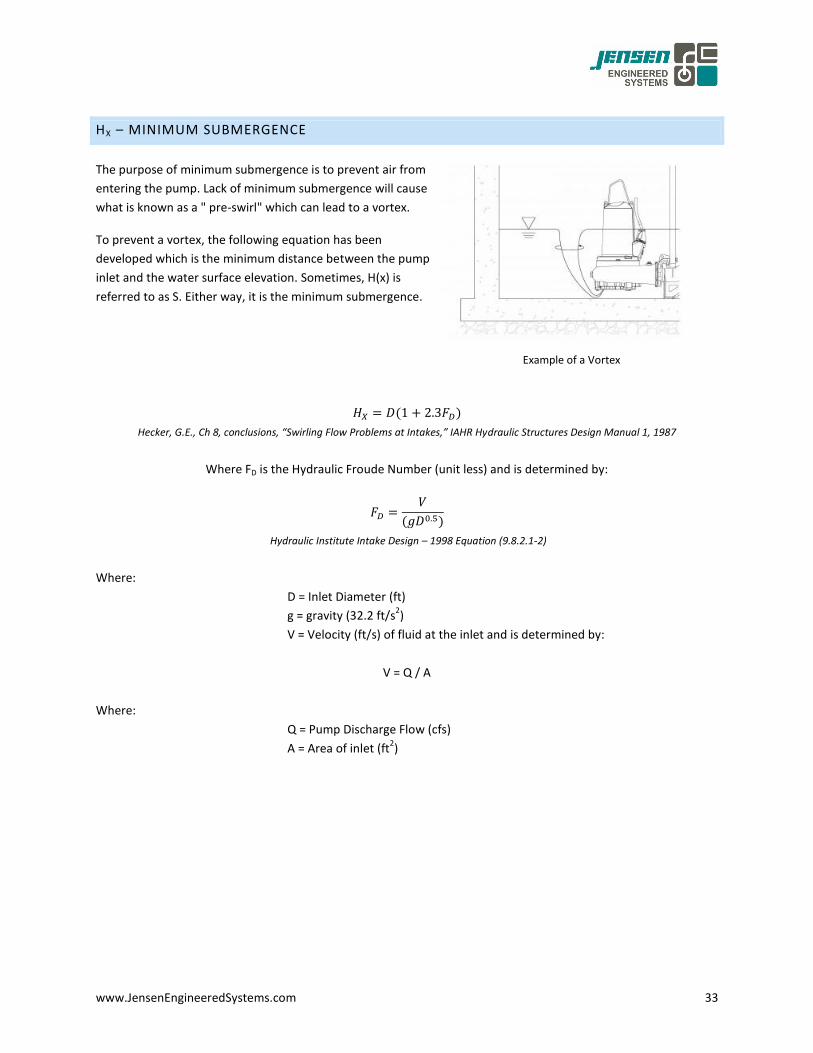
The purpose of minimum submergence is to prevent air from
entering the pump. Lack of minimum submergence will cause
what is known as a " pre-swirl" which can lead to a vortex.
To prevent a vortex, the following equation has been
developed which is the minimum distance between the pump
inlet and the water surface elevation. Sometimes, H(x) is
referred to as S. Either way, it is the minimum submergence.
Hecker, G.E., Ch 8, conclusions, “Swirling Flow Problems at Intakes,” IAHR Hydraulic Structures Design Manual 1, 1987
Where FD is the Hydraulic Froude Number (unit less) and is determined by:
Hydraulic Institute Intake Design – 1998 Equation (9.8.2.1-2)
Where:
D = Inlet Diameter (ft)
g = gravity (32.2 ft/s2)
V = Velocity (ft/s) of fluid at the inlet and is determined by:
V = Q / A
Where:
Q = Pump Discharge Flow (cfs)
A = Area of inlet (ft2)
Example of a Vortex
www.JensenEngineeredSystems.com 34
HMIN – MINIMUM STORAGE
H(min) is the distance between the pumps “off” and lead pump "on" elevations. It is determined by the following
equation.
HMIN = VMIN / A
Where:
VMIN = Minimum storage volume (gallons)
A = Cross sectional area of wet well (sq.ft.)
HLAG – LAG STORAGE
Duplex submersible pump stations should be sized so that one pump will be able to handle peak flow events.
During events where the inflow exceeds the predicted max flow, the second pump can be used to handle the
additional flows. This is where H(lag) comes into play. It is an arbitrary factor of safety set by the engineer.
Typically, in smaller flow stations of less than 200 gpm, an H(lag) of at least six inches is recommended. The larger
the engineer makes H(lag), the more conservative the system, but material and construction costs will increase.
HRES – RESERVOIR STORAGE
As with H(lag), H(res) is a factor of safety built into the submersible pump station. In the event the actual inflow far
exceeds the max predicted inflow, or a pump fails, an alarm is triggered. This alarm signals station operators that
there is a problem. For smaller flow stations (less than 200 gpm) an H(lag) of at least twelve inches is
recommended. However, this should be a decision made by the engineer on a system by system basis.
We hope these guidelines have been helpful. For additional information on Pump Station and Wet Well Design,
contact Jensen Engineered Systems at 855-468-5600, or visit www.JensenEngineeredSystems.com.