Embed Size (px)
Citation preview
PUMA SE
FINANCIAL REPORT
January – June of 2015

- 2 -
CONTENT
Key Figures 3
Interim Management Report
- General Economic Conditions 4
- Brand and Product Update 4
- Strategy Update 5
- Sales and Earnings Development 6 - 9
- Net Assets and Financial Position 10
- Outlook 11
Interim Consolidated Financial Statements
- Balance Sheet 12
- Income Statement 13
- Statement of Comprehensive Income 14
- Cashflow Statement 15
- Changes in Equity 16
- Operating Segments 17 - 18
- Notes to the Financial Report 19 – 21
Managing Directors / Administrative Board 22
Financial Calendar 23
0
10
20
30
40
50
60
70
80
90
0
20
40
60
80
100
120
Development of the PUMA ShareRebased Development incl. Trading Volume (Xetra)
Xetra Trading Volume PUMA Share SDAX Index
July Aug Sep Oct Nov Dec Jan Feb Mar Apr May June
- 3 -
1.520
1.651
1.559
1.462
1.648
2011 2012 2013 2014 2015
BRAND SALES Jan. - June (€ million)
1.447
1.574
1.474
1.378
1.594
2011 2012 2013 2014 2015
CONSOLIDATED SALES Jan. - June (€ million)
7,696,72
4,54
2,661,44
2011 2012 2013 2014 2015
EARNINGS PER SHAREJan. - June (€)
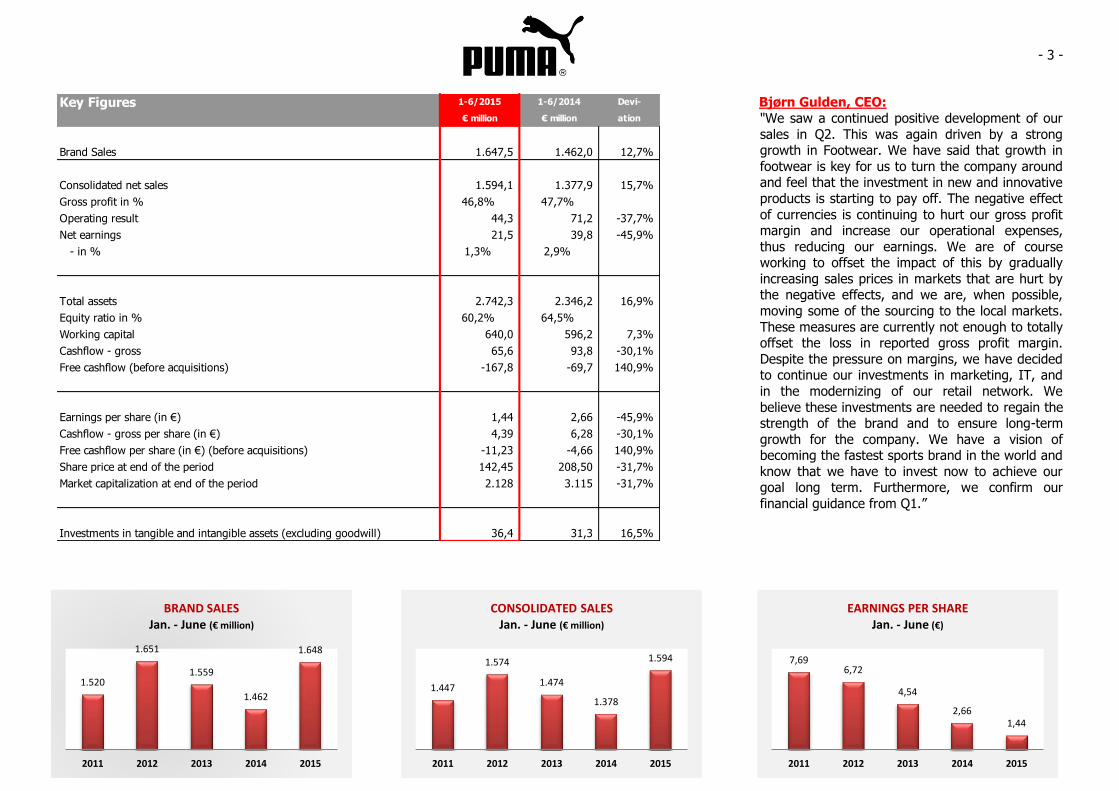
Bjørn Gulden, CEO:
"We saw a continued positive development of our
sales in Q2. This was again driven by a strong growth in Footwear. We have said that growth in
footwear is key for us to turn the company around and feel that the investment in new and innovative
products is starting to pay off. The negative effect
of currencies is continuing to hurt our gross profit margin and increase our operational expenses,
thus reducing our earnings. We are of course working to offset the impact of this by gradually
increasing sales prices in markets that are hurt by the negative effects, and we are, when possible,
moving some of the sourcing to the local markets.
These measures are currently not enough to totally offset the loss in reported gross profit margin.
Despite the pressure on margins, we have decided to continue our investments in marketing, IT, and
in the modernizing of our retail network. We
believe these investments are needed to regain the strength of the brand and to ensure long-term
growth for the company. We have a vision of becoming the fastest sports brand in the world and
know that we have to invest now to achieve our goal long term. Furthermore, we confirm our
financial guidance from Q1.”
Key Figures 1-6/2015 1-6/2014 Devi-
€ million € million ation
Brand Sales 1.647,5 1.462,0 12,7%
Consolidated net sales 1.594,1 1.377,9 15,7%
Gross profit in % 46,8% 47,7%
Operating result 44,3 71,2 -37,7%
Net earnings 21,5 39,8 -45,9%
- in % 1,3% 2,9%
Total assets 2.742,3 2.346,2 16,9%
Equity ratio in % 60,2% 64,5%
Working capital 640,0 596,2 7,3%
Cashflow - gross 65,6 93,8 -30,1%
Free cashflow (before acquisitions) -167,8 -69,7 140,9%
Earnings per share (in €) 1,44 2,66 -45,9%
Cashflow - gross per share (in €) 4,39 6,28 -30,1%
Free cashflow per share (in €) (before acquisitions) -11,23 -4,66 140,9%
Share price at end of the period 142,45 208,50 -31,7%
Market capitalization at end of the period 2.128 3.115 -31,7%
Investments in tangible and intangible assets (excluding goodwill) 36,4 31,3 16,5%

- 4 -
Interim Management Report
GENERAL ECONOMIC CONDITIONS
In the first half-year 2015, the global economy showed a weak development. According to the
Business Cycle Forecast of the Kiel Institute for
Word Economy (IfW), the global output grew by 0.6% in the first quarter 2015, after 0.9% in each
of the two preceding quarters. Growth in the advanced economies as well as emerging markets
slowed down, being strongly influenced by a
setback to the activity in the US and China, in particular. For the period from April to June, the
IfW expects the world economy to expand at a slightly higher rate again.
BRAND AND PRODUCT UPDATE
Underlining our strong position in Teamsport, PUMA achieved a great visibility at both the Copa
América in Chile and the FIFA Women’s World Cup in Canada. At the Copa América, PUMA partnered
host nation Chile crowned their stellar performance
throughout the tournament with their first continental trophy. The PUMA team secured their
triumph with a penalty shootout over archrival Argentina and its PUMA star Sergio Agüero, who
was amongst the tournament’s best goal scorers
with three goals. Agüero’s run of success follows an outstanding English Premier League 2014/15
season, finishing as the top scorer with 26 goals. In Germany, Bundesliga’s top scorer list was led by
PUMA player Alexander Meier of Eintracht Frankfurt with 19 goals.
At the FIFA Women’s World Cup, PUMA star Marta made the headlines by becoming the all-time
leading scorer of Women’s World Cup history,
while Germany’s Célia Šašić finished the tournament as the top goal scorer with six goals.
Together with the three participating PUMA teams Cameroon, Ivory Coast and Switzerland, more than
50 PUMA players contributed to a strong on-pitch
presence for PUMA.
Both the Copa América and the FIFA Women’s World Cup in Canada served as a great stage for
the introduction of PUMA’s innovative football boot evoSPEED SL. The newly revealed boot is PUMA’s
lightest match boot to date thanks to a super light
and almost translucent textile upper material. Whilst maintaining the necessary stability, the low
weight PUMA SPEEDFRAME adds to the overall lightweight theme of the evoSPEED SL. Designed
to give footballers a new game advantage
enhancing speed and agility, the evoSPEED SL is worn on pitch by some of the world’s best players
including Sergio Agüero, Marco Reus, Radamel Falcao, Marco Verratti, and Antoine Griezmann.
At the end of May, our top football club Arsenal FC became the most successful club in the history of
the English FA Cup with a record of 12 wins by outplaying Aston Villa to win 4:0 in the Final. Two
weeks later, we launched the much anticipated 2015/16 Arsenal home kit for the second year of
our partnership. The kit combines a modern
approach to materials with a traditional silhouette
and was launched through a live show at the Emirates Stadium by club legend and PUMA
ambassador Thierry Henry.
In our Running and Training category, we built on
the successful introduction of our revolutionary running technology IGNITE and continued to
develop the IGNITE platform with the launch of
IGNITE PWRCOOL. PWRCOOL is PUMA’s innovative cooling technology designed to keep the body at an
optimal temperature to preserve energy and is incorporated into a complete collection of thermo-
regulated apparel and Footwear designed with CoolCELL: highly functional materials that draw
sweat away from the skin while anatomically
placed air flow features offer superior temperature regulation. PUMA’s long history of working with
Jamaican athletes such as the Fastest Man in the World, Usain Bolt, and Olympic medalist Hansle
Parchment, provided the perfect conditions to test
PWRCOOL as part of the development process.
In early May, COBRA PUMA GOLF athlete Rickie Fowler powered his way to a stunning victory at
The Players Championship in Ponte Vedra Beach,
Florida, with the greatest finish in the 34-year history of the event. Fowler was decked out in
PUMA Golf apparel and equipped with his COBRA Golf clubs. With this signature style and world class
performance, Rickie Fowler continues to reinforce COBRA PUMA GOLF’s message of game enjoyment
coupled with excellence.
- 5 -
STRATEGY UPDATE
The first half of this year has shown that PUMA is
well under way in improving its product engine. Our stronger sales performance, especially in
Footwear underlines the increased attractiveness of
our products. With our successful product initiatives in the Spring/Summer season we have
underlined PUMA’s mission of becoming the Fastest Sports Brand in the World.
One of the important initiatives was the launch of
our new running technology IGNITE in Q1. IGNITE
has delivered very solid sell-in and sell-through performance in both Wholesale and own Retail. In
the second quarter, we have further nurtured this product platform with the introduction of IGNITE
PWR COOL.
In Teamsport, we are claiming back territory with
our two footwear platforms evoSPEED and evoPOWER, which we continue to support with
new designs, materials and innovations such as the newly launched evoSPEED SL, which only weighs
103 grams. Both platforms have been prominently
featured in our marketing campaign this year and delivered high sell-through across geographies.
PUMA and Kering Eyewear signed an eyewear
partnership agreement for optical frames and sunglasses to be launched in Spring/Summer 2016.
These will be divided into three main segments:
Performance, Active and Sportstyle. In line with PUMA’s focus on sports performance, the range will
also include eyewear items specifically designed for Running and Golf.
We have continued to strengthen the PUMA brand
with ongoing marketing investments and enhanced
marketing communication. Our campaign in the first half of this year has focused on showing our
athletes and products in action.
In the second quarter, we have started featuring
our newest brand ambassador Rihanna prominently through an in-store marketing campaign focusing
on the season’s female training styles. With this campaign we have affirmed our strong
commitment to women athlete consumers. Rihanna is an ideal brand ambassador admired by women
across the world, thanks to both her personality
and iconic style. While she is already generating positive PR buzz for PUMA, Rihanna will be at the
center of our ongoing marketing campaign over the
upcoming months. In a television commercial as well as online and other offline media she will
feature our IGNITE XT training shoe and other
commercial products. Rihanna is currently working closely with our design teams. While the first
Rihanna-inspired styles are already being launched in the second half of 2015, her own collection will
be in stores in 2016.
The new in-store concept for PUMA’s own retail
was first revealed in our full price store in Herzogenaurach earlier this year. Since then
further stores have been opened, including Hong Kong, Turkey and Mexico. In the new PUMA stores
we can better tell our product stories, reveal the
technologies behind them and strengthen PUMA’s positioning as a sports brand. All new and
refurbished stores are showing above average performance and an increased share of footwear
sales.

- 6 -
726652
843751
821 773
Q1 Q2 Q3 Q4
CONSOLIDATED SALES (€ million)
293
487
598
314
543
737
Accessories Apparel Footwear
CONSOLIDATED SALES Jan. - June (€ million)
299
486
593
365
617 612
Asia/Pacific Americas EMEA
SALES BY REGIONJan. - June (€ million)
Sales and Earnings Development
Global Brand Sales Worldwide PUMA brand sales - comprised of
consolidated and licensed sales - increased by 4.0% currency adjusted to € 797.9 million in the
second quarter of 2015. In the first six months of
2015, brand sales increased by 3.3% currency adjusted to € 1,647.5 million.
SECOND QUARTER 2015
Consolidated Sales
Currency adjusted sales exceed expectations In the second quarter of 2015, PUMA’s
consolidated sales improved by 7.6% currency adjusted to € 772.7 million and were above our
expectations. This positive development was
primarily driven by the growth in Footwear sales across all regions. In reported terms, consolidated
sales rose a strong 18.5%.
Growth in all regions
Second-quarter sales for the EMEA region (Europe, Middle East and Africa) rose by 3.9% currency
adjusted to € 270.5 million. The development was
particularly encouraging in Germany, France and Turkey, while Italy and Switzerland suffered a
decline on high comparables (last year’s World Cup replica sales not repeating this year).
Sales performance in the Americas was stronger in the second quarter with growth in both, North
and Latin America. Currency adjusted sales increased by 11.6% to € 328.4 million. In
particular, Argentina and Mexico showed above average sales developments.
Asia/Pacific (APAC) showed a satisfying second-quarter performance, with sales rising by 6.2%
currency adjusted to € 173.8 million. The increase was primarily attributable to good performances in
China and India, each reporting double-digit
growth.
Footwear leads product segment performance
Sales in Footwear increased for the fourth quarter in a row, rising by 16.2% currency adjusted to
€ 358.8 million. This development was mainly
driven by the Running, Training and Sportstyle categories and especially the PUMA IGNITE product
platform.
Apparel sales were broadly flat at € 263.3 million.
This is against high comparables in the second quarter 2014, when sales in replica jerseys driven
by the FIFA World Cup were particularly strong.
Accessories grew by 3.6% currency adjusted to € 150.7 million and developed in line with our
expectations.

- 7 -
Sales by regions and product segments
€ million 2015 2014 Eurocurrency
adjusted2015 2014 Euro
currency
adjusted
Breakdown by regions
EMEA 270,5 255,7 5,8% 3,9% 612,2 593,0 3,2% 1,8%
Americas 328,4 250,6 31,0% 11,6% 617,4 485,8 27,1% 8,7%
Asia/Pacific 173,8 145,9 19,1% 6,2% 364,5 299,2 21,9% 8,6%
Total 772,7 652,2 18,5% 7,6% 1.594,1 1.377,9 15,7% 5,9%
Breakdown by product segments
Footwear 358,8 277,6 29,3% 16,2% 736,9 598,4 23,1% 11,7%
Apparel 263,3 241,1 9,2% -0,3% 543,1 487,0 11,5% 2,7%
Accessories 150,7 133,6 12,8% 3,6% 314,1 292,5 7,4% -0,9%
Total 772,7 652,2 18,5% 7,6% 1.594,1 1.377,9 15,7% 5,9%
Q2 growth rates 1-6 growth rates

- 8 -
48,5%
46,7%46,3%
45,0%
46,9% 46,7%
Q1 Q2 Q3 Q4
GROSS PROFIT MARGIN(in %)
59
13
46
11
38
7
Q1 Q2 Q3 Q4
EBIT(€ million)
Gross Profit Margin
Gross profit margin stable Gross profit margin was stable at 46.7%,
despite significant negative currency effects. The footwear gross profit margin decreased slightly
from 42.7% to 42.3%, the apparel margin rose
from 48.2% to 50.7% and the margin for accessories fell from 52.4% to 50.0%.
Operating Expenses
Higher OPEX in line with expectations Operating expenditures (OPEX) - significantly
impacted by adverse currency effects - saw an
increase of 20.4% in reported terms, rising to € 357.4 million. During the quarter, we continued
to invest heavily in marketing activities to strengthen PUMA’s positioning as the Fastest
Sports Brand in the World. The main cause for the
increase was higher media spend and the partnerships with global sports and pop culture
icons Rihanna and Arsenal, which both commenced in the second half of 2014. The opening of new
retail stores at selected locations and investing into the IT-infrastructure also contributed to the
increase of OPEX in the second quarter. In
constant currencies, the increase in OPEX amounts to 10.6% versus last year.
EBIT
The rise in operating expenses led to a decrease of operating income (EBIT) from € 12.6 million to
€ 6.8 million.
Financial Result / Income from Associated Companies
In the second quarter, the financial result declined from € -1.3 million last year to € -5.7
million this year due to unfavorable impacts from currency conversion.
Net Earnings
Net earnings came in at € -3.3 million in the second quarter, resulting in earnings per share
of € -0.22.
FIRST HALF YEAR 2015
Consolidated Sales In the first half-year 2015, consolidated sales
increased by 5.9% currency adjusted to € 1,594.1 million and were above our expectations. In
reported terms, the improvement is significantly
higher with an increase of 15.7%.
All regions contribute to sales growth In the EMEA region, sales rose by 1.8% currency
adjusted to € 612.2 million. Germany, France, Spain and Turkey showed a positive development
in Europe, while the Middle East and Africa regions
continued their solid performance.
In the Americas, sales grew by 8.7% currency adjusted to € 617.4 million. Argentina and Mexico
stood out within the Latin American region, driving
double-digit growth, while North America was growing at a mid-single-digit pace with acceleration
in the second quarter.
Asia/Pacific also developed well, with an increase of 8.6% currency adjusted to € 364.5 million.
Performances in China and India were strong,
while sales in Japan were stagnant and Korea declined in a difficult economic environment.

- 9 -
2,38
0,28
1,93
-0,30
1,66
-0,22Q1 Q2 Q3 Q4
EARNINGS PER SHARE(€)
Footwear supported by IGNITE
In terms of product segments, Footwear was positively impacted by the successful launch of the
PUMA IGNITE product platform, leading to an overall increase of 11.7% currency adjusted to
€ 736.9 million. The Running, Training, and
Football categories were the main growth drivers. Apparel also grew with sales amounting to
€ 543.1 million (+2.7%), while Accessories decreased slightly to € 314.1 million (-0.9%).
PUMA’s retail sales grew
Supported by the increased number of stores
operating (44 more stores compared to one year ago; 4 less than at the end of 2014), retail sales
increased by 9.3% currency adjusted to € 322.2 million in the first half of 2015. This represented
20.2% of total sales compared to 19.6% last year.
Gross Profit Margin
Gross profit margin impacted by adverse currency
effects PUMA has already taken and will continue to take
countermeasures to offset the negative currency impact on the gross profit margin. The effect of
these measures helped us to limit the impact on
the gross profit margin to 90 basis points for the first half-year, as the second quarter gross profit
margin was stable. However, PUMA cannot currently fully neutralize the impact of volatile
currencies, as prices can only be adjusted very carefully in order not to impact consumer demand.
Furthermore, in some countries, the costs of
hedging outweigh its financial benefits, or in some instances, currency hedging is not possible at all.
In addition, we are considering to source products more in local markets in order to reduce the
exposure to foreign currencies in these markets.
PUMA’s gross profit margin for the first half-year went down by 90 basis points to 46.8%. The
footwear gross profit margin decreased from 43.4% to 42.6%, apparel margin was largely stable
at 50.7% and the margin for accessories decreased from 50.9% to 49.8%.
Operating Expenses
Continued higher OPEX due to heavy marketing
activities PUMA’s operating expenses (OPEX) increased by
19.1% to € 708.5 million, as negative currency effects continued to have an impact and the
company continued its marketing activities.
Opening up new stores and investing into IT-infrastructure also contributed to the rise in OPEX.
At the same time, PUMAs management continued to put a strong emphasis on strict control of other
operating costs. In constant currencies, the increase in OPEX amounts to 9.7% versus last
year.
EBIT
Operating income was down by 37.7% to € 44.3 million in the first half 2015, impacted by the
negative currency effects already described.
Financial Result / Income from Associated
Companies The financial result was almost stable at € -4.8
million compared to € -4.5 million in the first half year of 2014.
Net Earnings Half-year consolidated net earnings came in at
€ 21.5 million, representing earnings per share of € 1.44 compared to € 2.66 in the prior year.

- 10 -
Net Assets and Financial Position
Working Capital Increase in inventory and trade receivables broadly
aligned with sales growth
To ensure product availability and support sales growth as well as a higher demand from new
stores, inventories increased by 20.6% to € 704.5 million. This represents a currency adjusted
increase of 13.4%. Trade receivables went up by
13.1% to € 523.8 million, broadly in line with reported sales growth. Trade payables were at
€ 557.9 million, rising 27.6% compared to last year´s figure. In total, working capital rose 7.3%
to € 640.0 million.
Cashflow / Capex As a consequence of the higher working capital
requirement, the free cash flow before
acquisitions was at € -167.8 million compared with € -69.7 million for the same period last year.
Cash and cash equivalents
PUMA´s cash and cash equivalents went up
from € 300.0 million to € 337.9 million, while borrowings increased due to the higher working
capital requirements as part of PUMA’s short term financing activities.
TRETORN
PUMA sold trademark rights of Tretorn
Continuing our focus on our core categories under
the PUMA and COBRA brands, we have divested of our industrial property rights of the Tretorn
subgroup, which include trademark rights, patents and designs. In addition, the related operating
business was sold and the respective entities were
excluded from the scope of consolidation accordingly. Due to the very small size of the
Tretorn business with respect to sales, profit and net assets, these transactions had no material
impact on the results and financial position of the PUMA group.

- 11 -
Outlook 2015
Global Economy
According to the Kiel Institute for World Economy (IfW), the underlying drivers for economic growth
in the advanced economies remain intact: easy
financial conditions, more neutral fiscal policy in the euro area, lower fuel prices, and improving labor
market conditions. In contrast, the IfW does not expect a significant acceleration of economic
activity in the emerging markets. In total, the
Institute forecasts an expansion of the world’s gross domestic product of 3.4% in 2015 and 3.8%
in 2016 respectively. However, these projections are subject to severe downside risks. The global
output growth remains vulnerable due to ongoing geopolitical crises as well as the threat of financial
market turbulences, stemming from the Greek debt
crisis and interest rate hikes in the US.
Investments
Investments totaling around € 75 million are
planned for 2015. The majority of these funds have been allocated to infrastructure investments which
are necessary to help drive the sustainable growth, as well as the expansion of our core markets and
selective investments in retail stores.
Outlook 2015
The positive sales development registered in the first half-year 2015 came in above our
expectations. Nonetheless, we still continue to
expect an increase in the medium single-digit range for full-year currency-adjusted net sales. For
the second half of 2015, we anticipate higher sales growth in Q4 than in Q3.
However, as already expressed in the release of the first quarter results, the adverse developments
of foreign exchange rates since the beginning of the year, particularly the strengthening of the US
Dollar versus nearly all other currencies, had a significant negative impact on PUMA’s reported
gross profit margin. PUMA has already taken and
will continue to take countermeasures, but the impact will not fully offset the negative currency
impact on the gross profit margin. Therefore, we still expect a drop in the gross profit margin for the
full year in a range of 100 to 150 basis points
versus last year (2014: 46.6%).
In 2015, PUMA will continue to invest strongly in marketing to further enhance and reinforce its new
brand positioning. The investments in the upgrade
of PUMA’s current IT-infrastructure and the extension of our own retail store network will also
continue. This will result in an increase in OPEX that will be further impacted by negative currency
effects. At the same time, PUMA’s management will
continue to put a strong emphasis on strict control of other operating costs.
Based on the business development in the first
half-year 2015, we reiterate our expectation that adverse currency effects will continue to impact our
gross profit margin, OPEX and EBIT. At the current
exchange rate levels and thanks to the counter-measures, that we have already implemented, we
reiterate our expectation for a full-year EBIT in a range between € 80 million and € 100 million, with
net earnings impacted accordingly.

- 12 -
Balance Sheet Jun. 30,'15 Jun. 30,'14 Devi- Dec. 31,'14
€ million € million ation € million
ASSETS
Cash and cash equivalents 337,9 300,0 12,6% 401,5
Inventories 704,5 584,3 20,6% 571,5
Trade receivables 523,8 463,0 13,1% 449,2
Other current assets (Working Capital related) 195,8 182,7 7,2% 202,4
Other current assets 62,6 2,3 2633,7% 58,0
Current assets 1.824,5 1.532,3 19,1% 1.682,5
Deferred taxes 201,5 170,7 18,1% 178,8
Other non-current assets 716,4 643,2 11,4% 688,7
Non-current assets 917,9 813,9 12,8% 867,5
Total Assets 2.742,3 2.346,2 16,9% 2.549,9
LIABILITIES AND SHAREHOLDERS' EQUITY
Current financial liabilities 21,7 33,4 -35,0% 19,8
Trade payables 557,9 437,2 27,6% 515,2
Other current liabilities (Working Capital related) 226,1 196,6 15,0% 252,1
Other current liabilities 170,5 55,4 207,8% 35,5
Current liabilities 976,2 722,7 35,1% 822,6
Deferred taxes 56,2 44,5 26,3% 54,6
Pension provisions 26,4 28,2 -6,5% 26,0
Other non-current liabilities 32,9 37,3 -11,7% 28,4
Non-current liabilities 115,5 110,0 5,0% 109,0
Shareholders' Equity 1.650,6 1.513,5 9,1% 1.618,3
Total Liabilities and Shareholders' Equity 2.742,3 2.346,2 16,9% 2.549,9

- 13 -
Income Statement Q2/2015 Q2/2014 Devi- 1-6/2015 1-6/2014 Devi-
€ million € million ation € million € million ation
Sales 772,7 652,2 18,5% 1.594,1 1.377,9 15,7%
Cost of sales -412,2 -347,5 18,6% -848,6 -721,1 17,7%
Gross profit 360,6 304,7 18,3% 745,5 656,9 13,5%
- in % of consolidated sales 46,7% 46,7% 46,8% 47,7%
Royalty and commission income 3,7 4,7 -22,4% 7,3 9,3 -21,3%
Other operating income and expenses -357,4 -296,8 20,4% -708,5 -595,0 19,1%
Operating result (EBIT) 6,8 12,6 -45,8% 44,3 71,2 -37,7%
- in % of consolidated sales 0,9% 1,9% 2,8% 5,2%
Financial result / Income from associated companies -5,7 -1,3 330,2% -4,8 -4,5 6,7%
Earnings before taxes (EBT) 1,1 11,2 -90,3% 39,5 66,7 -40,7%
- in % of consolidated sales 0,1% 1,7% 2,5% 4,8%
Taxes on income 2,4 -3,8 -163,8% -8,4 -19,7 -57,4%
- Tax rate -220,2% 33,6% 21,3% 29,6%
Net earnings attributable to non-controlling interests -6,8 -3,3 108,2% -9,6 -7,2 33,5%
Net earnings -3,3 4,2 -179,1% 21,5 39,8 -45,9%
Earnings per share (€) -0,22 0,28 -179,1% 1,44 2,66 -45,9%
Earnings per share (€) - diluted -0,22 0,28 -179,1% 1,44 2,66 -45,9%
Weighted average shares outstanding 14,940 14,940 0,0%
Weighted average shares outstanding - diluted 14,940 14,940 0,0%
Second Quarter Full Year

- 14 -
Statement of Comprehensive Income After tax Tax impact Before tax After tax Tax impact Before tax
2015 2015 2015 2014 2014 2014
€ million € million € million € million € million € million
Net earnings 31,1 31,1 47,0 47,0
Currency changes 50,3 50,3 -5,0 -5,0
Neutral effects hedge accounting -15,2 6,3 -21,5 -3,1 1,4 -4,5
Neutral effects available-for-sale financial assets -1,7 0,7 -2,4 0,0 0,0
Share in other comprehensive income of at equity accounted investments 0,1 0,1 0,0 0,0
Items expected to be reclassified to the income statement
in the future 33,4 7,0 26,4 -8,1 1,4 -9,5
Remeasurements of the net defined benefit liability 0,0 0,0 0,0 -0,1 -0,0
Items not expected to be reclassified to the income statement
in the future 0,0 0,0 0,0 -0,1 -0,1 -0,0
Other result 33,4 7,0 26,4 -8,2 1,3 -9,5
Comprehensive income 64,5 7,0 57,5 38,7 1,3 37,5
attributable to: Non-controlling interest 11,6 11,6 7,3 7,3
Equity holders of the parent 52,9 7,0 45,9 31,4 1,3 30,1

- 15 -
Cashflow Statement 1-06/2015 1-06/2014 Devi-
€ million € million ation
Earnings before taxes (EBT) 39,5 66,7 -40,7%
Financial result and non cash effected expenses and income 26,1 27,1 -3,8%
Cashflow - gross 65,6 93,8 -30,1%
Change in net working capital -184,6 -94,6 95,1%
Taxes and interest payments -21,4 -36,5 -41,3%
Cashflow from operating activities -140,4 -37,3 276,5%
Payments for acquisitions 0,0 -2,3 -100,0%
Payments for investments in fixed assets -36,4 -31,3 16,5%
Other investing activities 9,1 -1,1 -963,4%
Cashflow from investing activities -27,3 -34,7 -21,2%
Free Cashflow -167,8 -72,0 133,1%
Free Cashflow (before acquisitions) -167,8 -69,7 140,9%
Dividends paid to equity holders of the parent company -7,5 -7,5 0,0%
Dividends paid to non-controlling interests -24,7 -15,3 61,4%
Proceeds from short-term borrowings 115,2 0,0 0,0%
Other changes 10,4 6,7 55,7%
Cashflow from financing activities 93,4 -16,1 -678,9%
Effect on exchange rates on cash 10,8 -2,0 -649,6%
Change in cash and cash equivalents -63,6 -90,1 -29,4%
Cash and cash equivalents at beginning of financial year 401,5 390,1 2,9%
Cash and cash equivalents end of the period 337,9 300,0 12,6%
- 16 -
Changes in Equity Subscribed Retained Treasury Equity Non- Total
capital Capital Revenue Difference Cashflow At equity earnings stock before controlling Equity
reserve reserves from hedges accounted non- interests
currency investments controlling
€ million conversion interests
Dec. 31, 2013 38,6 193,3 66,0 -137,5 -3,2 0,3 1.355,4 -31,4 1.481,6 15,7 1.497,3
Net earnings 0,0 0,0 0,0 0,0 0,0 0,0 39,8 0,0 39,8 7,2 47,0
Net income directly recognized
in equity 0,0 0,0 -0,1 -5,2 -3,1 0,0 0,0 0,0 -8,3 0,1 -8,2
Comprehensive income 0,0 0,0 -0,1 -5,2 -3,1 0,0 39,8 0,0 31,4 7,3 38,7
-7,5 -7,5 -15,3 -22,8
Value of employees services 0,3 0,3 0,3
June 30, 2014 38,6 193,7 65,9 -142,6 -6,3 0,3 1.387,7 -31,4 1.505,9 7,7 1.513,5
Dec. 31, 2014 38,6 193,7 57,9 -110,6 34,6 0,5 1.412,0 -31,4 1.595,2 23,1 1.618,3
Net earnings 0,0 0,0 0,0 0,0 0,0 0,0 21,5 0,0 21,5 9,6 31,1
Net income directly recognized
in equity 0,0 0,0 -1,7 48,3 -15,2 0,1 0,0 0,0 31,4 2,0 33,4
Comprehensive income 0,0 0,0 -1,7 48,3 -15,2 0,1 21,5 0,0 52,9 11,6 64,5
-7,5 -7,5 -24,7 -32,2
Changes in the
scope of consolidation 0,2 -0,2 -0,1 -0,1
June 30, 2015 38,6 193,7 56,1 -62,2 19,1 0,6 1.426,1 -31,4 1.640,6 10,0 1.650,6
Group reserves
Dividends paid to equity holders
of the parent company / non-
controlling interests
Dividends paid to equity holders
of the parent company / non-
controlling interests
- 17 -
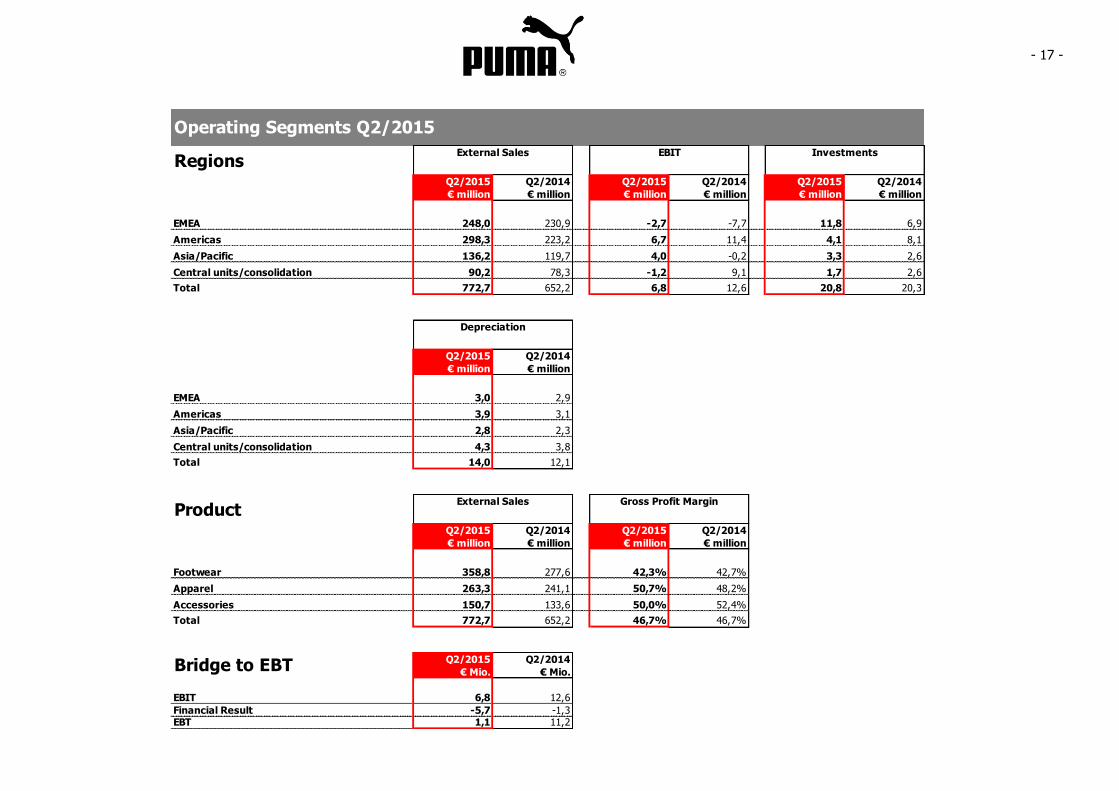
Operating Segments Q2/2015
RegionsExternal Sales EBIT Investments
Q2/2015 Q2/2014 Q2/2015 Q2/2014 Q2/2015 Q2/2014
€ million € million € million € million € million € million
EMEA 248,0 230,9 -2,7 -7,7 11,8 6,9
Americas 298,3 223,2 6,7 11,4 4,1 8,1
Asia/Pacific 136,2 119,7 4,0 -0,2 3,3 2,6
Central units/consolidation 90,2 78,3 -1,2 9,1 1,7 2,6
Total 772,7 652,2 6,8 12,6 20,8 20,3
Depreciation
Q2/2015 Q2/2014
€ million € million
EMEA 3,0 2,9
Americas 3,9 3,1
Asia/Pacific 2,8 2,3
Central units/consolidation 4,3 3,8
Total 14,0 12,1
ProductExternal Sales Gross Profit Margin
Q2/2015 Q2/2014 Q2/2015 Q2/2014
€ million € million € million € million
Footwear 358,8 277,6 42,3% 42,7%
Apparel 263,3 241,1 50,7% 48,2%
Accessories 150,7 133,6 50,0% 52,4%
Total 772,7 652,2 46,7% 46,7%
Q2/2015 Q2/2014
€ Mio. € Mio.
EBIT 6,8 12,6
Financial Result -5,7 -1,3EBT 1,1 11,2
Bridge to EBT

- 18 -
Operating Segments 1-6/2015
RegionsExternal Sales EBIT Investments
1-6/2015 1-6/2014 1-6/2015 1-6/2014 1-6/2015 1-6/2014
€ million € million € million € million € million € million
EMEA 559,4 531,2 10,0 14,9 16,3 11,6
Americas 537,5 417,7 1,1 15,6 11,1 14,4
Asia/Pacific 288,8 244,8 5,2 4,0 4,4 3,5
Central units/consolidation 208,3 184,2 28,0 36,7 4,6 3,2
Total 1.594,1 1.377,9 44,3 71,2 36,4 32,7
Depreciation Inventories Trade Receivables
1-6/2015 1-6/2014 1-6/2015 1-6/2014 1-6/2015 1-6/2014
€ million € million € million € million € million € million
EMEA 6,0 5,8 287,1 267,6 203,8 182,1
Americas 7,8 6,0 240,9 173,4 179,6 156,6
Asia/Pacific 5,3 4,4 103,5 70,6 57,9 49,0
Central units/consolidation 8,3 7,6 73,0 72,7 82,5 75,4
Total 27,3 23,9 704,5 584,3 523,8 463,0
ProductExternal Sales Gross Profit Margin
1-6/2015 1-6/2014 1-6/2015 1-6/2014
€ million € million € million € million
Footwear 736,9 598,4 42,6% 43,4%
Apparel 543,1 487,0 50,7% 50,9%
Accessories 314,1 292,5 49,8% 50,9%
Total 1.594,1 1.377,9 46,8% 47,7%
1-6/2015 1-6/2014
€ Mio. € Mio.
EBIT 44,3 71,2
Financial Result -4,8 -4,5EBT 39,5 66,7
Bridge to EBT

- 19 -
Notes to the Financial Report for the first six months of 2015
GENERAL REMARKS
Under the “PUMA” brand name, PUMA SE and its
subsidiaries (the “PUMA group”) are engaged in the development and sales of a broad range of sport
and sportlifestyle products including footwear,
apparel and accessories. The company’s registered head office is in Herzogenaurach, Federal Republic
of Germany; its responsible court of registration is at Fürth (Bavaria).
PUMA is an affiliated company of the Kering Group
and will be consolidated in the consolidated
financial statements of Kering.
ACCOUNTING STANDARDS
The unaudited financial report of PUMA SE and its subsidiaries (which together form the PUMA group)
was prepared according to IAS 34 “Interim Financial Reporting” and should be read in
connection with the annual financial statements as
of December 31, 2014. The consolidated financial statements details contained therein apply to the
financial reports for 2015, unless changes have been explicitly referred to.
The financial report corresponds to all committing
standards and interpretations applied and explained in the annual financial statements as of
December 31, 2014.
This financial report is partly based on assumptions
and estimates which have an impact on the amounts and on the breakdown of the reported
assets and liabilities as well as of the revenues and expenses. The actual values may, in some
exceptional cases, differ from these assumptions
and estimates at a later date. The corresponding changes if and when they occur will be considered
as soon as the findings are revised.
SEASONAL VARIANCE
The group’s sales fluctuate with the seasons. Consequently, the sales and resulting earnings vary
in the course of a year.
EMPLOYEES
2015 2014
Number of employees at the beginning of the period
11,267 10,982
Number of employees at the end of the period
10,877 10,725
Average number of employees
10,856 10,637
EARNINGS PER SHARE
Earnings per share are calculated according to IAS 33 by dividing the result for the period by the
weighted average number of outstanding shares. The repurchased shares reduced the number of
outstanding shares as well as diluted number of
shares. In principle, outstanding stock options from the Management Incentive Program can result to a
dilution of earnings per share.
2015 2014
Earnings per share € 1.44 € 2.66
Diluted earnings per share € 1.44 € 2.66

- 20 -
DIVIDEND
According to the Annual Shareholders’ Meeting on May 6, 2015, a dividend of € 0.50 per share was
approved for the fiscal year 2014. The dividend totaled € 7.5 million and was paid to the
shareholders beginning on May 7, 2015.
SHAREHOLDERS‘ EQUITY
Subscribed Capital As of balance sheet date the subscribed capital
amounted to € 38.6 million, divided into
15,082,464 no par value shares.
Treasury Stock The resolution adopted by the Annual General
Meeting on May 6, 2015 authorized the company to
purchase until May 5, 2020 its own shares to a value of up to ten percent of the share capital.
The company did not add shares to the treasury
stock during the first six months.
At the end of June, the company held a total of
142,551 shares. This represents 0.95% of the total subscribed capital.
Development Number of Shares
2015 2014
Number of shares at the beginning and at the end of the period
15,082,464 15,082,464
Thereof own shares/treasury stocks
-142,551 -142,551
Conversion of Management Incentives (issue of treasury stock)
0 0
Shares outstanding at the end of the period
14,939,913 14,939,913
Weighted average number of shares, outstanding
14,939,913 14,939,913
Diluted number of shares 14,939,913 14,939,913
RELATED PARTY TRANSACTIONS
PUMA SE has taken on short-term financial
liabilities of € 115.2 million (prior year: € 0.0 million) as a related party of the Kering-group as
part of its financing activities. These liabilities are presented as other current liabilities that are not
part of the working capital.
SEGMENT REPORTING
Segment reporting is based on geographical regions in accordance with the internal reporting
structure. Sales and gross profit are shown according to the geographical region where the
respective group company is located (head office).
Intra-group sales are eliminated. Allocation of the remaining segment information is also determined
on the basis of the respective group company’s head office. The sum totals equal the amounts on
the income statement or on the balance sheet, respectively.
EVENTS AFTER THE BALANCE SHEET DATE
There were no events after the balance sheet date
which may have a material effect on the financial
situation and earnings position as of June 30, 2015.

- 21 -
Responsibility Statement
“To the best of our knowledge, and in accordance with the applicable reporting principles for interim
financial reporting, the interim consolidated financial statements give a true and fair view of the
assets, liabilities, financial position and profit or
loss of the group, and the interim management report of the group includes a fair review of the
development and performance of the business and the position of the group, together with a
description of the principal opportunities and risks
associated with the expected development of the group for the remaining months of the financial
year.”
Herzogenaurach, July 24, 2015
The Managing Directors

- 22 -
Managing Directors Bjørn Gulden
(CEO, Chief Executive Officer)
Michael Laemmermann
(CFO, Chief Financial Officer)
Lars Radoor Sørensen (COO, Chief Operating Officer)
Administrative Board Jean-François Palus
(Chairman)
François-Henri Pinault
(Deputy Chairman)
Thore Ohlsson
Todd Hymel
Jean-Marc Duplaix
Belén Essioux-Trujillo
(from May 6, 2015)
Bernd Illig
Employees‘ Representative
Martin Koeppel
Employees‘ Representative
Guy Buzzard Employees‘ Representative

- 23 -
Financial Calendar FY 2015
February 16, 2015 Financial Results FY 2014
May 6, 2015 Annual Shareholders’ Meeting
May 6, 2015 Financial Results Q1/2015
July 24, 2015 Financial Results Q2/2015
November 6, 2015 Financial Results Q3/2015
The financial releases and other financial information are available on the Internet at „about.puma.com“.
Published by PUMA SE PUMA Way 1 D-91074 Herzogenaurach Tel.: +49 (0)9132 81-0 email: [email protected] Internet: http://www.puma.com
Notes relating to forward-looking statements:
This document contains forward-looking information about the Company’s financial status and strategic initiatives. Such information is subject to a certain level of risk and uncertainty that could cause the Company's actual results to differ significantly from the information discussed in this document. The forward-looking information is based on the current expectations and prognosis of the management team. Therefore, this document is further subject to the risk that such expectations or prognosis, or the premise of such underlying expectations or prognosis, become erroneous. Circumstances that could alter the Company's actual results and procure such results to differ significantly from those contained in forward-looking statements made by or on behalf of the Company include, but are not limited to those discussed be above.
PUMA PUMA is one of the world’s leading Sports Brands, designing, developing, selling and marketing Footwear, apparel and accessories. For over 65 years, PUMA has established a history of making fast product designs for the fastest athletes on the planet. PUMA offers performance and sport-inspired lifestyle products in categories such as Football, Running, Training and Fitness, Golf, and Motorsports. It engages in exciting collaborations with renowned design brands to bring innovative and fast designs to the sports world. The PUMA Group owns the brands PUMA, Cobra Golf, Dobotex and Brandon. The company distributes its products in more than 120 countries, employs more than 10,000 people worldwide, and is headquartered in Herzogenaurach/Germany. For more information, please visit http://www.puma.com